Abstract
Understanding the process underlying species coexistence is crucial in ecology. This challenge is relevant in tree communities inhabiting contrasting abiotic conditions, such as lowland floodplain and shallow hillslope karstic systems. We examined the influence of topographic variables and spatial factors on the structure of tree communities in the karstic system in Calakmul, Mexico. We measured 7050 trees (diameter at breast height ≥ 3 cm) in 152 circular plots and generated seven topographic variables from a digital elevation model. We employed redundancy analysis and variance partitioning to test the effects of environmental and spatial factors on tree communities. In addition, we used the null Raup–Crick model to uncover the relative importance of the deterministic and stochastic processes driving community assembly. Our study revealed significant floristic distinction between seasonally flooded and upland forests. The topographic wetness index (TWI) contribution to explaining the floristic differentiation in the studied tree assemblages was greater than that of the other topography-related variables. The explanatory power of the environmental and spatial factors varied slightly between datasets. The null model indicated a predominant influence of deterministic over stochastic processes. Our findings reaffirm the role of seasonal flooding as an abiotic filter. Additionally, the TWI can serve to identify flood-prone conditions within shallow depressions. The preservation of adjacent seasonally flooded and upland forests is relevant for the maintenance of tree diversity in the karst of the Yucatan Peninsula, since flooding drives the distribution of species.
1. Introduction
A central goal in ecology is to understand the processes that underlie species community assembly [1]. Stochastic (such as dispersal limitation) and deterministic (such as habitat filtering) processes are responsible for maintaining species coexistence and diversity in tropical forests [2]. The neutral theory [3] is a hypothesis positing that, at a regional scale, dispersal limitation is a key process shaping plant communities [4,5]; namely, the dispersion between adjacent sites generates spatial autocorrelation [3]. Although species distribution should not be related to the environment [4], it has been suggested that, if dispersal limitation is a determinant of species community assembly, similarity in floristic composition should decrease with an increase in geographic distance between pairs of plots [3,6].
In contrast, deterministic processes, such as habitat filtering [7,8], influence species sorting between habitats [9]. This perspective predicts that community similarity declines with increasing environmental heterogeneity. Therefore, the coexistence is possible because trees show habitat-specific adaptations and habitats contain species that differ in their niche requirements [2,10]. Coexistence is a consequence of differences in resource use among interacting species [11]. Niche partitioning among species or high environmental heterogeneity can enable species with similar niches to be restricted to somewhat different environments, allowing for their coexistence [12].
In the context of lowland floodable areas and upland forests, however, the extent to which these processes contribute to species community assembly remains inconclusively determined [13,14,15,16,17,18,19]. Waterlogging stress creates a pattern of disturbance between inundated and non-inundated areas [20]. In lowland areas, edaphic- and topographic-related variables drive seasonal flooding, generating anoxic stressful environments where species require special adaptations to survive the resulting conditions [21,22]. This habitat specialization leads to floristic differentiation between flooded and non-flooded forests [20,23,24,25,26] and contributes to maintaining a high regional diversity of plant species [27].
In Amazonian flooding forests, environmental factors such as substrate properties, topographic-related variables, hydroperiods, and their temporal dynamics have been suggested to drive the variation in floristic composition [28,29]. Edaphic characteristics [30] and elevation, convexity, and slope steepness also play a crucial role in defining the distribution of trees in non-flooded environments [31]. Related topographic variables like the topographic wetness index (TWI) [32] are key determinants of the distribution of plants in flooding environments [33]. Under local restrictive conditions [34] and disturbed conditions, environmental filters are expected to operate [35]. Therefore, seasonal flooding can act as an environmental filter [22,36]. In this case, seasonally flooded forests are naturally disturbed environments [19] that can be used as study models to discern the relative importance of the processes involved in the structuring of communities [9].
The southern portion of the Yucatan Peninsula (YP) is a karstic landscape, a mosaic formed by plains and hills whose origin is limestone or carbonate rock [37], useful as a model for investigating the relative importance of ecological processes maintaining species diversity. This is due to the presence of seasonally flooded depressions interspersed with low elevation hills [38,39]. The elevation gradients in the Yucatan Peninsula between stands of the seasonally flooded forest and the upland forest are typically 10–20 m [40,41], and usually within a distance of less than 500 m. Despite the short geographic distances involved, these forests can be clearly differentiated based on their topographical, geomorphological, and edaphic factors [42,43,44]. Seasonally flooded lowland flats can experience environmental stress that lasts for 1–6 months during the rainy season [45,46]. Furthermore, the distribution of seasonally flooded stands and upland forest fragments is interspersed, which could potentially limit seed dispersal across habitats where these two forest types occur (i.e., depressions and upland areas).
In the context of a seasonally flooded karstic system, this study aims to examine the underlying processes that structure two contiguous tree communities inhabiting contrasting abiotic conditions in floodplains and shallow karstic hillslopes. We hypothesize firstly that the environmental conditions contributing to seasonal flooding in karstic depressions reflect the operation of an environmental filter, which can lead to conspicuous differences in floristic composition between the two forest types. Secondly, we similarly expect that topographic-related variables to have a greater contribution than spatial factors in explaining the distribution of tree species, and finally, through the application of a null model, we aim to reveal the relative contribution of environmental filtering and dispersal limitation on the structure of the tree community.
2. Materials and Methods
2.1. Study Area and Forest Types
The study was carried out in the southern region of the Yucatan Peninsula (YP), Mexico, which lies between the coordinates of 18°31′–19°03′ N and 89°48′–90°10′ W. Specifically, the study area is located within the municipality of Calakmul in the state of Campeche. The landscape is predominantly karstic and spans approximately 2340 km2 (39 × 60 km), which includes parts of the Balam-kin and Balam-kú natural protected areas (Figure 1). The climate in the study area is warm sub-humid with a monsoonal rainfall pattern [46,47]. The environmental variation for the last 65 years, recorded at the meteorological stations near the sampling sites, indicates that the average annual temperature ranges between 26.3 and 26.7 °C and the total annual precipitation ranges from 908.6 to 1396 mm (https://smn.conagua.gob.mx/es/climatologia, accessed on 7 September 2023).
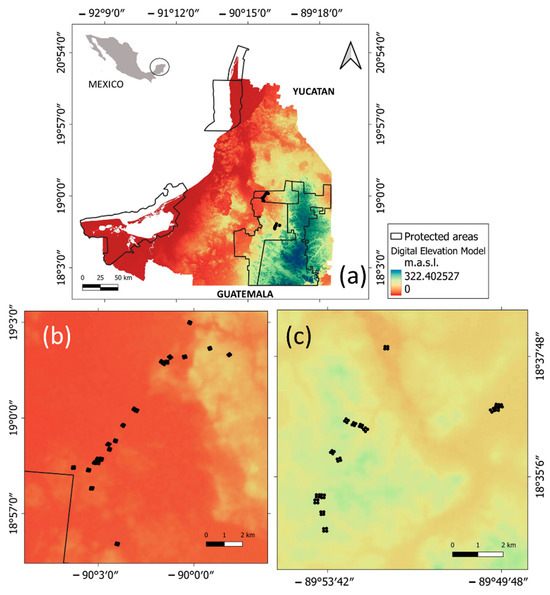
Figure 1.
Study area and location of sampling vegetation plots (black dots) in the municipality of Calakmul, state of Campeche, Mexico. (a) State of Campeche; (b) Balam-kin protected area; (c) Balam-kú protected area.
The upland forest in the study area is located in low hills with rocky, well-drained leptosols and is primarily dominated by Guaiacum sanctum L. (guayacan) [45,48]. The central part of the state of Campeche in Mexico is home to the largest remaining populations of G. sanctum [49,50]. In the YP, the presence of G. sanctum, along with Thouinia paucidentata Radlk. and Manilkara zapota (L.) P. Royen, is associated with old-growth forests in good conservation conditions [51]. The seasonally flooded forest in the YP develops in depressions called “bajos” [40,44,52]. These lowland flats are characterized by gleysols that remain flooded for long periods due to their high clay content [38,53]. However, detailed data on the physical and chemical soil variables from lowland sites are scarce, which results in difficult comparisons with nearby upland sites (Table S1) [38,53,54]. The seasonally flooded forest is a unique formation endemic to the YP [55,56]. The dominant tree species in the forest is Haematoxylum campechianum L., locally known as “palo de tinte”, which forms mono-dominant stands referred to as “tintales” [57].
2.2. Field Sampling and Data Collection
A comprehensive tree inventory was conducted in the study area using 152 circular plots, of which 60 were in flooded forest stands and 92 in upland forest. All trees with a diameter at breast height (DBH) of 10 cm or more were counted and measured within a 500 m2 plot (diameter of 25.23 m), while individuals with a DBH ranging between 3.0 and 9.9 cm were counted and measured within circular subplots of 100 m2 (diameter of 11.28 m) inside the larger plots. Tree height was measured with a Haglöf® digital clinometer type HCH, which provided a precision of 0.1 degree [58]. DBH was measured using a Haglöf® diametric tape.
2.3. Topographic Variables
We calculated seven topography-related variables for each of our study plots (Table S2), including aspect, elevation, roughness, slope, topographic position index (TPI), topographic roughness index (TRI), and topographic wetness index (TWI) from a digital elevation model (DEM) with a resolution of 15 m obtained from INEGI (accessed on 7 September 2023). The DEM is available for download free (https://www.inegi.org.mx/app/geo2/elevacionesmex, accessed on 22 August 2023), with no registration required. Aspect was determined as the direction of the steepest slope within each quadrat. Elevation (a.s.l.) was extracted from DEM. Roughness was calculated as the maximum difference in elevation between a focal cell and its eight adjacent cells [59]. The topographic position index (TPI) quantifies the difference between the elevation value of a given cell and the average elevation of neighboring cells within a defined radius [60]. This information is useful for identifying low-lying areas and depressions that are more likely to be wet [61]. A positive TPI value indicates a higher elevation (ridge) than the surrounding area, while a negative value indicates a lower elevation (valley), which is typically indicative of wetland areas [62].
The terrain ruggedness index (TRI) calculates the mean of the absolute differences in elevation between a focal cell and its eight surrounding cells, quantifying the total elevation change across a 3 × 3 cell area. Flat areas with little variation have a TRI of zero, while mountainous regions with step ridges have positive values [63]. The topographic wetness index (TWI) [32] is a commonly used proxy for soil moisture content, indicating the potential soil water storage condition of a pixel. The TWI combines the local upslope contributing area and slope to quantify the topographic control on hydrological processes [64]. The index is derived from three key components: total catchment area, flow width, and slope gradient [65]. The TWI predicts water accumulation by describing the shape of the land at any given point in the landscape as the ratio of the uphill area from which water would flow into that point to the local slope at that point [66]. As such, the TWI describes the spatial distribution saturation zones, making it a common surrogate for soil water content [67]. High TWI values are typical of converging, flat terrains and indicate a high potential for saturation, while low values are typical of steep and diverging areas and indicate a low potential for soil saturation. We calculated slope, roughness, and aspect using the corresponding tools in QGIS 3.26.3. To derive the TWI and other derivative variables such as the topographic position index (TPI) and terrain ruggedness index (TRI), we used the morphometry and hydrology modules. All the modules used are open source and are available for free in the System for Automated Geoscientific Analyses (SAGA GIS, v. 2.3.2 https://saga-gis.sourceforge.io/en/index.html, accessed on 22 August 2023).
2.4. Data Analysis
A non-metric multidimensional scaling (NMDS), based on the Bray–Curtis index as a dissimilarity distance using abundance data, was performed to distinguish differences between the stands of seasonally flooded forest and upland forest. This ordination method was realized using the vegan package [68]. Species that contributed the most to community dissimilarity among stands were identified using SIMPER (similarity percentage) analysis [69]. To examine whether the floristic composition significantly differed among the forests (upland vs. seasonally flooded), we employed one-way analysis of similarity (ANOSIM) with 999 permutations [69]; both analyses were performed in R using the vegan package [68] in R software (version 3.6.2, R Core Team, http://www.R-project.org, accessed on 3 September 2023).
To determine the contribution of environmental variables and spatial factors to species composition, we conducted a redundancy analysis (RDA) [70]. We utilized Hellinger-transformed abundance data (relative abundances) as the response matrix [71]. For the spatial explanatory matrix, we calculated the spatial distance among all plots using latitude–longitude data and transformed it to rectangular principal coordinates of neighborhood matrices (PCNM) using the pcnm function of the vegan [72,73] in R software (version 3.6.2, R Core Team, http://www.R-project.org, accessed on 3 September 2023). The explanatory matrix included spatial distance and seven environmental variables: aspect, elevation, roughness, slope, topographic position index (TPI), topographic roughness index (TRI), and topographic wetness index (TWI).
We conducted variance partition analysis [74] to determine the effects of dispersal limitation, represented by pure spatial component, and abiotic filtering, represented by the sum of purely abiotic component and spatially structured abiotic component. We employed a forward model selection with the ordiR2step function (200 permutations) and variance inflation factor (VIF < 10) with the vif function to select only significant spatial and environmental explanatory variables for the final model [75]. This procedure was carried out to choose a parsimonious RDA model with the highest adjusted R2. The varpart function was employed to determine the extent of the pure environmental (explained by abiotic factors only), pure spatial (explained by spatial factors), spatial component of environmental influence, and undetermined variables (residual). To test the statistical significance of each fraction, we used the anova.cca function available in the vegan package [68] in R software (version 3.6.2, R Core Team, http://www.R-project.org, accessed on 3 September 2023).
To disentangle the importance of deterministic processes from stochastic processes underlying assembly, we utilized a null model [76]. This model includes a modification of the Raup–Crick dissimilarity index [77], which is not influenced by differences in local species richness. The index uses a randomization procedure to compare the observed number of species occurring in both sites with the distribution of co-occurrences from 1000 random replicates. This approach makes it possible to infer the mechanisms that may determine community structure by comparing observed beta diversity against theoretical beta diversity in stochastically structured assemblages [76].
Values closer to +1 indicate that two communities are more dissimilar, sharing fewer species than expected by chance, which suggests the preponderance of biotic filter (competition) or spatial aggregation of the species due to dispersal limitation, i.e., very low dispersal among sites. Metric values close to -1 indicate that two communities are more similar than expected by chance, while values close to 0 indicate that dissimilarity between two communities does not differ from null expectation, suggesting that community assembly is highly stochastic, and dispersal is high among communities [76].
The value of this metric provides some indication of the possible underlying mechanisms of community assembly, particularly the degree to which deterministic processes create communities that deviate from those based on stochastic (null) expectations. We obtained the null estimates with 9999 randomizations using the raupcrick function available in the vegan package [68] in R software (version 3.6.2, R Core Team, http://www.R-project.org, accessed on 3 September 2023).
3. Results
3.1. Tree Community Composition
In total, we recorded 7050 individual trees and identified 139 tree species in the two forest types (Table 1). The NMDS ordination indicates that all flooded forest assemblages analyzed (DBH ≤ 10 cm, DBH ≥ 10 cm, and all individuals) tended to be more similar in their species composition (Figure 2). When we examined similarity in each assemblage separately, we found markedly that both forest types maintain different tree species assemblages (ANOSIM R = 0.464 and 0.534 for all individuals and DBH ≥ 10 cm, respectively). The SIMPER analysis of the all-individuals dataset showed that there was an 83.25% dissimilarity between the forest types (Table 2). The differentiation of the all-individuals dataset assemblage was determined by a group of five species: G. sanctum (7.08%), Lonchocarpus yucatanensis (6.91%), M. zapota (6.82%), Coccoloba cozumelensis (6.10%), and H. campechianum (5.87%), which together contributed 32.78% to the differentiation.

Table 1.
Description of seasonally flooded forest and upland forest in the Calakmul region, Campeche, Mexico. Density estimates are based on tree stems with DBH ≤ 10 cm and DBH ≥ 10 cm.
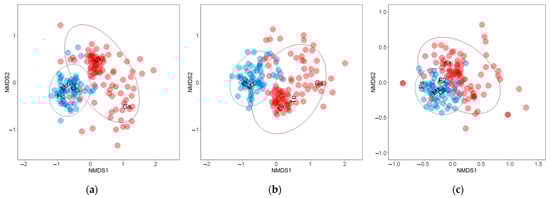
Figure 2.
Non-metric multidimensional scaling (NMDS) using the Bray–Curtis dissimilarity metric to distinguish floristic composition differences between seasonally flooded forest (blue circles) and upland forest (red circles) trees within the municipality of Calakmul in the state of Campeche, Mexico. Ellipses encompassed 95% confidence interval. (a) All-individuals dataset (7050 tree stems), (b) DBH ≥10cm (4847 tree stems) and (c) DBH ≤10cm (2203 tree stems). Scientific name abbreviations: Guaiacum sanctum (Gs); Lonchocarpus yucatanensis (Ly); Manilkara zapota (Mz); Coccoloba cozumelensis (Cc); Haematoxylum campechianum (Hc); Thouinia paucidentata (Tp); Psidium sartorianum (Ps); Fabaceae 1 (F1); Fabaceae 2 (F2).
Table 2.
Results of SIMPER (similarity percentage, dissimilarity), ANOSIM (analysis of similarities) and NMDS (non-metric multidimensional scaling) to compare floristic composition of trees recorded in a seasonally flooded forest and upland forest within the municipality of Calakmul in the state of Campeche, Mexico.
3.2. Important Local Environmental Variables and Spatial Components
The redundancy analysis (RDA) indicated that the TWI was significantly related to floristic differentiation in all the types of datasets studied. Additionally, variables such as aspect, TPI and roughness showed significant relationships with both the all-individuals dataset and the DBH ≥ 10 cm individuals dataset. In contrast, variables such as elevation, slope, and TRI were not found to significantly structure communities. Based on the selection approach, the spatial factor analysis revealed that PCNM3, PCNM4, PCNM5, and PCNM6 were significantly related in all three assemblies analyzed. PCNM2 was significant in both the all-individuals dataset and the DBH ≤ 10 cm individuals dataset. The first PCNM vector (PCNM1) did not significantly structure any communities (Table 3).
Table 3.
Results of the forward selection method in the redundancy analysis (RDA) for trees recorded in a seasonally flooded forest and upland forest within the municipality of Calakmul in the state of Campeche, Mexico. TPI: topographic position index; TRI: topographic roughness index; TWI: topographic wetness index; PCNM: principal coordinates of neighboring matrices. (-): variables that were not selected by the selection method.
3.3. Relative Role of Environmental and Spatial Factors
The variance partitioning analysis revealed that jointly the environmental variables, spatial components, and their shared effects accounted for 19.93% of the community variation in the all-individuals dataset, 19.70% in the DBH > 10 cm individuals dataset, and 12.63% in the DBH < 10 cm individuals dataset. The relative importance of environmental and spatial factors varied slightly among the datasets. The shared fractions accounted for the smallest amount of variation (2.63%–4.91%) and the residual or unexplained variance accounted for over 80.07% (Table 4).
Table 4.
Variation partitioning, pure environmental component, shared component and pure spatial component. The entire component is based on R2 adjusted values indicated as proportions of the overall variation. The residual refers to unexplained variance.
3.4. Processes Underlying Assembly
The beta Raup–Crick values obtained from the null model (Figure 3) for the all-individuals dataset ranged from 0.12 to 0.72 ( = 0.33), indicating that the communities tend to be more dissimilar than expected by chance (beta RC = 0.36 in DBH ≥ 10 cm individuals dataset and beta RC = 0.28 in DBH ≤ 10 cm individuals dataset).
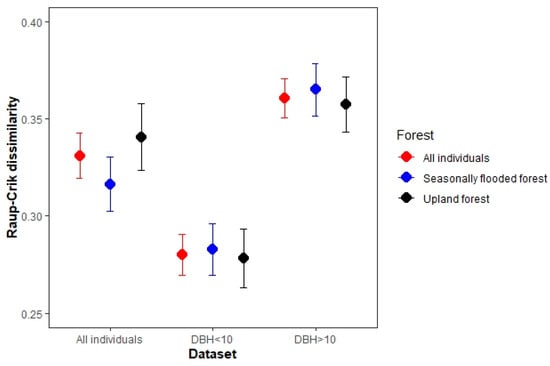
Figure 3.
Mean dissimilarity (±S.E.) according to Raup–Crick metric among sampling plots (beta Raup–Crick, BRC) in three different assemblies within the municipality of Calakmul in the state of Campeche, Mexico.
4. Discussion
This study aimed to assess the influence of topography-related factors and geographical distance on the organization of two tree communities located in the southeast of the YP region. The study area comprises a floodplain and hillslope karstic system that spans lowland depressions with seasonally flooded forests to well-drained shallow hills where upland forests develop. Our results showed that the floristic distinction between the two studied forest types suggests that, regardless of the type of assemblage data, the seasonally flooded forest community may be shaped by environmental filtering.
We found a grouping pattern in both the seasonally flooded forest and the upland forest plots, indicating a high similarity in their floristic composition within each forest type. This, in turn, resulted in a marked dissimilarity and high turnover of species between the two forest types. Gley-type soils, which are prevalent in the flooded depressions of the Calakmul region, have high clay content [38,53], favoring water retention and seasonal flooding due to local precipitation accumulation and surface runoff from rainwater, characteristic of the YP karstic landscape [39]. As such, the terrain depressions where the seasonally flooded forest develops can be considered stressful habitats due to their abiotic conditions, imposed by seasonal waterlogging [38,45,53,78]. In this sense, our results show that the floristic distinction between the seasonally flooded and upland forests in the Calakmul region is possibly due to seasonal flooding. Such a pattern of floristic differentiation is similar to that reported for the flooded and terra firme forests of Amazonia [15,79].
In order to investigate the influence of seasonal flooding on floristic differentiation between forest types, we utilized abiotic factors related to topographic features, which have been previously used as a proxy for hydrological processes. The topographic wetness index (TWI) is a reliable flood proxy [80] and has contributed significantly to revealing the processes influencing community assembly [81]. Our results showed that the TWI is a good predictor of the floristic distinction between the studied assemblages, and that seasonal flooding can generate a strong environmental filtering and lead to floristic differences in the forests studied, which is consistent with the findings of previous studies [82].
The variable selection procedure showed that elevation, slope (inclination), and the TRI did not influence tree distribution; this is possibly due to the low relief of the Calakmul region and particularly in the portions of the YP close to the Gulf of Mexico, where the relief is very shallow [39]. In our study, the highest elevation recorded was approximately around 136 m a.s.l., where the upland forest stands develop. The highest areas (~400 m a.s.l.) are located in the center of the YP [83]. These variables are more relevant in conditions of steeper altitudinal gradients, such as those found in other karstic environments [84].
In Amazonian flooded forests, floristic differentiation has been attributed to the influence of environmental filtering [15,16,17,18,28]. In our study system, we suggest that seasonal flooding significantly influences species sorting, particularly in lowland depressions, affecting the recruitment of tree species dispersing between upland and flooded areas. This is supported by the low floristic similarity observed between the tree assemblages in these two habitats (Figure 2). As we have noted previously, the forests studied can be distinguished by their edaphic and geomorphological characteristics (Tables S1 and S2); as well as for their structure and floristic composition. We found that the floristic distinction is indicated by the contribution of the typical species of each environment, mainly by G. sanctum (upland forest) and H. campechianum (seasonally flooded forest). M. zapota is a species of ecological importance that is notable in the forests of Calakmul [51] and occurs in both environments (seasonally flooded and upland forest). However, it may be experiencing phenotypic plasticity, since in the floodplains it is able to establish itself but with individuals that have reduced diameters (DBH ≤ 20 cm), in the opposite way to that in which it occurs in the hills, where individuals show larger diameters (DBH ≥ 35 cm).
The absence of predictive environmental variables can enhance the contribution of the spatial component. Therefore, it is possible that the contribution of the spatial component was slightly higher than the environmental component. However, the amount of variation explained by the spatial component cannot be considered as evidence of the predominance of stochastic processes, even though the forests studied are separated by distances of less than 500 m.
The unmeasured but potentially significant environmental variables may have contributed to decreasing the amount of unexplained variation. Future studies should take into consideration the physical and chemical variables of the soil to obtain a better explanation of the variance and more accurate understanding of the assembly mechanisms in such systems. However, the evidence obtained is insufficient to rule out the influence of spatial factors, such as dispersal limitation (i.e., spatial distance), which is a prominent factor in species turnover between seasonally flooded and upland forests. We did not include any seed functional traits, which are a proxy for dispersal ability [85]; future studies including seed traits should improve our understanding about the role of dispersal limitation in this karstic system, limited by short distances.
Moreover, the null model proposes that a significant number of plots exhibited greater dissimilarities than could be expected by chance. The observed pattern of fewer shared species than could be expected by chance implies that the turnover of species between the two forest types is barely influenced by dispersal limitation. However, we cannot discount its plausible effect on species differentiation. The mean null values obtained using the Raup–Crick beta diversity approach are consistent with the predictions derived from the operation of deterministic processes, indicating that habitat filtering plays a significant role in the studied karstic systems. Conducting experiments on tolerance (drought or flooding) across tree life stages with numerous local tree species would be necessary to clarify whether an environmental filter, e.g., the joint absence of competition and seed dispersal limitation, contributes to explaining the local species assemblage [8]. In addition, complementary observations could be carried out to evaluate the habitat preference and physiological response of seedlings in flooded and non-flooded habitats [22].
Our results highlight flooding as an abiotic condition that restricts the establishment and development of species that may disperse from upland forests to lowland flooded flats, leading to a striking difference in their floristic composition. Gaining an understanding of the local-scale processes involved in tree species differentiation between the seasonally flooded forest and upland forest provides greater insight into the conservation value of these arboreal formations in southern YP [55,86]. Both forests maintain a high diversity of epiphytes (bromeliads and orchids) and endangered endemic tree species such as C. cozumelensis, C. reflexiflora, G. sanctum, and L. xuul [44,49,50,51]. However, the functioning of seasonally flooded forest and upland forest is at risk due to the decline in rainfall in southern YP, with predictions suggesting further decreases in the near future [46,47,87]. The decrease in precipitation in southern YP may lead to the homogenization of the floristic composition. On the one hand, this may be due to the possible reduction in the distribution area of species associated with flooding conditions (e.g., H. campechianum). On the other hand, it may be due to the gradual increase in the relative abundance and distribution area of the species that occur in upland forests that are better adapted to drier conditions. Another possible trend of change involves an increase in the survivorship and establishment in flooded forests of species typical of early successional stages, such as Bursera simaruba, whose populations have recently been reported to increase [44], even though it is not a tree species typical of seasonally flooded forests [41,86].
5. Conclusions
Waterlogging may act as an environmental filter favoring a differentiation of tree species composition in lowland floodplain and shallow hillslope karstic systems. This is reflected in the differentiation of tree species composition and the pattern of the Raup–Crick null model, which shows a limited influence of stochastic processes. These differences between the seasonally flooded forest and upland forest stands are remarkable considering the short distances separating them. Dispersal limitation (spatial distance) was found to be a minor driver in the assemblage of tree communities, although it did show a significant contribution. The flooding condition of the depressions may be at risk due to reduced rainfall in the YP region. Severe droughts can influence changes in floristic composition, slow down the development of forest structure, and, consequently, reduce the ability to mitigate the effects of climate change. We suggest conducting long-term in situ studies with a wide range of species in seasonally flooded forest stands. Most studies have focused on understanding changes in the dominance in functional traits with a perspective of the action of a double environmental stress, drought, and flood. Additionally, experiments related to seedling growth under anoxic conditions, aerenchyma formation in roots, and seed germination under flooded conditions can be conducted to better understand the floristic differences between flooded and non-flooded forests in karstic systems. Finally, understanding community assembly can support the design of ecological restoration plans based on the selection of plants with traits related to environmental conditions, which can increase success and contribute to mitigating the effects of climate change.
Supplementary Materials
The following supporting information can be downloaded at: https://www.mdpi.com/article/10.3390/f15020250/s1; Table S1: Physical soil parameters (mean ± standard error) in seasonally flooded forest and upland forest. Values based on n = 9 samples for each forest type; Table S2: Description of topographic variables (mean ± standard error) of seasonally flooded forest and upland forest in the Calakmul region of the southern Yucatan Peninsula.
Author Contributions
Conceptualization, G.E.M.-A. and A.M.-R.; methodology, software, validation and formal analysis, G.E.M.-A., M.M.-T. and R.E.C.-S.; investigation and resources, G.E.M.-A. and A.M-.R.; data curation, G.E.M.-A. and R.E.C.-S.; writing—original draft preparation, G.E.M.-A., A.M.-R., M.G.-E. and M.M.-T.; writing—review and editing, G.E.M.-A., A.M.-R., M.G.-E. and M.M.-T.; visualization and supervision, G.E.M.-A., A.M.-R. and M.G.-E.; project administration and funding acquisition, G.E.M.-A. All authors have read and agreed to the published version of the manuscript.
Funding
This work was supported by the Comisión Nacional para el Conocimiento y Uso de la Biodiversidad (CONABIO) under Grant JF-128.
Data Availability Statement
Relevant data for this study can be obtained by contacting the authors in a reasonable manner.
Acknowledgments
We are grateful to the editors and reviewers for their valuable suggestions.
Conflicts of Interest
The authors declare no conflicts of interest.
References
- Kraft, N.J.B.; Valencia, R.; Ackerly, D.D. Functional traits and niche-based tree community assembly in an Amazonian forest. Science 2008, 322, 580–582. [Google Scholar] [CrossRef]
- Chase, J.M.; Myers, J.A. Disentangling the importance of ecological niches from stochastic processes across scales. Philos. Trans. R. Soc. B 2011, 366, 2351–2363. [Google Scholar] [CrossRef]
- Hubbell, S.P. The Unified Neutral Theory of Biodiversity and Biogeography; Princeton University Press: Princeton, NJ, USA, 2001; p. 322. [Google Scholar]
- Hubbell, S.P. Neutral theory in community ecology and the hypothesis of functional equivalence. Funct. Ecol. 2005, 19, 166–172. [Google Scholar] [CrossRef]
- Vellend, M. Conceptual synthesis in community ecology. Q. Rev. Biol. 2010, 85, 183–206. [Google Scholar] [CrossRef]
- Condit, R.; Pitman, N.; Leigh, E.G., Jr.; Chave, J.; Terborgh, J.; Foster, R.B.; Núñez, P.; Aguilar, S.; Valencia, R.; Villa, G.; et al. Beta-Diversity in Tropical Forest Trees. Science 2002, 295, 666–669. [Google Scholar] [CrossRef]
- Keddy, P.A. Assembly and response rules: Two goals for predictive community ecology. J. Veg. Sci. 1992, 3, 157–164. [Google Scholar] [CrossRef]
- Kraft, N.J.B.; Adler, P.B.; Godoy, O.; James, E.C.; Fuller, S.; Levine, J.M. Community assembly, coexistence and the environmental filtering metaphor. Funct. Ecol. 2015, 29, 592–599. [Google Scholar] [CrossRef]
- Cadotte, M.W.; Tucker, C.M. Should environmental filtering be abandoned? Trends Ecol. Evol. 2017, 32, 429–437. [Google Scholar] [CrossRef]
- Pitman, N.C.A.; Terborgh, J.W.; Silman, M.R.; Nuñez, V.P.; Neill, D.A.; Cerón, C.E.; Palacios, W.A.; Aulestia, M. Dominance and distribution of tree species in upper Amazonian terra firme forests. Ecology 2001, 82, 2101–2117. [Google Scholar] [CrossRef]
- Chase, J.M.; Leibold, M.A. Ecological Niches: Linking Classical and Contemporary Approaches; University of Chicago Press: Chicago, IL, USA, 2003; p. 221. [Google Scholar]
- Silvertown, J. Plant coexistence and the niche. Trends Ecol. Evol. 2004, 19, 605–611. [Google Scholar] [CrossRef]
- Jabot, F.; Etienne, R.S.; Chave, J. Reconciling neutral community models and environmental filtering: Theory and an empirical test. Oikos 2008, 117, 1308–1320. [Google Scholar] [CrossRef]
- González-Caro, S.; Umaña, M.N.; Álvarez, E.; Stevenson, P.R.; Swenson, N.G. Phylogenetic alpha and beta diversity in tropical tree assemblages along regional-scale environmental gradients in northwest South America. J. Plant Ecol. 2014, 7, 145–153. [Google Scholar] [CrossRef]
- Pitman, N.C.A.; Guevara Andino, J.E.; Aulestia, M.; Cerón, C.E.; Neill, D.A.; Palacios, W.; Rivas-Torres, G.; Silman, M.R.; Terborgh, J.W. Distribution and abundance of tree species in swamp forests of Amazonian Ecuador. Ecography 2014, 37, 902–915. [Google Scholar] [CrossRef]
- Baldeck, C.A.; Tupuyachi, R.; Sinca, F.; Jaramillo, N.; Asner, G.P. Environmental drivers of tree community turnover in western Amazonian forest. Ecography 2016, 39, 1089–1099. [Google Scholar] [CrossRef]
- Aldana, A.M.; Carlucci, M.B.; Fine, P.V.A.; Stevenson, P.R. Environmental filtering of eudicot lineages underlies phylogenetic clustering in tropical South American flooded forests. Oecologia 2017, 183, 327–335. [Google Scholar] [CrossRef]
- Stevenson, P.R.; Aldana, A.M.; Cárdenas, S.; Negret, P.J. Flooding and soil composition determine beta diversity of lowland forests in Northern South America. Biotropica 2018, 50, 568–577. [Google Scholar] [CrossRef]
- Ribeiro, K.F.; Martins, V.F.; Wiegand, T.; Santos, F.A. Habitat filtering drives the local distribution of congeneric species in a Brazilian white-sand flooded tropical forest. Ecol. Evol. 2021, 11, 1797–1813. [Google Scholar] [CrossRef]
- Arias, M.E.; Wittmann, F.; Parolin, P.; Murray-Hudson, M.; Cochrane, T.A. Interactions between flooding and upland disturbance drives species diversity in large river floodplains. Hydrobiologia 2018, 814, 5–17. [Google Scholar] [CrossRef]
- Parolin, P.; De Simone, O.; Haase, K.; Waldhoff, D.; Rottenberger, S.; Kuhn, U.; Kesselmeier, J.; Kleiss, B.; Schmidt, W.; Pledade, M.T.F.; et al. Central Amazonian floodplain forests: Tree adaptations in a pulsing system. Bot. Rev. 2004, 70, 357–380. [Google Scholar] [CrossRef]
- Baraloto, C.; Morneau, F.; Bonal, D.; Blanc, L.; Ferry, B. Seasonal water stress tolerance and habitat associations within four Neotropical tree genera. Ecology 2007, 88, 478–489. [Google Scholar] [CrossRef]
- González-Abella, J.S.; Aldana, A.M.; Correa, D.F.; Casas, L.F.; Stevenson, P.R. Forest Structure, Diversity and Dynamics in Terra Firme and Igapó Gallery Forests in the Colombian Orinoco Basin. Forests 2021, 12, 1568. [Google Scholar] [CrossRef]
- Bredin, Y.K.; Hawes, J.E.; Peres, C.A.; Haugaasen, T. Structure and Composition of Terra Firme and Seasonally Flooded Várzea Forests in the Western Brazilian Amazon. Forests 2020, 11, 1361. [Google Scholar] [CrossRef]
- Umaña, M.N.; Norden, N.; Cano, Á.; Stevenson, P.R. Determinants of plant community assembly in a mosaic of landscape units in central Amazonia: Ecological and phylogenetic perspectives. PLoS ONE 2012, 7, e45199. [Google Scholar] [CrossRef] [PubMed]
- Wittmann, F.; Junk, W.J.; Piedade, M.T.F. The várzea forests in Amazonia: Flooding and the highly dynamic geomorphology interact with natural forest succession. For. Ecol. Manag. 2004, 196, 199–212. [Google Scholar] [CrossRef]
- Mori, G.B.; Schietti, J.; Poorter, L.; Piedade, M.T.F. Trait divergence and habitat specialization in tropical floodplain forests trees. PLoS ONE 2019, 14, e0212232. [Google Scholar] [CrossRef] [PubMed]
- Fortunel, C.; Paine, C.E.T.; Fine, P.V.A.; Kraft, N.J.B.; Baraloto, C. Environmental factors predict community functional composition in Amazonian forests. J. Ecol. 2014, 102, 145–155. [Google Scholar] [CrossRef]
- Assis, R.L.; Wittmann, F.; Piedade, M.T.F.; Haugaasen, T. Effects of hydroperiod and substrate properties on tree alpha diversity and composition in Amazonian floodplain forests. Plant Ecol. 2015, 216, 41–54. [Google Scholar] [CrossRef]
- Mori, G.B.; Poorter, L.; Schietti, J.; Piedade, M.T.F. Edaphic characteristics drive functional traits distribution in Amazonian floodplain forests. Plant Ecol. 2021, 222, 349–360. [Google Scholar] [CrossRef]
- Zuleta, D.; Russo, S.E.; Barona, A.; Barreto-Silva, J.S.; Cardenas, D.; Castaño, N.; Davies, S.J.; Detto, M.; Sua, S.; Turner, B.L.; et al. Importance of topography for tree species habitat distributions in a terra firme forest in the Colombian Amazon. Plant Soil. 2020, 450, 133–149. [Google Scholar] [CrossRef]
- Beven, K.J.; Kirkby, M.J. A physically based, variable contributing area model of basin hydrology. Hydrol. Sci. Bull. 1979, 24, 43–69. [Google Scholar] [CrossRef]
- Kanagaraj, R.; Wiegand, T.; Comita, L.S.; Huth, A. Tropical tree species assemblages in topographical habitats change in time and with life stage. J. Ecol. 2011, 99, 1441–1452. [Google Scholar] [CrossRef]
- Cornwell, W.K.; Ackerly, D.D. Community assembly and shifts in plant trait distributions across an environmental gradient in coastal California. Ecol. Monogr. 2009, 79, 109–126. [Google Scholar] [CrossRef]
- Chase, J.M. Drought mediates the importance of stochastic community assembly. Proc. Natl. Acad. Sci. USA 2007, 104, 17430–17434. [Google Scholar] [CrossRef] [PubMed]
- de Oliveira, M.T.; Damasceno-Junior, G.A.; Pott, A.; Paranhos Filho, A.C.; Suarez, Y.R.; Parolin, P. Regeneration of riparian forests of the Brazilian Pantanal under flood and fire influence. For. Ecol. Manag. 2014, 331, 256–263. [Google Scholar] [CrossRef]
- Estrada-Medina, H.; Jimenez-Osornio, J.J.; Álvarez-Rivera, R.; Barrientos-Medina, R.C. El karst de Yucatán: Su origen, morfología y biología. Acta Univ. 2019, 29, e2292. [Google Scholar] [CrossRef]
- Duch-Gary, J. Los Bajos Inundables (ak’alches) de la Península de Yucatán: Las Expectativas de una Evaluación Ambiental Referida a su aprovechamiento; Universidad Autónoma Chapingo, División de Ciencias Forestales, Centro Regional de la Península de Yucatán: Texcoco, Mexico, 1989; p. 50. [Google Scholar]
- Beach, T.; Luzzadder-Beach, S.; Cook, D. Climatic changes and collapses in Maya history. Past Glob. Changes Mag. 2016, 24, 66–67. [Google Scholar] [CrossRef][Green Version]
- Lundell, C. Preliminary sketch of the phytogeography of the Yucatan Peninsula. Carn. Inst. Wash. Publ. 1934, 436, 257–321. [Google Scholar]
- Miranda, F. Estudios acerca de la vegetación. In Los Recursos Naturales del Sureste y su Aprovechamiento; Tomo, II, Beltrán, E., Eds.; Instituto Mexicano de Recursos Naturales no Renovables: Ciudad de México, Mexico, 1958; pp. 215–271. [Google Scholar]
- Beach, T.; Luzzadder-Beach, S.; Dunning, N.; Cook, D. Human and natural impacts on fluvial and karst depressions of the Maya Lowlands. Geomorphology 2008, 101, 308–331. [Google Scholar] [CrossRef]
- Dunning, N.P.; Griffin, R.E.; Sever, T.L.; Saturno, W.A.; Jones, J.G. The nature and origins of linear features in the Bajo de Azúcar, Guatemala: Implications for ancient Maya adaptation to a changing environment. Geoarchaeol. Int. J. 2016, 32, 107–129. [Google Scholar] [CrossRef]
- Martínez, E.; Galindo-Leal, C. La vegetación de Calakmul, Campeche, México. Boletín Soc. Botánica México 2002, 71, 7–32. [Google Scholar] [CrossRef]
- Palacio-Aponte, G.A.; Noriega-Trejo, R.; Zamora-Crescendo, P. Caracterización físico-geográfica del paisaje conocido como "bajos inundables". El caso del área natural protegida Balamkín, Campeche. Investig. Geográficas 2002, 49, 57–73. [Google Scholar] [CrossRef]
- Orellana, R.; Espadas, C.; Conde, C.; Gay, C. Atlas Escenarios de cambio climático en la Península de Yucatán; CICY-UNAM-CONACY-SEDUMA-Gobierno del Estado de Yucatán-SIDETEY-ONU-PNUD: Mérida, Mexico, 2009; p. 111. [Google Scholar]
- Márdero, S.; Schmook, B.; Christman, Z.E.; Nickl, E.; Schneider, L.; Rogan, J.; Lawrence, D. Precipitation Variability and Adaptation Strategies in the Southern Yucatán Peninsula, Mexico: Integrating Local Knowledge with Quantitative Analysis. In International Perspectives on Climate Change: Latin America and Beyond; Leal Filho, W., Alves, F., Caeiro, S., Azeiteiro, U.M., Eds.; Springer International Publishing: Cham, Switzerland, 2014; pp. 189–201. [Google Scholar]
- Wendelken, P.N.; Martín, R.F. Avian consumption of Guaiacum sanctum fruit in the arid interior of Guatemala. Biotropica 1987, 19, 116–121. [Google Scholar] [CrossRef]
- López-Toledo, L.; González-Salazar, C.; Burslem, D.F.R.P.; Martínez-Ramos, M. Conservation assessment of Guaiacum sanctum and Guaiacum coulteri: Historic distribution and future trends in Mexico. Biotropica 2011, 43, 246–255. [Google Scholar] [CrossRef]
- López-Toledo, L.; Ibarra-Manríquez, G.; Burslem, D.F.R.P.; Martínez-Salas, E.; Pineda-García, F.; Martínez-Ramos, M. Protecting a single endangered species and meeting multiple conservation goals: An approach with Guaiacum sanctum in Yucatan Peninsula, Mexico. Divers. Distrib. 2012, 18, 575–587. [Google Scholar] [CrossRef]
- Weterings, M.J.A.; Weterings-Schonck, S.M.; Vester, H.F.M.; Calmé, S. Senescence of Manilkara zapota trees and implications for large frugivorous birds in the Southern Yucatan Peninsula, Mexico. For. Ecol. Manag. 2008, 256, 1604–1611. [Google Scholar] [CrossRef]
- Miranda, F.; Hernández-Xolocotzi, E. Los tipos de la vegetación de México y su clasificación. Boletín Soc. Botánica México 1963, 28, 29–179. [Google Scholar] [CrossRef]
- Beach, T.; Luzzadder-Beach, S.; Cook, D.; Krause, S.; Doyle, C.; Eshleman, S.; Wells, G.; Dunning, N.; Brennan, M.L.; Brokaw, N.; et al. Stability and instability on Maya Lowlands tropical hillslope soils. Geomorphology 2018, 305, 185–208. [Google Scholar] [CrossRef]
- Mariaca-Méndez, R.; Hernández-Xolocotzi, E.; Castillo-Morales, A. Análisis estadístico de rendimientos, durante seis años de cultivo continuo experimental, de una milpa bajo roza-tumba-quema en Yucatán, México (1980–1986) II. Factores que influyen en los rendimientos de maíz. Agrociencia Ser. Fitociencia 1991, 2, 109–119. [Google Scholar]
- Olmsted, I.; Durán, R.; González-Iturbide, J.A. Diagnóstico del conocimiento y manejo de las selvas de la península de Yucatán. In Conocimiento y Manejo de las Selvas de la Península de Yucatán; González, H.D., Echazarreta, G.C., Parra, T.V., Eds.; Universidad Autónoma de Yucatán: Mérida, Mexico, 1994; pp. 139–178. [Google Scholar]
- Tun-Dzul, F.J.; Vester, H.; Durán, R.; Schmook, B. Estructura arbórea y variabilidad temporal del NDVI en los “bajos inundables” de la Península de Yucatán, México. Polibotánica 2008, 25, 69–90. [Google Scholar]
- Pennington, T.D.; Sarukhán, J. Árboles tropicales de México. Manual Para la Identificación de las Principales Especies, 3rd ed.; Universidad Nacional Autónoma de México y Fondo de Cultura Económica: Mexico City, Mexico, 2005; p. 523. [Google Scholar]
- Westoby, M.; Falster, D.S.; Moles, A.T.; Vesk, P.A.; Wright, I.J. Plant ecological strategies: Some leading dimensions of variation between species. Annu. Rev. Ecol. Syst. 2002, 33, 125–159. [Google Scholar] [CrossRef]
- Beasom, S.L.; Wiggers, E.P.; Giardino, J.R. A technique for assessing land surface ruggedness. J. Wildl. Manag. 1983, 47, 1163–1166. [Google Scholar] [CrossRef]
- Gallant, J.C.; Wilson, J.P. Primary topographic attributes. In Terrain Analysis: Principles and Applications; Wilson, J.P., Gallant, J.C., Eds.; Wiley: New York, NY, USA, 2000; pp. 51–85. [Google Scholar]
- Chimner, R.A.; Bourgeau-Chavez, L.; Grelik, S.; Hribljan, J.A.; Planas-Clarke, A.M.; Polk, M.H.; Lilleskov, E.A.; Fuentealba, B. Mapping mountain peatlands and wet meadows using multi-date, multi-sensor remote sensing in the Cordillera Blanca, Peru. Wetlands 2019, 39, 1057–1067. [Google Scholar] [CrossRef]
- Montgomery, J.; Brisco, B.; Chasmer, L.; Devito, K.; Cobbaert, D.; Hopkinson, C. SAR and LiDAR temporal data fusion approaches to boreal wetland ecosystem monitoring. Remote Sens. 2019, 11, 161. [Google Scholar] [CrossRef]
- Riley, S.J.; DeGloria, S.D.; Elliot, R. A terrain ruggedness index that quantifies topographic heterogeneity. Intermt. J. Sci. 1999, 5, 23–27. [Google Scholar]
- Sörensen, R.; Zinko, U.; Seibert, J. On the calculation of the topographic wetness index: Evaluation of different methods based on field observations. Hydrol. Earth Syst. Sci. 2006, 10, 101–112. [Google Scholar] [CrossRef]
- Gruber, S.; Peckham, S. Land-surface parameters and objects in hydrology. In Developments in Soil Science; Elsevier: Amsterdam, The Netherlands, 2009; pp. 171–194. [Google Scholar] [CrossRef]
- Cohen, J.M.; Kacey, C.E.; Lindblade, K.A.; Vulule, J.M.; John, C.C.; Wilson, M.L. Local topographic wetness indices predict household malaria risk better than land-use and land-cover in the western Kenya highlands. Malar. J. 2010, 9, 328. [Google Scholar] [CrossRef]
- Moore, I.D.; Grayson, R.B.; Ladson, A.R. Digital terrain modelling: A review of hydrological, geomorphological, and biological applications. Hydrol. Process. 1991, 5, 3–30. [Google Scholar] [CrossRef]
- Oksanen, J.; Blanchet, F.G.; Friendly, M.; Kindt, R.; Legendre, P.; McGlinn Minchin, D.P.R.; O’Hara, R.B.; Simpson, G.L.; Solymos, P. Vegan: Community Ecology Package. 2019. R Package Version 2.5-6. Available online: https://CRAN.R-project.org/package=vegan (accessed on 20 March 2023).
- Clarke, K.R. Non-parametric multivariate analyses of changes in community structure. Aust. J. Ecol. 1993, 18, 117–143. [Google Scholar] [CrossRef]
- Legendre, P.; Anderson, M.J. Distance-based redundancy analysis: Testing multispecies responses in multifactorial ecological experiments. Ecol. Monogr. 1999, 69, 1–24. [Google Scholar] [CrossRef]
- Legendre, P.; Gallagher, E.D. Ecologically meaningful transformations for ordination of species data. Oecologia 2001, 129, 271–280. [Google Scholar] [CrossRef]
- Borcard, D.; Legendre, P. All-scale spatial analysis of ecological data by means of principal coordinates of neighbour matrices. Ecol. Model. 2002, 153, 51–68. [Google Scholar] [CrossRef]
- Borcard, D.; Legendre, P.; Avois-Jacquet, C.; Tuomisto, H. Dissecting the spatial structure of ecological data at multiple scales. Ecology 2004, 85, 1826–1832. [Google Scholar] [CrossRef]
- Borcard, D.; Legendre, P.; Drapeau, P. Partialling out the spatial component of ecological variation. Ecology 1992, 73, 1045–1055. [Google Scholar] [CrossRef]
- Blanchet, F.G.; Legendre, P.; Borcard, D. Forward selection of explanatory variables. Ecology 2008, 89, 2623–2632. [Google Scholar] [CrossRef]
- Chase, J.M.; Kraft, N.J.B.; Smith, K.G.; Vellend, M.; Inouye, B.D. Using null models to disentangle variation in community dissimilarity from variation in α-diversity. Ecosphere 2011, 2, 1–11. [Google Scholar] [CrossRef]
- Raup, D.M.; Crick, R.E. Measurement of faunal similarity in paleontology. J. Paleontol. 1979, 53, 1213–1227. [Google Scholar]
- Fragoso-Servón, P.; Bautista, F.; Frausto, O.; Pereira, A. Caracterización de las depresiones kársticas (forma, tamaño y densidad) a escala 1:50,000 y sus tipos de inundación en el Estado de Quintana Roo, México. Rev. Mex. Cienc. Geológicas 2014, 31, 127–137. [Google Scholar]
- Wittmann, F.; Schöngart, J.; Montero, J.C.; Motzer, T.; Junk, W.J.; Piedade, M.T.F.; Queiroz, H.L.; Worbes, M. Tree species composition and diversity gradients in white-water forests across the Amazon Basin. J. Biogeogr. 2006, 33, 1334–1347. [Google Scholar] [CrossRef]
- Besnard, A.G.; La Jeunesse, I.; Pays, O.; Secondi, J. Topographic wetness index predicts the occurrence of bird species in floodplains. Divers. Distrib. 2013, 19, 955–963. [Google Scholar] [CrossRef]
- Blanchard, G.; Munoz, F.; Ibanez, T.; Hequet, V.; Vandrot, H.; Girardi, J.; Birnbaum, P. Regional rainfall and local topography jointly drive tree community assembly in lowland tropical forests of New Caledonia. J. Veg. Sci. 2019, 30, 845–856. [Google Scholar] [CrossRef]
- Polanía, B.S.; Aldana, A.M.; Bottin, M.; Cruz, D.M.; Castro-Lima, F.; Stevenson, P.R.; Sanchez, A. Effect of Seasonal Rains and Floods on Seedling Recruitment and Compositional Similarity in Two Lowland Tropical Forests. Forests 2020, 11, 1297. [Google Scholar] [CrossRef]
- Bautista, F.; Palacio-Aponte, G.; Quintana, P.; Zinck, J.A. Spatial distribution and development of soils in tropical karst areas from the Peninsula of Yucatan, Mexico. Geomorphology 2011, 135, 308–321. [Google Scholar] [CrossRef]
- Guo, Y.; Xiang, W.; Wang, B.; Li, D.; Mallik, A.U.; Chen, H.Y.H.; Huang, F.; Ding, T.; Wen, S.; Lu, S.; et al. Partitioning beta diversity in a tropical karst seasonal rainforest in Southern China. Sci. Rep. 2018, 8, 17408. [Google Scholar] [CrossRef] [PubMed]
- Muller-Landau, H.C.; Wright, S.J.; Calderón, O.; Condit, R.; Hubbell, S.P. Interspecific variation in primary seed dispersal in a tropical forest. J. Ecol. 2008, 96, 653–667. [Google Scholar] [CrossRef]
- Olmsted, I.; Durán, R. Aspectos ecológicos de la selva baja inundable de la reserva de Sian Ka’an, Quintana Roo, México. Biotica 1986, 11, 151–179. [Google Scholar]
- Estrada-Medina, H.; Cobos-Gasca, V.; Acosta-Rodríguez, J.L.; Peña-Fierro, S.; Castilla-Martínez, M.; Castillo-Carrillo, C.; Franco-Brito, S.; López-Castillo, D.; López-Díaz, M.; Luna-Flores, W.; et al. La sequía de la península de Yucatán. Tecnol. Cienc. Agua 2016, 7, 151–165. [Google Scholar]


Disclaimer/Publisher’s Note: The statements, opinions and data contained in all publications are solely those of the individual author(s) and contributor(s) and not of MDPI and/or the editor(s). MDPI and/or the editor(s) disclaim responsibility for any injury to people or property resulting from any ideas, methods, instructions or products referred to in the content. |
© 2024 by the authors. Licensee MDPI, Basel, Switzerland. This article is an open access article distributed under the terms and conditions of the Creative Commons Attribution (CC BY) license (https://creativecommons.org/licenses/by/4.0/).