Article

The Relationship between the Carbon Fixation Capacity of Vegetation and Cultivated Land Expansion and Its Driving Factors in an Oasis in the Arid Region of Xinjiang, China

1
College of Ecology and Environment, Xinjiang University, Urumqi 830017, China
2
College of Geography and Remote Sensing Sciences, Xinjiang University, Urumqi 830017, China
3
Key Lab of Guangdong for Utilization of Remote Sensing and Geographical Information System, Guangdong Open Laboratory of Geospatial Information Technology and Application; Guangzhou Institute of Geography, Guangdong Academy of Sciences, Guangzhou 510070, China
4
School of Surveying and Land Information Engineering, Henan Polytechnic University, Jiaozuo 454000, China
*
Author to whom correspondence should be addressed.
Forests 2024, 15(2), 262; https://doi.org/10.3390/f15020262
Submission received: 18 December 2023 / Revised: 22 January 2024 / Accepted: 26 January 2024 / Published: 29 January 2024
(This article belongs to the Special Issue Ecosystem Degradation and Restoration: From Assessment to Practice)

Abstract

:
In the process of agricultural development in arid and semi-arid areas, the carbon fixation capacity of vegetation can be affected to different degrees, but research on its driving factors is lacking. Consequently, this paper focuses on the Weiku Oasis in Xinjiang as its research area, in which the carbon fixation capacity of vegetation is estimated with the chemical equation of a photochemical reaction, using methods such as linear system models and Geodetector to analyze the relationship between cropland expansion characteristics and the carbon fixation capacity of vegetation from 1990 to 2020. The influence of land-use changes on the space differentiation of carbon fixation was elucidated through a time series relationship, and the synergistic effects of nine influencing factors on the carbon fixation capacity during the process of vegetation changes were discussed. The results were as follows: (1) In the process of agricultural development, the proportions of cultivated land area and spatial agglomeration had significant negative correlations with carbon sequestration, and the significance was rising, but the effect of cultivated land area proportion was more significant. (2) Through temporal sequential cooperativity analysis, when other land-use types were converted into cultivated land, the carbon fixation capacity of vegetation suddenly and significantly decreased in the initial year of the transformation, but the effect of cultivated land reclamation on the carbon fixation capacity of vegetation did not have a significant time lag. Moreover, after a certain period of time, cultivated land can gradually recover part of its lost carbon fixation capacity. (3) Among the nine driving factors, potential evapotranspiration is the most prominent in explaining the carbon fixation capacity of vegetation. This single-factor pairwise interaction presents the relationship between bivariate enhancement and nonlinear enhancement. When terrain factors interact with other factors, the enhancement effect of the influence on the carbon fixation capacity of vegetation has an obvious promotion effect. However, the change in the carbon fixation capacity of vegetation is more significantly influenced by potential evapotranspiration and the interaction between the normalized difference vegetation index (NDVI) and other factors. This research is helpful to understanding the basic theories related to the change in the carbon fixation capacity of vegetation during the process of agricultural development in arid and semi-arid areas, as well as providing theoretical reference for ecological environment construction and sustainable development.

1. Introduction

Since the establishment of the United Nations Intergovernmental Panel on Climate Change in 1988, international negotiations on climate change have been conducted on numerous occasions [1,2]. Over the past three decades, terrestrial ecosystems, in terms of carbon sinks, have played significant roles in addressing climate change [3,4,5]. The carbon cycle in terrestrial ecosystems has always been a focal point of a series of global climate change response programs, such as the Global Carbon Project (GCP) and the Global Change and Terrestrial Ecosystem Response Project (GCTE) [6]. If there is a serious imbalance between global carbon sources and sinks, climate change and the carbon cycling of terrestrial ecosystems will be affected to a certain extent [7]. Studies have shown that the impact of terrestrial vegetation is considered one of the greatest uncertainties regarding the global carbon cycle [8,9,10]. Terrestrial vegetation can capture and fix CO2 through photosynthesis [11]. The carbon fixation capacity of vegetation is a key parameter for assessing carbon balance, and it plays a crucial role in reducing global carbon dioxide emissions [12,13]. The carbon fixation capacity of vegetation not only reflects the amount of organic carbon fixed by green plants through photosynthesis, but also manifests the productive capacity of terrestrial ecosystems under natural conditions, making it an important topic in carbon cycle research [14,15]. Oases are the principal environments for human survival in arid regions [16]. Therefore, studying the carbon fixation capacity of vegetation in oases is of considerable significance for the implementation of sustainable development strategies.
The quantitative estimation of ecosystem carbon fixation, using net primary production (NPP) data, has been applied by many scholars [17,18,19,20]. Feng et al. estimated the carbon fixation in the Sichuan and Chongqing regions based on the reaction formulas of photosynthesis and respiration, and they proposed that controlling human activities is the key to improving carbon fixation in the higher-altitude regions of Western Sichuan. Zhang et al. used NPP to calculate vegetation carbon fixation in the Qinghai Lake basin, and they deduced that the increase in the alpine meadow carbon fixation value was the largest. Xu et al. estimated NPP using a CASA model, and then calculated the vegetation carbon fixation in Guangzhou, Guangdong Province, according to the reaction equation between photosynthesis and respiration. They concluded that, after the transition from natural land-use types to built-up areas, the urban vegetation carbon fixation decreased, and the urban ecosystem might enter the repair period. Many scholars have confirmed that the spatiotemporal variations in NPP and the carbon fixation capacity of vegetation may be affected by factors such as land-use types, topography, vegetation types, climate, and other natural and anthropogenic factors. This reflects the fact that the main factors affecting the carbon fixation capacity of vegetation also vary from region to region [21,22,23]. Generally speaking, most studies are conducted for forest ecosystems [24,25]. Although other land-use types (such as cultivated land) are also important components of terrestrial ecosystem carbon sinks, there are fewer relevant studies on them. However, with the development of agriculture and urbanization, the most important land-use type change in arid regions is the change in cultivated land [26]. And, agriculture is one of the most extensive land-use activities among human beings, covering 1/3 of the global surface area and playing a crucial role in regulating climate change and carbon sinks [27,28].
In arid zones with fragile ecosystems, natural and human factors interact with the carbon fixation capacity of vegetation [29]. Natural factors, such as topographic features and climatic factors, can lead to large differences in vegetation growth [30]. Favorable climate conditions, particularly abundant rainfall, often increase species diversity and below-ground biomass, thereby benefiting the carbon storage of shrubs and grasslands [31]. Anthropogenic factors mainly include changes in land-use types due to human activities. It has been shown that the conversion of land-use types caused by urban expansion has a negative impact on the carbon fixation capacity of vegetation [32,33,34]. Current studies suggest that the commonly held view that conservation farming is beneficial for carbon fixation might be an illusion created by sampling methods; the data reported so far are not convincing, so the impact of cultivated land on relevant carbon fixation remains uncertain [35]. In response to these issues, scholars have conducted a lot of research on carbon sinks, but they often focus on the impact of a single influencing factor (e.g., vegetation type, building land expansion, etc.) on carbon sinks in economically developed or densely vegetated areas, or are limited to short-term time series studies [36,37]. However, in arid and semi-arid areas, little research combines land-use types, topography, climate, and other natural and human activity factors for long-term time series studies, explores their lag relationships, and analyzes the drivers of the carbon fixation capacity of vegetation. This study, therefore, promotes our understanding of the carbon fixation capacity of vegetation in different areas.
The Xinjiang Uygur Autonomous Region is situated in the arid northwest of China. The local ecological environment is fragile, and the situation for sustainable development is of great concern. In the 1990s, the southern region of Xinjiang, particularly the oasis areas, vigorously developed its agricultural economy, encouraged the reclamation of cultivated land, and introduced a series of preferential policies such as grain production subsidies and agricultural tax reductions, with the speed and quantity of cultivated land development reaching its peak between 2000 and 2005 [38]. With the rapid development of agriculture, the type of land use has drastically changed, and there is evidence that land-use changes have significant impacts on carbon fixation and the ecological environment [39,40], which prompted our need to further understand the carbon fixation capacity of vegetation during the process of agricultural development on a regional scale. The Weiku Oasis plays a typical role in the southern Xinjiang region and was chosen as the research area for this paper. A comprehensive analysis of the main factors influencing the spatial differentiation of the carbon fixation capacity of vegetation during agricultural development in the Weiku Oasis can enrich our further understanding of the impact of carbon fixation during agricultural development in arid areas.
For this study, we used the highly agriculturalized Weiku Oasis in Xinjiang as the research subject. Utilizing long-term time series research methods, we elaborated on the relationships between important cultivated land reclamation characteristics, such as the proportion of expanded cropland area, spatial agglomeration patterns, spatial expansion intensity, and spatial growth, and the carbon fixation capacity of vegetation. This revealed the temporal sequential cooperativity between land-use changes and the carbon fixation capacity of vegetation. In addition, we used Geodetector to quantitatively analyze the impact on the carbon fixation capacity of vegetation under the combined action of various climate and human activity factors, such as land-use types, terrain, and precipitation. The purpose of this research is to enrich the theory of the relationship between land-use change and carbon sinks during the process of agricultural production and development in arid and semi-arid areas and to provide an empirical basis for agricultural ecological management and development.

2. Materials and Methods

2.1. Study Area

The study area is located in the Weigan River–Kucha River Delta Oasis in southern Xinjiang (hereinafter referred to as the Weiku Oasis), as shown in Figure 1. It is situated in the alluvial and diluvial plain zone at the southern foothills of the Tianshan Mountains in the central–northern part of the Tarim Basin, between 81°28′30″ E and 84°05′06″ E longitude, and 39°29′51″ N and 42°38′01″ N latitude. The elevation of the plain area is between 976 and 1030 m, belonging to a continental warm temperate arid climate [41]. The average annual temperature is 11.6 °C, with cold winters, long frost-free periods, and scarce precipitation. The air is dry, and evaporation is strong, with the annual total evaporation in the plain area ranging between 1766 and 2450 mm, with the average annual evaporation being 2024 mm, and it is high in summer and lower in winter. The Weiku Oasis is administratively part of the Aksu Region and is located in Kuqa City, Xinhe County, and Shaya County. The center of the area bordering Kuqa City, Xinhe Prefecture, and Shaya Prefecture is well-watered, thus forming the Weiku Oasis, while most of the area farther away from the water source is Gobi Desert.

2.2. Data Collection and Processing

2.2.1. Data

The land-use type data were obtained from the CLCD (China Land Cover Dataset) through the GEE (Google Earth Engine) platform (https://code.earthengine.google.com), with spatial resolutions of 30 m. The normalized difference vegetation index (NDVI) and Net Primary Productivity (NPP) data were also obtained from the GEE platform, with spatial resolutions of 1 km and 500 m, respectively. The digital elevation model (DEM) was from the ASTER GDEM, with a resolution of 30 m, sourced from the Geospatial Data Cloud (https://www.gscloud.cn (accessed on 15 March 2022)). Slope and aspect were extracted from the DEM data. Monthly precipitation, average monthly temperature, and potential evapotranspiration data were obtained from the Earth System Science Data Sharing Platform (https://www.geodata.cn/ (accessed on 2 April 2023)), each with a resolution of 1 km. Population density data were sourced from the Spatiotemporal 3-pole Environment Big Data Platform (http://poles.tpdc.ac.cn/zh-hans/ (accessed on 10 May 2023)) and the LandScan global population density data (landscan.ornl.gov/ (accessed on 15 May 2023)), with a spatial resolution of 1 km. For the above data, the timeframe of land-use data was 1990–2020, and other data except the DEM, slope, and slope direction were from four sets of data, from 1990, 2000, 2010, and 2020. The above data were rasterized in ArcGIS (10.2) software and converted uniformly to WGS 1984 coordinates, with a spatial resolution of 1 km after processing projection changes, study area boundary masking, and resampling.
Among these, the DEM (Digital Elevation Model) data provided altitude information. Slope and aspect affect soil erosion and runoff, which, in turn, affect the vegetation’s growth and carbon fixation capacity. The monthly precipitation and average spatial temperature, two climatic factors, determine vegetation distribution and growing conditions, affect photosynthesis and carbon fixation capacity, and are highly correlated with the spatial differentiation of grassland biomass [42]. Potential evapotranspiration, the main pathway of water resource consumption, is considered critical in water resource management, especially in arid and semi-arid environments [43]. The NDVI (Normalized Difference Vegetation Index) is an index that can directly reflect vegetation coverage and productivity. The impact of human activities, represented by population density, on vegetation cover and carbon cycling is very significant and has been recognized as a major cause affecting the recovery and degradation of vegetation in Xinjiang [44].

2.2.2. Data Preprocessing

When using the geographic detector for factor and driving force analysis, numerical values need to be discretized into categorical values. Referring to the “Yunnan Province Forest Resource Planning and Design Survey Operation Rules”, the slope was divided into six levels and the aspect was divided into nine directions [45,46]. Using the reclassification tool in ArcGIS, the slope was divided into six categories (in degrees): gentle slope (0–5), mild slope (6–15), moderate slope (16–25), steep slope (26–35), sharp slope (36–45), and dangerous slope (≥46). The remaining six variables were converted from continuous to categorical using the natural break point classification method (Table 1).

2.3. Research Method

2.3.1. Estimation of the Amount of Fixed Carbon

The vegetation in the ecosystem absorbs CO2 from the air. The chemical equation is as follows: 6 CO 2 + 6 H 2 O   C 6 H 12 O 6 + 6 O 2 , The relationship between organic matter and the absorption of carbon dioxide was established using the photosynthesis equation [47,48], and the content of carbon in dry matter accounted for approximately 45% of the total NPP [49]. Vegetation can fix 1.63 kg CO2 by producing 1.00 kg organic matter, and the carbon content in CO2 is 27.27% [29,50]. According to this relationship, the following equation was established:
W C = N P P 0.45 × 1.63 × 0.27
In the formula, W C   represents the conversion of the NPP to the amount of   CO 2   fixed (g/m2) per unit area of a certain ecosystem and, thus, represents the carbon fixation capacity of vegetation; NPP represents the annual per-unit area vegetation NPP (gC/m2/a) of this ecosystem.

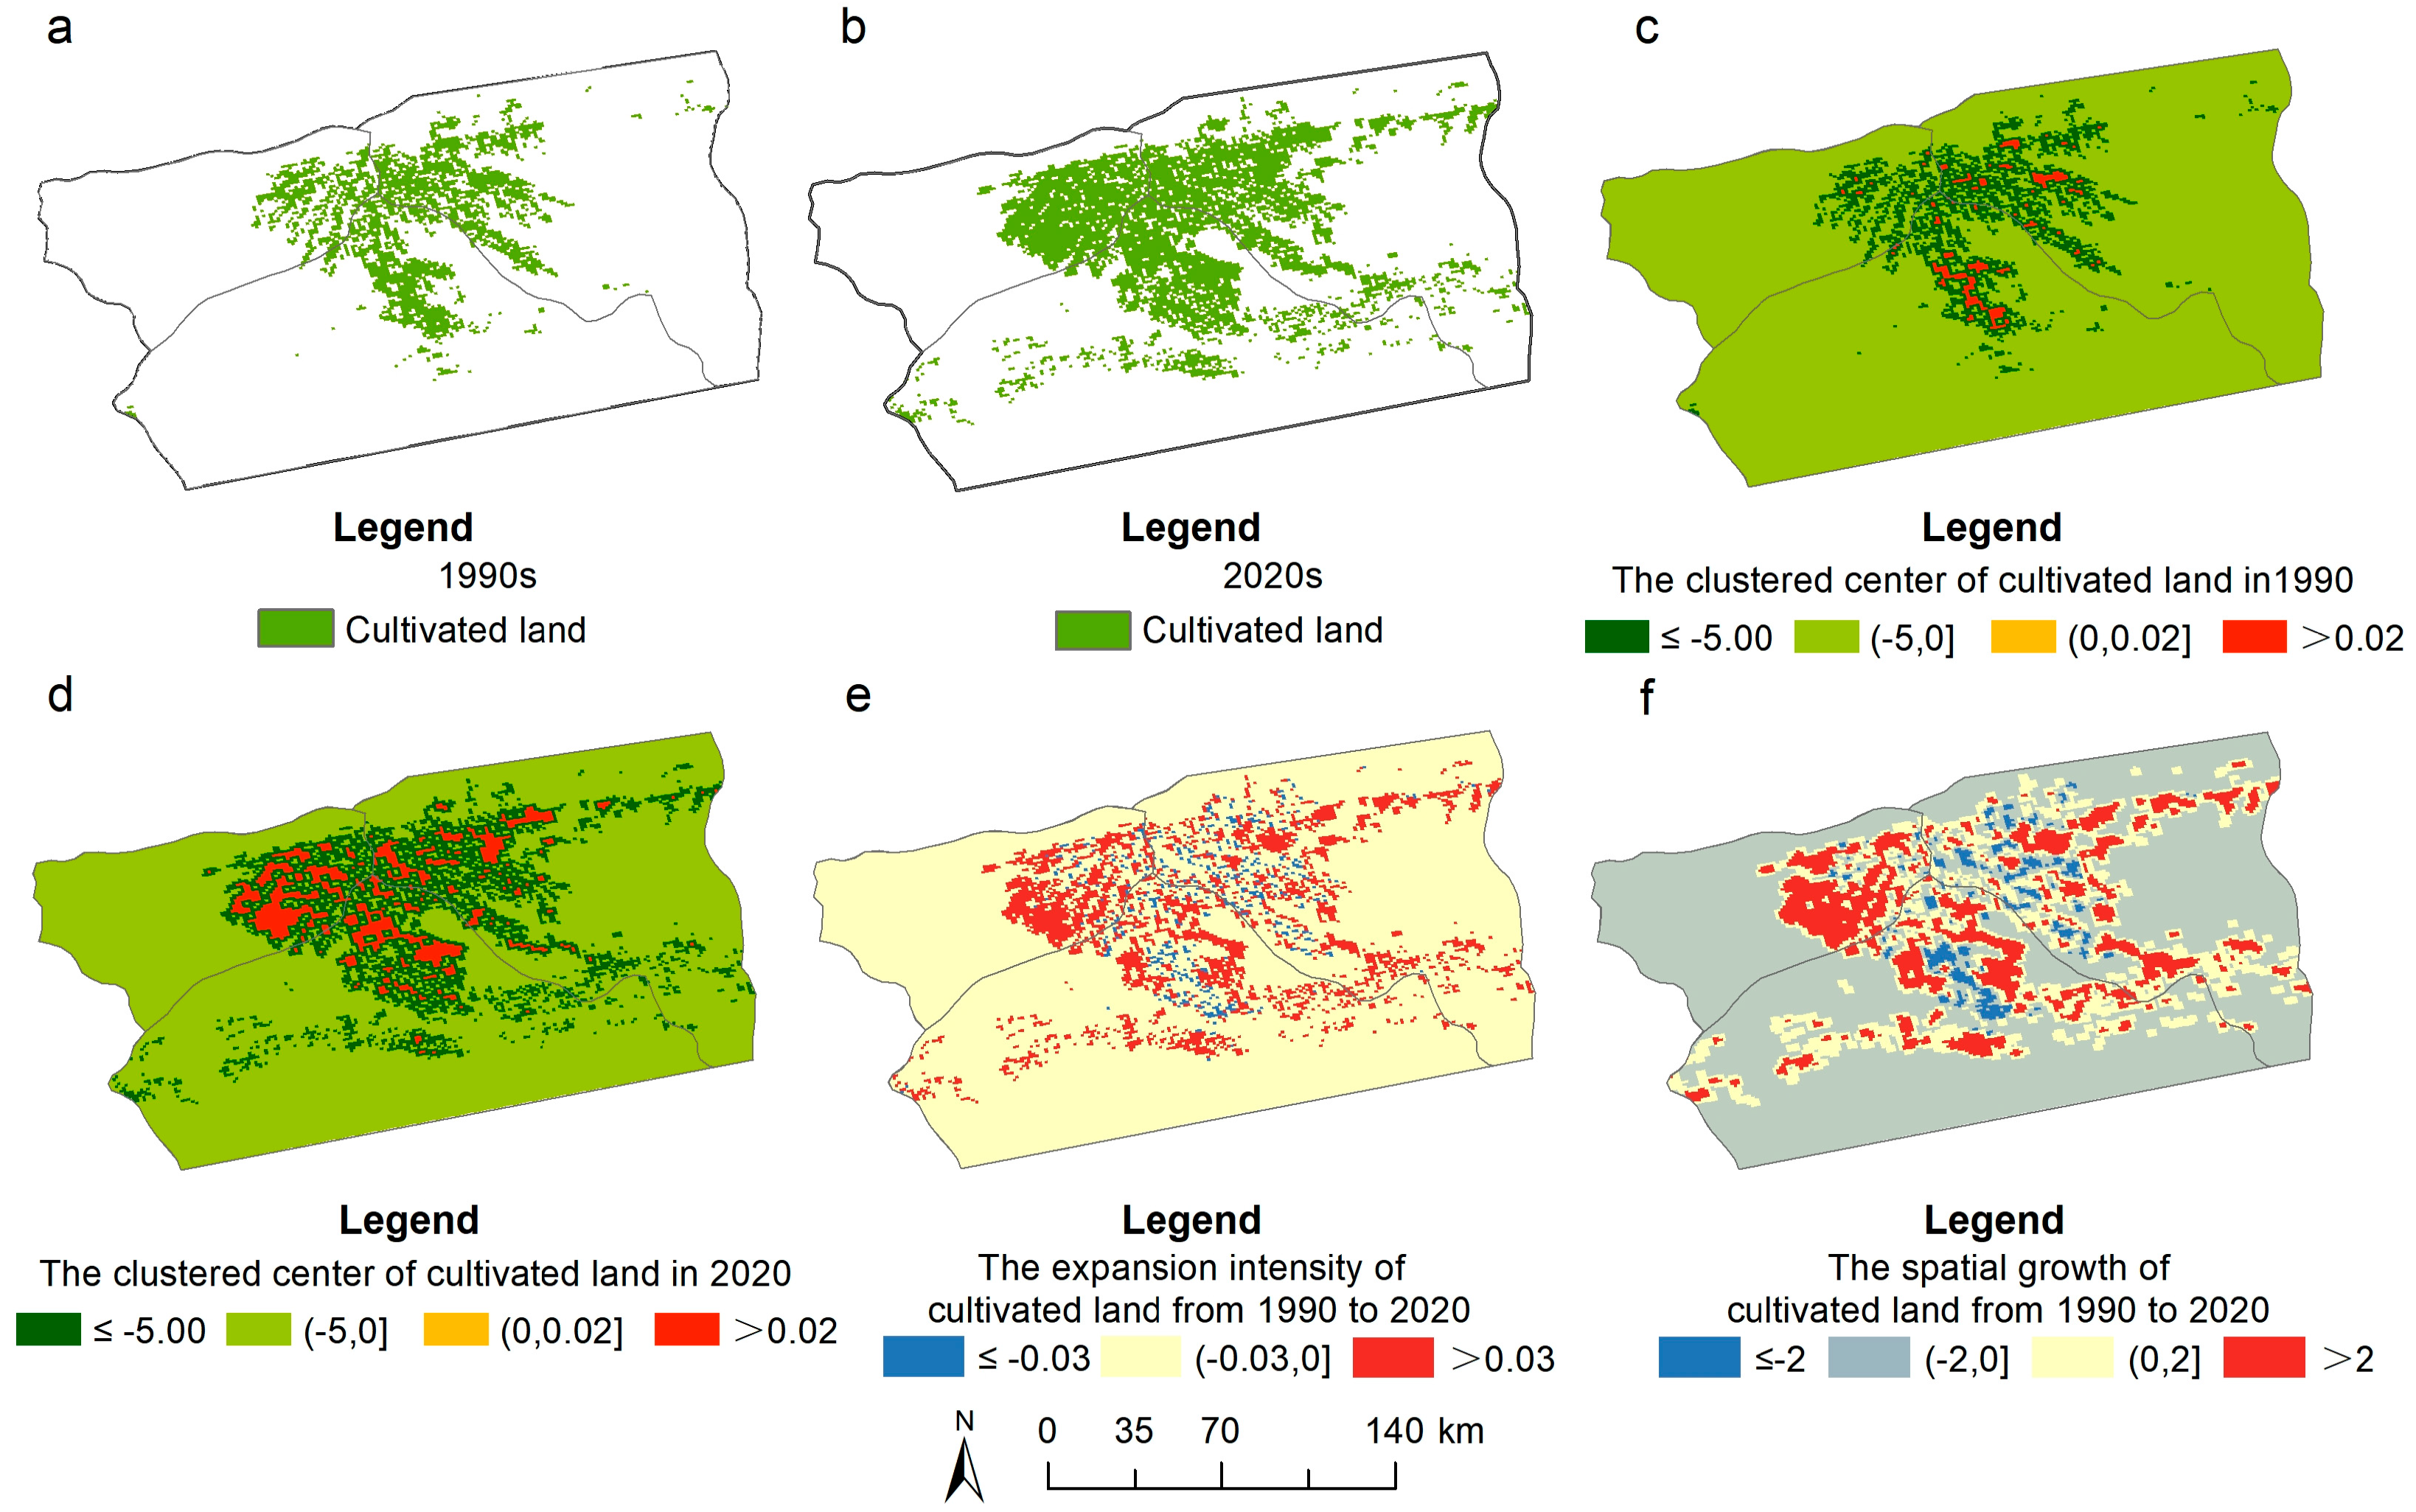
2.3.2. Spatial Agglomeration of Cultivated Land

To explore the agglomeration characteristics of cultivated land over the past 30 years, the ArcGIS (10.2) software technology platform’s 1 km × 1 km grid statistical unit was used to perform spatial superposition on cultivated land. The hotspot analysis model (Getis-Ord Gi*), in spatial statistical analysis, was used to quantitatively identify high-value (hot) and low-value (cold) cultivated land spatial agglomeration [20]. The specific evaluation model is as follows:
G i * = Σ j = 1 n W i , j x j X ¯ Σ j = 1 n W i , j n Σ j = 1 n w i , j 2 ( Σ j = 1 n w i , j ) 2 n 1
In the formula, x j represents the area of cultivated land in grid j , w i j   is the spatial proximity weight between grid i and grid j , and n is the total number of grids. The first law of geography indicates that cultivated land may exhibit spatial autocorrelation at a certain spatial scale [51]. Based on the aforementioned theory, the hotspot analysis of cultivated land can express the spatial agglomeration of cultivated land with G i Z scores and   G i p values, as well as perform confidence significance tests (Table 2). Z scores and p values are measures of statistical significance. Z scores represent multiples of the standard deviation, and the p values represent power levels.

2.3.3. Spatial Expansion Intensity and Spatial Growth of Cultivated Land

To quantitatively evaluate the spatial expansion intensity and spatial growth center of cropland during a rapid development process, the comprehensive land use dynamic degree index model and hotspot analysis model, proposed by Liu et al. were adopted [52]. The spatial expansion intensity information of cropland in the Weiku Oasis from 1990 to 2020 was compiled into a 1 km × 1 km grid statistical unit. The specific evaluation model for the spatial expansion intensity index of cropland is as follows:
L i = Δ U i Δ t × S n e t × 100 %
In the formula, Δ U I   represents the dynamic change in the area of cropland with in the i grid during the research period, Δ t   denotes the research period, and S n e t   refers to the area of the spatial unit under study. The evaluation results of the cropland spatial expansion intensity were obtained based on the above method, and the hotspot areas of cropland spatial expansion intensity and spatial growth were determined quantitatively by referring to the G i index.

2.3.4. Pearson Correlation Analysis

The Pearson correlation coefficient is commonly used to calculate the correlation between two variables [53,54]. The proportion of cultivated land expansion (excluding rural residential land types), spatial aggregation, spatial expansion intensity, and spatial growth are the variables X = ( X 1 ,   X 2 ,   , X n ), and the carbon sequestration amount of vegetation is the variable Y. The Pearson correlation coefficient r, between variables X and Y, is calculated as follows:
r = i = 1 n ( X i X ¯ ) ( Y i Y ¯ ) i = 1 n ( X i X ¯ ) 2 i = 1 n ( Y i Y ¯ ) 2
where r represents the Pearson correlation coefficient, X and Y represent the variables, X ¯ is the average value of variable X, and Y ¯ is the average value of variable Y. Range of r value: [−1, 1],│ r │; the closer the value is to 1, the higher the degree of correlation between the two variables. When r < 0.20, there is very weak correlation/no correlation; when 0.21 ≤ r < 0.40, there is weak correlation; when 0.41 ≤ r < 0.60, there is moderate correlation, when 0.61 ≤ r < 0.80, there is strong correlation; when r ≥ 0.81, there is very strong correlation. Using the SPSS 22 statistical software, Pearson was used for correlation analysis, evaluating the impact of rapid agricultural development (cultivated land expansion) on the carbon fixation of oasis vegetation from 1990 to 2020.

2.3.5. Linear System Models

In terrestrial ecosystems, if the expansion of cultivated land is viewed as a stimulus to the system, then the carbon fixation capacity of vegetation can be seen as the system’s comprehensive response to the stimulus. It is assumed that, within a certain period of time, there is a linear relationship between the expansion of cultivated land area and carbon sinks. In simple terms, the carbon fixation capacity of vegetation in a certain year is considered as the result of the comprehensive impact of cultivated land expansion; when the expansion of cultivated land in a year is explained as possibly affecting the carbon fixation capacity of vegetation in that year, the second year…, or n years later, a linear system model is established. The carbon fixation capacity of vegetation is set as C , the cultivated land expansion is set as L , the function of the impact of cultivated land expansion on the carbon fixation capacity of vegetation is 0 years, the 1st year…, and the nth year is set as Q . These variables can be used to obtain n equations [20], as shown in the formula, to analyze the time series coordination relationship between oasis cultivated land expansion and the carbon fixation capacity of vegetation.
{ C 0 C 1 C n } = { Q 0 Q 0 Q 1 Q 0 Q 1 Q n } { L 0 L 1 L n }

2.3.6. Geodetector

Geodetector is a set of statistical methods used to analyze geographic differentiation and reveal the driving forces behind it [55]. The impacts of geographical and environmental factors on geographical phenomena are revealed through four sensors: risk detection, factor detection, ecological detection, and interaction detection. The independent variables selected in this paper have already discretized numerical quantities into categorical quantities, and two functions of factor detection and interaction detection in the geographic detector are used.
Through the factor detector, we analyzed the explanatory power of natural and human factors, to some extent, on the spatial differentiation of the carbon fixation capacity of vegetation in the Weiku Oasis and used the q value to measure the specific explanatory power of each factor.
q = 1 h 1 L N h σ h 2 N σ 2 = 1 S S W S S T
  S S W = h 1 L N h σ h 2
S S T = N σ 2
In the formula, h = 1; L represents the classification of variable Y or factor X; N h   and N , respectively, represent the unit number of h and the whole area;   σ h 2 and σ 2 , respectively, represent the variance of the category and the variance of the Y-value for the whole region. S S W   and   S S T   , respectively, represent the sum of the variances within the category and the total variance of the whole area. The higher the q value, the greater the influence of the factor on the carbon fixation capacity of vegetation, and its value range is [0, 1].
To identify the interactions of different natural and human factors with the carbon fixation capacity of vegetation, for the q-value  ( X 1   X 2 ) of any single superimposed factor, X1 and X2 are calculated to determine whether the combined action of factors will increase or weaken the explanatory power for the carbon fixation capacity of vegetation Y, or whether these factors affect Y independently [56]. The relationships between the factors are shown in Table 3. Nine factors, including the DEM slope, aspect, precipitation, temperature, NDVl, potential evapotranspiration, population density, and land use, are selected as the driving factors for the carbon fixation capacity of vegetation (Table 4), and the Geodetector model is used to analyze the significance levels of the impacts of individual factors on the carbon fixation capacity of vegetation and the impacts of interactions between various factors on the carbon fixation capacity of vegetation.

3. Results

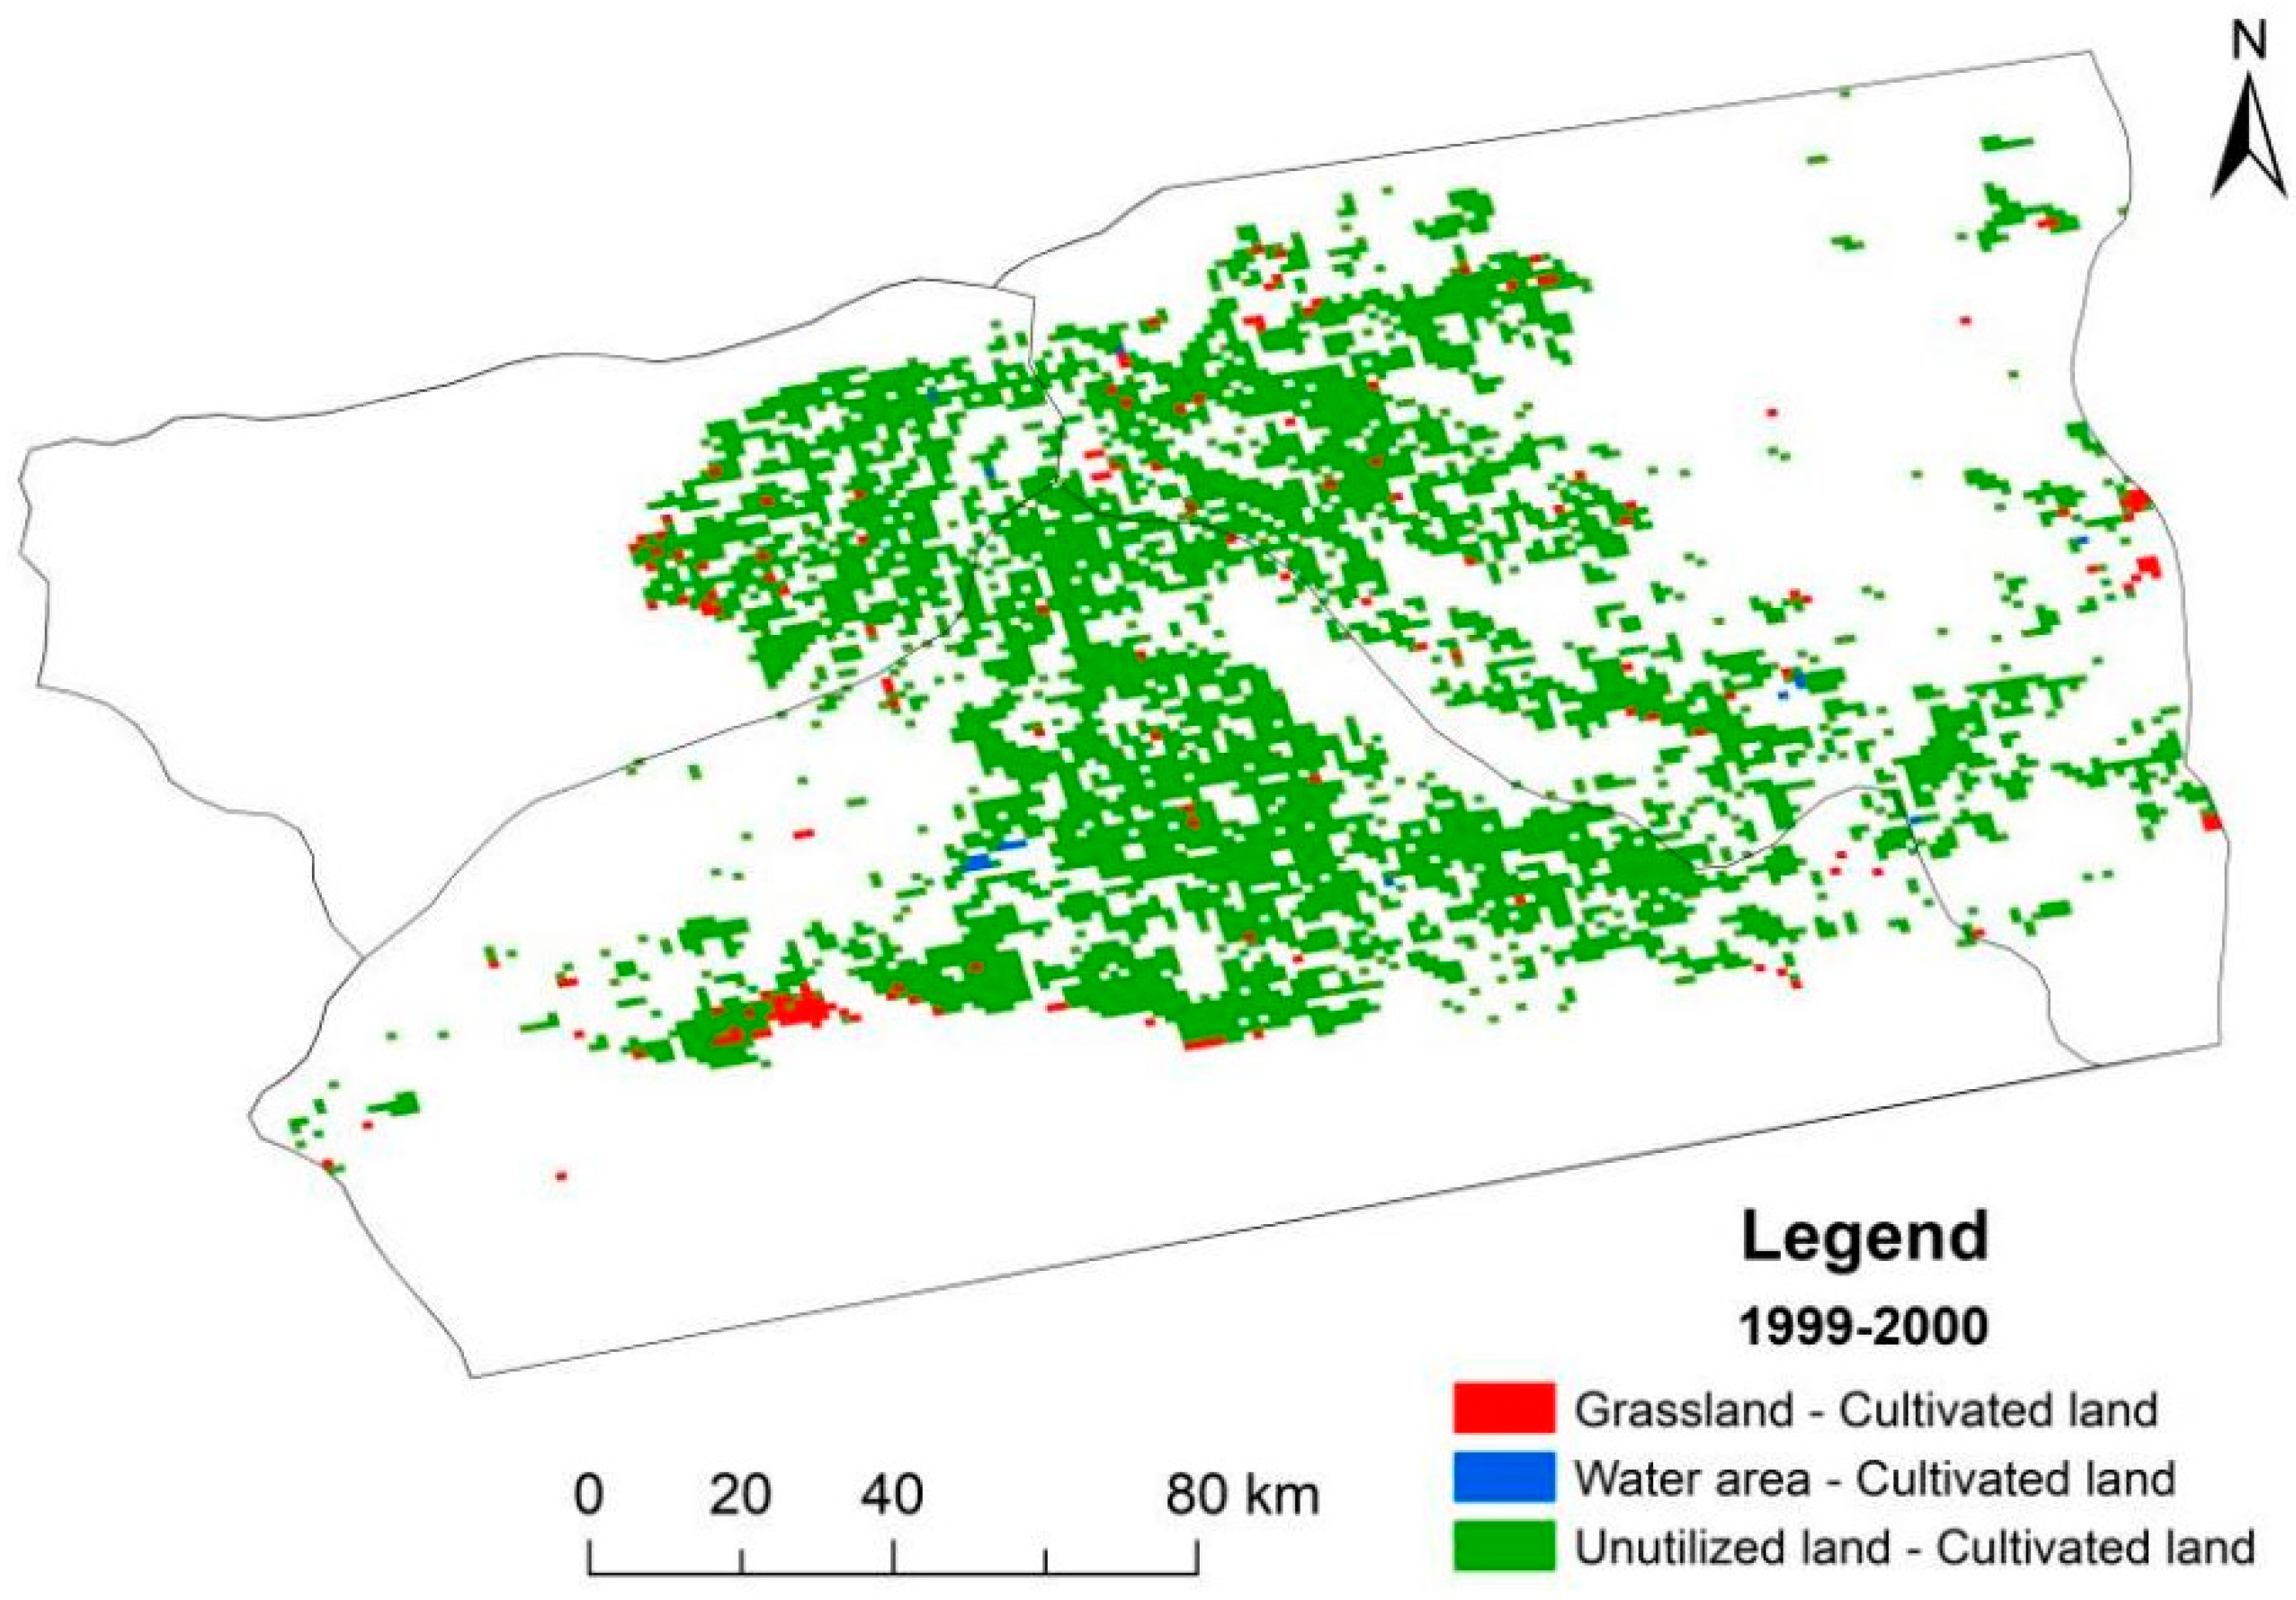
3.1. The Impact of Cultivated Land Expansion in the Weiku Oasis on the Carbon Fixation Capacity of Vegetation

In this study, we analyzed the main characteristics of cultivated land expansion in the Weiku Oasis from 1990 to 2020. As shown in Figure 2, the proportion of cultivated land area is mainly distributed in the central area bordering Kuqa City, Xinhe County, and Shaya County. On this basis, cultivated land has been under continuous expansion, and the proportion of cultivated land area has increased significantly. This is because the central regions connecting the three areas have sufficient water resources, and the terrain is flat, which is suitable for arable land. The spatial agglomeration mainly presents an evolutionary pattern of cropland spreading outwards from the central part of the Weiku Oasis, with the evolution process of cropland expansion in Xinhe County being particularly significant. In terms of the cropland spatial expansion intensity and spatial growth, higher values are mainly concentrated in the eastern part of Xinhe County, the central and southern parts of Shaya County, and the central and northern parts of Kuche City. These regions expanded cropland at a faster and more significant rate.
From 1990 to 2020, the proportion of cropland and spatial agglomeration were negatively correlated with the carbon fixation capacity of vegetation, and their significance values showed upward trends (Table 5). According to the (bilateral) significance test (Table 5), it can also be seen that both the proportion of cropland and spatial agglomeration significantly impacted the carbon fixation capacity of vegetation. However, cropland proportion significantly impacts the oasis carbon fixation capacity of vegetation more than spatial agglomeration. This indicates that, in the cultivated land expansion caused by agricultural development in arid regions, the proportion of cultivated land area is the main driving factor affecting the change in the carbon fixation capacity of vegetation. From 1990 to 2000 and from 2000 to 2010, the correlation between the cropland spatial expansion intensity and spatial growth and the carbon fixation capacity of vegetation changed from negative to positive. This transformation may be due to the gradual improvement in cultivated land management measures during cultivated land reclamation [57]. At the beginning of the reclamation of the Weiku Oasis, the farmland drainage and irrigation systems were not perfect, and farming was extensive. The structure of agricultural production has been optimized through the vigorous management of salinized land; the prevention of seepage through canals; the adoption of low-pressure pipeline irrigation, drip irrigation, and other technologies; and the adjustment of crop planting structures [58]. The correlation between the oasis cropland expansion intensity and the carbon fixation capacity of vegetation from 1990 to 2010 was insignificant. The impact of the cropland spatial expansion intensity and spatial growth on the carbon fixation capacity of vegetation is relatively low, and the maximum correlation coefficient of these two indicators appears from 2010 to 2020. In summary, cultivated land expansion in the Weiku Oasis has increased the carbon fixation capacity of vegetation, indicating that the expansion of cultivated land during agricultural development significantly impacted the carbon fixation capacity of vegetation in the oasis. The complex characteristics of cultivated land expansion, such as area, intensity, spatial clustering, and spatial growth, have varying degrees of impact on the carbon fixation capacity of vegetation, among which the proportion of cultivated land area plays an important role.

3.2. Temporal Sequential Cooperativity Relation of Cultivated Land Reclamation and the Carbon Fixation Capacity of Vegetation in the Oasis

As shown in Figure 3, the expansion of cultivated land in the Weiku Oasis is mainly from grasslands, water areas, and unused land to cultivated land. In this paper, we took the expansion of cultivated land in the Weiku Oasis from 1999 to 2000 as an example (Figure 3), examined the impacts of three types of cultivated land expansion (grassland/water/unused land) on the carbon fixation capacity of vegetation from 1999 to 2010, and explored their temporal coordination relationships.
The temporal evolution characteristics of the first year, the second year, and the nth year between cultivated land expansion types and the carbon fixation capacity of vegetation are indicated in Figure 3 and Figure 4, as well as in Table 6. According to Table 6, from 1999, the carbon fixation capacity of vegetation in the Weiku Oasis dropped sharply in the second year (2000) after different land-use types were transformed into cultivated land. Among them, as grassland transformed into cultivated land, the unit grid number changed from 170.47 g·m−2·a−1 to 87.94 g·m−2·a−1 (a loss of 82.53 g·m−2·a−1); as water areas transformed into cultivated land, the unit grid number changed from 50.09 g·m−2·a−1 to 30.98 g·m−2·a−1 (a loss of 19.11 g·m−2·a−1); as unused land transformed into cultivated land, the unit grid number changed from 167.40 g·m−2·a−1 to 63.91 g·m−2·a−1 (a loss of 103.49 g·m−2·a−1). The transformations of the aforementioned different land-use types into cultivated land are the main factors causing the change in the carbon fixation capacity of vegetation. However, the carbon fixation capacity of vegetation in the third year (2001) decreased compared to the second year (2000), but the change was insignificant. The carbon fixation capacity of vegetation in the fourth year (2002) increased and decreased compared to the third year (2001), but the change was also insignificant. This indicates that the land-use type transformation in 1999 had the most significant impact on the carbon fixation capacity of vegetation in 2000, causing a large loss of carbon fixation. However, there was no significant change in the carbon fixation capacity of vegetation in 2001. Therefore, there is no significant time lag relationship between cultivated land expansion and changes in the carbon fixation capacity of vegetation.
From Table 6, it can be observed that, when grassland was transformed into cultivated land from 1999 to 2000, there was a large loss of carbon fixation capacity of vegetation, but with the passage of time, from 2002 to 2003, the area that was previously expanded from grassland to cultivated land began to slowly experience an increase in the carbon fixation capacity of vegetation. Overall, after the cultivated land expansion in 1999, compared to 2000, the carbon fixation capacity of vegetation in 2010 increased. This result shows that, after grassland, water areas, and unused land are transformed into cultivated land, the carbon fixation capacity of vegetation drops sharply.

3.3. Analysis of the Influences of Driving Factors Based on the Geodetector

3.3.1. Single-Factor Detection

As can be seen from Table 7, from 1990 to 2020, all nine single-factor variables had a significant relationship with the carbon fixation capacity of vegetation (p < 0.01). Among them, the explanatory power of the DEM, annual rainfall, and annual average temperature on the carbon fixation capacity of vegetation gradually decreased; the impacts of slope, aspect, and potential evapotranspiration remained basically the same; the explanatory power of the NDVI, population density, and land use increase year by year. Although the DEM, slope, and aspect have lower explanatory power for the carbon fixation capacity of vegetation among these nine factors, they also participate in influencing the spatiotemporal differentiation of the carbon fixation capacity of vegetation to a certain extent. The top three factors, in terms of explanatory power, for the carbon fixation capacity of vegetation are the potential evapotranspiration, annual average temperature, and annual precipitation in 1990; the potential evapotranspiration, land-use type, and annual precipitation in 2000; the NDVI, potential evapotranspiration, and land-use type in 2010; and the potential evapotranspiration, NDVI, and land-use type in 2020. It can be seen that, among these variables, the natural factor with the largest explanatory power for the spatial pattern of the carbon fixation capacity of vegetation is potential evapotranspiration, and the largest anthropogenic factor is land-use type, indicating that natural factors and anthropogenic factors directly or indirectly affect the spatiotemporal evolution pattern of the carbon fixation capacity of vegetation.

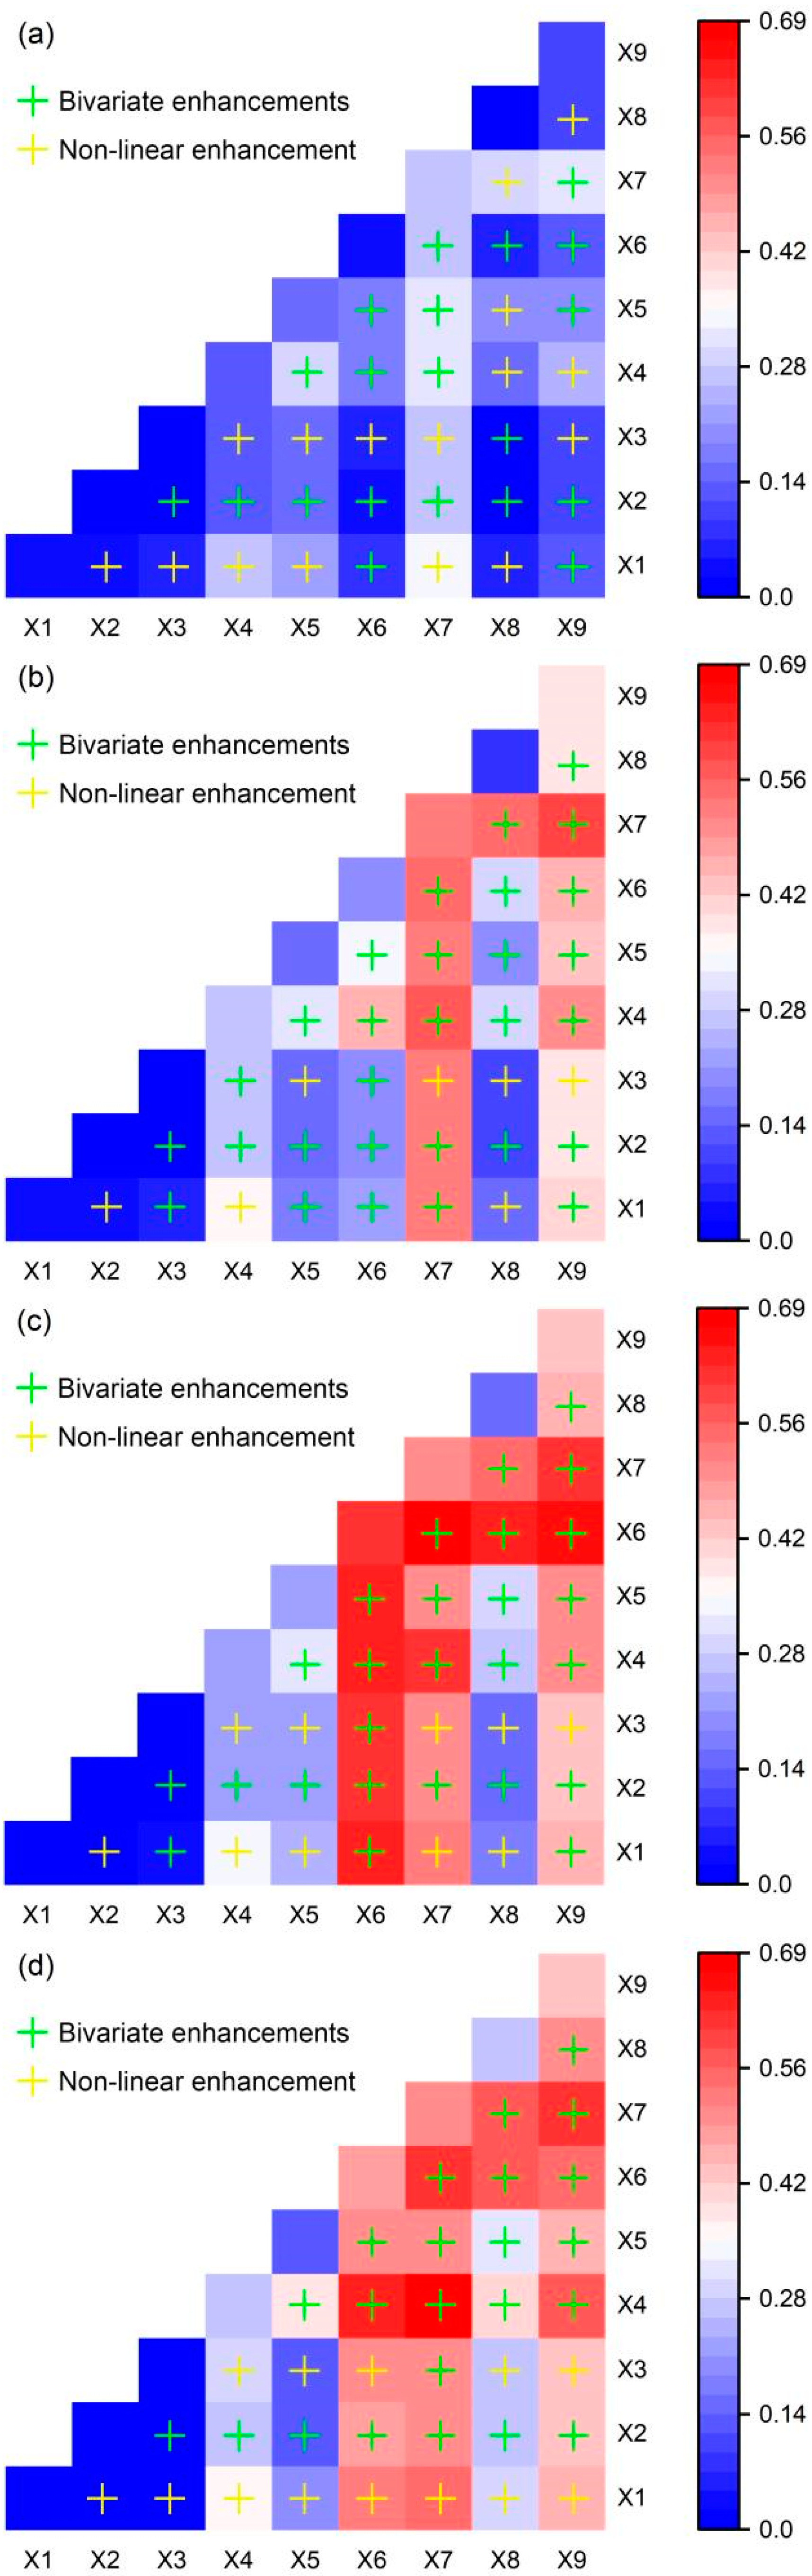
3.3.2. Detection of Driver Interactions

The Geodetector model is applied to quantitatively analyze the impact of the simultaneous action of two factors on the spatial differentiation of the carbon fixation capacity of vegetation (Figure 5). It can be found that the q-values obtained from the sum of the interactions of two factors from 1990 to 2020 were all greater than the q-values when one factor acted alone. The results showed that the effect of any two factors on the spatial differentiation of the carbon fixation capacity of vegetation was higher than that of a single factor, and the interaction increased the explanatory power of the carbon fixation capacity of vegetation.
As shown in Figure 5, the interaction detection results of the nine factors were divided into two-factor enhancement and non-linear enhancement. The interactions of potential evapotranspiration, land use, and other factors had greater effects on the carbon sequestration capacity of vegetation in 2000, 2010, and 2020. The interaction of the NDVI with other factors had a greater effect on the carbon fixation capacity of vegetation in 2010 and 2020. Comparing the results, the interaction values of the NDVI, potential evapotranspiration, and land use were higher when they interacted with other factors in 2000, 2010, and 2020, most of which were above 0.5, and the highest value occurred in 2010, which indicated that the interactions of different factors made the spatial and temporal evolutions of the carbon fixation capacity of vegetation more complicated. The topographic factors (the DEM and aspect) tended to show nonlinear enhancement when interacting with other factors in 1990, 2000, 2010, and 2020, and the two-factor enhancement was lower, which indicated that the interaction with the other factors enhanced the influence of the two factors, more than the sum of the two factors alone. Therefore, the topographic factor enhanced the influences of other factors on the carbon fixation capacity of vegetation, and, thus, the topographic factor can be used as a supplementary factor in monitoring the carbon fixation capacity of vegetation.

4. Discussion

Discussion of the carbon fixation capacity of vegetation in various land-use types is potentially influential in developing environmental policies to reduce CO2 emissions and the effects of climate change [59]. However, rapidly developing agricultural activities and continuous cultivated land expansion have brought tremendous environmental pressure to natural ecosystems [60]. To accelerate rural revitalization, southern Xinjiang mainly develops industries with agricultural and pastoral characteristics. In this process, the speed of cultivated land reclamation has accelerated. Land-use types have changed from high-carbon fixation to low-carbon fixation function types, and the carbon fixation capacity of vegetation has also changed accordingly. From our study, it can be found that the shift from other land-use types to cultivated land causes a sudden and significant decrease in the carbon fixation capacity of vegetation, and that the effects of the proportion of cultivated land and spatial agglomeration on the carbon fixation capacity of vegetation are more significant. Xu et al. studied the impact of urbanization on the vegetation carbon fixation in Guangzhou, Guangdong Province, and the analysis suggested that the expansion of construction land does not have a significant time lag effect on carbon fixation, which is similar to our research results. After changing from other land-use types to cultivated land, after a certain period of time, the carbon fixation capacity of vegetation increases to some extent. During the processes of agricultural production activities related to cultivated land, such as land turning, planting, irrigation, fertilization, pest control, and harvesting, the protection of cultivated land and the processes of carbon emission and carbon sequestration are involved [61]. Xiong et al. argued that the construction of high-standard farmland can increase total-factor productivity in agriculture and, thus, have a carbon-reducing effect [62]. The Weiku Oasis may disrupt the regional ecosystem carbon balance after the cultivation of arable land. However, with the rationalization of cropping structures and important initiatives, such as the planting of salt-tolerant crops, such as maize and cotton, the construction of farmland protection forests, the development of scientific irrigation and drainage systems, and land improvement, the carbon fixation capacity of cultivated land may gradually increase [63,64,65]. The carbon cycle may gradually transition to a new equilibrium in the Weiku Oasis during the construction of high-standard agricultural land.
Potential evapotranspiration had the most significant impact on the carbon fixation capacity of vegetation in the study area. This is because potential evapotranspiration, as an important part of the water cycle, plays a very important role in the growth of vegetation and crops [66], especially in arid areas. It has been shown that potential evapotranspiration is a key natural factor affecting the carbon use efficiency of forest and grass ecosystems in Xinjiang, explaining 59.05% of its spatial variation [67]. The vapor pressure deficit is one of the causes of plant evapotranspiration, and its increase promotes the opening of stomata by leaves, which facilitates water uptake for plant photosynthesis and normal physiological activities [68]. During the rapid development of agriculture, although natural factors play major roles in the impact on the carbon fixation capacity of vegetation, the impacts of human factors such as population density and land-use changes are continuously increasing. In the interaction, the superposition of potential evapotranspiration, the NDVI, and other factors had greater effects on the carbon fixation capacity of vegetation. Topographic factors do not have strong impacts on the carbon fixation capacity of vegetation when acting alone, but when they interact with other factors, the explanatory power of the carbon fixation capacity of vegetation is mostly greater than the sum of the two factors. This shows that topographic factors have a strong promoting effect on the interaction between the two factors. This may be due to the fact that topography affects natural and anthropogenic factors, such as climate and land use, thereby affecting the carbon fixation capacity of vegetation and reflecting the complexity of the interaction between topographic factors and other factors, such as climate and human activities. Therefore, the impacts of driving factors on the temporal distribution of the carbon fixation capacity of vegetation are not independent, but interrelated, and the factors interact synergistically, indicating that the spatial differentiation of the temporal distribution of the carbon fixation capacity of vegetation is a result of the interactions among various natural and human factors. Feng et al. (2023) deduced that the temporal distribution of the carbon fixation capacity of vegetation in the Chuan-Yu region is jointly affected by climate change and human activities [18], which is similar to this conclusion.
In the carbon cycle of terrestrial ecosystems, different influencing factors have different impacts on the carbon fixation capacity of vegetation. In arid and semi-arid regions, to ensure correspondence with the research time, and due to current knowledge limitations, only nine influencing factors were chosen. Future related research should include more datasets. In this study, we clarified the impacts of land-use changes, climate, and other natural and anthropogenic factors on the carbon fixation capacity of vegetation. Despite this, there are still various uncertainties in distinguishing between direct and indirect impacts, and this area of research needs further discussion and verification. Future research should consider the opinions of multidisciplinary experts, establish a comprehensive indicator system, and provide better references for decision makers [69]. However, this paper focuses particularly on using the photosynthesis reaction equation to calculate the amount of CO2 fixed, which represents the carbon fixation capacity of vegetation [34,70]. The NPP used here refers to the fraction of organic carbon fixed by vegetation, less its own respiratory consumption [71]. Without taking into account the amount of respiratory consumption by heterotrophic organisms, only one aspect of the carbon sink is reflected. The dynamic changes in carbon sinks influenced by both human activities and natural factors might be more complex than those of natural ecosystems. Currently, research on vegetation carbon sinks mainly focuses on estimating the carbon balance of a region or estimating the vegetation carbon sink of a region, using the simulation results of various models [72]. Ecosystem carbon balance estimation methods can be broadly classified into “Bottom–up” and “Top–down” types, including inventory methods, eddy correlation methods, ecosystem process model simulation methods, atmospheric inversion methods, and other methods [73]. Modeling vegetation carbon sinks in a region involves chemical, physical, and biological processes [74]. Currently, there are limitations in the understanding of carbon cycle mechanisms, and analytical studies on carbon sources and sinks still need further development. And there are some uncertainties in the model simulation process, such as errors in ground observation and remote sensing observation, the accuracy of parameters in the model construction process, and the selection of parameters. For the long term, a more comprehensive, higher-precision approach is a direction for future research, the complexity of the carbon cycle needs to be taken into account, and attempts should be made to couple a variety of models to improve the accuracy of model simulation, which will help improve our understanding of carbon sources and sinks.

5. Summary and Conclusions

In this paper, we analyzed the relationship between arable land expansion and the carbon fixation capacity of vegetation and studied the impact of the synergy of nine natural and human activity factors on the spatiotemporal variation in the carbon fixation capacity of vegetation through a geographic detector model, exploring the driving mechanisms of the carbon fixation capacity of vegetation in arid areas. The main conclusions are as follows:
(1)
During the process of agricultural development, the proportion of cultivated land plays a major role in the impact on the carbon fixation capacity of vegetation. The proportion of cultivated land and spatial agglomeration is negatively correlated with the carbon fixation capacity of vegetation, changing it from insignificant to significant, and the significance shows an upward trend. Moreover, the impact of the proportion of cultivated land and spatial agglomeration on the carbon fixation capacity of vegetation is more significant than that of the spatial expansion intensity and spatial growth.
(2)
The carbon fixation capacity of vegetation declined sharply at the beginning of cropland expansion, but there was no significant time lag in the effect on the carbon fixation capacity of vegetation. And, as the system is restored and more of the cultivated land base management is improved, the carbon fixation capacity of vegetation in the cultivated land increases somewhat.
(3)
According to our single-factor detection, the most influential factor in the study year is potential evapotranspiration. The impacts of annual precipitation and average air temperature on the carbon fixation capacity of vegetation are gradually replaced by the NDVI and land-use types. Among the nine driving factors in interactive detection, the results of two-factor interaction detection are two-factor enhancement and non-linear enhancement. The explanatory power of topographic factors is low when they act alone, but they have strong promotive effects when interacting with other factors.
In this study, we preliminarily investigated the factors affecting the change in the carbon fixation capacity of vegetation during the process of agricultural development and provided a theoretical reference for the study of regional carbon sinks in arid zone oases.

Author Contributions

M.S.: conceptualization, writing—original draft, writing—review and editing, data curation, and formal analysis. H.J.: conceptualization, writing—review and editing, and funding acquisition. J.X.: conceptualization, methodology, and supervision. P.Z.: conceptualization, software, and resources. X.L.: visualization and resources. M.X.: validation and resources. D.H.: resources. All authors have read and agreed to the published version of the manuscript.

Funding

Funding was provided by the Open Subject of Xinjiang Oasis Ecology Key Laboratory (2023D04060), the National Natural Science Foundation of China (No. 41561081, No. 41001198), and the Doctor’s start-up fund of Xinjiang University (No. BS190205).

Data Availability Statement

The data analyzed in this study are subject to the following licenses/restrictions: the original contributions presented in this study are included in the article; further inquiries can be directed to the first author.

Acknowledgments

Many thanks to all individuals and organizations who provided data.

Conflicts of Interest

The authors declare no conflicts of interest.

References

  1. Houghton, J.T.; Callander, B.A.; Varney, S.K. Climate Change 1992: The Supplementary Report to the IPCC Scientific Assessment; Cambridge University Press: Cambridge, UK, 1992. [Google Scholar]
  2. Mansanet-Bataller, M.; Pardo, Á. What you should know about carbon markets. Energies 2008, 1, 120–153. [Google Scholar] [CrossRef]
  3. Kern, R.A.; Schlesinger, W.H. Carbon stores in vegetation. Nature 1992, 357, 447–448. [Google Scholar] [CrossRef]
  4. Lu, M.; Zou, Y.; Xun, Q.; Yu, Z.; Jiang, M.; Sheng, L.; Lu, X.; Wang, D. Anthropogenic disturbances caused declines in the wetland area and carbon pool in China during the last four decades. Glob. Chang. Biol. 2021, 27, 3837–3845. [Google Scholar] [CrossRef]
  5. Stocker, B.D.; Zscheischler, J.; Keenan, T.F.; Colin Prentice, I.; Seneviratne, S.; Peñuelas, J. Drought impacts on terrestrial primary production underestimated by satellite monitoring. Nat. Geosci. 2019, 12, 264–270. [Google Scholar] [CrossRef]
  6. Dai, E.; Huang, Y.; Wu, Z.; Zhou, D. Analysis of spatio-temporal features of a carbon source/sink and its relationship to climatic factors in the Inner Mongolia grassland ecosystem. J. Geogr. Sci. 2016, 26, 297–312. [Google Scholar] [CrossRef]
  7. Piao, S.; Fang, J.; Ciais, P.; Peylin, P.; Huang, Y.; Sitch, S.; Wang, T. The carbon balance of terrestrial ecosystems in China. Nature 2009, 458, 1009–1013. [Google Scholar] [CrossRef] [PubMed]
  8. Brandt, M.; Rasmussen, K.; Hiernaux, P.; Herrmann, S.; Tucker, C.J.; Tong, X.; Tian, F.; Mertz, O.; Kergoat, L.; Mbow, C.; et al. Reduction of tree cover in West African woodlands and promotion in semi-arid farmlands. Nat. Geosci. 2018, 11, 328–333. [Google Scholar] [CrossRef] [PubMed]
  9. Brovkin, V.; Boysen, L.; Arora, V.K.; Boisier, J.P.; Cadule, P.; Chini, L.; Claussen, M.; Friedlingstein, P.; Gayler, V.; van den Hurk, B.J.J.M.; et al. Effect of anthropogenic land-use and land-cover changes on climate and land carbon storage in CMIP5 projections for the twenty-first century. J. Clim. 2013, 26, 6859–6881. [Google Scholar] [CrossRef]
  10. Houghton, R.A.; Nassikas, A.A. Global and regional fluxes of carbon from land use and land cover change 1850–2015. Glob. Biogeochem. Cycles 2017, 31, 456–472. [Google Scholar] [CrossRef]
  11. Cheah, W.Y.; Ling, T.C.; Juan, J.C.; Lee, D.J.; Chang, J.S.; Show, P.L. Biorefineries of carbon dioxide: From carbon capture and storage (CCS) to bioenergies production. Bioresour. Technol. 2016, 215, 346–356. [Google Scholar] [CrossRef] [PubMed]
  12. Robinson, D.T.; Brown, D.G.; Currie, W.S. Modelling carbon storage in highly fragmented and human-dominated landscapes: Linking land-cover patterns and ecosystem models. Ecol. Model. 2009, 220, 1325–1338. [Google Scholar] [CrossRef]
  13. Chen, Y.; Feng, X.; Tian, H.; Wu, X.; Gao, Z.; Feng, Y.; Piao, S.; Lv, N.; Pan, N.; Fu, B. Accelerated increase in vegetation carbon sequestration in China after 2010: A turning point resulting from climate and human interaction. Glob. Chang. Biol. 2021, 27, 5848–5864. [Google Scholar] [CrossRef] [PubMed]
  14. Mu, W.; Zhu, X.; Ma, W.; Han, Y.; Huang, H.; Huang, X. Impact assessment of urbanization on vegetation net primary productivity: A case study of the core development area in central plains urban agglomeration, China. Environ. Res. 2023, 229, 115995. [Google Scholar] [CrossRef] [PubMed]
  15. Zhang, B.; Xie, Z.; Gao, J. Assessment on the carbon fixation of urban forests and their efficacy on offsetting energy carbon emissions in Shanghai. Acta Ecol. Sin. 2021, 41, 8906–8920. (In Chinese) [Google Scholar]
  16. Zhuang, Q.; Shao, Z.; Huang, X.; Zhang, Y.; Wu, W.; Feng, X.; Lv, X.; Ding, Q.; Cai, B.; Altan, O. Evolution of soil salinization under the background of landscape patterns in the irrigated northern slopes of Tianshan Mountains, Xinjiang, China. Catena 2021, 206, 105561. [Google Scholar] [CrossRef]
  17. Luo, X.; Jia, B.; Lai, X. Contributions of climate change, land use change and CO2 to changes in the gross primary productivity of the Tibetan Plateau. Atmos. Ocean. Sci. Lett. 2020, 13, 8–15. [Google Scholar] [CrossRef]
  18. Feng, H.; Kang, P.; Deng, Z.; Zhao, W.; Hua, M.; Zhu, X.; Wang, Z. The impact of climate change and human activities to vegetation carbon sequestration variation in Sichuan and Chongqing. Environ. Res. 2023, 238, 117138. [Google Scholar] [CrossRef] [PubMed]
  19. Zhang, T.; Cao, G.; Cao, S.; Zhang, X.; Zhang, J.; Han, G. Dynamic assessment of the value of vegetation carbon fixation and oxygen release services in Qinghai Lake basin. Acta Ecol. Sin. 2017, 37, 79–84. [Google Scholar] [CrossRef]
  20. Xu, Q.; Dong, Y.; Yang, R. Influence of land urbanization on carbon sequestration of urban vegetation: A temporal cooperativity analysis in Guangzhou as an example. Sci. Total Environ. 2018, 635, 26–34. [Google Scholar] [CrossRef]
  21. Piao, S.; Fang, J.; He, J. Variations in vegetation net primary production in the Qinghai-Xizang Plateau, China, from 1982 to 1999. Clim. Chang. 2006, 74, 253–267. [Google Scholar] [CrossRef]
  22. Yuan, Z.; Wang, Y.; Xu, J.; Wu, Z. Effects of climatic factors on the net primary productivity in the source region of Yangtze River, China. Sci. Rep. 2021, 11, 1376. [Google Scholar] [CrossRef] [PubMed]
  23. Zhai, D.; Gao, X.; Li, B.; Yuan, Y.; Li, Y.; Liu, W.; Xu, J. Diverse chronic responses of vegetation aboveground net primary productivity to climatic changes on Three-River Headwaters region. Ecol. Indic. 2022, 139, 108925. [Google Scholar] [CrossRef]
  24. He, N.; Wen, D.; Zhu, J.; Tang, X.; Xu, L.; Zhang, L.; Hu, H.; Huang, M.; Yu, G. Vegetation carbon sequestration in Chinese forests from 2010 to 2050. Glob. Chang. Biol. 2017, 23, 1575–1584. [Google Scholar] [CrossRef] [PubMed]
  25. Xu, Y.; Jiang, M. Forest carbon pool characteristics and advances in the researches of carbon storage and related factors. Acta Ecol. Sin. 2015, 35, 926–933. [Google Scholar]
  26. Cheng, W.; Gao, X.; Ma, T.; Xu, X.; Chen, Y.; Zhou, C. Spatial-temporal distribution of cropland in China based on geomorphologic regionalization during 1990–2015. Acta Geogr. Sin. 2018, 73, 1613–1629. [Google Scholar]
  27. Yao, Z.; Zhang, L.; Tang, S.; Li, X.; Hao, T. The basic characteristics and spatial patterns of global cultivated land change since the 1980s. J. Geog. Sci. 2017, 27, 771–785. [Google Scholar] [CrossRef]
  28. Ren, W.; Tian, H.; Tao, B.; Huang, Y.; Pan, S. China’s crop productivity and soil carbon storage as influenced by multifactor global change. Glob. Chang. Biol. 2012, 18, 2945–2957. [Google Scholar] [CrossRef]
  29. Zhang, Y.; Lang, M.; Liu, M.; Xie, B.; Chang, Q. Vegetation carbon sequestration in the Loess Plateau under the synergistic effects of land cover change and elevations. Acta Ecol. Sin. 2022, 42, 3897–3908. (In Chinese) [Google Scholar]
  30. Wang, F.; Wang, Z.; Zhang, Y. Spatio-temporal variations in vegetation net primary productivity and their driving factors in Anhui Province from 2000 to 2015. Acta Ecol. Sin. 2018, 38, 2754–2767. (In Chinese) [Google Scholar]
  31. Chen, S.; Wang, W.; Xu, W.; Wang, Y.; Wan, H.; Chen, D.; Tang, Z.; Tang, X.; Zhou, G.; Xie, Z.; et al. Plant diversity enhances productivity and soil carbon storage. Proc. Natl. Acad. Sci. USA 2018, 115, 4027–4032. [Google Scholar] [CrossRef] [PubMed]
  32. Lai, L.; Huang, X.; Yang, H.; Chuai, X.; Zhang, M.; Zhong, T.; Chen, Z.; Chen, Y.; Wang, X.; Thompson, J.R. Carbon emissions from land-use change and management in China between 1990 and 2010. Sci. Adv. 2016, 2, e1601063. [Google Scholar] [CrossRef]
  33. Luo, Y.; Sun, W.; Yang, K.; Zhao, L. China urbanization process induced vegetation degradation and improvement in recent 20 years. Cities 2021, 114, 103207. [Google Scholar] [CrossRef]
  34. Zhuang, Q.; Shao, Z.; Li, D.; Huang, X.; Altan, O.; Wu, S.; Li, Y. Isolating the direct and indirect impacts of urbanization on vegetation carbon sequestration capacity in a large oasis city: Evidence from Urumqi, China. Geo-Spat. Inf. Sci. 2023, 26, 379–391. [Google Scholar] [CrossRef]
  35. Baker, J.M.; Ochsner, T.E.; Venterea, R.T.; Griffis, T.J. Tillage and soil carbon sequestration—What do we really know? Agric. Ecosyst. Environ. 2007, 118, 1–5. [Google Scholar] [CrossRef]
  36. Cox, P.M.; Pearson, D.; Booth, B.B.; Friedlingstein, P.; Huntingford, C.; Jones, C.D.; Luke, C.M. Sensitivity of tropical carbon to climate change constrained by carbon dioxide variability. Nature 2013, 494, 341–344. [Google Scholar] [CrossRef] [PubMed]
  37. Zhuang, Q.; Shao, Z.; Li, D.; Huang, X.; Li, Y.; Altan, O.; Xu, S. Impact of global urban expansion on the terrestrial vegetation carbon sequestration capacity. Sci. Total Environ. 2023, 879, 163074. [Google Scholar] [CrossRef] [PubMed]
  38. Gao, X.; Cheng, W.; Wang, N.; Liu, Q.; Ma, T.; Chen, Y.; Zhou, C. Spatio-temporal distribution and transformation of cropland in geomorphologic regions of China during 1990–2015. J. Geogr. Sci. 2019, 29, 180–196. [Google Scholar] [CrossRef]
  39. Long, H.; Liu, Y.; Hou, X.; Li, T.; Li, Y. Effects of land use transitions due to rapid urbanization on ecosystem services: Implications for urban planning in the new developing area of China. Habitat Int. 2014, 44, 536–544. [Google Scholar] [CrossRef]
  40. Tao, Y.; Li, F.; Wang, R.; Zhou, D. Effects of land use and cover change on terrestrial carbon stocks in urbanized areas: A study from Changzhou, China. J. Clean. Prod. 2015, 103, 651–657. [Google Scholar] [CrossRef]
  41. He, B.; Ding, J.; Huang, W.; Ma, X. Spatiotemporal Variation and Future Predictions of Soil Salinization in the Werigan–Kuqa River Delta Oasis of China. Sustainability 2023, 15, 13996. [Google Scholar] [CrossRef]
  42. Du, J.; Yu, D. Impacts of climate change and human activities on net primary productivity of grassland in agro-pastoral transitional zone in northern China. J. Beijing Norm. Univ. 2018, 54, 365–372. [Google Scholar]
  43. Khoshravesh, M.; Sefidkouhi, M.A.G.; Valipour, M. Estimation of reference evapotranspiration using multivariate fractional polynomial, Bayesian regression, and robust regression models in three arid environments. Appl. Surf. Sci. 2017, 7, 1911–1922. [Google Scholar] [CrossRef]
  44. Qin, J.X.; Hao, X.M.; Zhang, Y.; Hua, D. Effects of climate change and human activities on vegetation productivity in arid areas. Arid Land Geogr. 2020, 43, 117–125. [Google Scholar]
  45. Wu, Z. Study on Site Factors’ Auto-computation in Forest Resources Planning and Design Investigation. J. Cent. South Univ. 2007, 26, 51–53. [Google Scholar]
  46. Han, G.F.; Ye, L.; Sun, Z.W. Influence of aspect on land surface temperature in mountainous city: A case study in central area of Chongqing City. Sheng Tai Xue Bao 2014, 34, 4017–4024. [Google Scholar]
  47. Chen, M.; Chen, Y.; Guo, G.; Ai, B. Ecological property assessment in the rapidly urbanized region based on Rs: A case study of Dongguan. J. Nat. Resour. 2012, 27, 601–613. (In Chinese) [Google Scholar]
  48. Chen, J.; Fan, W.; Li, D.; Liu, X.; Song, M. Driving factors of global carbon footprint pressure: Based on vegetation carbon sequestration. Appl. Energy 2020, 267, 114914. [Google Scholar] [CrossRef]
  49. Ni, J. Net primary productivity in forests of China: Scaling-up of national inventory data and comparison with model predictions. For. Ecol. Manag. 2003, 176, 485–495. [Google Scholar] [CrossRef]
  50. Wen, Y.; Sun, Q.; Yan, Y.; Xiao, M.; Song, W.; Yang, J. Impacts of the terrestrial ecosystem changes on the carbon fixation and oxygen release services in the Guangdong-Hong Kong-Macao Greater Bay Area. Acta Ecol. Sin. 2020, 40, 8482–8493. (In Chinese) [Google Scholar]
  51. Tobler, W.R. A computer movie simulating urban growth in the Detroit region. Econ. Geogr. 1970, 46 (Suppl. 1), 234–240. [Google Scholar] [CrossRef]
  52. Liu, J.; Zhang, Z.; Zhuang, D.; Wang, Y.; Zhou, W.; Zhang, S.; Li, R.; Jiang, N.; Wu, S. A study on the spatial-temporal dynamic changes of land-use and driving forces analyses of China in the 1990s. Geogr. Res. 2003, 22, 1–12. (In Chinese) [Google Scholar]
  53. Fisher, R.A.; Yates, F. Statistical Methods, Experimental Design, and Scientific Inference: A Re-Issue of Statistical Methods for Research Workers, the Design of Experiments and Statistical Methods and Scientific Inference; Oxford University Press: Oxford, UK, 1990. [Google Scholar]
  54. Li, X.; Wang, D.; Lu, S. Study of Fingerprint Spectra of Tobacco Flavor with Pearsonion Correlation Coefficient and the UPLC. Fine Chem. 2008, 25, 475. (In Chinese) [Google Scholar]
  55. Wang, J.; Xu, C. Geodetector: Principle and prospective. Acta Geogr. Sin. 2017, 72, 116–134. [Google Scholar]
  56. Wang, J.; Zhao, J.; Zhou, P.; Li, K.; Cao, Z.; Zhang, H.; Han, Y.; Luo, Y.; Yuan, X. Study on the Spatial and Temporal Evolution of NDVI and Its Driving Mechanism Based on Geodetector and Hurst Indexes: A Case Study of the Tibet Autonomous Region. Sustainability 2023, 15, 5981. [Google Scholar] [CrossRef]
  57. Drexler, S.; Gensior, A.; Don, A. Carbon sequestration in hedgerow biomass and soil in the temperate climate zone. Reg. Environ. Chang. 2021, 21, 74. [Google Scholar] [CrossRef]
  58. Mansur, S.; Hai, Y.; Parhat, A. Agricultural Exploitation of the Delta Oasis of Weigan-Kuqa River during Recent 5 Decades and Analyses of its Ecological Problems. J. Desert Res. 2004, 24, 349–354. [Google Scholar]
  59. Gemitzi, A.; Albarakat, R.; Kratouna, F.; Lakshmi, V. Land cover and vegetation carbon stock changes in Greece: A 29-year assessment based on CORINE and Landsat land cover data. Sci. Total Environ. 2021, 786, 147408. [Google Scholar] [CrossRef]
  60. Zhang, Z.; He, G.; Wang, Z.; Liu, S.; Gou, Y.; Liu, Y. Numerical and experimental studies on cloaked arrays of truncated cylinders under different wave directions. Ocean Eng. 2019, 183, 305–317. [Google Scholar] [CrossRef]
  61. Liu, Z. Study on Measures of Cultivated Land Protection and Food Security under the Background of Carbon Peaking and Carbon Neutrality Goals. J. Anhui Agric. Sci. 2023, 51, 261–263. (In Chinese) [Google Scholar]
  62. Xiong, F.; Zhao, X.; Guo, Z.; Zhu, S. Research on the effects of rural land consolidation on agricultural carbon emissions: A quasi-natural experiment based on the high-standard farmland construction policy. Chin. J. Eco-Agric. 2023, 31, 2022–2032. (In Chinese) [Google Scholar]
  63. Lv, N.; Bai, J.; Chang, C.; Li, J.; Luo, G.; Wu, S.; Ding, J. Spatial-temporal changes in evapotranspiration based on planting patterns of major crops in the Xinjiang oasis during 1960–2010. Geogr. Res. 2017, 36, 1443–1454. [Google Scholar]
  64. Muyasser, R.; Wang, X. Spatial Variation Characteristics of Soil Water and Salt in Cultivated Layer in the Delta Oasis of the Weigan-Kuga Rivers. J. Northwest For. Coll. 2021, 36, 39–46. (In Chinese) [Google Scholar]
  65. Zhu, A.; Yao, J.; Lv, T. Effectiveness, dilemma and optimization path of farmland shelterbelt management in Junggar Basin: A case study of Hutubi Count. Trib. Soc. Sci. Xinjiang 2022, 6, 73–78. (In Chinese) [Google Scholar]
  66. Unkovich, M.; Baldock, J.; Farquharson, R. Field measurements of bare soil evaporation and crop transpiration, and transpiration efficiency, for rainfed grain crops in Australia—A review. Agric. Water Manag. 2018, 205, 72–80. [Google Scholar] [CrossRef]
  67. Zhang, X.; Chen, Y.; Zhang, Q.; Xia, Z.; Hao, H.; Xia, Q. Potential evapotranspiration determines changes in the carbon sequestration capacity of forest and grass ecosystems in Xinjiang, Northwest China. Glob. Ecol. Conserv. 2023, 48, e02737. [Google Scholar] [CrossRef]
  68. Yuan, R.; Huang, X.; Hao, L. Spatio–Temporal Variation of Vapor Pressure Deficit and Impact Factors in China in the Past 40 Years. Clim. Environ. Res. 2021, 26, 413–424. [Google Scholar]
  69. Liu, Y.; Yuan, X.; Li, J.; Qian, K.; Yan, W.; Yang, X.; Ma, X. Trade-offs and synergistic relationships of ecosystem services under land use change in Xinjiang from 1990 to 2020: A Bayesian network analysis. Sci. Total Environ. 2023, 858, 160015. (In Chinese) [Google Scholar] [CrossRef] [PubMed]
  70. Field, C.B.; Randerson, J.T.; Malmström, C.M. Global net primary production: Combining ecology and remote sensing. Remote Sens. Environ. 1995, 51, 74–88. [Google Scholar] [CrossRef]
  71. Imhoff, M.L.; Bounoua, L.; DeFries, R.; Lawrence, W.T.; Stutzer, D.; Tucker, C.J.; Ricketts, T. The consequences of urban land transformation on net primary productivity in the United States. Remote Sens. Environ. 2004, 89, 434–443. [Google Scholar] [CrossRef]
  72. Pan, J.; Wen, Y. Estimation and spatial-temporal characteristics of carbon sink in the arid region of northwest China. Acta Ecol. Sin. 2015, 35, 7718–7728. [Google Scholar]
  73. Piao, S.; He, R.; Wang, X.; Chen, F. Estimation of China’s terrestrial ecosystem carbon sink: Methods, progress and prospects. Sci. China Earth Sci. 2022, 65, 641–651. [Google Scholar] [CrossRef]
  74. Xin, X.; Li, A.; Jin, H. The simulation models of the forest carbon cycle on a large scale: A review. Acta Ecol. Sin. 2018, 38, 41–54. (In Chinese) [Google Scholar]
Figure 1. Map of the study area.
Forests 15 00262 g001
Figure 2. The expansion characteristics of cultivated land. (a) Cultivated land in 1990. (b) Cultivated land in 2020. (c) The clustered center of cultivated land in 1990. (d) The clustered center of cultivated land in 2020. (e) The spatial expansion intensity of cultivated land from 1990 to 2020. (f) Growth of cultivated land space from 1990 to 2020.
Forests 15 00262 g002
Figure 3. The main types of cultivated land expansion from 1999 to 2000.
Forests 15 00262 g003
Figure 4. Changes in the amount of fixed carbon from 1999 to 2010.
Forests 15 00262 g004
Figure 5. The q-values for interaction detection of influence factors in (a) the year 1990; (b) the year 2000; (c) the year 2010; and (d) the year 2020.
Forests 15 00262 g005
Table 1. Grading standards for the carbon fixation capacity of vegetation and various driving factors.
LevelX1X2 (°)X3 (°)X4 (mm)X5 (°C)X6X7 (mm)X8
(Person km2)
X9Y
1926–9690–5Flat (−1)≤62≤104≤0.1≤9530–29.0Arable land0–35.82
2970–10506–15North (0–22.5, 337.5–360)63–74105–1120.1–0.3953–100629.1–226.0Forest35.82–100.69
31050–117716–25Northeast (22.5–67.5)75–87113–1180.3–0.51006–1052226.1–572.0Grassland100.69–182.99
41178–132726–35East (67.5–112.5)88–99119–1200.5–0.71053–1093572.1–1246.0Water land182.99–272.06
51328–153036–45Southeast (112.5–157.5)99–112121–123≥0.71094–11341246.1–3305.0Building land272.06–338.87
61531–2023≥46South (157.5–202.5)≥113≥124 ≥1135≥3305.1Unused land
7 Southwest (202.5–247.5)
8 West (247.5–292.5)
9 Northwest (292.5–337.5)
Note: X1: DEM, X2: slope, X3: aspect, X4: average annual precipitation, X5: average annual air temperature, X6: NDVI, X7: potential evapotranspiration, X8: population density, X9: land-use type, Y: carbon fixation capacity of vegetation.
Table 2. Critical Z scores and p values.
Gi Z ScoreGi p ValueConfidence CoefficientGi Bin
Z < −1.65 or Z > +1.65p < 0.1090%−1–1
Z < −1.96 or Z > +1.96p < 0.0595% −2–2
Z < −2.58 or Z > +2.58p < 0.0199%−3–3
Table 3. Interaction analysis for the carbon fixation capacity of vegetation with different factors.
Judgment BasisInteraction
q(X1∩X2) < min(q(X1), q(X2))Non-linear weakening
min(q(X1), q(X2) < q(X1∩X2) < max(q(X1), q(X2))Single-factor nonlinear attenuation
q(X1∩X2) > max(q(X1), q(X2))Two-factor enhancement
q(X1∩X2) = q(X1) + q(X2)Mutual independence
q(X1∩X2) > q(X1) + q(X2)Non-linear enhancement
Table 4. Factor analysis.
Stability FactorDEMX1
SlopeX2
AspectX3
Change factorAverage annual precipitationX4
Average annual air temperatureX5
NDVIX6
Potential evapotranspirationX7
Population densityX8
Land-use typeX9
Table 5. Pearson analysis of cultivated land characteristics and the carbon fixation capacity of vegetation from 1990 to 2020.
19902000201020201990–20002000–20102010–20201990–2020
Proportion of cultivated land−0.062−0.358 **−0.408 **−0.635 **\\\\
Spatial agglomeration−0.053−0.457 **−0.474 **−0.513 **\\\\
Spatial expansion intensity\\\\−0.0590.0540.348 **0.211 **
Spatial growth\\\\−0.062 **0.013 **0.050 **0.020 **
Note: ** significant at the 0.01 level in (bilateral) tests.
Table 6. Changes in the carbon fixation values of the vegetation contents in different cultivated land expansion types in the Weiku Oasis from 1999 to 2010 (g·m−2·a−1).
199920002001200220032004200520062007200820092010
Grassland–Cultivated land170.4787.9481.2480.7795.2399.1598.0696.02101.56114.22104.91104.89
Water area–Cultivated land50.0930.98 28.3029.7230.1233.6032.3531.6135.5434.9135.7735.25
Unutilized land–Cultivated land167.4063.9161.2262.2074.2377.1376.6372.9972.9682.0677.1078.07
Table 7. Factor detection results from 1990 to 2020.
Factors1990200020102020
qpqsortqpqsortqpqsortqpqsort
X10.045050.045070.023070.00707
X20.0008090.001090.001090.00109
X30.00170.00680.003080.004080.00208
X40.134030.273030.209050.27604
X50.154020.144050.217040.11606
X60.044060.2040.618010.48302
X70.265010.514010.494020.49201
X80.007070.092060.147060.26705
X90.093040.373020.426030.41803
Disclaimer/Publisher’s Note: The statements, opinions and data contained in all publications are solely those of the individual author(s) and contributor(s) and not of MDPI and/or the editor(s). MDPI and/or the editor(s) disclaim responsibility for any injury to people or property resulting from any ideas, methods, instructions or products referred to in the content.

