Article

Individual Tree Species Identification for Complex Coniferous and Broad-Leaved Mixed Forests Based on Deep Learning Combined with UAV LiDAR Data and RGB Images

1
College of Mechanical and Electrical Engineering, Northeast Forestry University, Harbin 150040, China
2
School of Civil Engineering and Transportation, Northeast Forestry University, Harbin 150040, China
*
Author to whom correspondence should be addressed.
These authors contributed equally to this work.
Forests 2024, 15(2), 293; https://doi.org/10.3390/f15020293
Submission received: 1 January 2024 / Revised: 24 January 2024 / Accepted: 30 January 2024 / Published: 3 February 2024
(This article belongs to the Special Issue Panoptic Segmentation of Tree Scenes from Mobile LiDAR Data)

Abstract

:
Automatic and accurate individual tree species identification is essential for the realization of smart forestry. Although existing studies have used unmanned aerial vehicle (UAV) remote sensing data for individual tree species identification, the effects of different spatial resolutions and combining multi-source remote sensing data for automatic individual tree species identification using deep learning methods still require further exploration, especially in complex forest conditions. Therefore, this study proposed an improved YOLOv8 model for individual tree species identification using multisource remote sensing data under complex forest stand conditions. Firstly, the RGB and LiDAR data of natural coniferous and broad-leaved mixed forests under complex conditions in Northeast China were acquired via a UAV. Then, different spatial resolutions, scales, and band combinations of multisource remote sensing data were explored, based on the YOLOv8 model for tree species identification. Subsequently, the Attention Multi-level Fusion (AMF) Gather-and-Distribute (GD) YOLOv8 model was proposed, according to the characteristics of the multisource remote sensing forest data, in which the two branches of the AMF Net backbone were able to extract and fuse features from multisource remote sensing data sources separately. Meanwhile, the GD mechanism was introduced into the neck of the model, in order to fully utilize the extracted features of the main trunk and complete the identification of eight individual tree species in the study area. The results showed that the YOLOv8x model based on RGB images combined with current mainstream object detection algorithms achieved the highest mAP of 75.3%. When the spatial resolution was within 8 cm, the accuracy of individual tree species identification exhibited only a slight variation. However, the accuracy decreased significantly with the decrease of spatial resolution when the resolution was greater than 15 cm. The identification results of different YOLOv8 scales showed that x, l, and m scales could exhibit higher accuracy compared with other scales. The DGB and PCA-D band combinations were superior to other band combinations for individual tree identification, with mAP of 75.5% and 76.2%, respectively. The proposed AMF GD YOLOv8 model had a more significant improvement in tree species identification accuracy than a single remote sensing sources and band combinations data, with a mAP of 81.0%. The study results clarified the impact of spatial resolution on individual tree species identification and demonstrated the excellent performance of the proposed AMF GD YOLOv8 model in individual tree species identification, which provides a new solution and technical reference for forestry resource investigation combined multisource remote sensing data.

1. Introduction

Tree species information plays a crucial role in the dynamic monitoring of forest resources, biodiversity assessment, and estimation of forest biomass and carbon storage. How to quickly and accurately obtain forest tree species information and assess their spatial distribution has become a hot issue that urgently needs to be solved [1]. Traditional tree species information acquisition requires manual field investigation, which is costly and time-consuming. The identification of forest tree species with the help of remote sensing technology has been carried out for nearly forty years. Initially, less efficient methods such as visual interpretation were used to identify individual tree species, which was similar to fieldwork and labor sensitive [2]. With advancements in computer and sensor technologies, machine learning, and deep learning methods, multi-source remote sensing technologies have increasingly been utilized to enhance the automation and accuracy of individual tree information acquisition [3].
Accurate identification of individual tree species based on remote sensing technology requires ultra-high spatial resolution. Unmanned aerial vehicles (UAVs) have the advantages of cost-effectiveness, high flexibility, and adaptability across various terrains. To date, ultra-high spatial resolution remote sensing data from UAVs has been extensively used for small to medium-scale forest resource monitoring [4,5]. UAVs can carry different sensors depending on their carrying capacity. Most sensors fit into one of two categories based on their data acquisition principles. The first category is passive remote sensing data, including RGB images, multispectral images, and hyperspectral images. Passive remote sensing technologies can obtain the spectral and textural information of the measured objects, which is of great help to the identification of tree species [6]. Multispectral and hyperspectral sensors in particular can provide more abundant spectral information about the targets and offer more powerful classification capabilities [7]. However, this comes at a higher cost. In addition, hyperspectral images are composed of dozens to hundreds of bands, leading to substantial data redundancy [8]. Hyperspectral images are also more susceptible to noise and changes in external lighting during data collection, thus requiring a more stringently defined external environment. Under the equivalent flight conditions, RGB images can obtain higher spatial resolution and quality at a lower cost, which makes RGB data more widely used in practice [9]. The second category is active remote sensing data, specifically Light Detection and Ranging (LiDAR) [10]. LiDAR technology can obtain the three-dimensional information of the target objects and can effectively perform individual tree segmentation and tree structure parameters extraction in the face of undulating tree crowns and terrain morphology. However, it generally lacks spectral information and has only a limited ability to identify tree species [11,12].
Due to the obvious advantages and disadvantages of RGB images and LiDAR data, some researchers have attempted to combine these two types of data for tree species identification [13,14,15,16]. In previous studies on the identification of individual tree species combining the two types of data, there are basically two steps: individual tree segmentation and tree species identification [17,18]. The individual tree segmentation is either based on image data or based on point cloud data [11,19]. The commonly used individual tree segmentation methods for the ultra-high spatial resolution RGB images or Canopy Height Models (CHM) images generated from LiDAR data include image binarization, local maximum filtering, watershed segmentation, region growing, and so on [20]. The direct point cloud-oriented method mainly achieves individual tree segmentation through clustering methods, such as k-means, mean-shift, adaptive distance, and others [21,22]. Subsequently, the spectral features, texture features, point cloud spatial features, and point cloud echo features are extracted from RGB images and LiDAR data, respectively, and then machine learning algorithms are implemented for individual tree species identification [2]. Among different machine learning algorithms, support vector machines and random forest algorithms are widely used [23,24]. Although individual tree species identification can be achieved based on RGB images and LiDAR data, the process is relatively complex, and the accuracy of tree species identification is limited by the segmentation effect of individual trees. In addition, the machine learning algorithms need to further analyze and extract data features and debug to seek the optimum parameters [25], resulting in time-consuming, laborious, and poor generalization when extended to different forest types.
Deep learning, as a branch of machine learning, has made tremendous progress in recent years, benefiting from the development of high-performance computing platforms [26]. As an end-to-end model, it does not require the tedious feature analysis and extraction other machine learning algorithms do, which greatly improves the level of automation. Deep learning can be divided into three types of tasks in the field of images, including semantic segmentation, instance segmentation, and object detection. Among them, instance segmentation and object detection can directly achieve the goal of identifying individual tree species [25]. Instance segmentation is able to offer a more accurate delineation of the canopy delineations under simple stand conditions. For example, Hao et al. [27] and Li et al. [6] utilized Mask R-CNN for individual tree detection in plantation. However, in complex forest environments, significant overlap and occlusion between tree crowns posed challenges to accurately and completely outlining individual tree crowns. Furthermore, the production of the dataset required manual delineation of the tree crown contour, making it extremely difficult to produce the dataset [6]. In contrary, object detection can determine individual tree crown positions and boundaries by identifying rectangular candidate boxes, significantly reducing the cost of dataset creation. Object detection is generally classified into one-stage and two-stage methods. Faster R-CNN, as a representative of a two-stage network, was introduced in 2015 [28], and its own and improved networks have been widely used in a variety of fields. For example, Luo et al. [29] and Xia et al. [30] successfully implemented individual tree detection using Faster R-CNN in sparse plantations and on ginkgo trees growing in urban environments, respectively. However, some studies have pointed out that Faster R-CNN has lower detection accuracy in high canopy density forests [31,32]. In recent years, one-stage networks have made significant advancements [33], mainly including You Only Look Once (YOLO) [34], Single Shot MultiBox Detector (SSD) [35], and RetinaNet [36]. RetinaNet was introduced in 2017, and exhibited higher accuracy compared to the two-stage network Faster R-CNN [36]. The YOLO network was initially proposed in 2015, and its regression-based concept can directly generate detection boxes [34,37], which have been rapidly applied in various fields. Chen et al. [38] applied an improved YOLO v4 for individual bayberry tree detection. Wang et al. [39], successfully detected dead trees in protected forests based on the improved LDS-YOLO. Jintasuttisak et al. [40] compared different YOLO models and SSD for individual date palm tree detection, and the results showed that YOLO v5 had the highest accuracy. Puliti et al. [41] utilized YOLO v5 for detecting individual trees damaged by snow accumulation. Dong et al. [42] implemented individual tree crown detection and width extraction in Metasequoia glyptostroboides forests using an improved YOLO v7. Although there have been studies introducing object detection methods into the forestry field, there are few studies on individual tree species identification. The latest version of YOLO v8 [43] was released in March 2023, but there are few research results on YOLO v8, and its model performance needs further exploration.
In summary, current research on individual tree species identification based on RGB images, LiDAR data, or a combination of both from UAVs is mostly based on low canopy density forest stands [44,45,46], and in the tree crown detection task using object detection methods, most studies also do not involve tree species identification [47,48]. There have been no reports on research into individual tree detection and tree species identification in complex coniferous and broad-leaved mixed forests based on the fusion of multi-source remote sensing data from UAV platform and target detection methods. Additionally, there is a negative correlation between UAV flight altitude and data acquisition efficiency. Generally, multi-source remote sensing data is typically acquired through different flight missions. Since the attitude and positioning of UAVs in these missions cannot always be completely consistent, leading to errors, precise data registration has become a significant challenge in the process of multi-source remote sensing fusion [13]. Therefore, further in-depth research is needed to investigate the application effects of different object detection models in complex forest stands, the precise registration between different data sources, and the impact of different data fusion methods and spatial resolutions on the performance of tree species identification models [49].
Based on the current research status, this study proposes an object detection method that can combine LiDAR point cloud and ultra-high spatial resolution RGB image data in natural coniferous broad-leaved mixed forests under complex conditions, achieving highly automated and high-precision identification of individual tree species. The specific objectives of this study are to:
(1) Explore the individual tree species identification ability of a YOLO v8 model in natural mixed coniferous and broad-leaved forests under complex conditions, compare YOLO v8 with current mainstream object detection models (RetinaNet, Faster R-CNN, SSD, YOLOv5), and reveal the impact of different spatial resolution images and YOLOv8 model scales on individual tree species identification results.
(2) Evaluate the effectiveness of the current multi-source remote sensing data band combination method for identifying individual tree species in natural coniferous and broad-leaved mixed forests under complex conditions compared to single data sources.
(3) Propose an improved YOLO v8 model according to the characteristics of the multisource remote sensing forest data to achieve more precise individual tree species identification in natural coniferous and broad-leaved mixed forests under complex conditions.

2. Study Area and Data Acquisition

2.1. Study Area

The study area is situated in the Mao’ershan Experimental Forest Farm (127°30′ to 127°34′ E, 45°20′ to 45°25′ N), Heilongjiang Province, China, with a temperate continental monsoon climate, average annual temperature of 3.1°C, and annual average precipitation of 629 mm. The existing forest types primarily consist of various stages of natural secondary forests [50]. The study area has a high canopy closure and comprises complex natural mixed coniferous and broadleaf forests, including Populus davidiana, Ulmus pumila, Betula platyphylla, Fraxinus mandshurica, Pinus koraiensis, Larix gmelinii, Salix alba, and others. The overview of the study area is shown in Figure 1.

2.2. Data Acquisition

2.2.1. UAV Data Acquisition

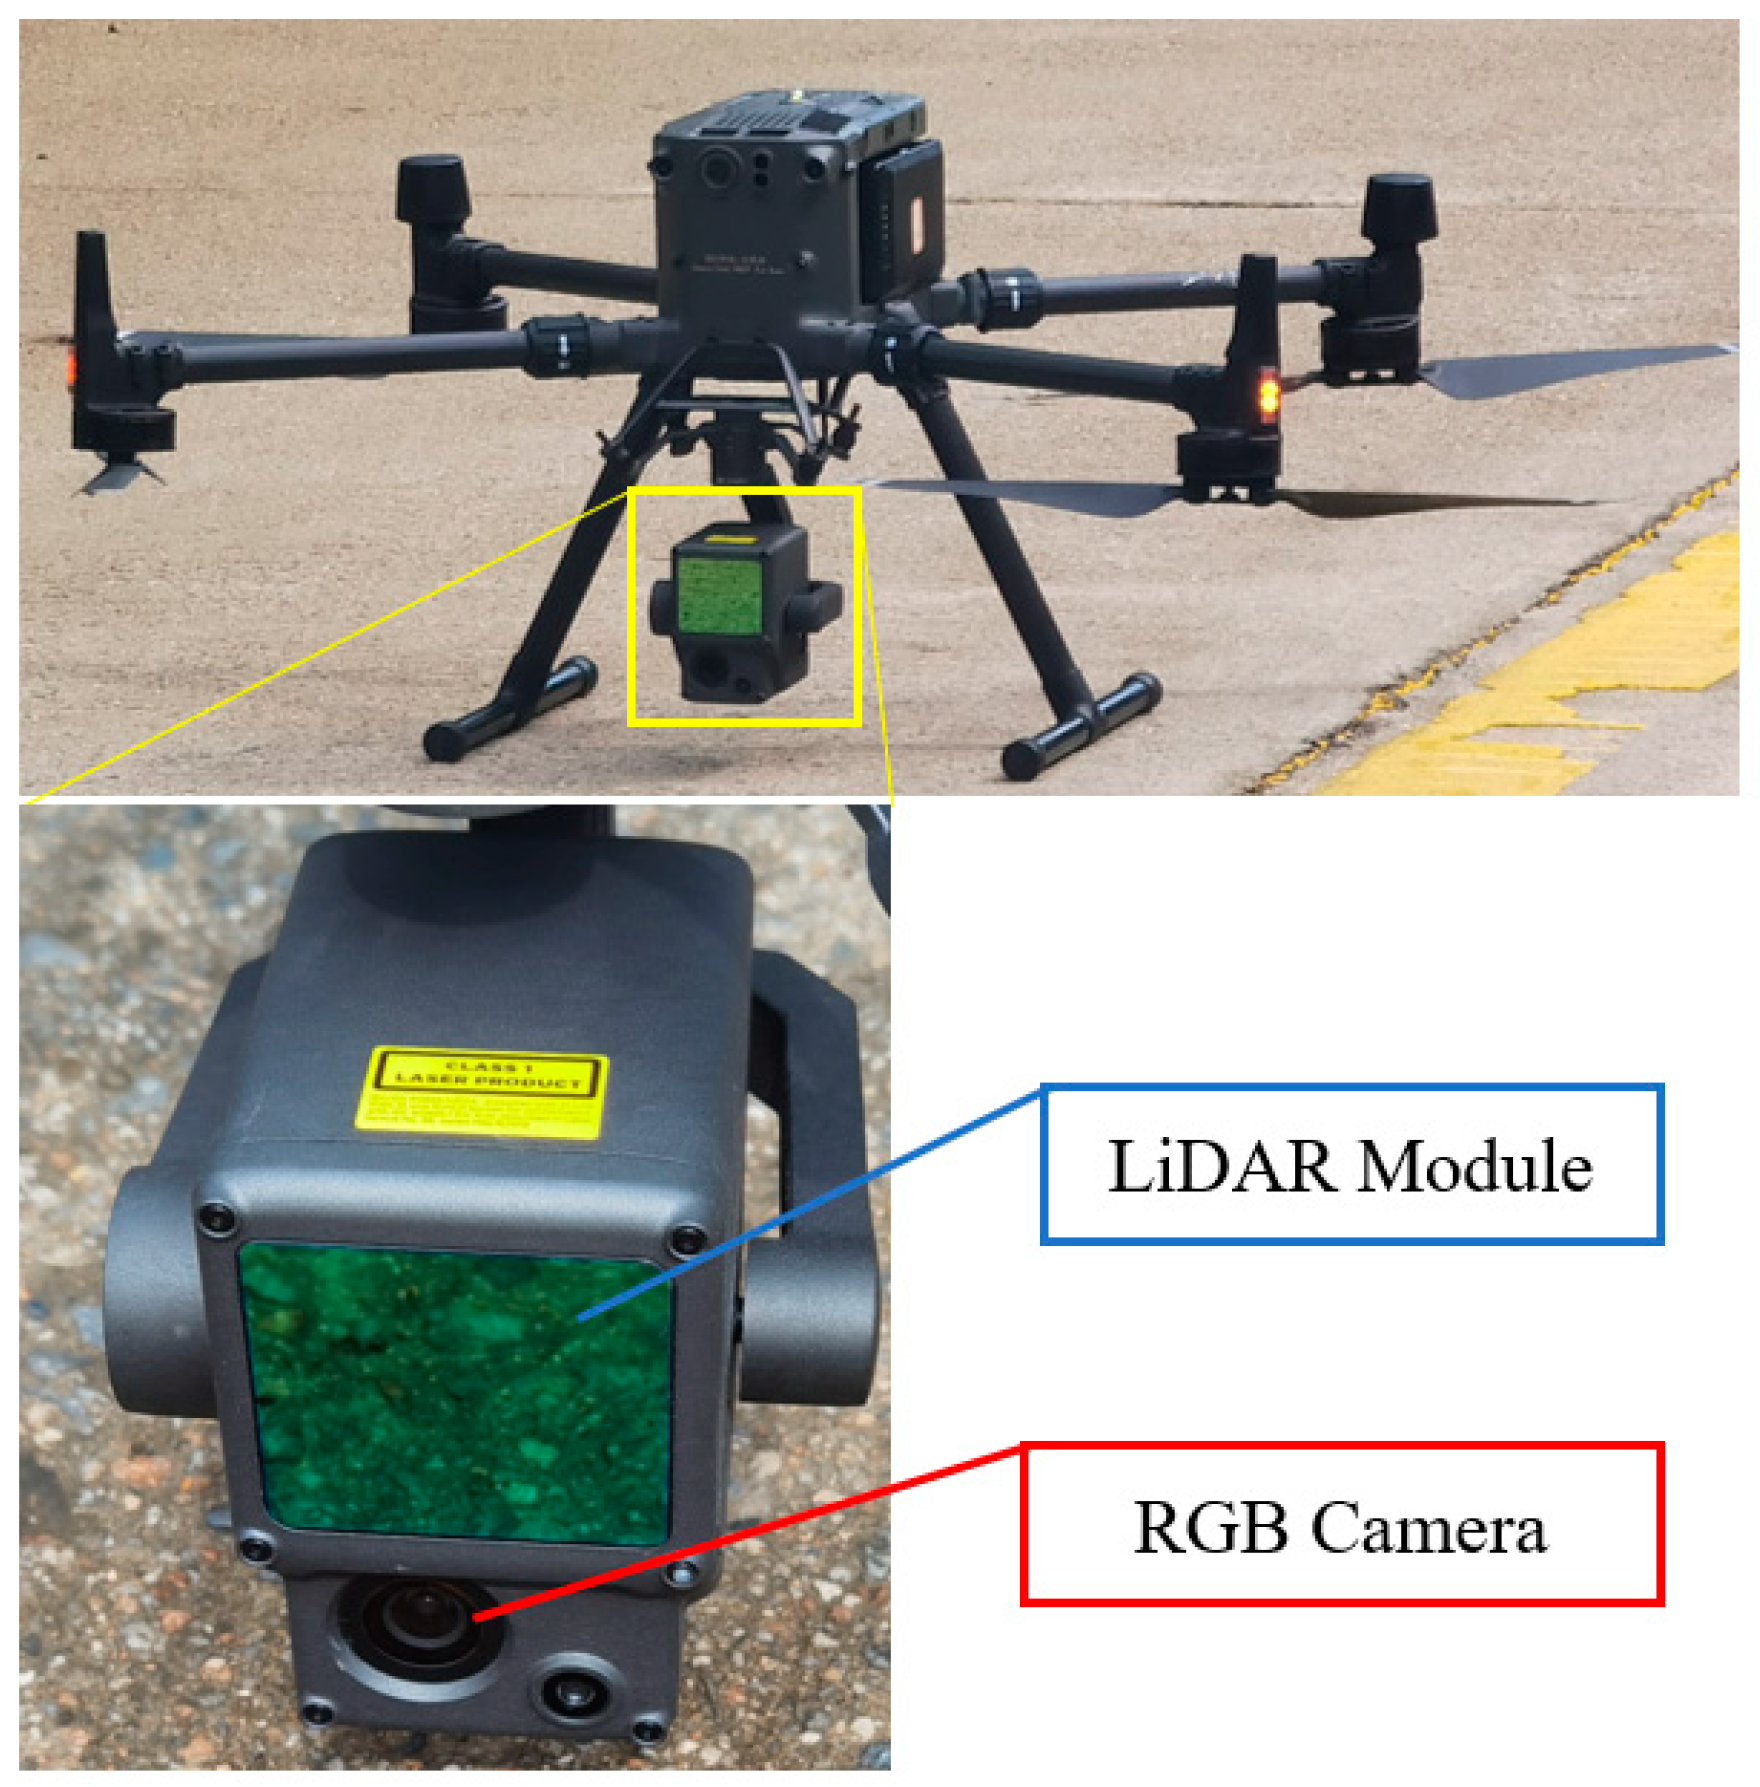
The flight mission was carried out on 22 July 2022, with clear and cloudless weather and wind speeds less than 3.0 m/s. The mission utilized the DJI Matrice 300 RTK UAV, equipped with a Global Navigation Satellite System with Real-Time Kinematic (GNSS RTK) system. The flight parameters were set as follows: flight speed 5.5 m/s, flight altitude 100 m. Data collection was conducted using the Zenmuse L1 payload, which integrates a LiDAR module, an RGB camera, and a high-accuracy IMU. The LiDAR sensor model is Livox, which is a frame-style design with an effective measurement distance of 450 m, three echoes, and a point density of approximately 200 points/m2. The mapping camera used for collecting RGB image data has a 1-inch sensor size, 20 million effective pixels, and a focal length of 8.8 mm/24 mm (equivalent), with an aperture range of f/2.8–f/11. The acquired RGB images and LiDAR data are shown in Figure 1b,c. The UAV system is illustrated in Figure 2. The projected coordinate system used by the UAV is WGS 1984 UTM Zone 52 N.

2.2.2. Plot Survey

In late July 2022, a survey of tree species was conducted within the study area (13 hm2). A total of 16 sample plots (40 m × 40 m) (Figure 1b) were selected based on the principle of covering as many different tree species as possible. There are a total of 4520 trees in the study area, of which 1260 trees in the 16 sample plots (40 m × 40 m) were investigated. The geographic coordinates and tree parameters (species, DBH, height, height under branches, crown width) of the trees in the sample plots were obtained using GNSS RTK (Qianxunxingyao X). The GNSS RTK projection coordinate system also utilized WGS 1984 UTM Zone 52 N. Significant landmarks were recorded using the control point collection feature to facilitate the matching of ground survey data with UAV data.

3. Methods

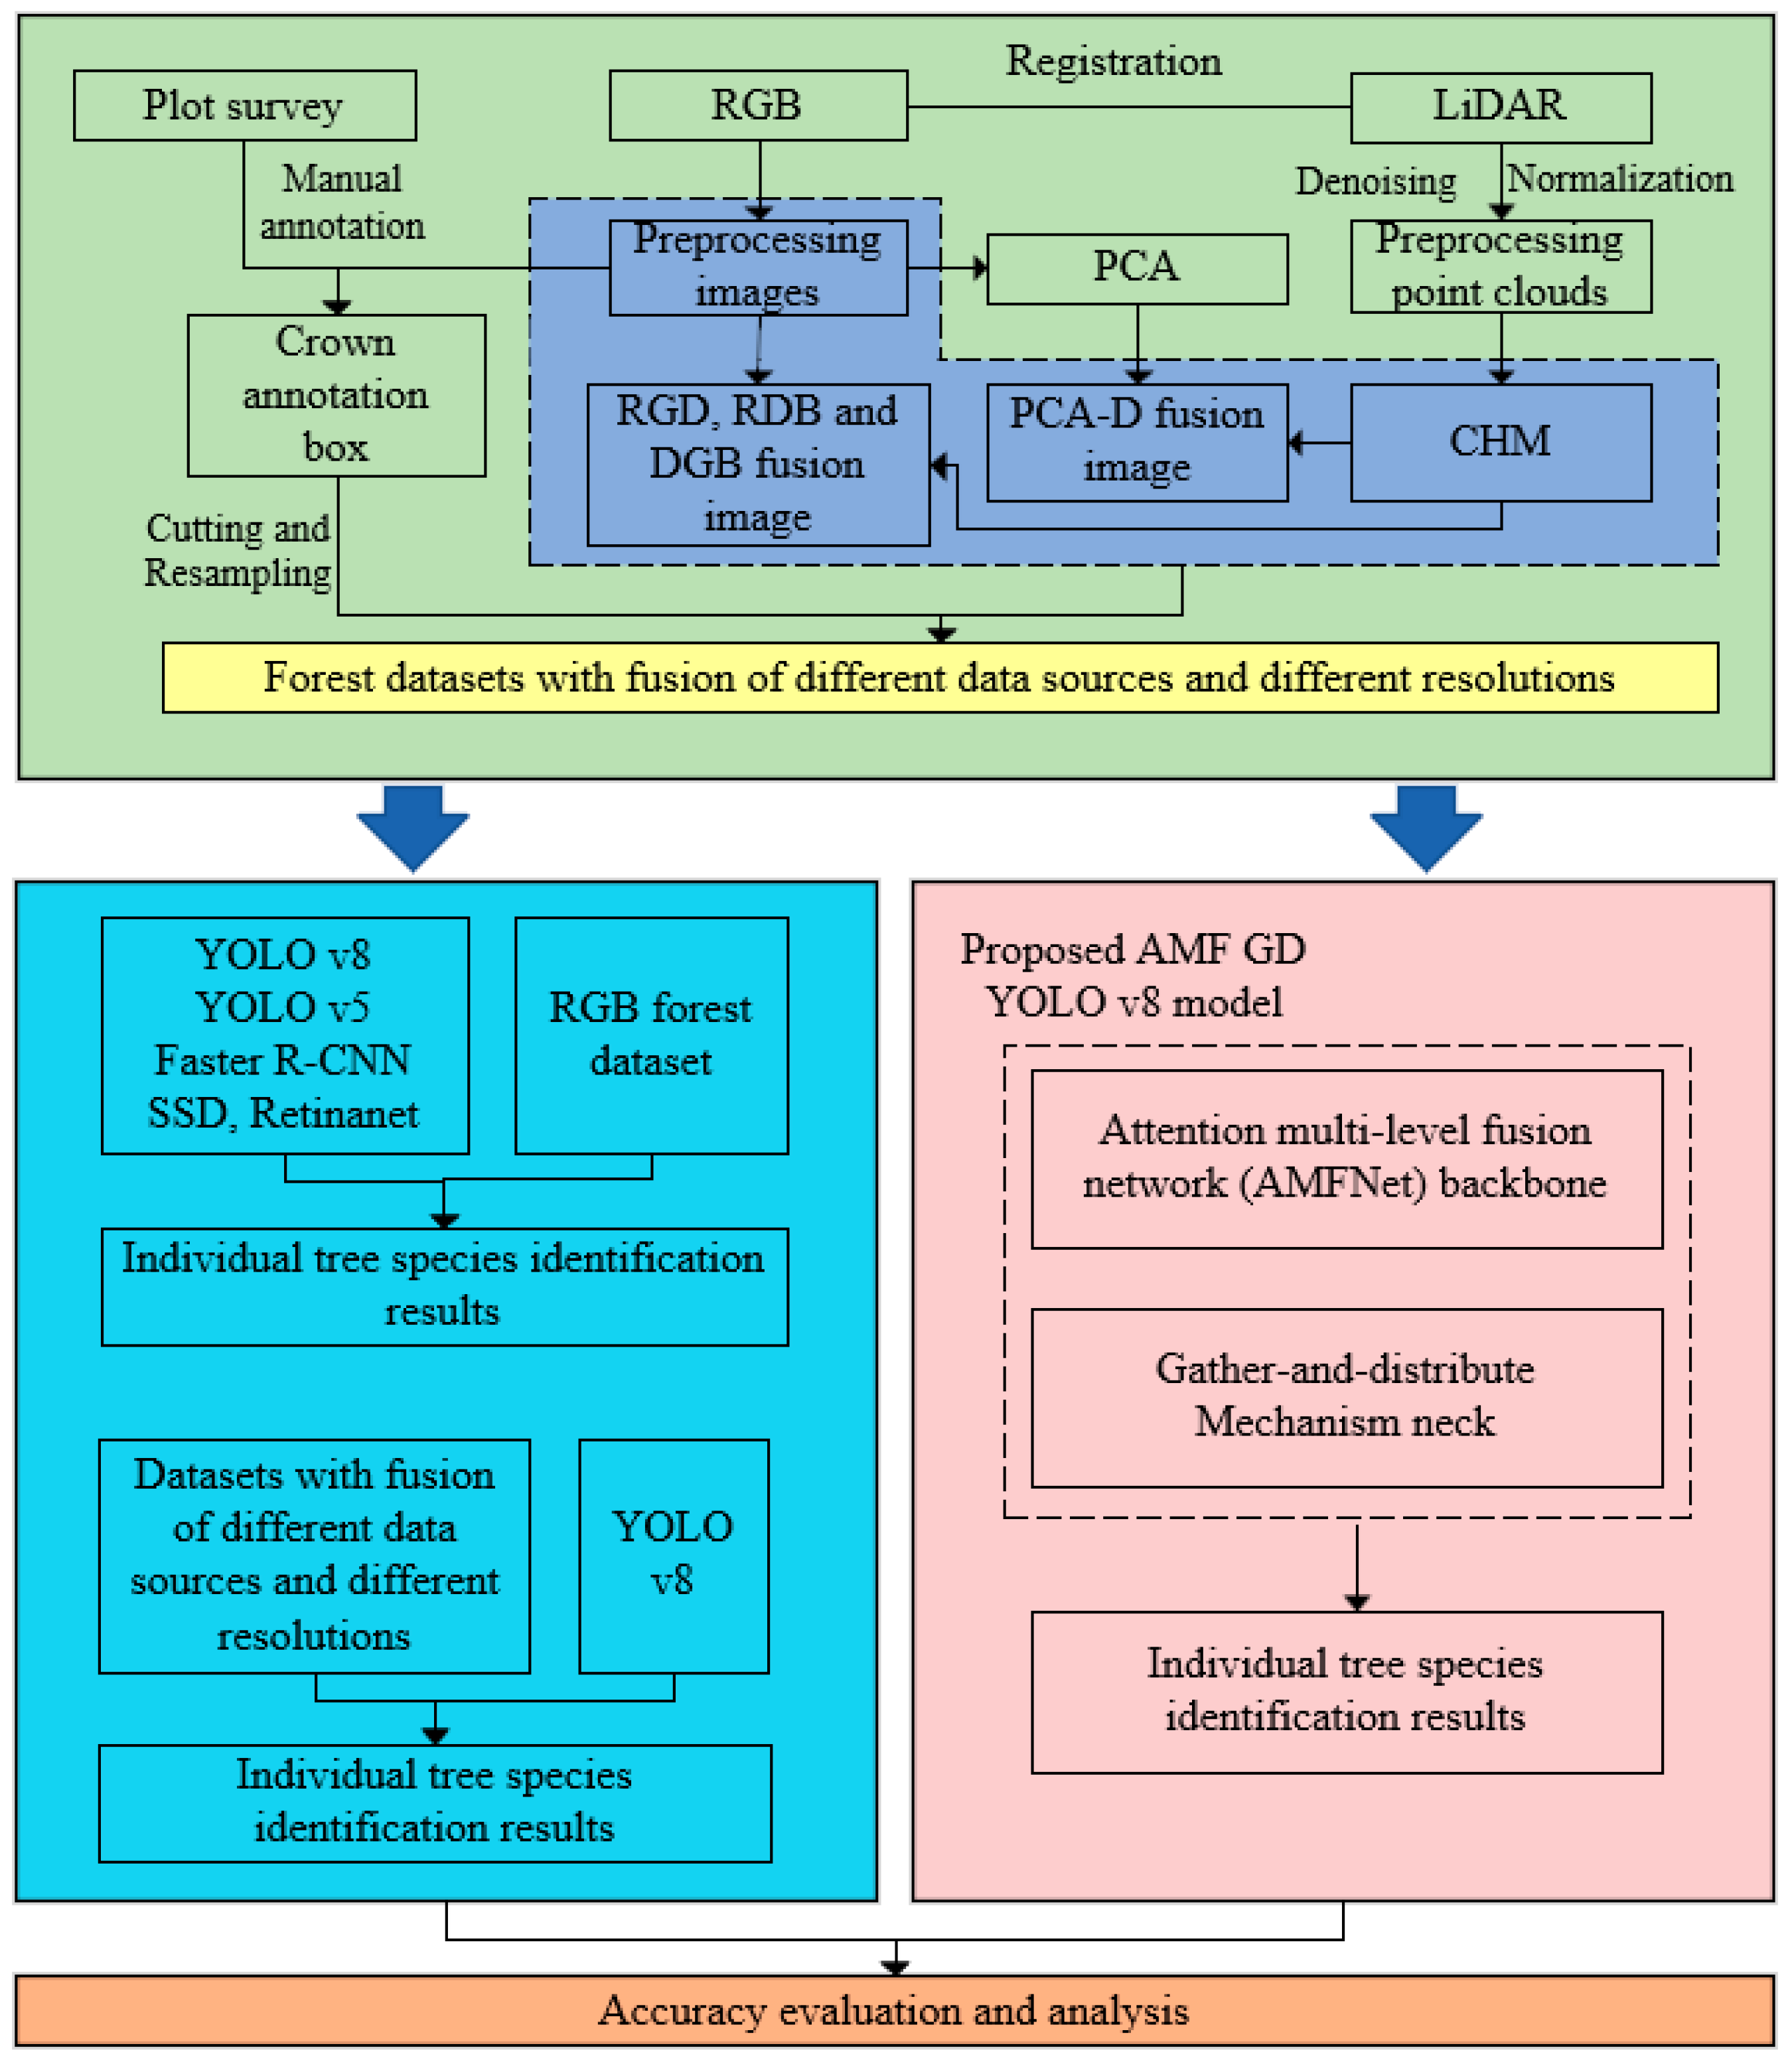
Firstly, a UAV equipped with both visible light and LiDAR sensors was used, enabling the acquisition of both RGB images and LiDAR data of the study area through a single flight mission. CHM images were obtained from preprocessed LiDAR data, and PCA transformation was performed on the RGB data. Various fused images were obtained through band combination and further combined with plot investigation data for data annotation to complete the production of a multi-source remote sensing forest dataset. Subsequently, YOLO v8, RetinaNet, SSD, Faster R-CNN, and YOLO v5 networks were used to identify individual tree species in the RGB dataset. Then, RGB datasets with different spatial resolution and YOLO v8 scales were used to study the identification ability of YOLO v8 in complex forest stands, and the impact of spatial resolution on individual tree species identification was analyzed. Different fusion methods for multi-source remote sensing data were explored for their effects on tree species identification. Finally, based on the characteristics of the multisource remote sensing forest data, the AMF GD YOLO v8 model was proposed. The model uses a structure known as the Attention Multi-level Fusion Network (AMFNet) as its backbone. This backbone allows multisource remote sensing data to be input into two branches for feature extraction and fusion at multiple scales. It replaces the original model’s Path Aggregation Network with Feature Pyramid Networks (PAN-FPN) neck with a gather-and-distribute mechanism, enhancing the model structure. The performance of the improved model was verified through ablation experiments. The overall research workflow is shown in Figure 3.

3.1. Data Preprocessing

The raw data was processed using DJI Terra 3.4 software. The RGB data was registered and stitched by the software. Combined with the UAV flight altitude and RGB camera parameters, the maximum output of 2.7 cm resolution orthophoto can be obtained. To explore the impact of image spatial resolution on tree species identification, the RGB images with 2.7 cm spatial resolution were selected for subsequent analyses. The original point cloud data was filtered and denoised using LiDAR360 4.1.3 software, and then ground points normalization was performed, and the point cloud data of the study area was obtained after cropping. CHM images were generated based on an inverse distance weight interpolation method. In order to facilitate data fusion, the spatial resolution was consistent with that of the RGB images, which was 2.7 cm.

3.2. Dataset Creation and Data Fusion

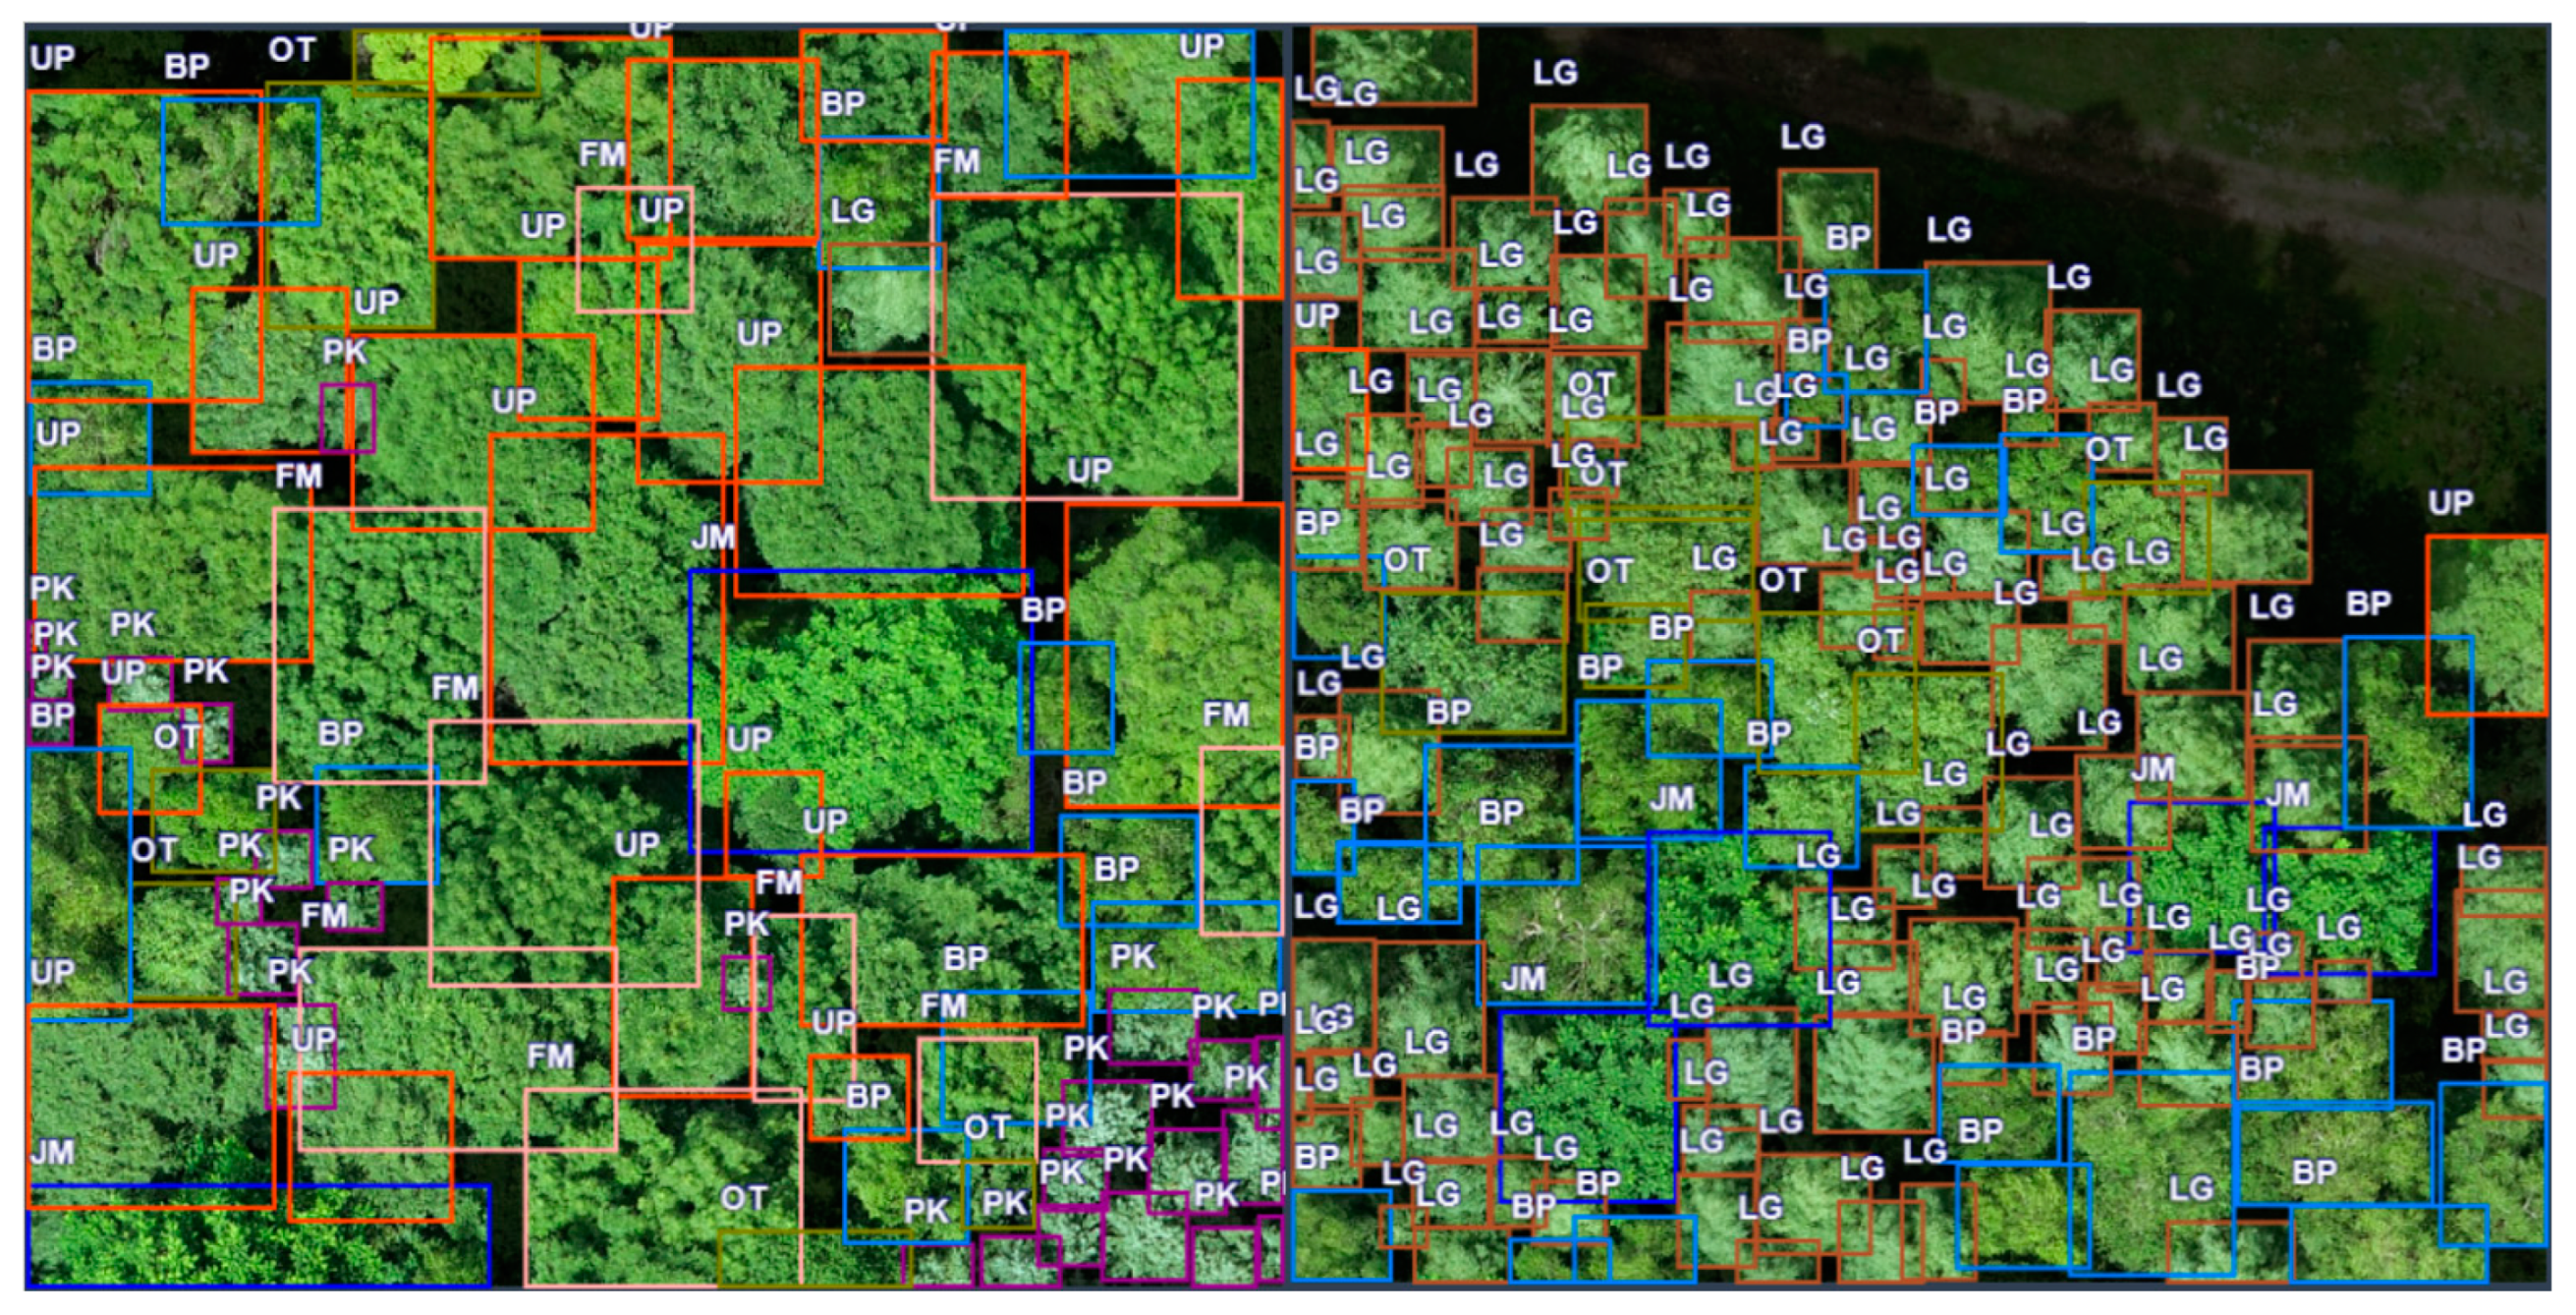
The UAV multi-source remote sensing forest dataset was based on the tree locations and species information obtained from plot investigation. The tree location information (GNSS RTK points) and RGB images were imported into ArcGISPro and combined using the point cloud visualization function of LiDAR360 software. This procedure allows the edge of an individual tree crown to be accurately determined. The RGB images were manually annotated using Labelimg 1.8.6 software to obtain the RGB image dataset. In accordance with general practice, the dataset was divided into training, validation, and test sets with a ratio of 6:2:2. Partial data annotation results were shown in Figure 4.
Figure 4 shows the annotation results for a part of the study area in which all trees were annotated. The trees were divided into 8 categories and 7 main tree species, including Betula platyphylla (BP), Pinus koraiensis (PK), Juglans mandshurica (JM), Larix gmelinii (LG), Fraxinus mandshurica (FM), Picea asperata (PA) and Ulmus pumila (UP). Some of the less abundant tree species were grouped as other tree species (OT).
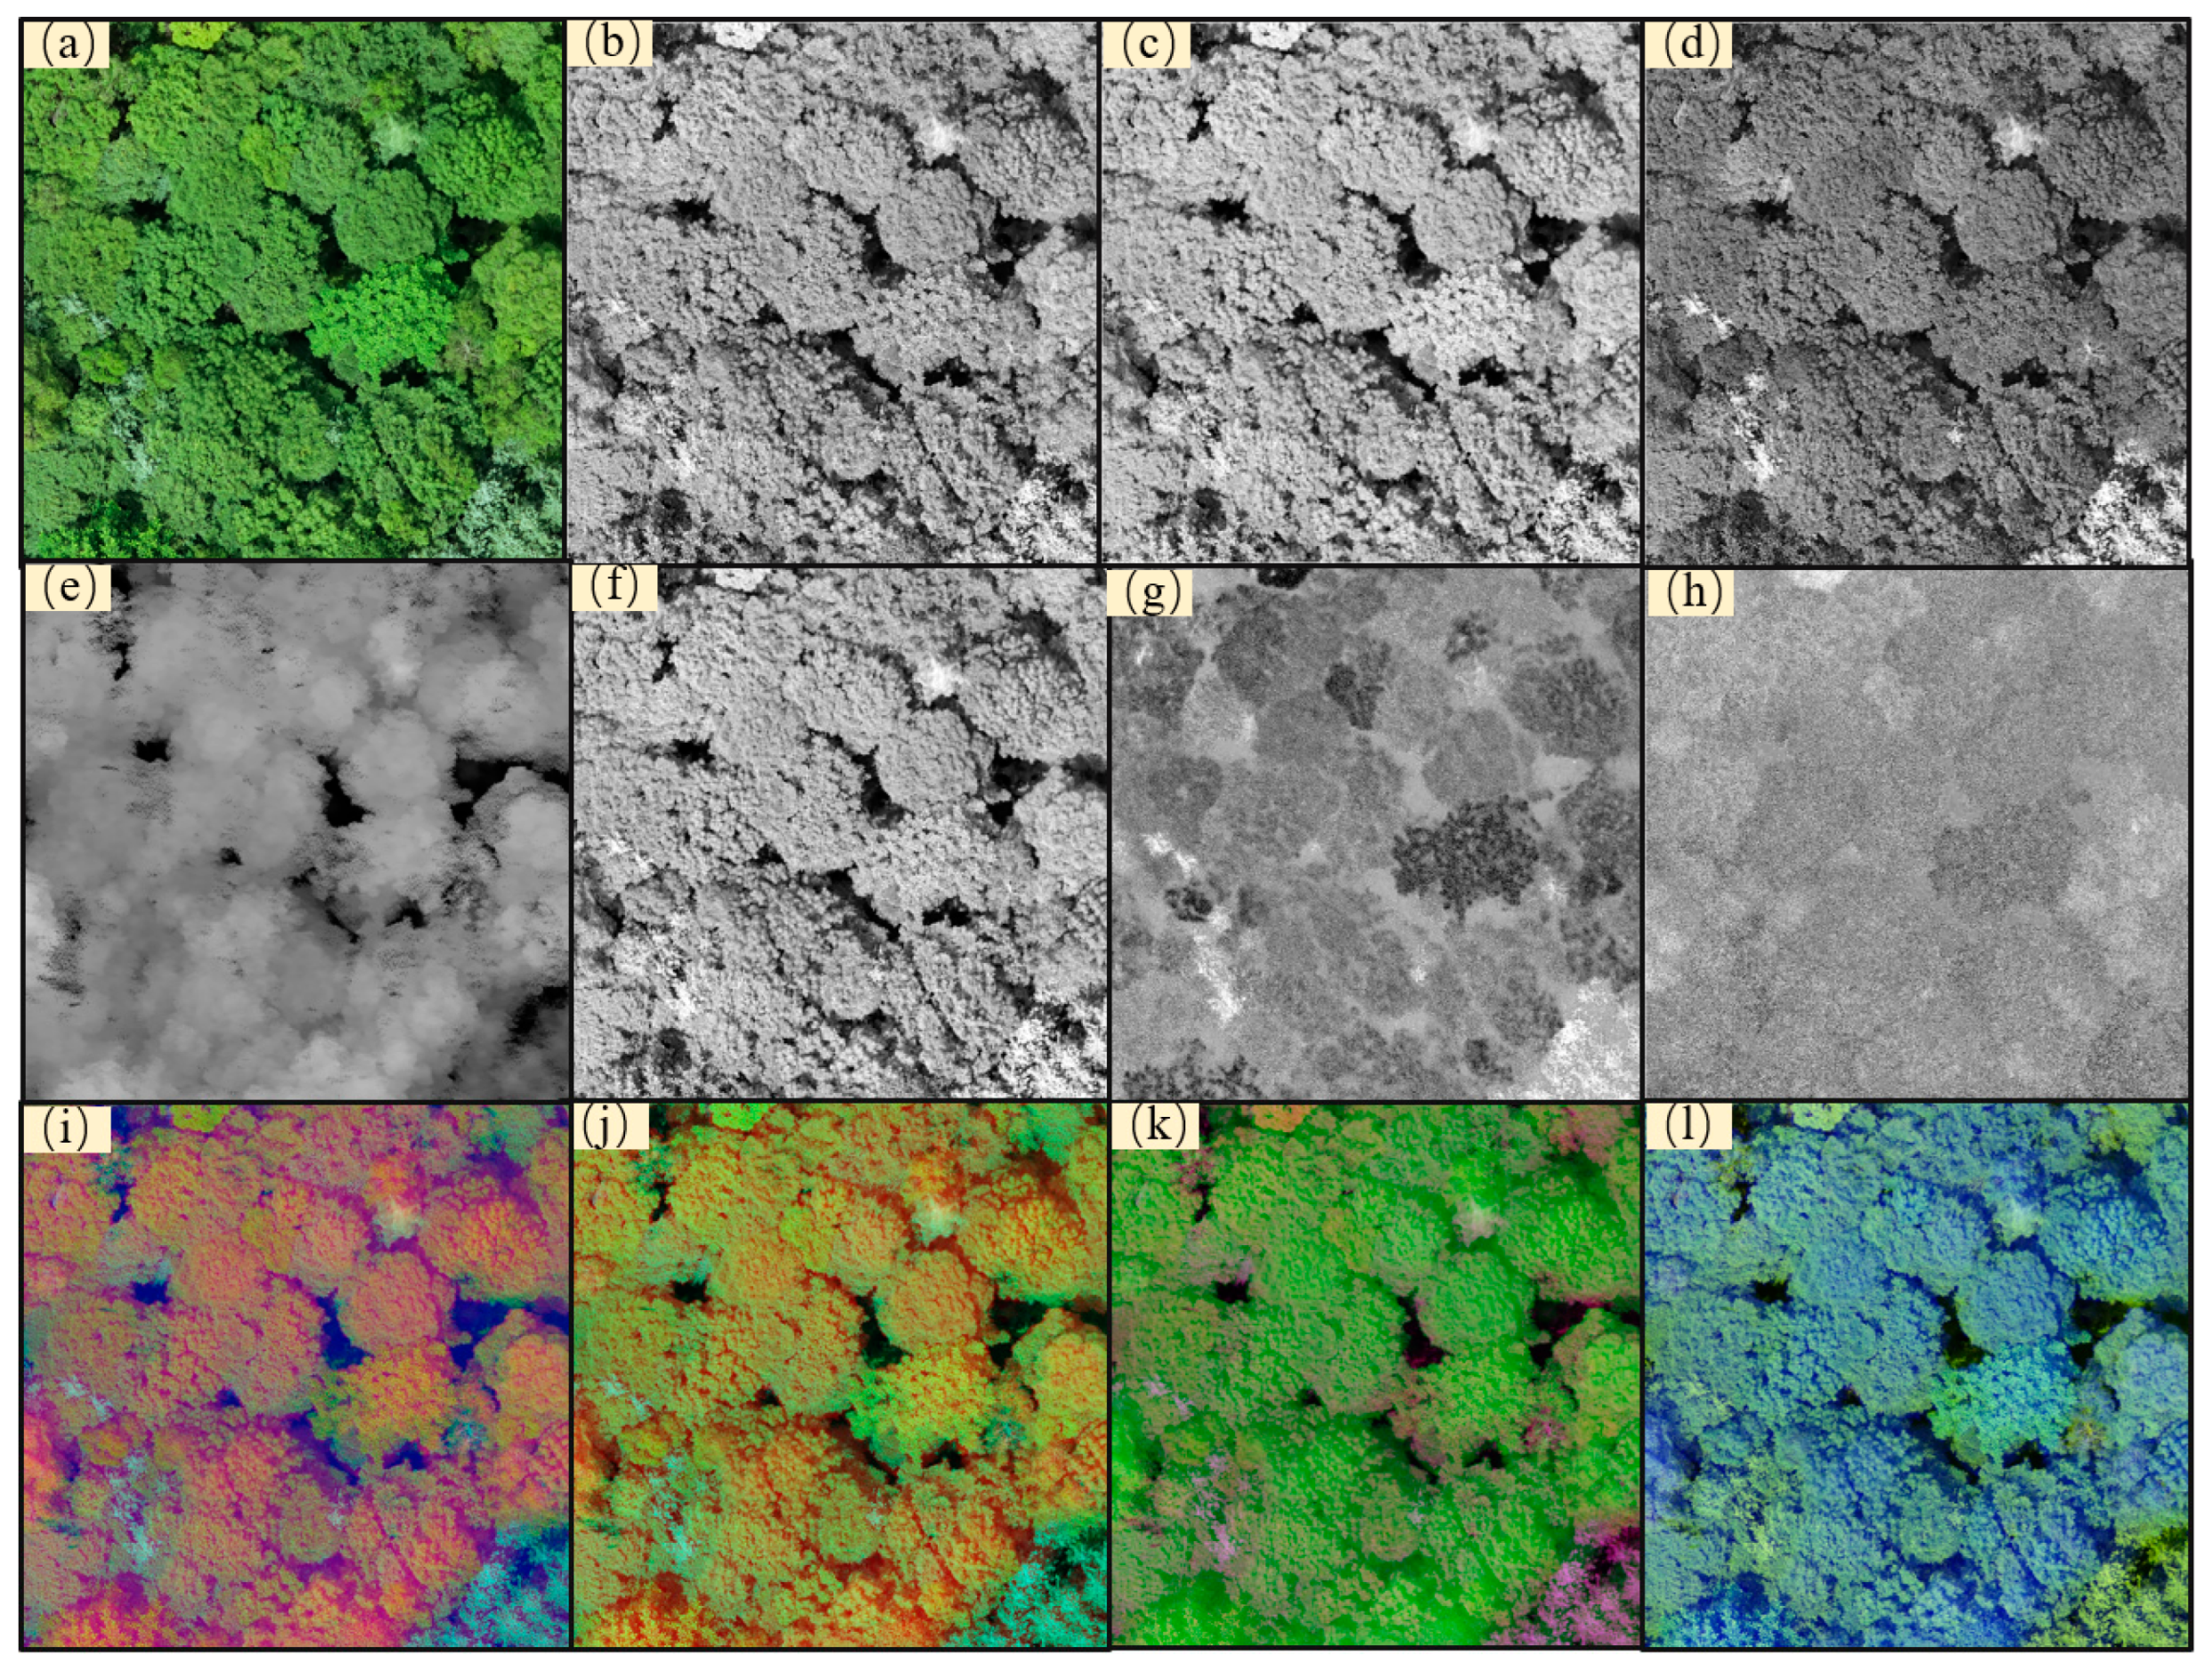
Since the input data for an object detection model is generally a 3-channel RGB image, fusing depth information data can replace one channel of the RGB image with a CHM image, thereby generating RG-D, R-D-B, and D-GB images. However, this approach directly discards 1/3 of the RGB images data, while a PCA algorithm concentrates the main information of the data into the previous component through transformation. Therefore, ENVI 5.3 software was used to perform principal component transformation analysis on the RGB images. The first two components of the principal component transformation were used to fuse with depth information to obtain PCA-D images. Since the image size and spatial resolution were exactly the same as those of the RGB images, the corresponding image dataset was obtained by segmenting it in the same way as RGB images.
Data augmentation can avoid overfitting and improve model robustness and generalization ability [51]. Therefore, a consistent data augmentation method was used to compare the impact on accuracy of different data fusions on individual tree identification on the above data training set. The augmentation methods include flip, rotation, shear, hue, capture, brightness, exposure, noise, and mosaic operations.

3.3. Performance Comparison of Different Object Detection Models

In order to compare the individual tree species identification capabilities of different models, the RGB dataset was trained using various models, including the first-stage algorithms RetinaNet, SSD, YOLO v5, and YOLO v8. In addition, the classic second-stage object detection algorithm Faster R-CNN was also used to train the models to explore their capabilities in identifying individual tree species under complex natural coniferous and broad-leaved mixed forests.

3.4. Tree Species Identification Effectiveness of Different Scales and Spatial Resolutions in YOLO v8

YOLO v8 can be divided into five scales based on different scaling factors, namely n, s, m, l and x, each associated with an increasing number of parameters. With additional parameters, the accuracy of the model rises, but it also makes the model larger, more complex, and slower to run. This study obtained RGB datasets with spatial resolutions of 2.7, 3.6, 5.4, 8.1, 10, 15, 20, 30, 40, 50, and 80 cm through resampling, and conducted training to explore the impact of different spatial resolutions and model scales on the accuracy of individual tree species identification.

3.5. Tree Species Identification Performance of Different Data Fusion Methods

Currently, there is limited research on the optimal fusion method for RGB and CHM image data in the field of forestry. Therefore, this study is based on the YOLO v8 model and trains the RG-D, R-D-B, D-GB, and PCA-D datasets to compare the accuracy impact of different fusion methods on individual tree species identification.

3.6. AMF GD YOLO v8 Model

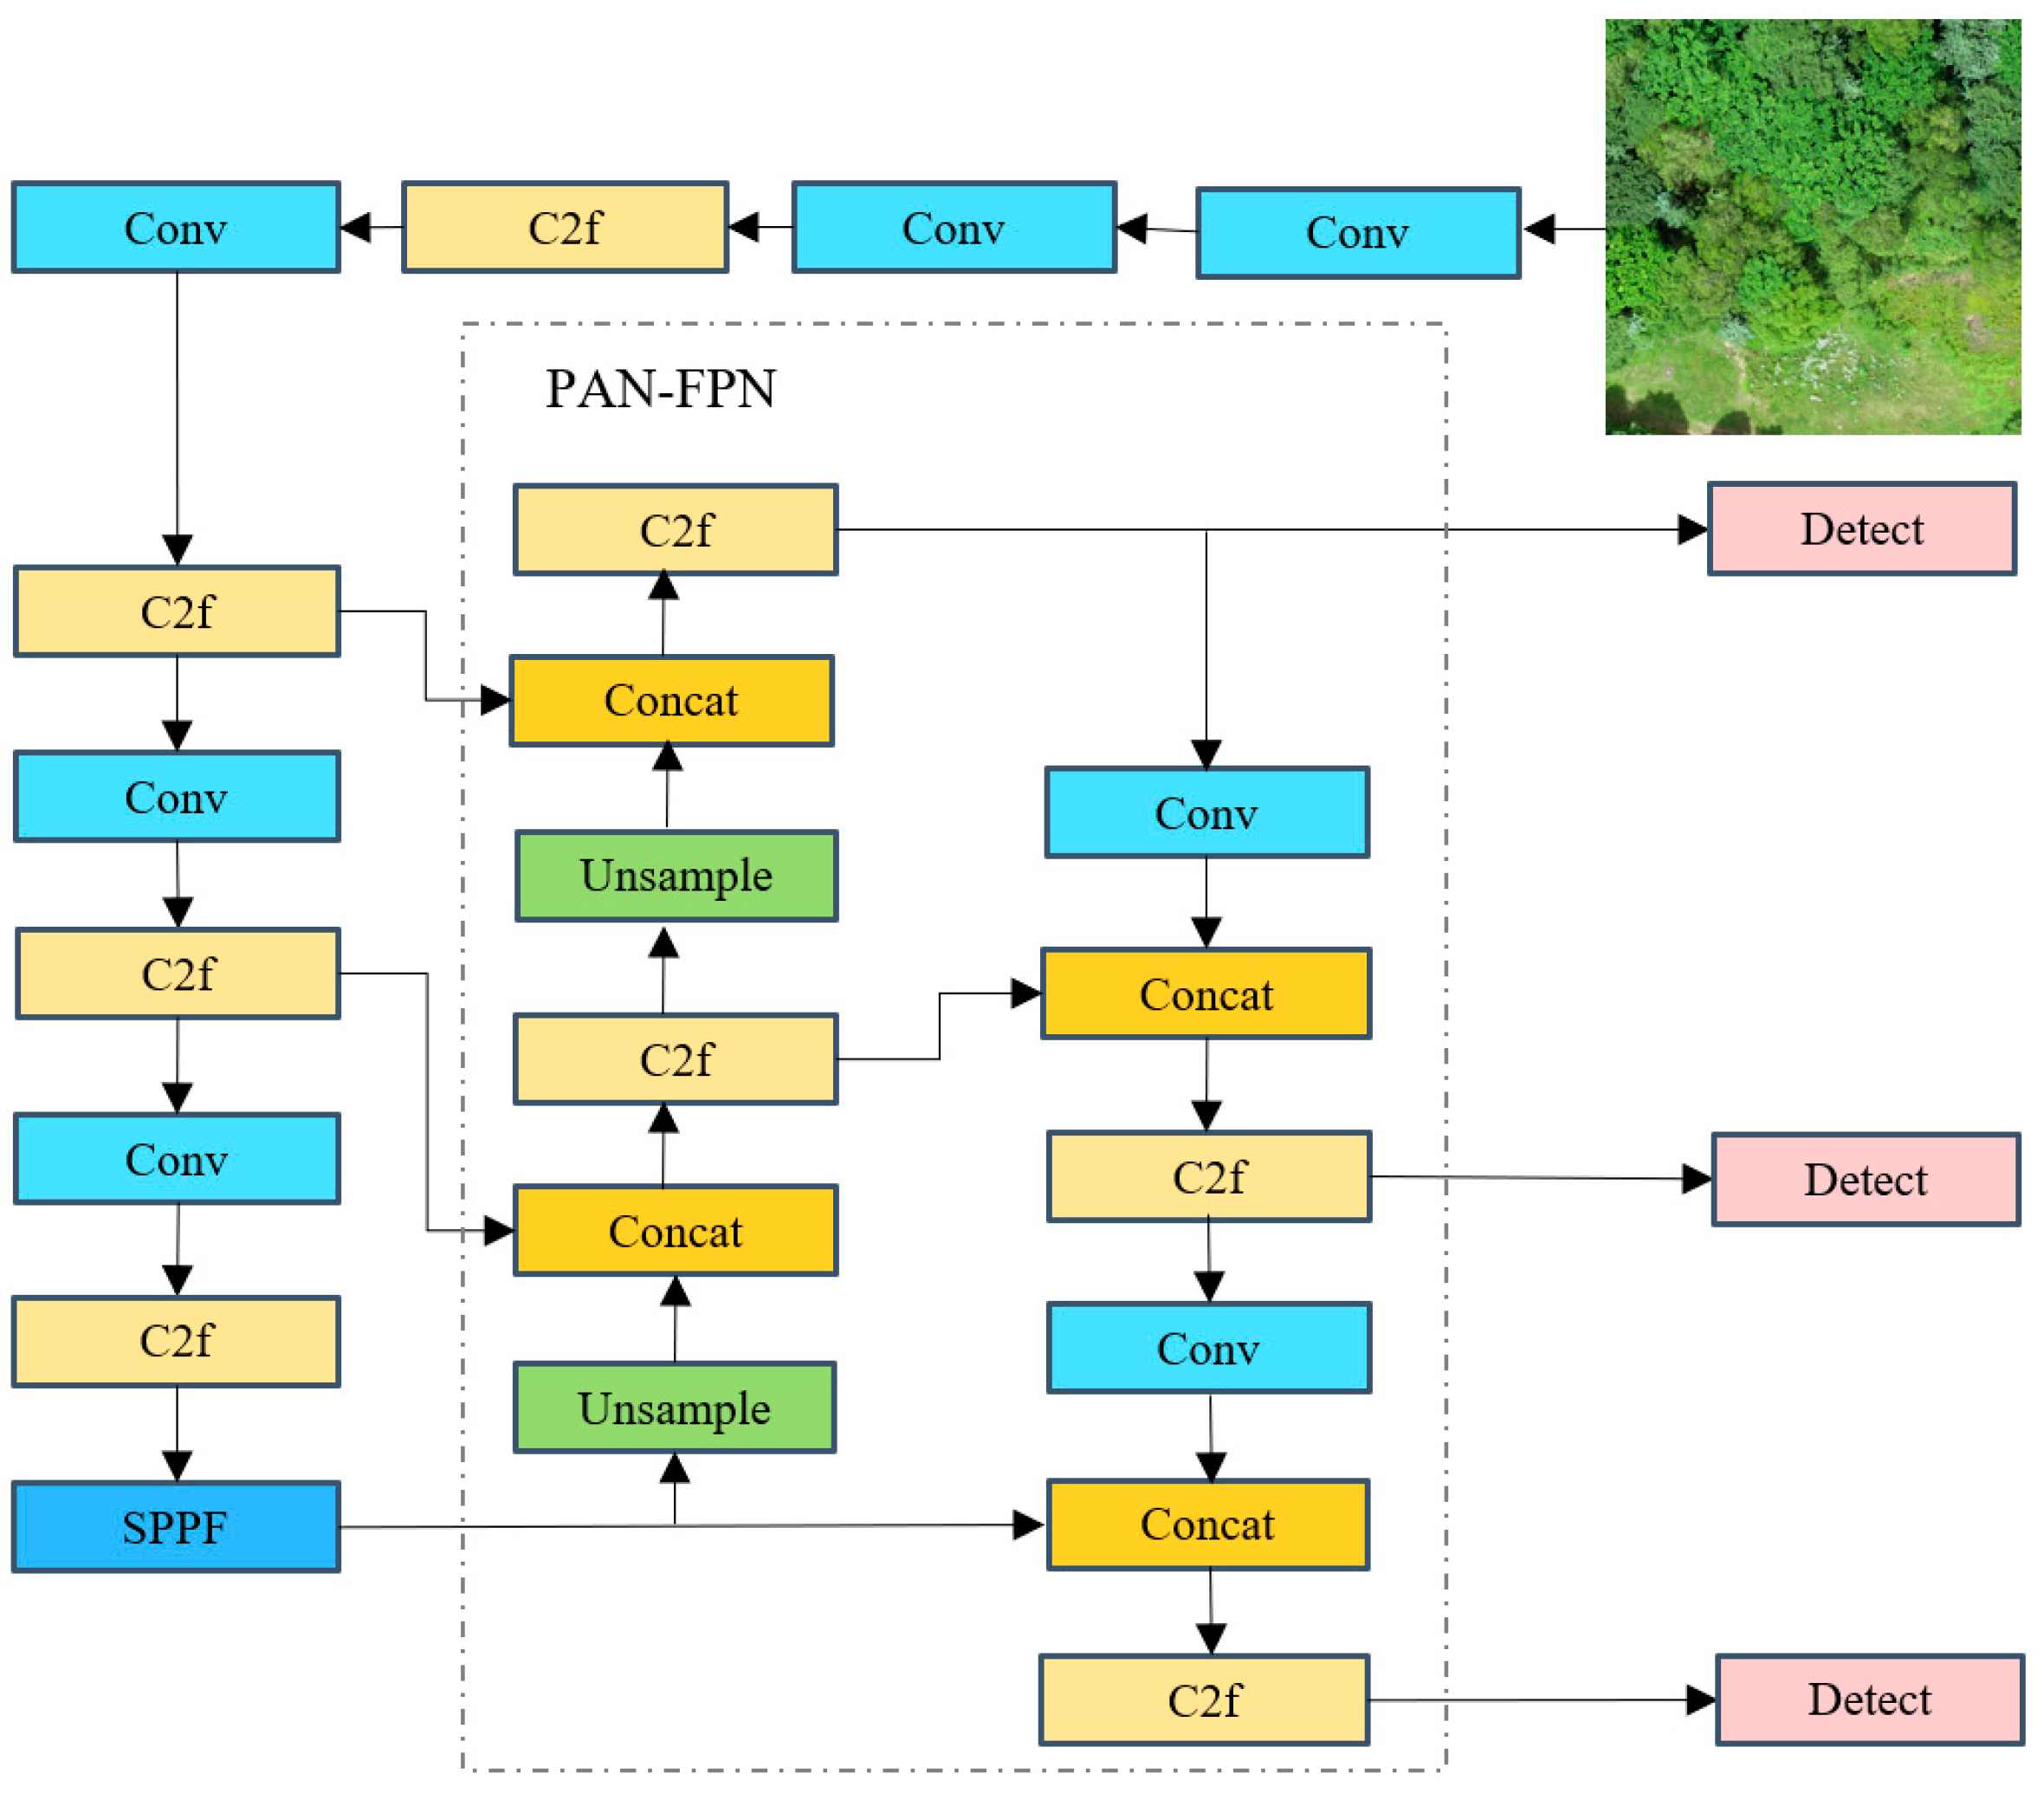
The YOLO v8 model structure is shown in Figure 5, which integrates the advantages of various YOLO series, enabling YOLO v8 to achieve higher accuracy in various object detection tasks, establishing it as the state-of-the-art (SOTA) in the current YOLO series [43,52].
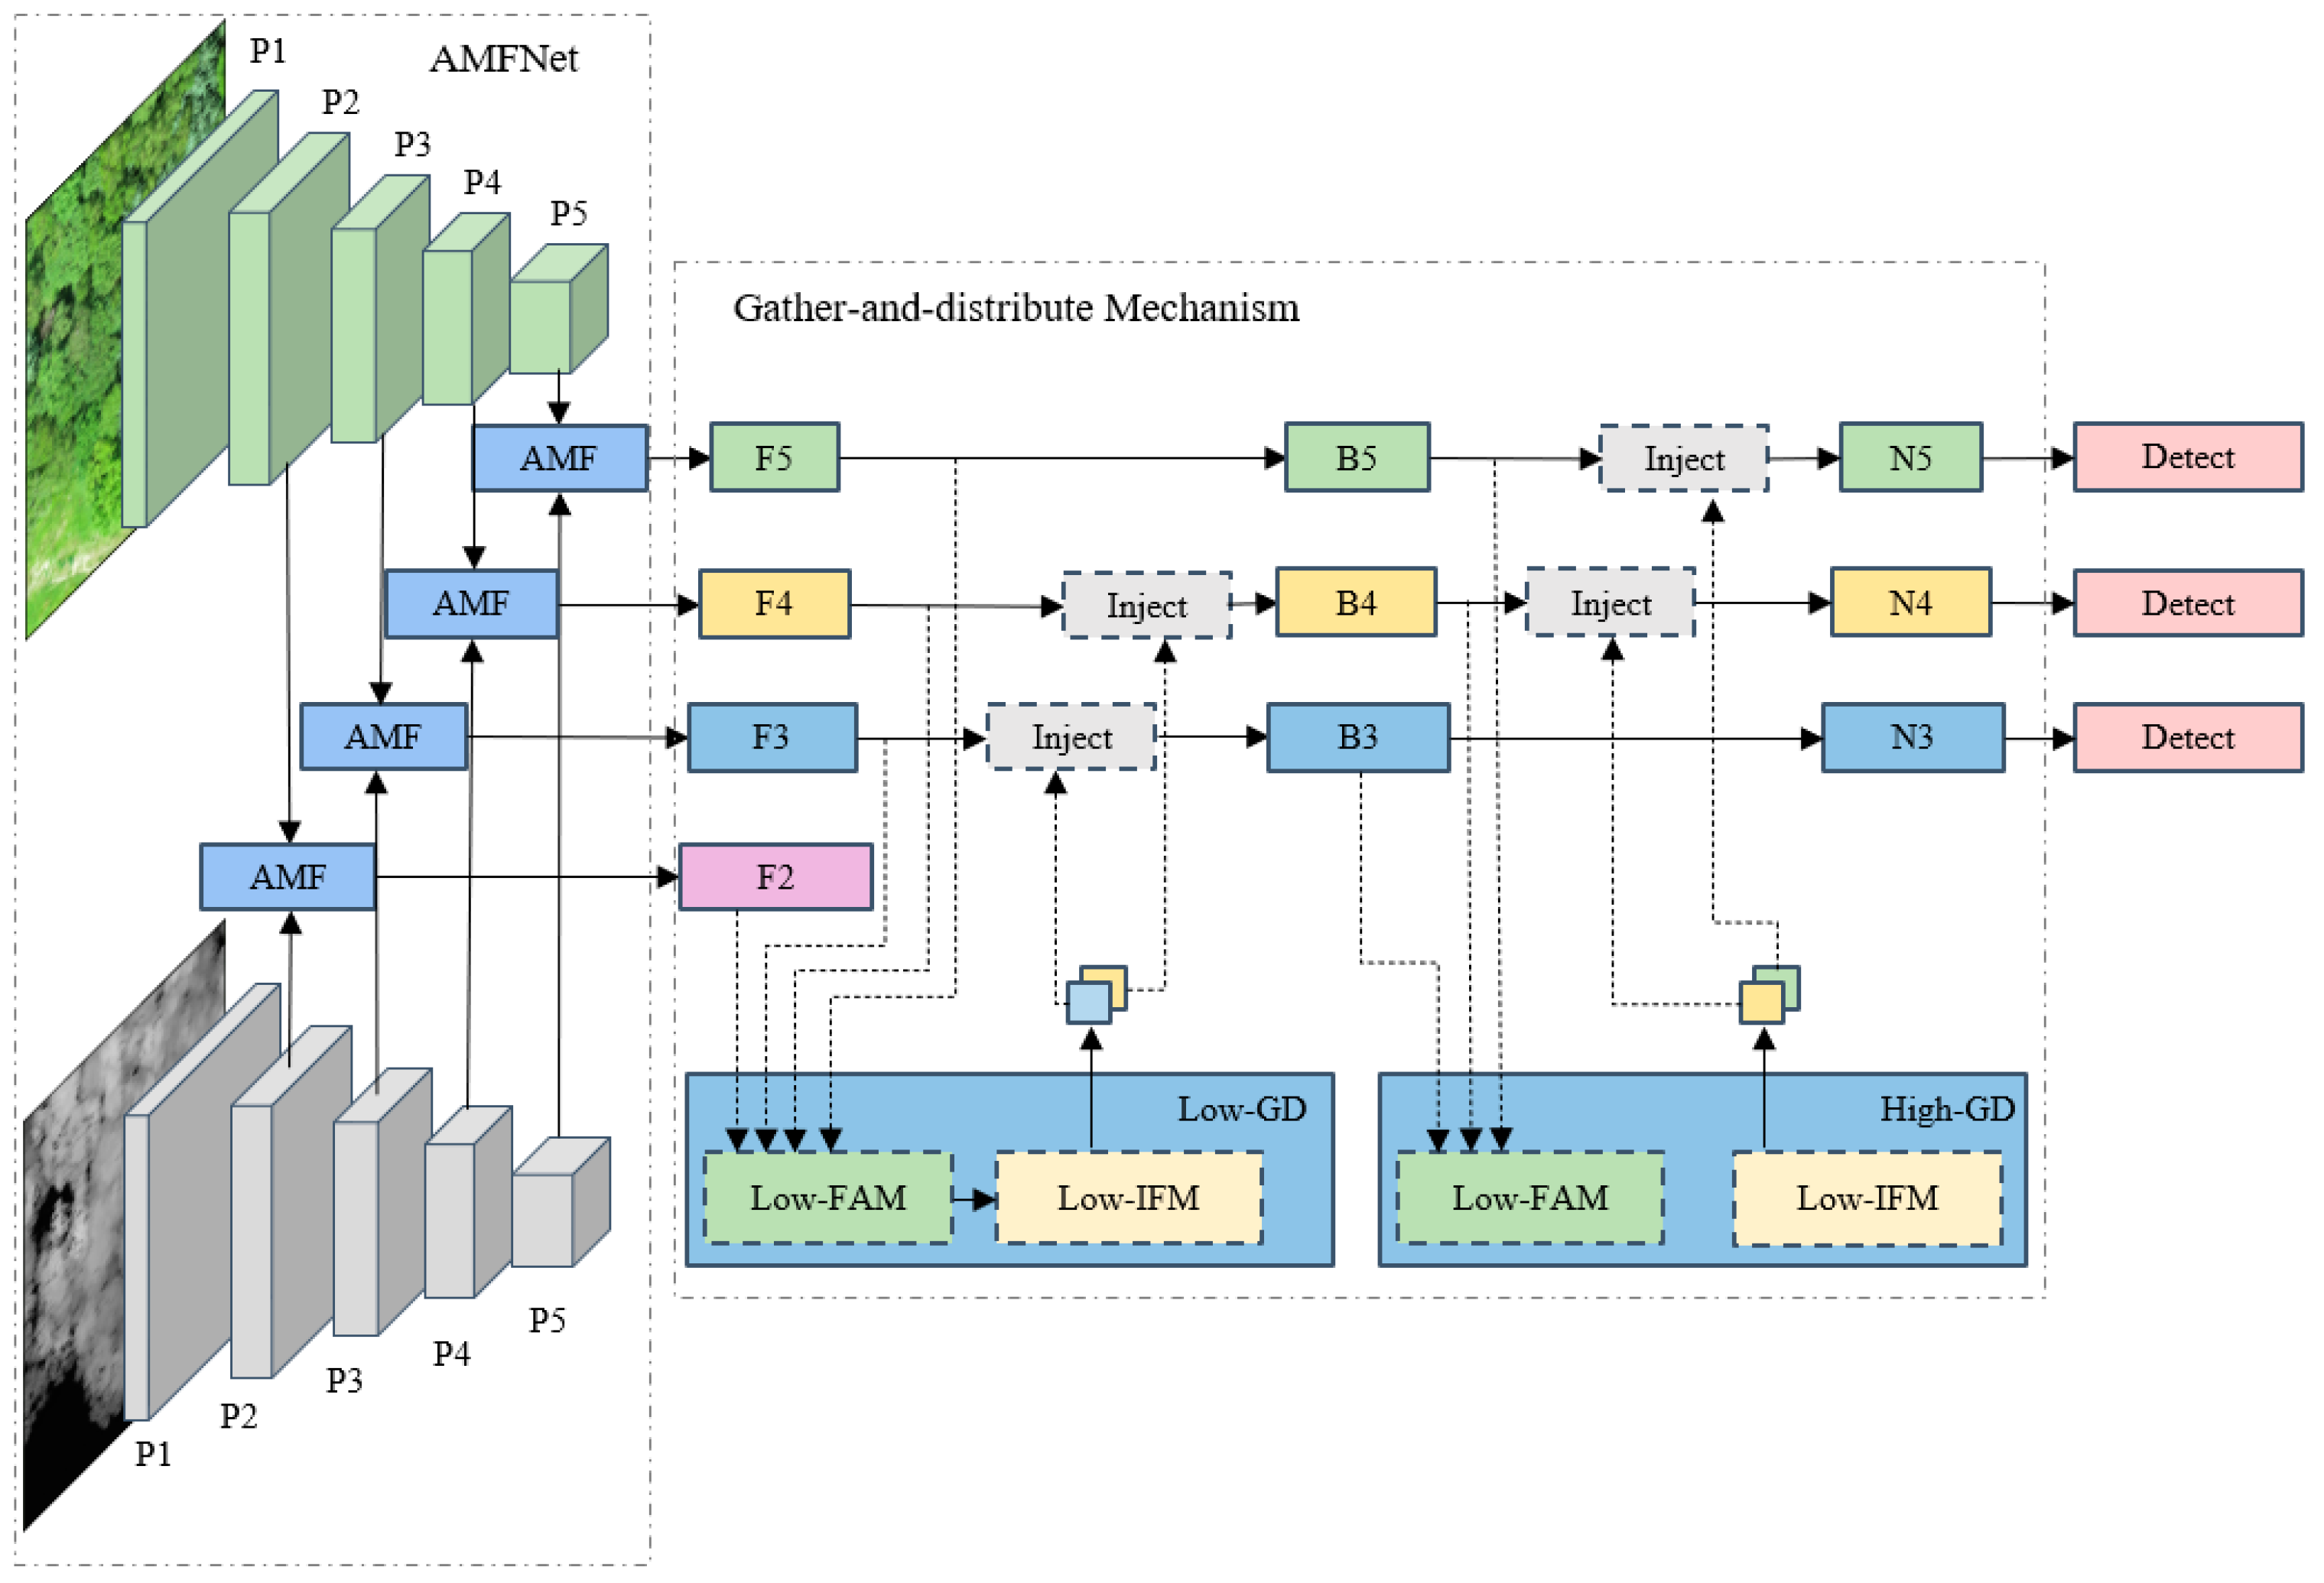
Although YOLO v8 has robust object detection capabilities, it cannot directly input multisource remote sensing data. The aforementioned band combination fusion methods lead to the loss of some data information. After fusing some RGB data and CHM data into the network, the contributions to the final object detection results are different due to the different effective information attributes contained in the two types of data. Inputting two different forms of data into the same network structure can easily lead to the loss of effective CHM information [6]; dual-branch feature extraction networks are more suitable for processing multimodal data [53,54]. To fully explore the potential of combined multisource remote sensing data in the identification of individual tree species in complex natural coniferous and broad-leaved mixed forests, the AMF GD YOLO v8 object detection network based on YOLO v8 was proposed, as shown in Figure 6.

3.6.1. AMFNet

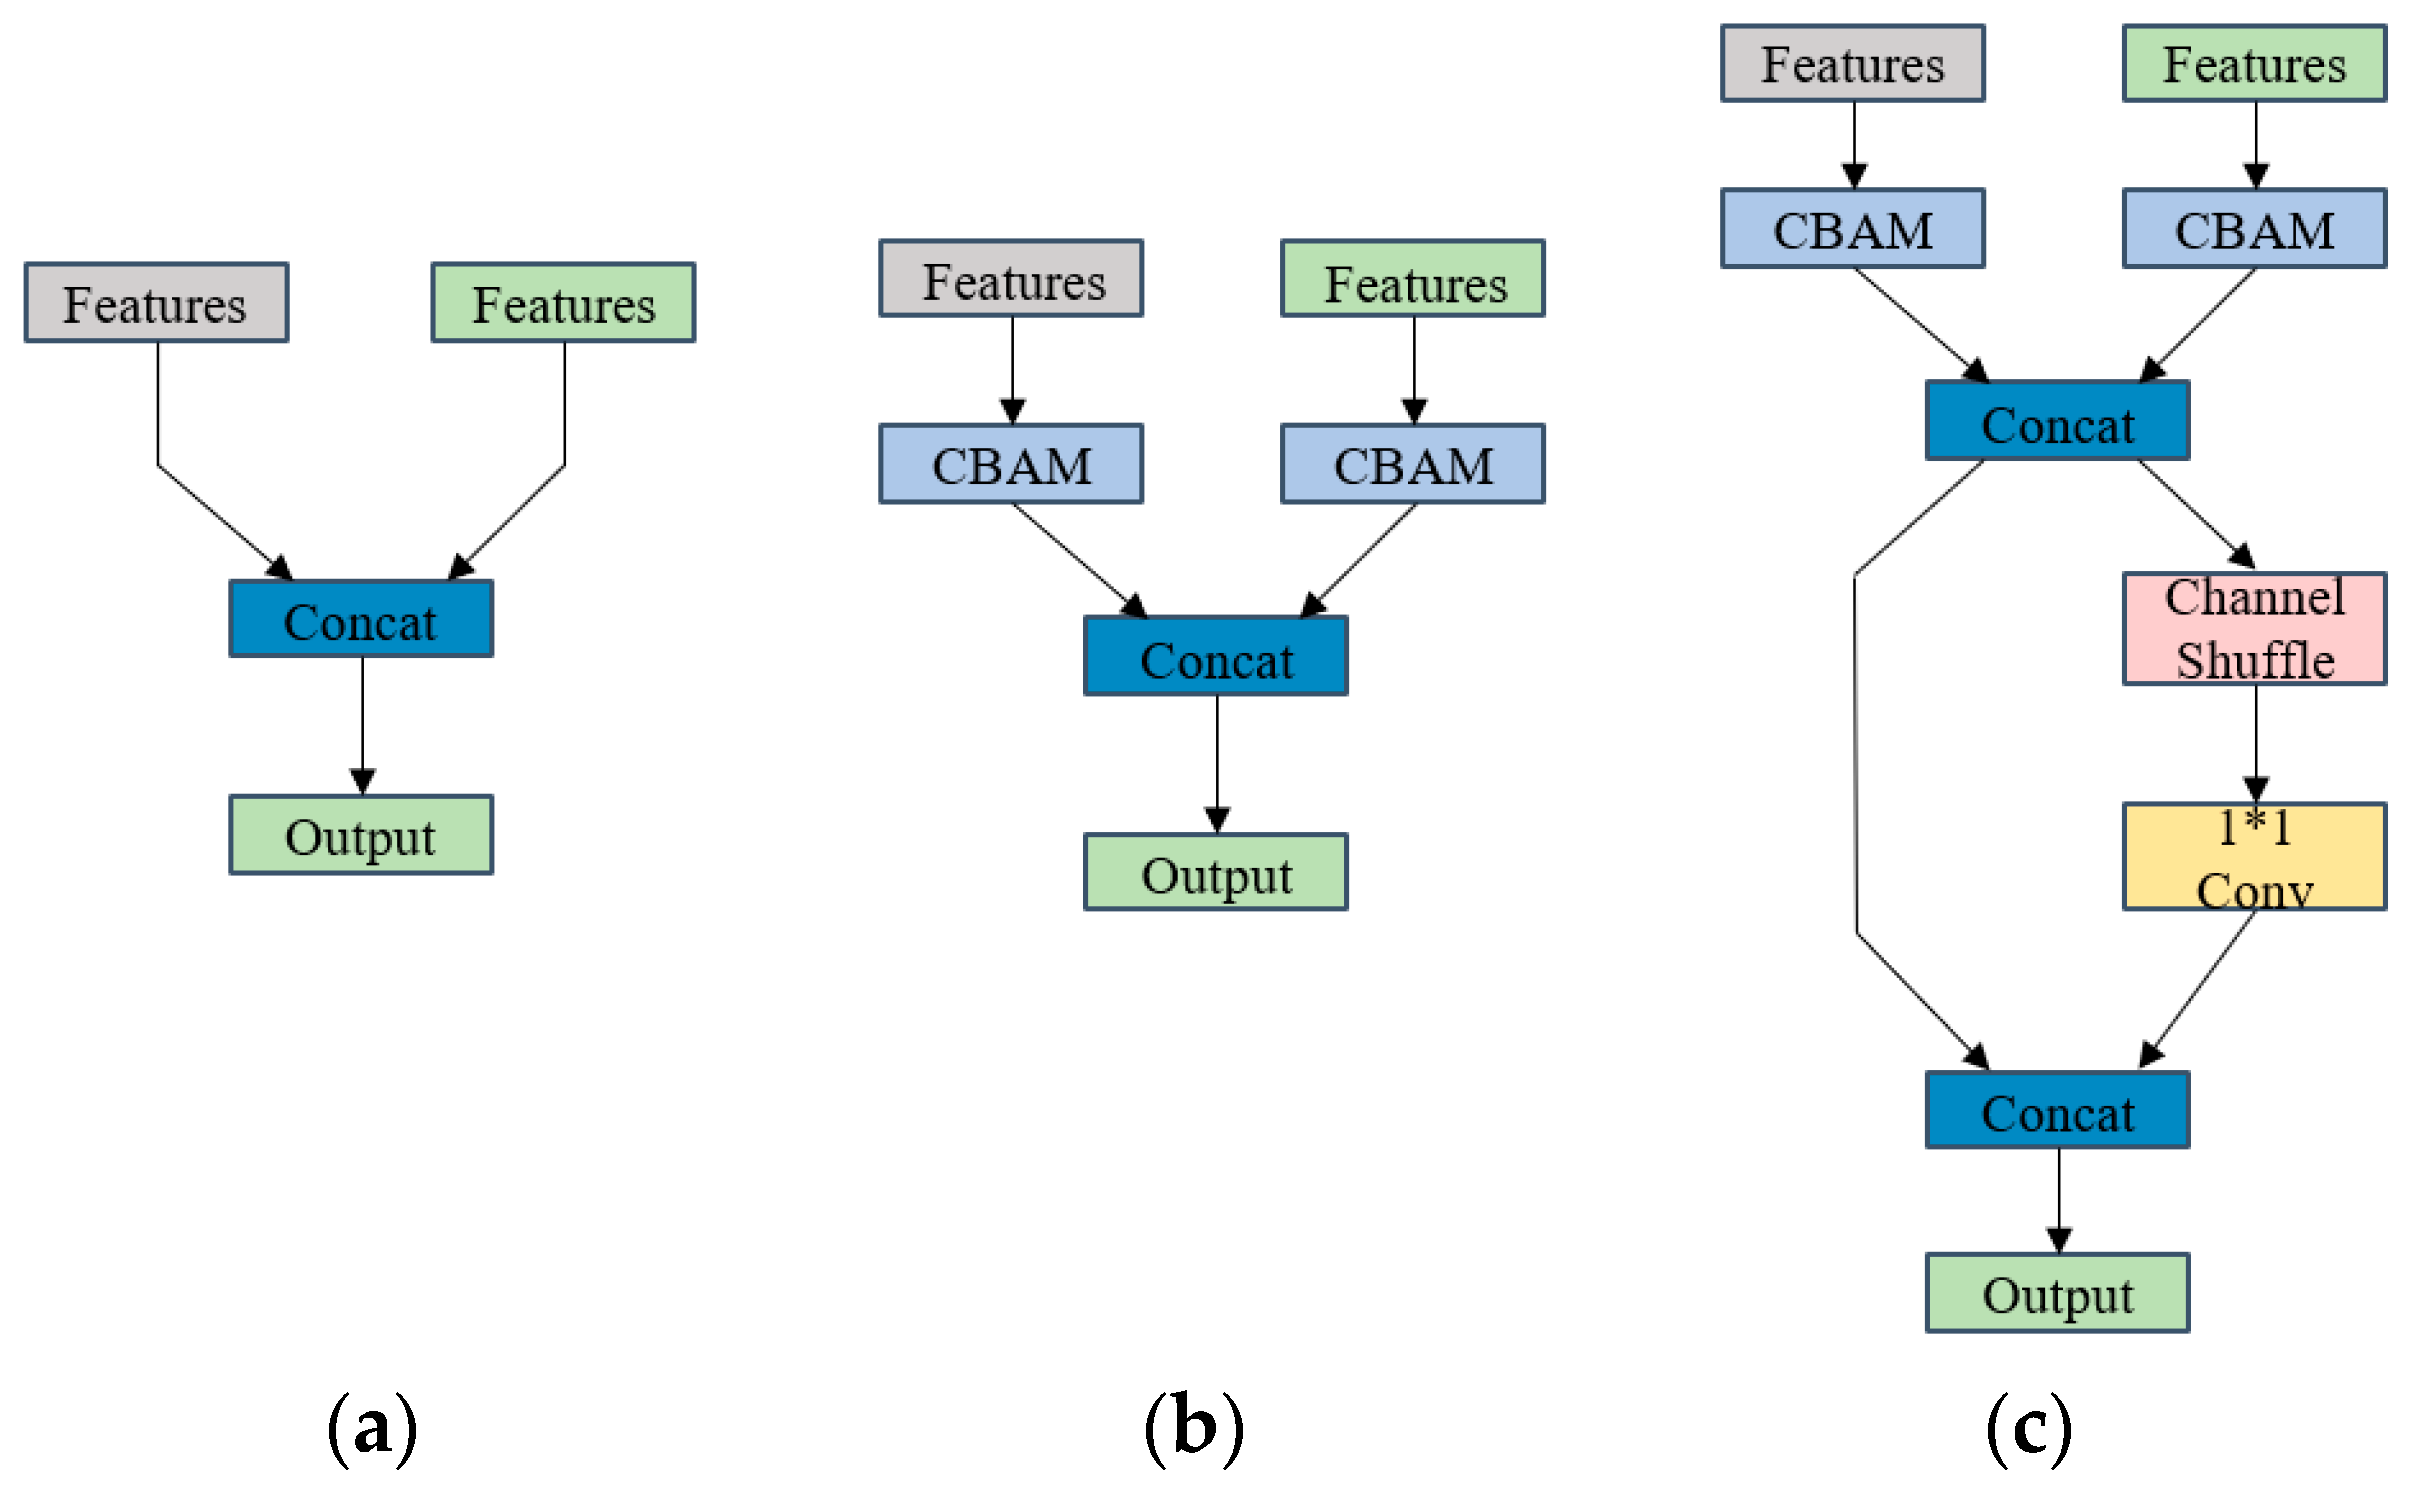
The Attention Multi-level Fusion Network (AMFNet) consists of two feature extraction branches and data fusion modules, which can simultaneously input RGB and CHM images to achieve multi-level fusion of images. The two feature extraction branches are based on the YOLO v8 backbone. The extracted features are fused through a data fusion module. In the data fusion module, Convolutional Block Attention Module (CBAM) attention mechanism was added [55]. The CBAM module sequentially generates attention feature map information in both channel and spatial dimensions, and then multiplies the two-feature map information with the previous original input feature map for adaptive feature correction, highlighting important data and suppressing irrelevant information. After several trials, attention mechanisms were selected to be added respectively before the fusion of features from the two branches, allowing the attention mechanism to emphasize the useful information of each dataset without mutual interference. However, this can result in a lack of interaction between the different data features after concatenation. To address this issue, we referred to the Shuffle Net structure [56] by adding inter-channel information exchange to enable the network to learn more mixed features and adapt to the features of both data types, thus improving the model’s expressive capability and predictive performance. The specific structure of the data fusion module was shown in Figure 7. Figure 7a–c show ablation experiments conducted on different structural models to further explore their effects.

3.6.2. Gather-and-Distribute Mechanism

The original YOLOv8 was fused with multi-scale features using the PAN-FPN (Path Aggregation Network with Feature Pyramid Networks) structure in the model neck, as shown in Figure 5. However, the FPN method can only fully integrate the features of adjacent layers, and information from other layers can only be indirectly ‘recursively’ obtained. Therefore, based on the neck module of the GOLD-YOLO model [57], the gather-and-distribute (GD) mechanism was introduced into the improved model neck, as shown in Figure 6. Compared with traditional FPN method by using a unified module to collect and fuse information from different levels and then distribute it to different levels, which can effectively avoid the inherent information loss in the traditional FPN structures.
The AMF GD YOLO v8 model is an improvement based on the characteristics of different modalities of multi-source forest remote sensing data. Compared to the original YOLO v8, the improved model can simultaneously input RGB and CHM images for tree species identification and achieve multi-level fusion of RGB and CHM features through a feature fusion model. In response to the characteristic that trees are mostly small to medium-sized targets, the gather-and-distribute mechanism was introduced to comprehensively utilize the features extracted by the backbone. Compared to PAN-FPN, the P2 detection layer was added to enhance the ability to detect small targets and thereby better achieving individual tree species identification in complex natural coniferous and broad-leaf mixed forests.

3.7. Accuracy Evaluation and Experimental Environment

This study used harmonic mean F1 scores of precision and recall, as well as the average precision mAP when the IoU threshold was set to 0.5(mAP@50) as accuracy evaluation metrics [32,44]. The model’s efficiency was assessed using the Frames Per Second (FPS) metric. To validate the performance of the proposed AMF GD YOLO v8 model, ablation experiments were designed to evaluate the effects of different improvement modules, the performance of the AMFNet backbone, different feature combination methods of the AMF module, and the CBAM attention mechanism. The gather-and-distribute mechanism neck in individual tree species identification using UAV multi-source remote sensing datasets was also verified.
The experiment of this study utilized PyTorch as the deep learning framework. The experiments were conducted on a desktop computer with Windows 11 as the operating system. The hardware included an NVIDIA GeForce RTX 3090 GPU with 24 GB of VRAM, 32 GB DDR4 RAM, and an Intel (Core (TM) i7-12700 CPU. This setup provided a robust platform for conducting the deep-learning experiments and evaluations necessary for this study.

4. Results and Analysis

4.1. Individual Tree Species Identification Results of Different Models

RGB data is most widely used in the research of object detection in the forestry field, and its spatial resolution ranges between 5 and 10 cm [6,31]. To make the research results more comparable with other studies, an RGB image dataset with a spatial resolution of 5.4 cm was trained on commonly used object detection models such as RetinaNet, Faster R-CNN, SSD, YOLO v5, and YOLO v8. For YOLO models, the highest precision ‘x scale’ was used. The results are shown in Table 1.
Table 1 shows that the ability of different models to identify individual tree species in coniferous and broad-leaved mixed forests varies. YOLO v8 achieves the highest precision, the mAP and F1-scores were 75.3% and 0.732, respectively, while the YOLO v5 model has the second highest accuracy, indicating that the YOLO series models have strong detection capabilities compared to the other modules. Although there is limited research on YOLO v8, the relevant studies also confirmed the superiority of the recently released YOLO series in object detection [58,59,60,61].

4.2. Impact of Different Spatial Resolutions and YOLO v8 Scales on Individual Tree Species Identification

To explore the impacts of different spatial resolution images on the accuracy and efficiency of identifying individual tree species in natural coniferous and broad-leaved mixed forests, as well as the object detection ability and efficiency of YOLO v8 with different scales at various spatial resolutions (2.7, 3.6, 5.4, 8, 10, 15, 20, 30, 40, 50, 80 cm), a total of five scales, n, s, m, l and x were used to train the resampled RGB dataset, and 55 combination results were obtained. This approach allows for a comprehensive assessment of how image resolution affects the model’s ability to accurately identify individual tree species and the efficiency of the detection process across different scales of the YOLO v8 model. The trend of mAP accuracy and the model detection speed are shown in Figure 8.
It is shown in Figure 8 that the finer the spatial resolution and the larger the model scale, the higher the identification accuracy. Specifically, the mAPs of x and n scales are 75.6% and 70.8%, respectively, but the difference in accuracy between x, l, and m scales is relatively small. From the overall trend of the curve, higher spatial resolution can achieve higher accuracy in tree species identification. However, the accuracy difference is small when the spatial resolution is within the domain of 2.7–8 cm. The accuracy slightly decreases when the spatial resolution is between 8–15 cm, and the accuracy trend declines significantly at spatial resolutions above 15 cm. When the spatial resolution is greater than 50 cm, the performance becomes very poor. In terms of efficiency, higher resolutions and larger model scales result in lower detection speeds. The n and s scales are noticeably more efficient than the x, l, and m scales. Although the accuracy differences between x, l, and m scales are small, their speed differences are more significant. The overall trend from Figure 8a,b indicates that as spatial resolution increases, the differences in accuracy and speed among different model scales become more pronounced.

4.3. Tree Species Identification Results of Different Data Fusion Methods

To explore the effects of multi-source remote sensing data fusion on the identification of individual tree species, different band combinations were used for fusion based on RGB and CHM images. The visualization results of data transformation and band combination are shown in Figure 9. From Figure 9b–d, it can be seen that the reflectance differences in the R, G, B bands vary among different tree species, indicating varying abilities to identify different tree species. Additionally, PCA transformation was used to concentrate the effective information of RGB images into the first few components, maximizing the information input into the YOLO v8 model. After PCA transformation, the first two components accounted for 99.3% of the information. Figure 9f–h show that the first and second components can express differences between tree species well, while the third component contains a lot of noise.
The YOLO v8 x model was used to train forest datasets with different fusion methods using the same spatial resolution of 5.4 cm, with results shown in Table 2. According to Table 2, after fusing depth information with RGB images through band combinations, the accuracy varied compared to that using RGB images alone. The accuracy decreased for RG-D and R-D-B, while it slightly increased for D-GB. Based on Figure 9b–d, it can be seen that the differences in tree species in the B band were greater than those in the R and G bands, indicating that the RG-D dataset with CHM replacing the B-band had the lowest accuracy, while the PCA-D dataset achieved the optimal result of 76.2%, indicating that PCA transformation can concentrate more useful information for tree species identification into the previous components, thereby enhancing accuracy. Overall, band combination methods relatively improved the accuracy of individual tree species identification compared to using only RGB data, but the effect was moderate.

4.4. AMF GD YOLO v8 Model Tree Species Identification Results

The effectiveness of the proposed AMF GD YOLO v8 model in identifying individual tree species was verified through combinations of different modules. The AMF GD YOLO v8 model was trained by simultaneously inputting two different data sources. In order to visualize the data results, the inference results of the AMF GD YOLO v8 model were uniformly displayed on RGB images. The results are shown in Table 3 and Figure 10, where both YOLO v8 and AMF GD YOLO v8 used x scales and 5.4 cm spatial resolution images.
According to Table 3, it is evident that combining RGB and CHM data, the AMF GD YOLO v8 achieved an accuracy of 81%, a 5.7% improvement compared to that using only RGB data in the original YOLO v8. The feature fusion module proposed has further improved accuracy compared to direct concatenation (a) by incorporating CBAM (b) and feature interaction (c), and the GD feature fusion method was superior to the FPN method, thus improving tree species identification accuracy. As seen in Figure 10, combining RGB and CHM information reduced model misjudgments. Using only RGB data, similar-colored background grasslands were mistakenly identified as trees, while there are obvious elevation differences between ground areas and tree crowns. CHM accurately expresses the target elevation information. Therefore, the AMF GD YOLO v8 model combined with RGB and CHM images can effectively avoid such misidentification in tree species identification. For large broadleaf trees, gaps between branches were mistakenly detected as separate crowns when using RGB data alone. However, CHM data showed the overall undulation of individual tree crown, reducing the occurrence of false positives. This demonstrates that the AMF GD YOLO v8 model can integrate effective information from both data types, making data utilization more comprehensive and thus enhancing tree species identification accuracy.

5. Discussion

Compared to other object detection models, YOLO v8 has a higher detection accuracy [62,63]. In this study comparing it with current mainstream object detection algorithms, YOLO v8 demonstrated its advantages in tree species identification. At the same time, the effects of YOLO v8 on the identification of individual tree species in complex natural coniferous and broad-leaved mixed forests under different spatial resolutions and data fusion methods was explored. Furthermore, the AMF GD YOLO v8 model was proposed based on the characteristics of multi-source remote sensing forest data, achieving precise identification of individual tree species in complex natural coniferous and broad-leaved mixed forests by combining RGB images and LiDAR data from UAVs.
Under the same hardware configurations, UAV remote sensing platforms can only achieve higher spatial resolution data by adjusting flight altitude. While UAVs have better flexibility, their data acquisition efficiency significantly decreases as flight altitude decreases. Therefore, it is important to clarify the impact of spatial resolution on the identification of tree species in complex forest stands and achieve a balance between regional coverage and spatial resolution, which is crucial to improve the efficiency of UAV data acquisition [64]. The spatial resolution of UAV RGB images has a significant impact on individual tree species identification. Higher spatial resolution can achieve higher identification accuracy, but only at the cost of lower efficiency. However, when the spatial resolution is better than 8 cm, the accuracy improvement becomes less significant. This trend was also confirmed in similar studies [32].
YOLO v8 provides five scales for researchers to use. As the number of parameters increases, its accuracy will improve, but the model will become larger and complex, and the computational efficiency will also decrease. This study used different scales to train datasets at different spatial resolutions to explore the differences in model accuracy and speed. The x scale of YOLOv8 achieved the highest individual tree species identification accuracy but had the lowest speed. In contrast, the n and s scales had lower accuracy but faster speeds. However, the detection accuracy of l and m scales had a smaller difference compared to x scale but faster detection speeds. Thus, in practical applications, it is important to choose the appropriate scales and spatial resolution based on research objectives to achieve an efficient balance between accuracy and detection speed. This consideration is vital for optimizing tree species identification performance and data collecting efficiency using UAV remote sensing.
The difficulty of identifying different trees varies from species to species. According to the individual tree species identification results for different species (Table 3), the identification accuracy for coniferous trees like Pinus koraiensis, Larix gmelinii, and Picea asperata was higher than that for broadleaf trees, which is similar to the research results of Beloiu et al. and Fricker et al. [31,65]. This is because coniferous trees have more regular appearances, with significant and uniform height variations at the top and edges of the crown, whereas broadleaf trees have a smoother crown top and irregular crown shape. Overall, the models achieved good results in identifying individual trees of the dominant species in the study area, but the accuracy of identifying ‘other tree species’ in this category was relatively low, possibly due to their small numbers and the composition of different tree species.
Band combination is the simplest and commonly used method in multi-source remote sensing data fusion [6,27,29,66,67], and different combination methods showed different effects for different tree species. The identification accuracy of DGB and PCA-D was 75.5% and 76.2%, respectively, which indicates a good identification performance. The identification accuracy of tree species using PCA transformation for image fusion proposed in this study is superior to conventional band combinations. The reason is that PCA transformation concentrates information on the front components, reducing some data noise while inputting more useful information into the deep learning network, thereby enhancing predictive result accuracy. The experimental results showed that band combination is a simple but effective approach for fusing multi-source remote sensing data. However, band combination complicates data preprocessing, reduces automation, and involves some information loss. Li et al. [6] noted that because different remote sensing data came from different sensors, there were great differences in data characteristics. When the data after band combination was input into the same network structure, and the network could not maximize the extraction of each data source’s features, leading to the loss of some effective information. In this study, as much information as possible was input into the model through band combination, but its effectiveness was still inferior to the AMFNet GD YOLO v8.
From the model structure (Figure 6), it can be seen that AMFNet GD YOLO v8 can avoid the problems of information loss and the inability of a single feature extraction network to adapt to multi-source remote sensing data. According to the band combination experiment results (Table 2) and the improved model results (Table 3), using only the dual-branch backbone without using CBAM attention mechanisms, channel communication, and GD neck (Figure 7a), the mAP increased by 3.5%. This validates the applicability of the proposed dual-branch backbone for multi-source remote sensing data. Further, according to the ablation experiment results, the CBAM attention mechanism highlighted important features of the data, helping the model focus on the most information parts of the input and ignore unimportant information, thus enhancing the model’s ability to detect and identify individual trees. Compared to the fusion method without feature interaction (Figure 7b) in the AMF module, the feature interaction method (Figure 7c) obtained a 1.1% improvement in individual tree identification accuracy. This indicates that the proposed feature interaction method can address the lack of interaction between features extracted by different branches of the model backbone, thereby improving tree species identification accuracy. In the model’s neck, ablation results proved that the GD mechanism is superior to PAN-FPN, and the improvement in identification accuracy not only comes from the GD mechanism using a unified module to collect and fuse information at various levels, but also effectively avoids the information loss inherent in traditional FPN structures [57]. According to the model structure diagram (Figure 6), the GD mechanism integrated P2 layer detection information into the module, thereby enhanced the detection effect of individual trees in the forest stand.
This study based on deep learning achieved automated and precise identification of individual tree species in natural coniferous and broad-leaved mixed forests. It explored the impacts of different models, spatial resolutions, and data fusion methods on individual tree species identification, and the proposed AMF GD YOLO v8 model achieved encouraging results in individual tree identification. However, there are still some limitations worthy of further research. The dual-branch feature extraction and fusion structure within the AMF module have achieved an improvement in accuracy, yet they have also increased the computational complexity of the model. Future research could focus on developing more lightweight models, which could be deployed in small-scale devices to enable real-time acquisition of tree species information. Alternatively, developing more advanced model architectures to further improve the accuracy of tree species identification.
While the creation of a multi-source remote sensing dataset for forests has validated the efficacy of the AMF GD YOLO v8 model, its generalizability across forest types under varying geographical, climatic, or ecological conditions still requires further verification. However, current research on individual tree species identification using deep learning is hindered by the lack of comprehensive and large-scale public datasets encompassing a wide variety of tree species, which is crucial for enhancing the model’s performance and universality.

6. Conclusions

This study developed an end-to-end individual tree identification method using RGB and LiDAR data under complex natural coniferous and broad-leaved mixed forests. The current object detection method was applied to the identification of individual tree species and the fusion method of multi-source remote sensing data was studied. The conclusion indicates that: (1) The YOLO v8 object detection model performs the best compared to other models, and different spatial resolutions and model scales have a certain impact on the accuracy of individual tree species identification. The higher the spatial resolution, the larger the scale, and the higher the accuracy in identification of tree species. (2) Band combination of multisource data can improve tree species identification accuracy, however, due to issues such as information loss, the improvement in tree species identification is limited. (3) The AMF GD YOLO v8 model can significantly improve detection capabilities, achieving automatic and accurate identification of individual tree species under complex conditions in the forests of Northeast China. This study provides a new solution for the application of UAV technology in forest resource investigation, and also provides technical reference for the application of deep learning combined with multi-source remote sensing data. Furthermore, how to achieve model light-weighting, higher accuracy, and broader applicability merits more in-depth research.

Author Contributions

Conceptualization, H.Z., Z.Z. and W.L.; methodology, H.Z., Z.Z. and W.L.; software, H.Z. and Z.Z.; validation, H.Z., Z.Z. and W.L.; formal analysis, H.Z. and Z.Z.; investigation, H.Z., Z.Z., W.L. and H.L.; resources, H.Z. and W.L.; data curation, H.Z.; writing—original draft preparation, H.Z.; writing—review and editing, H.Z., J.W. and W.L.; visualization, H.Z.; supervision, W.L. and J.W.; project administration, W.L. and H.Z.; funding acquisition, W.L. and H.Z. All authors have read and agreed to the published version of the manuscript.

Funding

This research was funded by the Innovation Foundation for Doctoral Program of Forestry Engineering of Northeast Forestry University (LYGC202114), the National Natural Science Foundation of China (31971574), and the Joint Project of the Natural Science Foundation of Heilongjiang (LH2020C049).

Data Availability Statement

The data presented in this study are available on request from the corresponding author.

Acknowledgments

The authors would like to acknowledge the field crew for collecting the field data.

Conflicts of Interest

The authors declare no conflicts of interest.

References

  1. Budei, B.C.; St-Onge, B.; Hopkinson, C.; Audet, F.A. Identifying the genus or species of individual trees using a three-wavelength airborne lidar system. Remote Sens. Environ. 2018, 204, 632–647. [Google Scholar] [CrossRef]
  2. Fassnacht, F.E.; Latifi, H.; Sterenczak, K.; Modzelewska, A.; Lefsky, M.; Waser, L.T.; Straub, C.; Ghosh, A. Review of studies on tree species classification from remotely sensed data. Remote Sens. Environ. 2016, 186, 64–87. [Google Scholar] [CrossRef]
  3. Braga, J.R.G.; Peripato, V.; Dalagnol, R.; Ferreira, M.P.; Tarabalka, Y.; Aragao, L.; Velho, H.E.D.; Shiguemori, E.H.; Wagner, F.H. Tree crown delineation algorithm based on a convolutional neural network. Remote Sens. 2020, 12, 1288. [Google Scholar] [CrossRef]
  4. de Almeida, D.R.A.; Broadbent, E.N.; Ferreira, M.P.; Meli, P.; Zambrano, A.M.A.; Gorgens, E.B.; Resende, A.F.; de Almeida, C.T.; do Amaral, C.H.; Corte, A.P.D.; et al. Monitoring restored tropical forest diversity and structure through UAV-borne hyperspectral and lidar fusion. Remote Sens. Environ. 2021, 264, 112582. [Google Scholar] [CrossRef]
  5. Terryn, L.; Calders, K.; Bartholomeus, H.; Bartolo, R.E.; Brede, B.; D’Hont, B.; Disney, M.; Herold, M.; Lau, A.; Shenkin, A.; et al. Quantifying tropical forest structure through terrestrial and UAV laser scanning fusion in Australian rainforests. Remote Sens. Environ. 2022, 271, 112912. [Google Scholar] [CrossRef]
  6. Li, Y.B.; Chai, G.Q.; Wang, Y.T.; Lei, L.T.; Zhang, X.L. ACE R-CNN: An attention complementary and edge detection-based instance segmentation algorithm for individual tree species identification using UAV RGB images and LiDAR data. Remote Sens. 2022, 14, 3035. [Google Scholar] [CrossRef]
  7. Shen, X.; Cao, L. Tree-species classification in subtropical forests using airborne hyperspectral and LiDAR data. Remote Sens. 2017, 9, 1180. [Google Scholar] [CrossRef]
  8. Zhao, D.; Pang, Y.; Liu, L.; Li, Z. Individual tree classification using airborne LiDAR and hyperspectral data in a natural mixed forest of Northeast China. Forests 2020, 11, 303. [Google Scholar] [CrossRef]
  9. Qin, H.M.; Zhou, W.Q.; Yao, Y.; Wang, W.M. Individual tree segmentation and tree species classification in subtropical broadleaf forests using UAV-based LiDAR, hyperspectral, and ultrahigh-resolution RGB data. Remote Sens. Environ. 2022, 280, 113143. [Google Scholar] [CrossRef]
  10. Falkowski, M.J.; Evans, J.S.; Martinuzzi, S.; Gessler, P.E.; Hudak, A.T. Characterizing forest succession with lidar data: An evaluation for the Inland Northwest, USA. Remote Sens. Environ. 2009, 113, 946–956. [Google Scholar] [CrossRef]
  11. Lu, X.C.; Guo, Q.H.; Li, W.K.; Flanagan, J. A bottom-up approach to segment individual deciduous trees using leaf-off lidar point cloud data. ISPRS J. Photogramm. Remote Sens. 2014, 94, 1–12. [Google Scholar] [CrossRef]
  12. Jaskierniak, D.; Lucieer, A.; Kuczera, G.; Turner, D.; Lane, P.N.J.; Benyon, R.G.; Haydon, S. Individual tree detection and crown delineation from Unmanned Aircraft System (UAS) LiDAR in structurally complex mixed species eucalypt forests. ISPRS J. Photogramm. Remote Sens. 2021, 171, 171–187. [Google Scholar] [CrossRef]
  13. Liu, B.J.; Hao, Y.S.; Huang, H.G.; Chen, S.X.; Li, Z.Y.; Chen, E.X.; Tian, X.; Ren, M. TSCMDL: Multimodal deep learning framework for classifying tree species using fusion of 2-D and 3-D features. IEEE Trans. Geosci. Remote Sens. 2023, 61, 4402711. [Google Scholar] [CrossRef]
  14. You, H.T.; Tang, X.; You, Q.X.; Liu, Y.; Chen, J.J.; Wang, F. Study on the differences between the extraction results of the structural parameters of individual trees for different tree species based on UAV LiDAR and high-resolution RGB images. Drones 2023, 7, 317. [Google Scholar] [CrossRef]
  15. Lombardi, E.; Rodríguez-Puerta, F.; Santini, F.; Chambel, M.R.; Climent, J.; de Dios, V.R.; Voltas, J. UAV-LiDAR and RGB imagery reveal large intraspecific variation in tree-level morphometric traits across different pine species evaluated in common gardens. Remote Sens. 2022, 14, 5904. [Google Scholar] [CrossRef]
  16. Deng, S.Q.; Katoh, M.; Yu, X.W.; Hyyppä, J.; Gao, T. Comparison of tree species classifications at the individual tree level by combining ALS data and RGB images using different algorithms. Remote Sens. 2016, 8, 1034. [Google Scholar] [CrossRef]
  17. Mayra, J.; Keski-Saari, S.; Kivinen, S.; Tanhuanpaa, T.; Hurskainen, P.; Kullberg, P.; Poikolainen, L.; Viinikka, A.; Tuominen, S.; Kumpula, T.; et al. Tree species classification from airborne hyperspectral and LiDAR data using 3D convolutional neural networks. Remote Sens. Environ. 2021, 256, 112322. [Google Scholar] [CrossRef]
  18. Hamraz, H.; Jacobs, N.B.; Contreras, M.A.; Clark, C.H. Deep learning for conifer/deciduous classification of airborne LiDAR 3D point clouds representing individual trees. ISPRS J. Photogramm. Remote Sens. 2019, 158, 219–230. [Google Scholar] [CrossRef]
  19. Liu, L.; Lim, S.; Shen, X.S.; Yebra, M. A hybrid method for segmenting individual trees from airborne lidar data. Comput. Electron. Agric. 2019, 163, 104871. [Google Scholar] [CrossRef]
  20. Roeder, M.; Latifi, H.; Hill, S.; Wild, J.; Svoboda, M.; Bruna, J.; Macek, M.; Novakova, M.H.; Guelch, E.; Heurich, M. Application of optical unmanned aerial vehicle-based imagery for the inventory of natural regeneration and standing deadwood in post-disturbed spruce forests. Int. J. Remote Sens. 2018, 39, 5288–5309. [Google Scholar] [CrossRef]
  21. Ferraz, A.; Bretar, F.; Jacquemoud, S.; Gonçalves, G.; Pereira, L.; Tomé, M.; Soares, P. 3-D mapping of a multi-layered Mediterranean forest using ALS data. Remote Sens. Environ. 2012, 121, 210–223. [Google Scholar] [CrossRef]
  22. Lee, H.; Slatton, K.C.; Roth, B.E.; Cropper, W.P. Adaptive clustering of airborne LiDAR data to segment individual tree crowns in managed pine forests. Int. J. Remote Sens. 2010, 31, 117–139. [Google Scholar] [CrossRef]
  23. Modzelewska, A.; Fassnacht, F.E.; Sterenczak, K. Tree species identification within an extensive forest area with diverse management regimes using airborne hyperspectral data. Int. J. Appl Earth Obs. Geoinf. 2020, 84, 101960. [Google Scholar] [CrossRef]
  24. Rana, P.; St-Onge, B.; Prieur, J.F.; Budei, B.C.; Tolvanen, A.; Tokola, T. Effect of feature standardization on reducing the requirements of field samples for individual tree species classification using ALS data. ISPRS J. Photogramm. Remote Sens. 2022, 184, 189–202. [Google Scholar] [CrossRef]
  25. Ke, Y.H.; Quackenbush, L.J. A review of methods for automatic individual tree-crown detection and delineation from passive remote sensing. Int. J. Remote Sens. 2011, 32, 4725–4747. [Google Scholar] [CrossRef]
  26. Hoeser, T.; Kuenzer, C. Object detection and image segmentation with deep learning on earth observation data: A review-part I: Evolution and recent trends. Remote Sens. 2020, 12, 1667. [Google Scholar] [CrossRef]
  27. Hao, Z.B.; Lin, L.L.; Post, C.J.; Mikhailova, E.A.; Li, M.H.; Yu, K.Y.; Liu, J.; Chen, Y. Automated tree-crown and height detection in a young forest plantation using mask region-based convolutional neural network (Mask R-CNN). ISPRS J. Photogramm. Remote Sens. 2021, 178, 112–123. [Google Scholar] [CrossRef]
  28. Ren, S.; He, K.; Girshick, R.B.; Sun, J. Faster R-CNN: Towards real-time object detection with region proposal networks. IEEE Trans. Pattern Anal. Mach. Intell. 2015, 39, 1137–1149. [Google Scholar] [CrossRef]
  29. Luo, M.; Tian, Y.A.; Zhang, S.W.; Huang, L.; Wang, H.Q.; Liu, Z.Q.; Yang, L. Individual tree detection in coal mine afforestation area based on improved Faster RCNN in UAV RGB images. Remote Sens. 2022, 14, 5545. [Google Scholar] [CrossRef]
  30. Xia, K.; Wang, H.; Yang, Y.H.; Du, X.C.; Feng, H.L. Automatic detection and parameter estimation of Ginkgo biloba in urban environment based on RGB Images. J. Sens. 2021, 2021, 6668934. [Google Scholar] [CrossRef]
  31. Beloiu, M.; Heinzmann, L.; Rehush, N.; Gessler, A.; Griess, V.C. Individual tree-crown detection and species identification in heterogeneous forests using aerial RGB imagery and deep learning. Remote Sens. 2023, 15, 1463. [Google Scholar] [CrossRef]
  32. Gan, Y.; Wang, Q.; Iio, A. Tree crown detection and delineation in a temperate deciduous forest from UAV RGB imagery using deep learning approaches: Effects of spatial resolution and species characteristics. Remote Sens. 2023, 15, 778. [Google Scholar] [CrossRef]
  33. Sirisha, U.; Praveen, S.P.; Srinivasu, P.N.; Barsocchi, P.; Bhoi, A.K. Statistical analysis of design aspects of various YOLO-based deep learning models for object detection. Int. J. Comput. Intell. Syst. 2023, 16, 126. [Google Scholar] [CrossRef]
  34. Redmon, J.; Divvala, S.K.; Girshick, R.B.; Farhadi, A. You Only Look Once: Unified, real-time object detection. In Proceedings of the 2016 IEEE Conference on Computer Vision and Pattern Recognition (CVPR), Las Vegas, NV, USA, 27–30 June 2016; pp. 779–788. [Google Scholar] [CrossRef]
  35. Liu, W.; Anguelov, D.; Erhan, D.; Szegedy, C.; Reed, S.E.; Fu, C.Y.; Berg, A.C. SSD: Single shot multibox detector. In Proceedings of the European Conference on Computer Vision, Amsterdam, The Netherlands, 11–14 October 2016. [Google Scholar] [CrossRef]
  36. Lin, T.Y.; Goyal, P.; Girshick, R.B.; He, K.; Dollár, P. Focal loss for dense object detection. In Proceedings of the 2017 IEEE International Conference on Computer Vision (ICCV), Venice, Italy, 22–29 October 2017; pp. 2999–3007. [Google Scholar] [CrossRef]
  37. Shen, Y.Y.; Liu, D.; Chen, J.Y.; Wang, Z.P.; Wang, Z.; Zhang, Q.L. On-board multi-class geospatial object detection based on convolutional neural network for High Resolution Remote Sensing Images. Remote Sens. 2023, 15, 3963. [Google Scholar] [CrossRef]
  38. Chen, Y.L.; Xu, H.L.; Zhang, X.J.; Gao, P.; Xu, Z.G.; Huang, X.B. An object detection method for bayberry trees based on an improved YOLO algorithm. Int. J. Digit. Earth 2023, 16, 781–805. [Google Scholar] [CrossRef]
  39. Wang, X.W.; Zhao, Q.Z.; Jiang, P.; Zheng, Y.C.; Yuan, L.M.Z.; Yuan, P.L. LDS-YOLO: A lightweight small object detection method for dead trees from shelter forest. Comput. Electron. Agric. 2022, 198, 107035. [Google Scholar] [CrossRef]
  40. Jintasuttisak, T.; Edirisinghe, E.; Elbattay, A. Deep neural network based date palm tree detection in drone imagery. Comput. Electron. Agric. 2022, 192, 106560. [Google Scholar] [CrossRef]
  41. Puliti, S.; Astrup, R. Automatic detection of snow breakage at single tree level using YOLOv5 applied to UAV imagery. Int. J. Appl. Earth Obs. Geoinf. 2022, 112, 102946. [Google Scholar] [CrossRef]
  42. Dong, C.; Cai, C.Y.; Chen, S.; Xu, H.; Yang, L.B.; Ji, J.Y.; Huang, S.Q.; Hung, I.K.; Weng, Y.H.; Lou, X.W. Crown width extraction of Metasequoia glyptostroboides using improved YOLOv7 based on UAV images. Drones 2023, 7, 336. [Google Scholar] [CrossRef]
  43. YOLO v8. Available online: https://github.com/ultralytics/ultralytics (accessed on 25 March 2023).
  44. Weinstein, B.G.; Marconi, S.; Bohlman, S.; Zare, A.; White, E. Individual tree-crown detection in RGB imagery using semi-supervised deep learning neural networks. Remote Sens. 2019, 11, 1309. [Google Scholar] [CrossRef]
  45. Perez, M.I.; Karelovic, B.; Molina, R.; Saavedra, R.; Cerulo, P.; Cabrera, G. Precision silviculture: Use of UAVs and comparison of deep learning models for the identification and segmentation of tree crowns in pine crops. Int. J. Digit. Earth 2022, 15, 2223–2238. [Google Scholar] [CrossRef]
  46. Choi, K.; Lim, W.; Chang, B.; Jeong, J.; Kim, I.; Park, C.R.; Ko, D.W. An automatic approach for tree species detection and profile estimation of urban street trees using deep learning and Google street view images. ISPRS J. Photogramm. Remote Sens. 2022, 190, 165–180. [Google Scholar] [CrossRef]
  47. Zhao, H.T.; Morgenroth, J.; Pearse, G.; Schindler, J. A systematic review of individual tree crown detection and delineation with convolutional neural networks (CNN). Curr. For. Rep. 2023, 9, 149–170. [Google Scholar] [CrossRef]
  48. Plesoianu, A.I.; Stupariu, M.S.; Sandric, I.; Patru-Stupariu, I.; Dragut, L. Individual tree-crown detection and species Classification in very high-resolution remote sensing imagery using a deep learning ensemble model. Remote Sens. 2020, 12, 2426. [Google Scholar] [CrossRef]
  49. Zhao, H.W.; Zhong, Y.F.; Wang, X.Y.; Hu, X.; Luo, C.; Boitt, M.; Piiroinen, R.; Zhang, L.P.; Heiskanen, J.; Pellikka, P. Mapping the distribution of invasive tree species using deep one-class classification in the tropical montane landscape of Kenya. ISPRS J. Photogramm. Remote Sens. 2022, 187, 328–344. [Google Scholar] [CrossRef]
  50. Zhong, H.; Lin, W.S.; Liu, H.R.; Ma, N.; Liu, K.K.; Cao, R.Z.; Wang, T.T.; Ren, Z.Z. Identification of tree species based on the fusion of UAV hyperspectral image and LiDAR data in a coniferous and broad-leaved mixed forest in Northeast China. Front. Plant Sci. 2022, 13, 964769. [Google Scholar] [CrossRef]
  51. Bai, Y.L.; Zhou, M.; Zhang, W.; Zhou, B.W.; Mei, T. Augmentation pathways network for visual recognition. IEEE Trans. Pattern Anal. Mach. Intell. 2023, 45, 10580–10587. [Google Scholar] [CrossRef]
  52. Guo, J.M.; Lou, H.T.; Chen, H.A.; Liu, H.Y.; Gu, J.S.; Bi, L.Y.; Duan, X.H. A new detection algorithm for alien intrusion on highway. Sci. Rep. 2023, 13, 10667. [Google Scholar] [CrossRef]
  53. Hazirbas, C.; Ma, L.; Domokos, C.; Cremers, D. FuseNet: Incorporating depth into semantic segmentation via fusion-based CNN architecture. In Proceedings of the Computer Vision—ACCV 2016, Taipei, Taiwan, 20–24 November 2016; pp. 213–228. [Google Scholar] [CrossRef]
  54. Sun, Y.M.; Cao, B.; Zhu, P.F.; Hu, Q.H. Drone-based RGB-Infrared cross-modality vehicle detection via uncertainty-aware learning. IEEE Trans. Circuits Syst. Video Technol. 2022, 32, 6700–6713. [Google Scholar] [CrossRef]
  55. Woo, S.; Park, J.; Lee, J.-Y.; Kweon, I.S. CBAM: Convolutional block attention module. In Proceedings of the Computer Vision—ECCV 2018, Munich, Germany, 8–14 September 2018; pp. 3–19. [Google Scholar] [CrossRef]
  56. Ma, N.; Zhang, X.; Zheng, H.-T.; Sun, J. ShuffleNet V2: Practical Guidelines for Efficient CNN Architecture Design. In Proceedings of the Computer Vision—ECCV 2018, Munich, Germany, 8–14 September 2018; pp. 122–138. [Google Scholar] [CrossRef]
  57. Wang, C.; He, W.; Nie, Y.; Guo, J.; Liu, C.; Han, K.; Wang, Y. Gold-YOLO: Efficient object detector via gather-and-distribute mechanism. arXiv 2023. [Google Scholar] [CrossRef]
  58. Niu, Y.; Cheng, W.; Shi, C.; Fan, S. YOLOv8-CGRNet: A lightweight object detection network leveraging context guidance and deep residual learning. Electronics 2024, 13, 43. [Google Scholar] [CrossRef]
  59. Yang, Y.; Zhang, G.; Ma, S.; Wang, Z.; Liu, H.; Gu, S. Potted phalaenopsis grading: Precise bloom and bud counting with the PA-YOLO algorithm and multiviewpoint imaging. Agronomy 2024, 14, 115. [Google Scholar] [CrossRef]
  60. Liu, B.; Wang, H.; Cao, Z.; Wang, Y.; Tao, L.; Yang, J.; Zhang, K. PRC-Light YOLO: An efficient lightweight model for fabric defect detection. Appl. Sci. 2024, 14, 938. [Google Scholar] [CrossRef]
  61. Wang, S.; Yan, B.; Xu, X.; Wang, W.; Peng, J.; Zhang, Y.; Wei, X.; Hu, W. Automated identification and localization of rail internal defects based on object detection networks. Appl. Sci. 2024, 14, 805. [Google Scholar] [CrossRef]
  62. Talaat, F.M.; ZainEldin, H. An improved fire detection approach based on YOLO-v8 for smart cities. Neural Comput. Appl. 2023, 35, 20939–20954. [Google Scholar] [CrossRef]
  63. Elmessery, W.M.; Gutiérrez, J.; Abd El-Wahhab, G.G.; Elkhaiat, I.A.; El-Soaly, I.S.; Alhag, S.K.; Al-Shuraym, L.A.; Akela, M.A.; Moghanm, F.S.; Abdelshafie, M.F. YOLO-based model for automatic detection of broiler pathological phenomena through visual and thermal images in intensive poultry houses. Agriculture 2023, 13, 1527. [Google Scholar] [CrossRef]
  64. Schiefer, F.; Kattenborn, T.; Frick, A.; Frey, J.; Schall, P.; Koch, B.; Schmidtlein, S. Mapping forest tree species in high resolution UAV-based RGB-imagery by means of convolutional neural networks. ISPRS J. Photogramm. Remote Sens. 2020, 170, 205–215. [Google Scholar] [CrossRef]
  65. Fricker, G.A.; Ventura, J.D.; Wolf, J.A.; North, M.P.; Davis, F.W.; Franklin, J. A convolutional neural network classifier identifies tree species in mixed-conifer forest from hyperspectral imagery. Remote Sens. 2019, 11, 2326. [Google Scholar] [CrossRef]
  66. Fu, Y.C.; Fan, J.F.; Xing, S.Y.; Wang, Z.; Jing, F.S.; Tan, M. Image segmentation of cabin assembly scene based on improved RGB-D Mask R-CNN. IEEE Trans. Instrum. Meas. 2022, 71, 5001512. [Google Scholar] [CrossRef]
  67. Xu, S.; Wang, R.; Shi, W.; Wang, X. Classification of tree species in transmission line corridors based on YOLO v7. Forests 2024, 15, 61. [Google Scholar] [CrossRef]
Figure 1. Overview of the study area. (a) represents the location map of the Northeast region. (b) is the RGB image with sample plots and (c) is the LiDAR point cloud data of the study area.
Forests 15 00293 g001
Figure 2. Overview of the UAV system.
Forests 15 00293 g002
Figure 3. Flowchart for individual tree species identification using deep learning combined with RGB images and LiDAR data.
Forests 15 00293 g003
Figure 4. Results of Partial Data Annotation. Different tree species are covered by rectangles of various colors, with the species information at the top left corner of each rectangle.
Forests 15 00293 g004
Figure 5. YOLO v8 model structure.
Forests 15 00293 g005
Figure 6. AMF GD YOLO v8 model structure.
Forests 15 00293 g006
Figure 7. Structure of the different data fusion modules. (a) represents a simple feature concatenation module. (b) represents a feature concatenation module that incorporates an attention mechanism. (c) represents a feature concatenation module that includes both attention mechanism and channel interaction.
Forests 15 00293 g007
Figure 8. Comparisons of the accuracy and efficiency of tree species identification at different scales and resolutions. (a) shows the trend of mAP accuracy. (b) displays the trend in model detection speed.
Forests 15 00293 g008
Figure 9. Data Transformation and Fusion Results. Specifically, image (a) is the RGB image, (bd) are the single-band images of R, G, B, respectively, (e) is the CHM image, (fh) are the 1st, 2nd, and 3rd components after PCA transformation, (i) is the PCA-D image combining PCA 1st and 2nd components with CHM, and (jl) are the D-GB, R-D-B, RG-D images combining R, G, B bands with CHM, respectively.
Forests 15 00293 g009
Figure 10. The results of tree species identification. Specifically, the left side of the figure displays instances of misidentification, where tree crowns and grassland are incorrectly detected. The right side shows cases of over-detection of tree crowns. (a1,a2) represent the original RGB image, (b1,b2) represent the CHM image, (c1,c2) display the detection results from YOLO v8, (d1,d2) exhibits the detection results from AMF GD YOLOv8 using both RGB and CHM images. The detailed differences are presented in (e1h1) and (e2h2).
Forests 15 00293 g010
Table 1. Tree species identification results with different modules.
ModelspRF1-ScoresmAP@50
Retina Net0.6230.5340.57555.1
SSD0.6450.5680.60461.2
Faster R-CNN0.6720.6470.65967.8
YOLO v5x0.7180.7010.70972.8
YOLO v8x0.7420.7220.73275.3
Table 2. Tree Species Identification Results with Different Data Fusion Methods.
DatapRF1-ScoresmAP@50
RGB0.7420.7220.73275.3
RG-D0.7280.7100.71974.8
D-GB0.7410.7290.73575.5
R-D-B0.7410.7210.73275.2
PCA-D0.7470.7390.74376.2
Table 3. The results of tree species identification.
DataNeckFusion ModuleBPPKJMLGFMPAUPOTmAP@50
RGBPAN-FPN-69.288.171.492.285.38769.939.875.3
RGBGD-69.888.472.592.68687.770.940.276.0
RGB + CHMPAN-FPN(a)73.79175.793.585.589.275.746.378.8
RGB + CHMPAN-FPN(b)7591.376.193.786.389.777.448.779.2
RGB + CHMPAN-FPN(c)75.791.476.593.78790.178.750.880.3
RGB + CHMGD(c)76.191.676.793.988.690.579.852.681.0
Disclaimer/Publisher’s Note: The statements, opinions and data contained in all publications are solely those of the individual author(s) and contributor(s) and not of MDPI and/or the editor(s). MDPI and/or the editor(s) disclaim responsibility for any injury to people or property resulting from any ideas, methods, instructions or products referred to in the content.