
Spruce Protection against Ips typographus with Anti-Attractant Blend of Tree-Based Semiochemicals: From Small Experimental Plots to Stand Scales

 ,
,  ,
,  ,
,  , , , ,
Abstract
1. Introduction
2. Methods
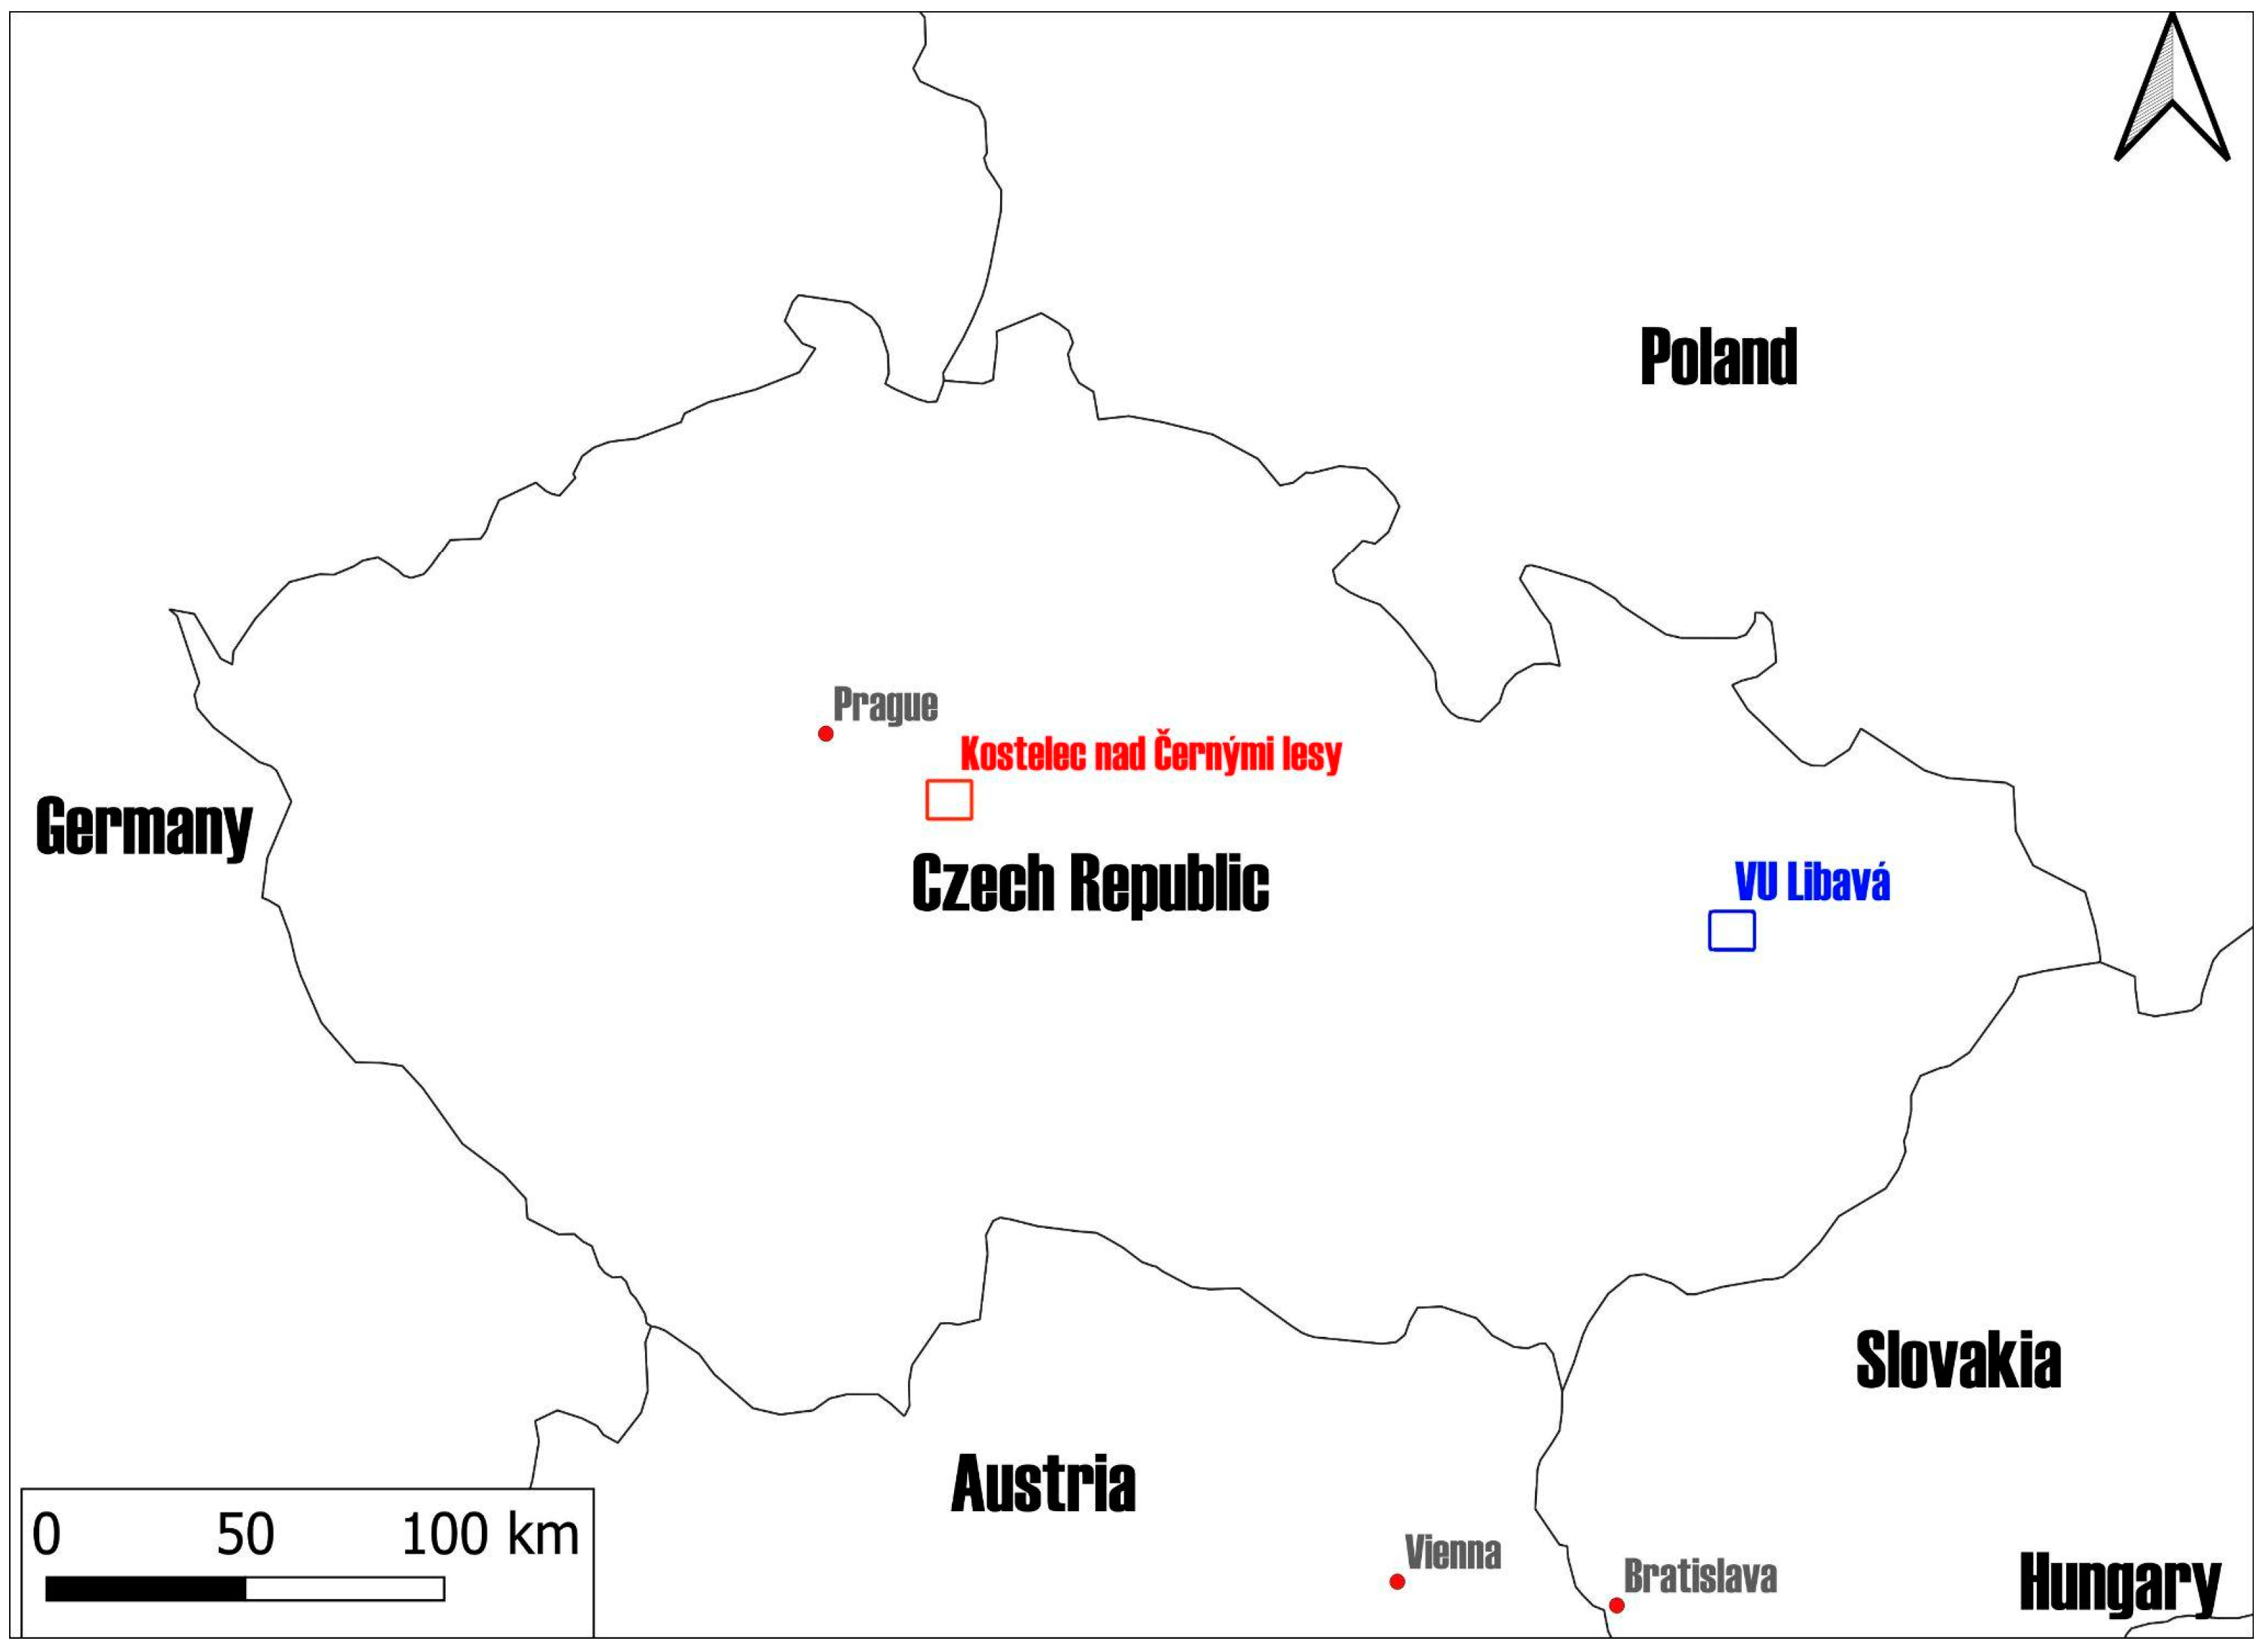
2.1. Study Areas
2.2. Dispensers
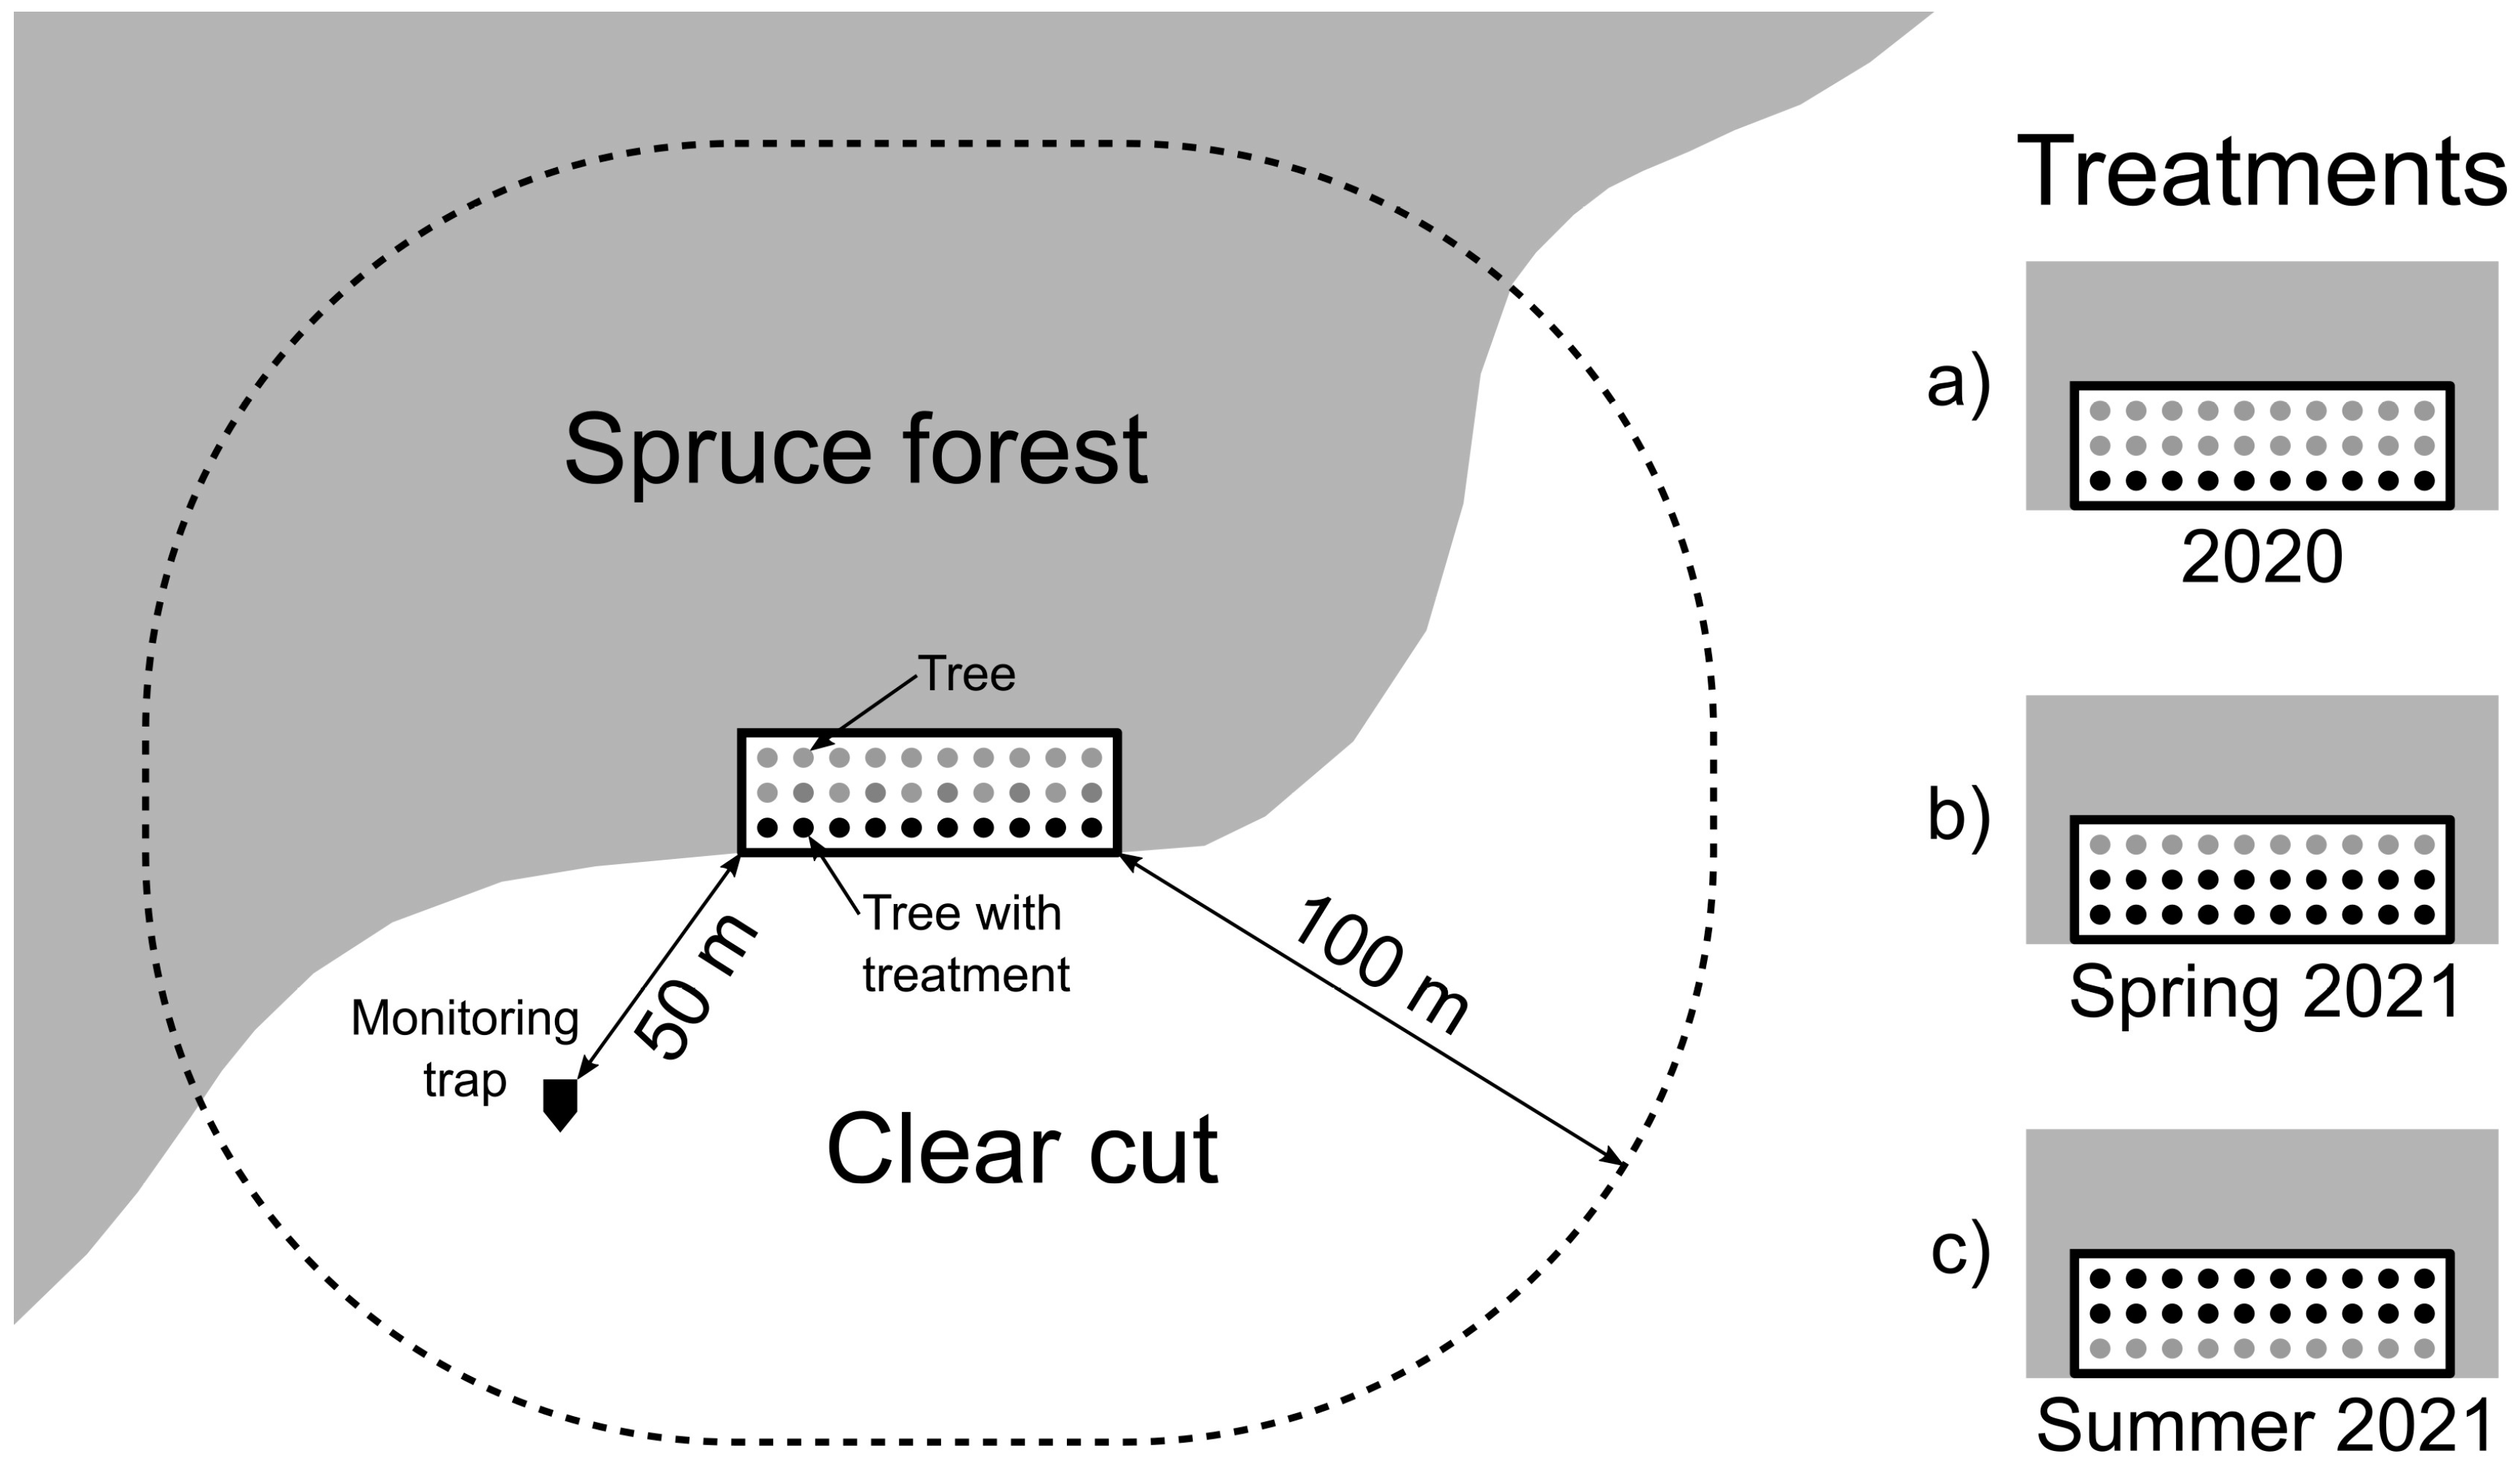
2.3. Experimental Design
2.3.1. Trapping Experiments
2.3.2. Tree Protection Experiments
Experiment 2020
Experiment 2021
2.4. Statistical Analysis
2.4.1. Trapping Experiments
2.4.2. Tree Protection Experiments
3. Results
3.1. Trapping Experiments
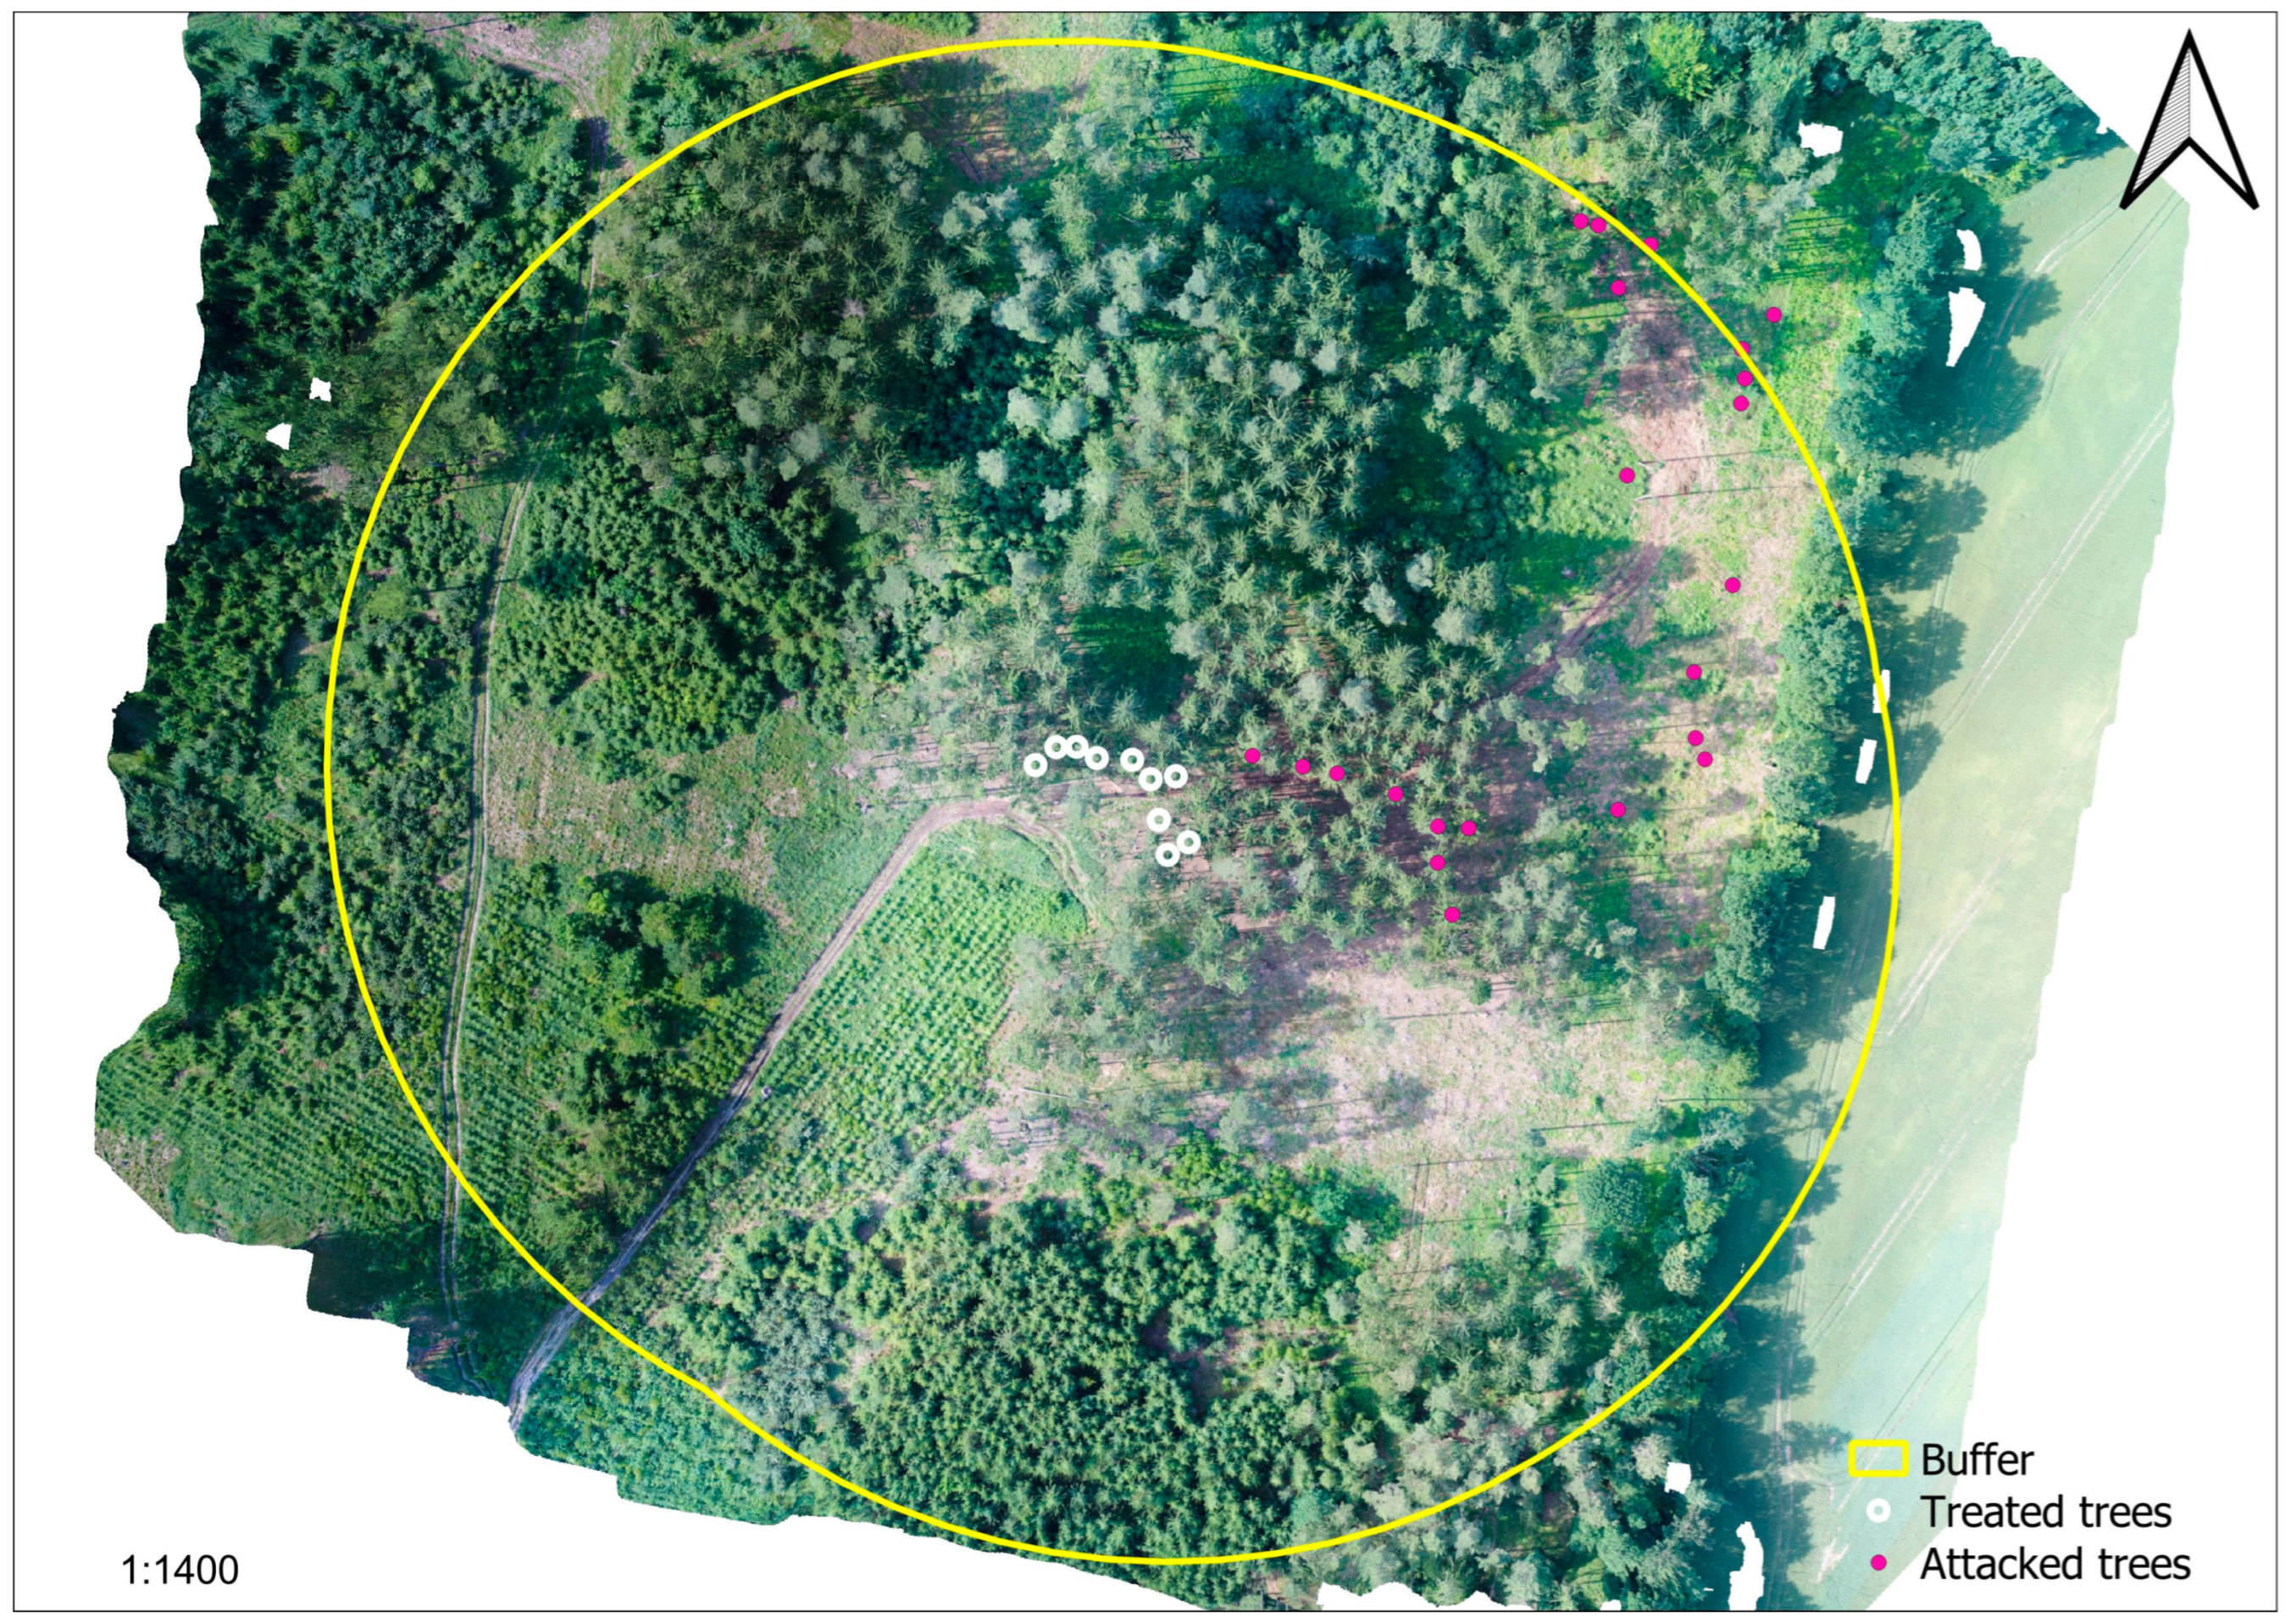
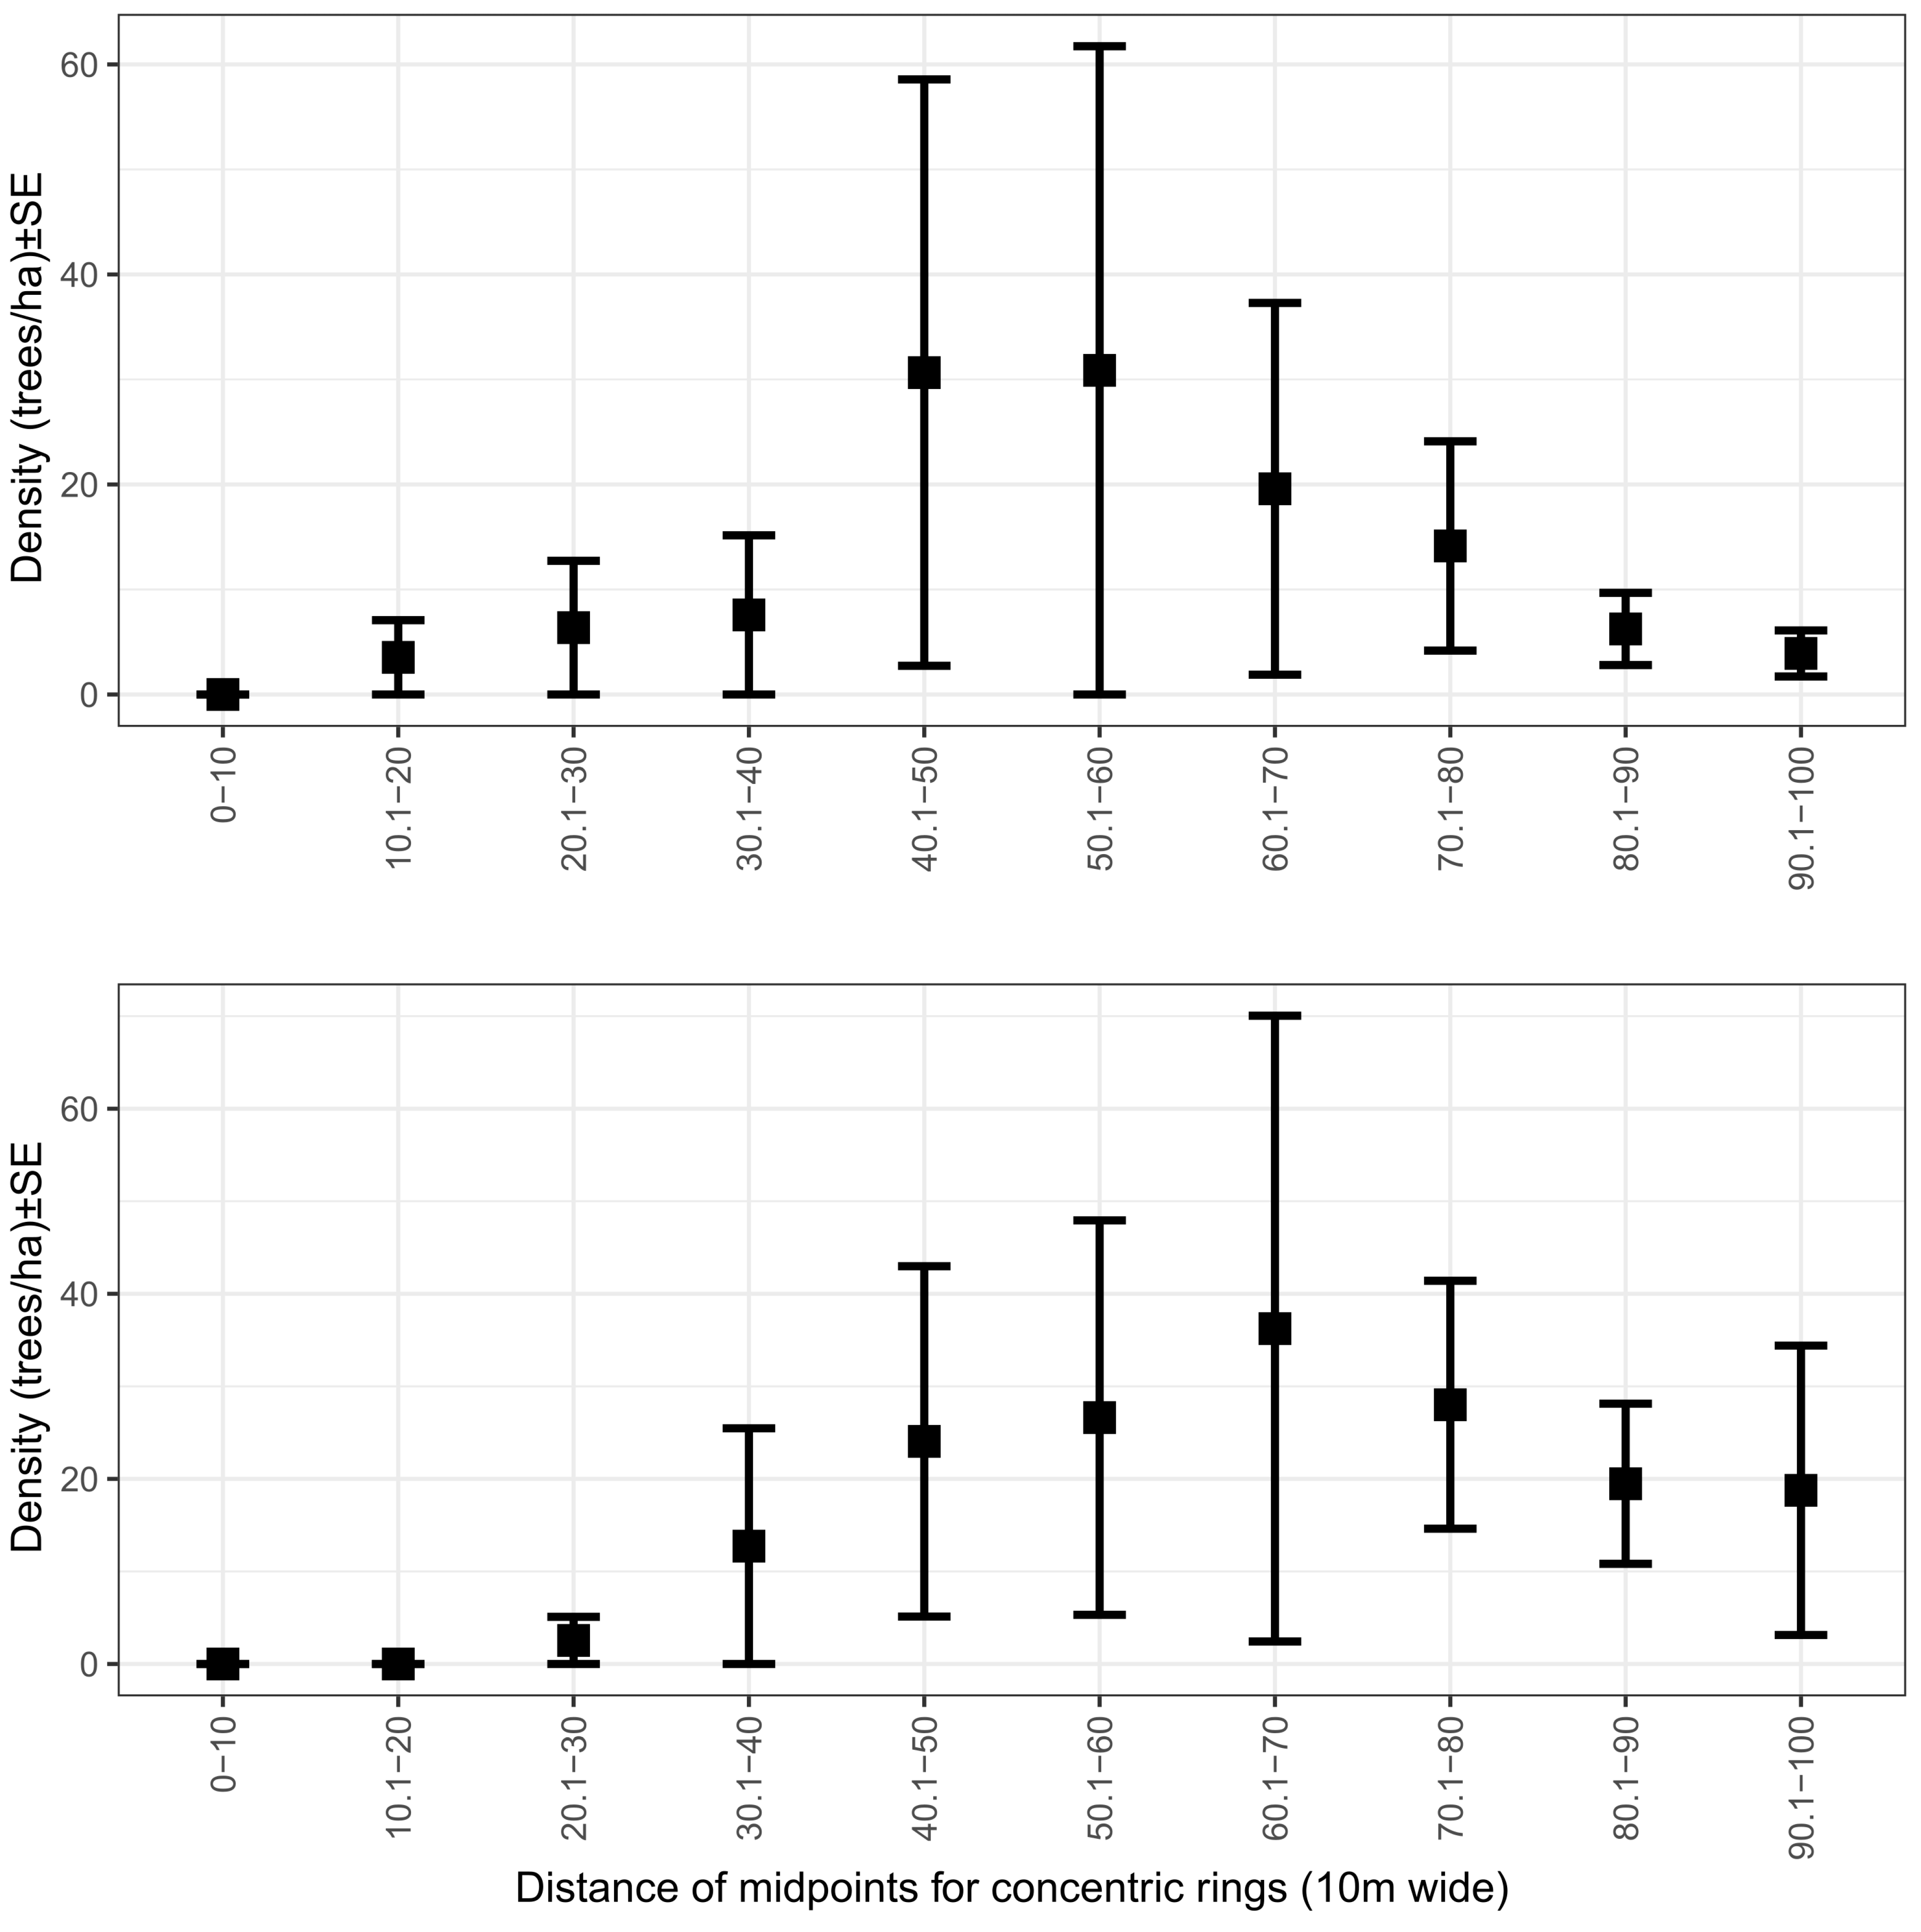
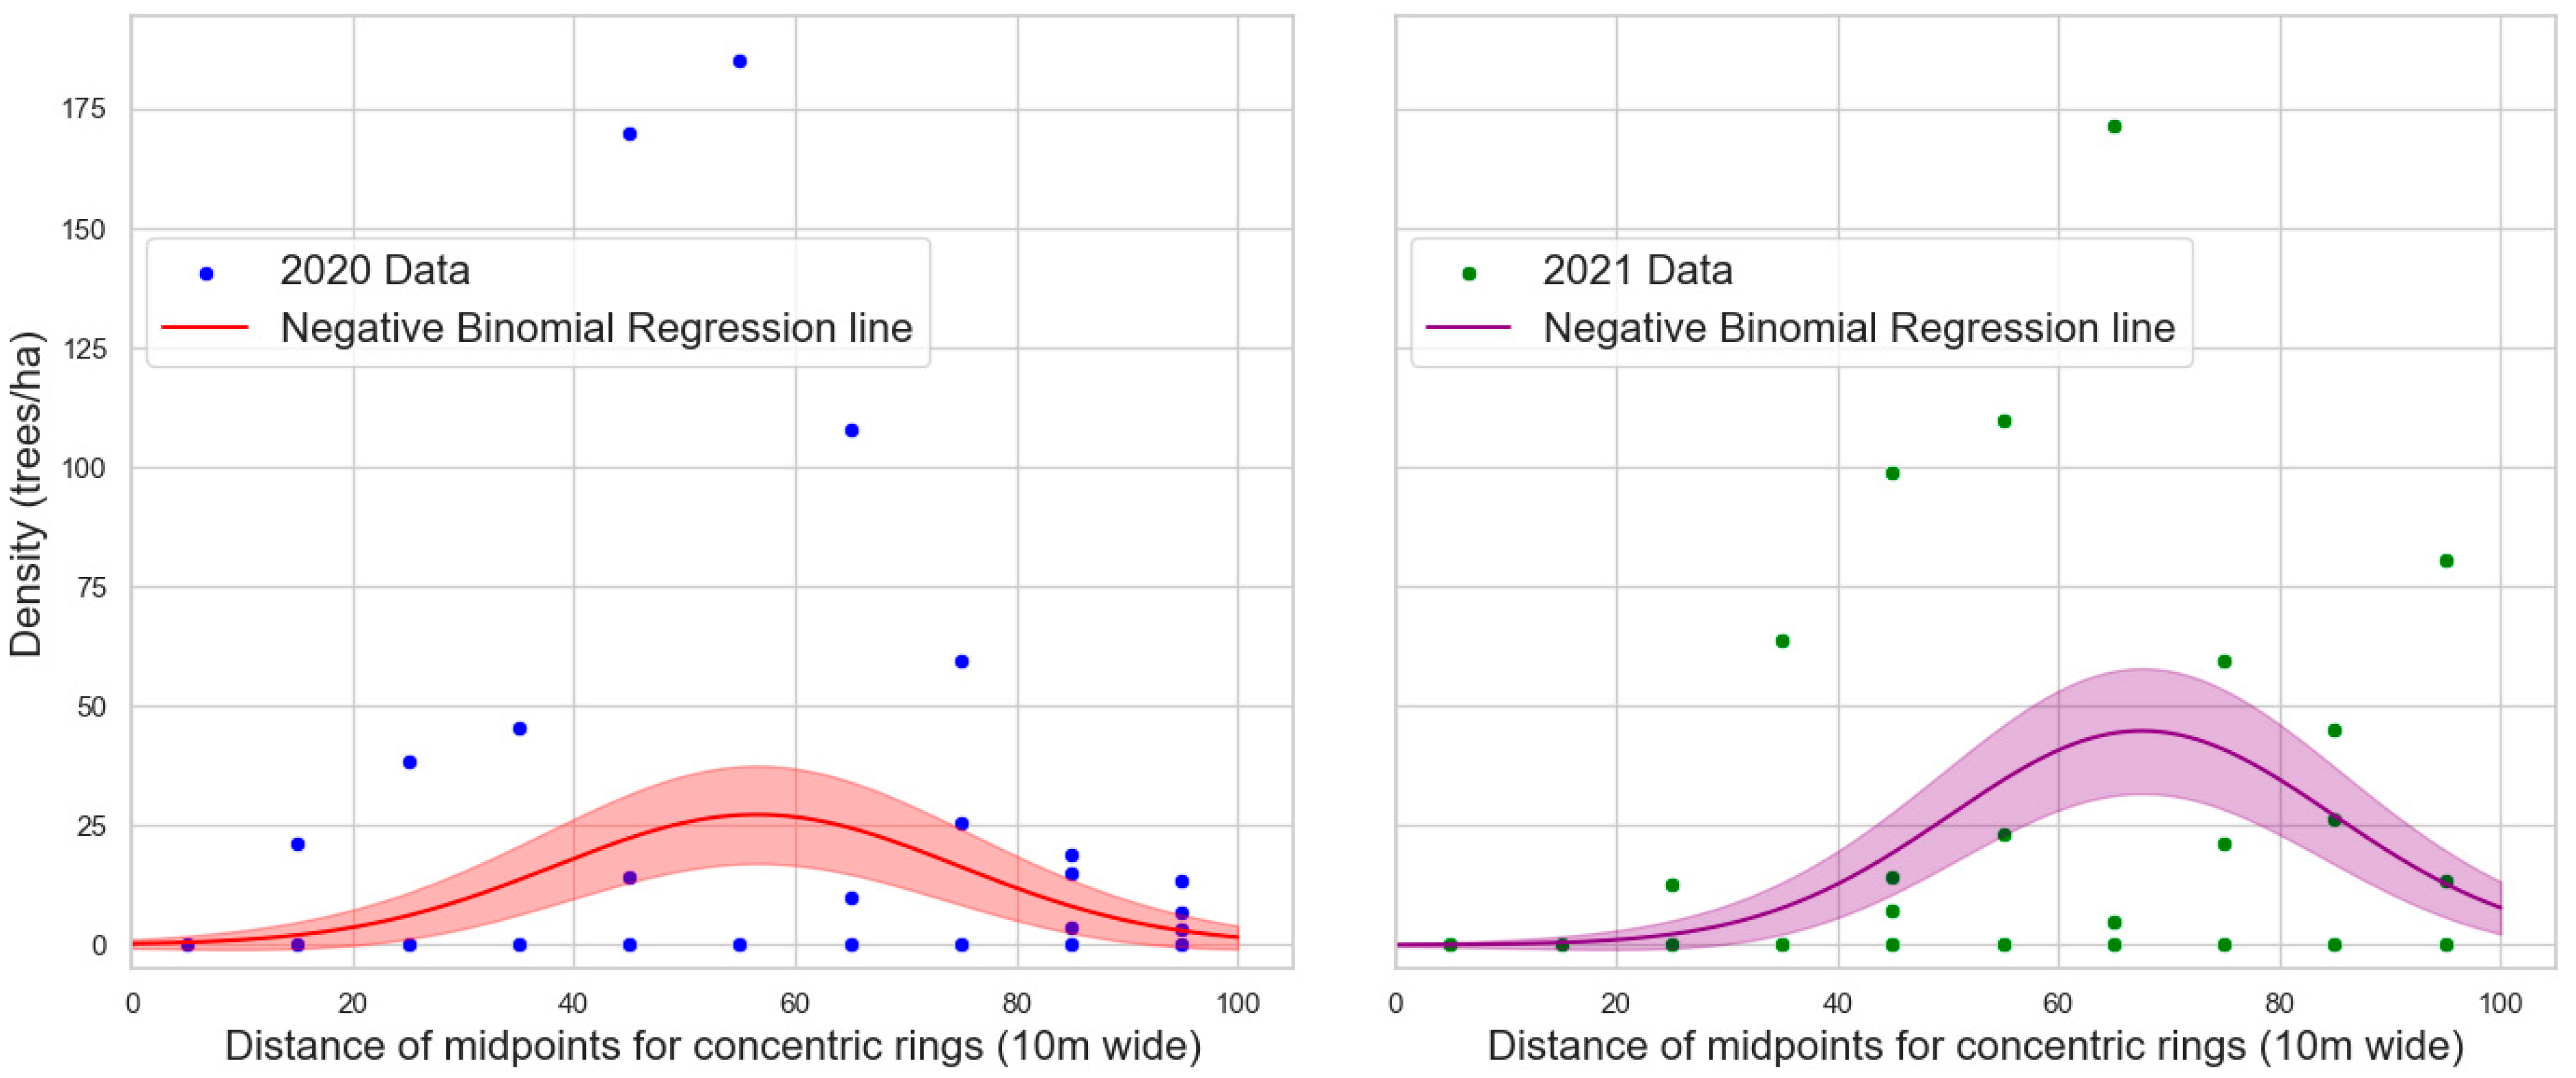
3.2. Tree Protection Experiments
3.2.1. Tree Mortality
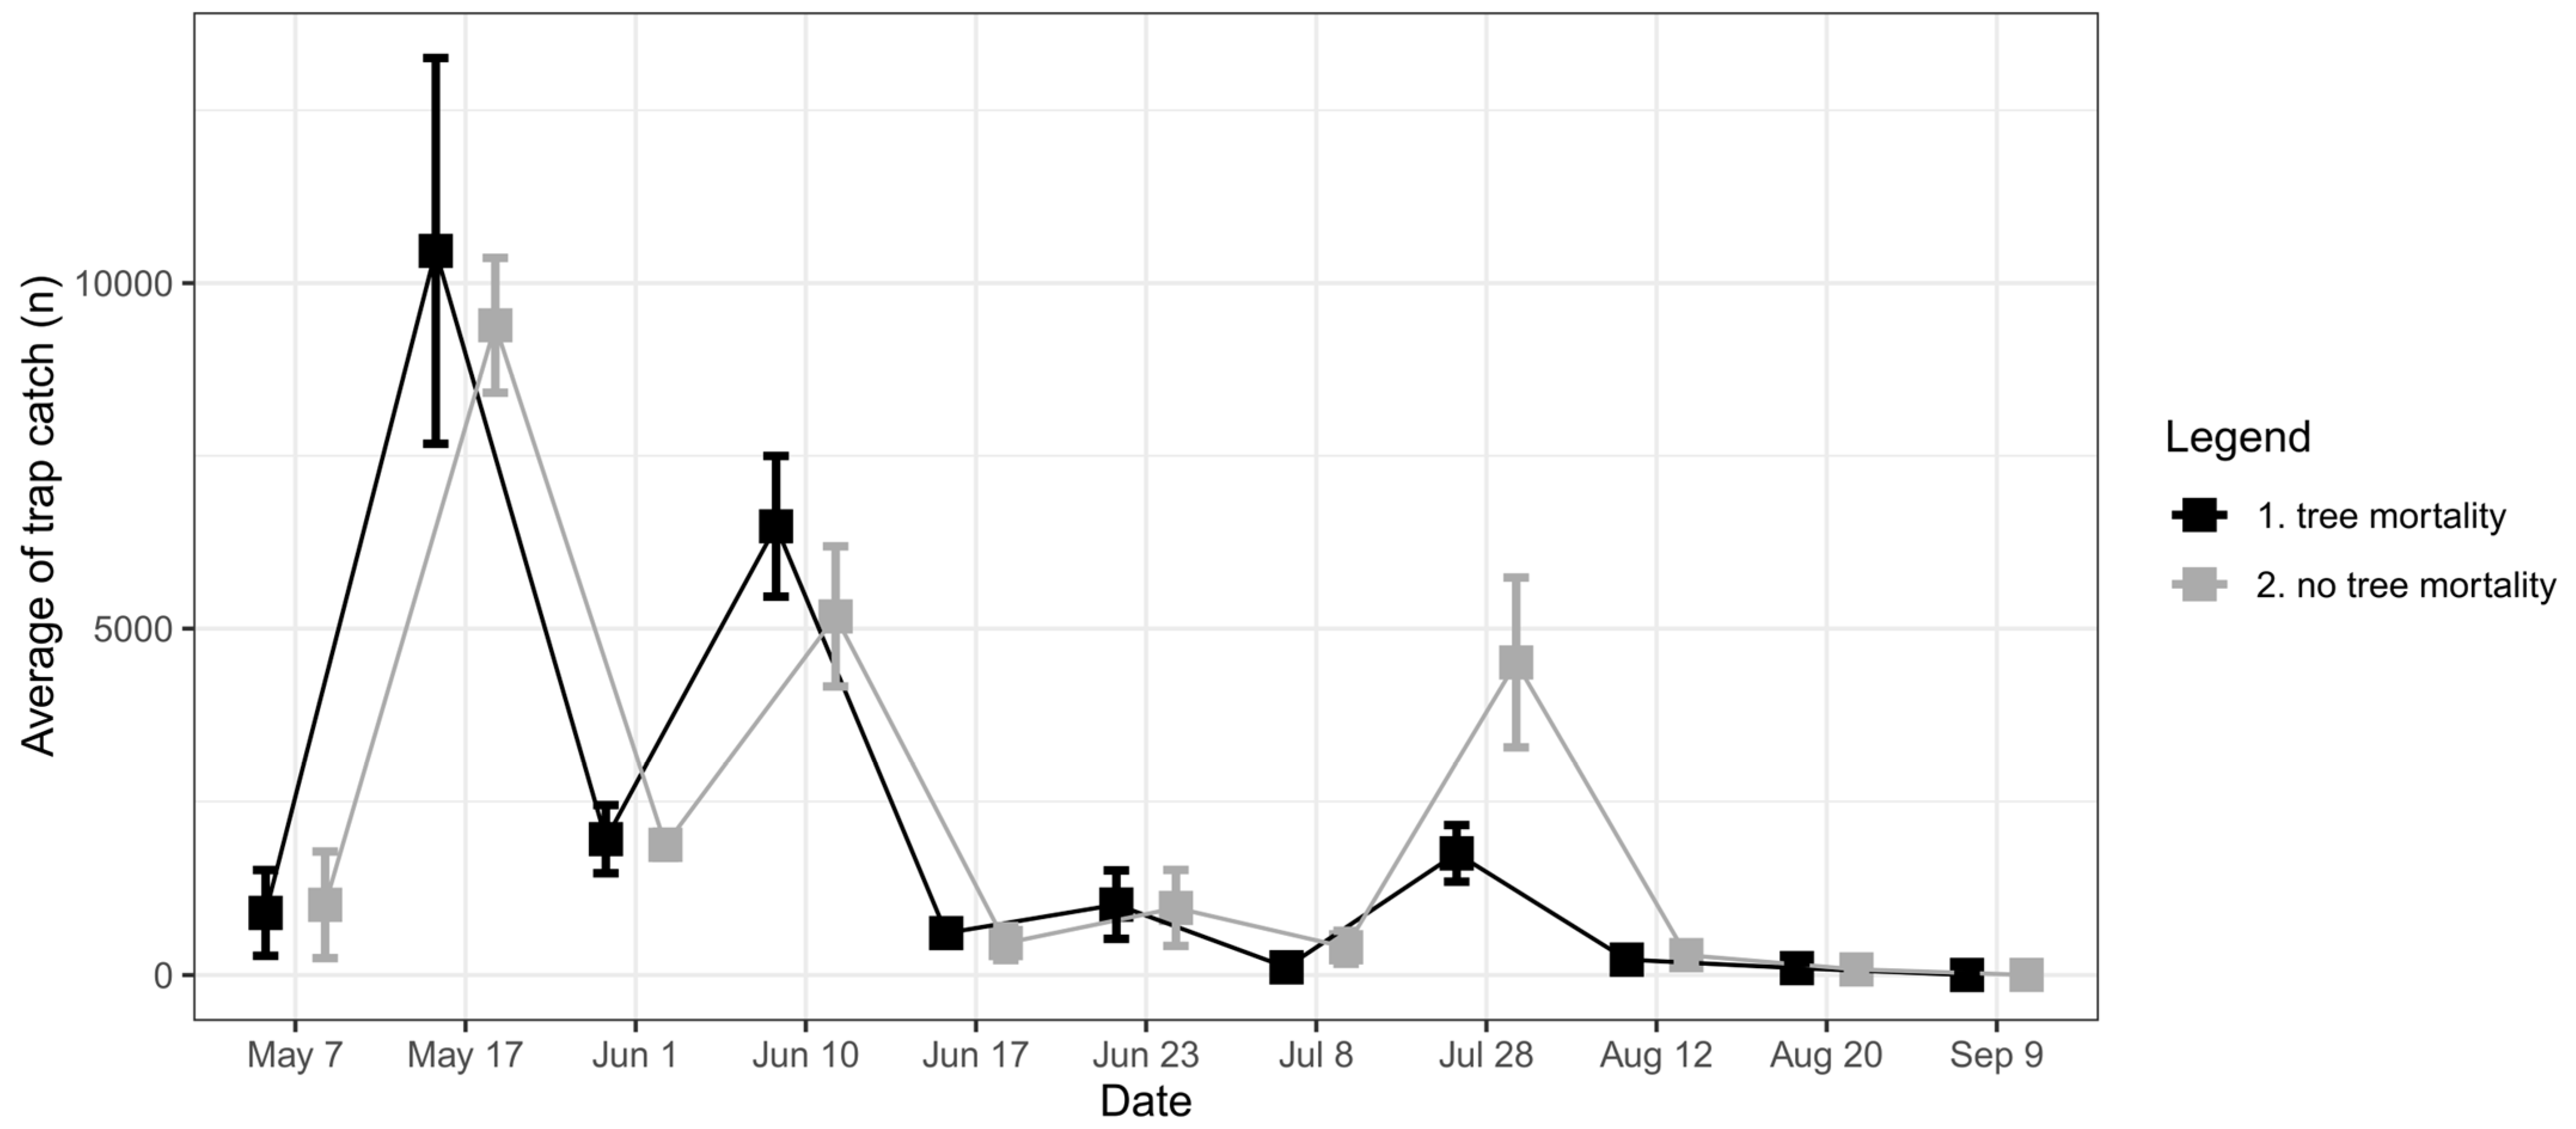
3.2.2. Monitoring Traps
4. Discussion
4.1. Effectiveness of Anti-Attractant Mixtures
4.2. Spillover Effect from Pheromone Traps
4.3. Switching Effect from Verbenone
4.4. Experimental Plot Design: Conventional Plots or Patterns over Distance?
4.5. Practical Implementations
5. Conclusions
Author Contributions
Funding
Data Availability Statement
Conflicts of Interest
References
- Wermelinger, B. Ecology and Management of the Spruce Bark Beetle Ips typographus—A Review of Recent Research. For. Ecol. Manag. 2004, 202, 67–82. [Google Scholar] [CrossRef]
- Gonzalez, R.; Grégoire, J.-C.; Drumont, A.; De Windt, N. A Sampling Technique to Estimate Within-tree Populations of Pre-emergent Ips typographus (Col., Scolytidae). J. Appl. Entomol. 1996, 120, 569–576. [Google Scholar] [CrossRef]
- Kautz, M.; Schopf, R.; Ohser, J. The “Sun-Effect”: Microclimatic Alterations Predispose Forest Edges to Bark Beetle Infestations. Eur. J. For. Res. 2013, 132, 453–465. [Google Scholar] [CrossRef]
- Doležal, P.; Sehnal, F. Effects of Photoperiod and Temperature on the Development and Diapause of the Bark Beetle Ips typographus. J. Appl. Entomol. 2007, 131, 165–173. [Google Scholar] [CrossRef]
- Jakuš, R. A Method for the Protection of Spruce Stands against Ips typographus by the Use of Barriers of Pheromone Traps in North-Eastern Slovakia. Anz. Für Schädlingskunde Pflanzenschutz Umweltschutz 1998, 71, 152–158. [Google Scholar] [CrossRef]
- Bakke, A. Mass Trapping of the Spruce Bark Beetle Ips typographus. Pheromone and Trap Technology. Medd Skogforsoeksves 1983, 38, 1–35. [Google Scholar]
- Vité, J.P. Erfahrungen und Erkenntnisse zur Akuten Gefährdung Des Mitteleuropäischen Fichtenwaldes Durch Käferbefall. Allg. Forstz. 1984, 39, 249–254. [Google Scholar]
- Vité, J.P. The European Struggle to Control Ips typographus-Past, Present and Future. Ecography 1989, 12, 520–525. [Google Scholar] [CrossRef]
- Weslien, J. Effects of Mass Trapping on Ips typographus (L.) Populations1. J. Appl. Entomol. 1992, 114, 228–232. [Google Scholar] [CrossRef]
- Niemeyer, H. Integrated Bark Beetle Control: Experiences and Problems in Northern Germany. USDA For. Serv. Gen. Tech. Rep. NE 1997, 236, 80–86. [Google Scholar]
- Faccoli, M.; Stergulc, F. Réduction Des Dégâts et Efficacité Des Dispositifs de Piégeage de Masse Pour La Protection Des Forêts Contre Le Typographe, Ips typographus (Coleoptera Curculionidae Scolytinae). Ann. For. Sci. 2008, 65, 309. [Google Scholar] [CrossRef]
- Zahradník, P.; Zahradníková, M. The Efficacy of a New Pheromone Trap Setup Design, Aimed for Trapping Ips typographus (Coleoptera, Curculionidae, Scolytinae). Šumar. List 2015, 139, 185–186. [Google Scholar]
- Ross, D.W.; Daterman, G.E. Efficacy of an antiaggregation pheromone for reducing Douglas fir beetle, Dendroctonus pseudotsugae Hopkins (Coleoptera: Scolytidae), infestation in high risk stands. Can. Entomol. 1995, 127, 805–811. [Google Scholar] [CrossRef]
- Schlyter, F. Semiochemical Diversity in Practice: Antiattractant Semiochemicals Reduce Bark Beetle Attacks on Standing Trees—A First Meta-Analysis. Psyche J. Entomol. 2012, 2012, 268621. [Google Scholar] [CrossRef]
- Cook, S.M.; Khan, Z.R.; Pickett, J.A. The Use of Push-Pull Strategies in Integrated Pest Management. Annu. Rev. Entomol. 2007, 52, 375–400. [Google Scholar] [CrossRef] [PubMed]
- Seybold, S.J.; Bentz, B.J.; Fettig, C.J.; Lundquist, J.E.; Progar, R.A.; Gillette, N.E. Management of Western North American Bark Beetles with Semiochemicals. Annu. Rev. Entomol. 2018, 63, 407–432. [Google Scholar] [CrossRef] [PubMed]
- Ross, D.W.; Daterman, G.E. Reduction of Douglas-Fir Beetle Infestation of High-Risk Stands by Antiaggregation and Aggregation Pheromones. Can. J. For. Res. 1994, 24, 2184–2190. [Google Scholar] [CrossRef]
- Borden, J.H.; Birmingham, A.L.; Burleigh, J.S. Evaluation of the Push-Pull Tactic against the Mountain Pine Beetle Using Verbenone and Non-Host Volatiles in Combination with Pheromone-Baited Trees. For. Chron. 2006, 82, 579–590. [Google Scholar] [CrossRef]
- Gillette, N.E.; Mehmel, C.J.; Mori, S.R.; Webster, J.N.; Wood, D.L.; Erbilgin, N.; Owen, D.R. The Push-Pull Tactic for Mitigation of Mountain Pine Beetle (Coleoptera: Curculionidae) Damage in Lodgepole and Whitebark Pines. Environ. Entomol. 2012, 41, 1575–1586. [Google Scholar] [CrossRef]
- Jakuš, R.; Schlyter, F.; Zhang, Q.-H.; Blaženec, M.; Vaverčák, R.; Grodzki, W.; Brutovský, D.; Lajzová, E.; Turčáni, M.; Bengtsson, M.; et al. Overview of Development of an Anti-attractant Based Technology for Spruce Protection against Ips typographus: From Past Failures to Future Success. Anz. Für Schädlingskunde 2003, 76, 89–99. [Google Scholar] [CrossRef]
- Schiebe, C.; Blaženec, M.; Jakuš, R.; Unelius, C.R.; Schlyter, F. Semiochemical Diversity Diverts Bark Beetle Attacks from Norway Spruce Edges: NHV Interfere with Bark Beetles’ Host Finding. J. Appl. Entomol. 2011, 135, 726–737. [Google Scholar] [CrossRef]
- Deganutti, L.; Biscontin, F.; Bernardinelli, I.; Faccoli, M. The Semiochemical Push-and-pull Technique Can Reduce Bark Beetle Damage in Disturbed Norway Spruce Forests Affected by the Vaia Storm. Agric. For. Entomol. 2023, 26, afe.12600. [Google Scholar] [CrossRef]
- Birgersson, G.; Leufvén, A. The Influence of Host Tree Response to Ips typographus and Fungal Attack on Production of Semiochemicals. Insect Biochem. 1988, 18, 761–770. [Google Scholar] [CrossRef]
- Zhang, Q.; Schlyter, F. Olfactory Recognition and Behavioural Avoidance of Angiosperm Nonhost Volatiles by Conifer-inhabiting Bark Beetles. Agric. For. Entomol. 2004, 6, 1–20. [Google Scholar] [CrossRef]
- Zhang, Q.-H.; Birgersson, G.; Zhu, J.; Löfstedt, C.; Löfqvist, J.; Schlyter, F. Leaf Volatiles from Nonhost Deciduous Trees: Variation by Tree Species, Season and Temperature, and Electrophysiological Activity in Ips typographus. J. Chem. Ecol. 1999, 25, 1923–1943. [Google Scholar] [CrossRef]
- Andersson, M.N.; Larsson, M.C.; Blaženec, M.; Jakuš, R.; Zhang, Q.-H.; Schlyter, F. Peripheral Modulation of Pheromone Response by Inhibitory Host Compound in a Beetle. J. Exp. Biol. 2010, 213, 3332–3339. [Google Scholar] [CrossRef]
- Binyameen, M.; Jankuvová, J.; Blaženec, M.; Jakuš, R.; Song, L.; Schlyter, F.; Andersson, M.N. Co-localization of Insect Olfactory Sensory Cells Improves the Discrimination of Closely Separated Odour Sources. Funct. Ecol. 2014, 28, 1216–1223. [Google Scholar] [CrossRef]
- Kalinová, B.; Břízová, R.; Knížek, M.; Turčáni, M.; Hoskovec, M. Volatiles from Spruce Trap-Trees Detected by Ips typographus Bark Beetles: Chemical and Electrophysiological Analyses. Arthropod-Plant Interact. 2014, 8, 305–316. [Google Scholar] [CrossRef]
- Blažytė-Čereškienė, L.; Apšegaitė, V.; Radžiutė, S.; Mozūraitis, R.; Būda, V.; Pečiulytė, D. Electrophysiological and Behavioural Responses of Ips typographus (L.) to Trans-4-Thujanol—A Host Tree Volatile Compound. Ann. For. Sci. 2015, 73, 247–256. [Google Scholar] [CrossRef]
- Schiebe, C.; Unelius, C.R.; Ganji, S.; Binyameen, M.; Birgersson, G.; Schlyter, F. Styrene, (+)-Trans-(1R,4S,5S)-4-Thujanol and Oxygenated Monoterpenes Related to Host Stress Elicit Strong Electrophysiological Responses in the Bark Beetle Ips typographus. J. Chem. Ecol. 2019, 45, 474–489. [Google Scholar] [CrossRef] [PubMed]
- Jirošová, A.; Kalinová, B.; Modlinger, R.; Jakuš, R.; Unelius, C.R.; Blaženec, M.; Schlyter, F. Anti-Attractant Activity of (+)-Trans-4-Thujanol for Eurasian Spruce Bark Beetle Ips typographus: Novel Potency for Females. Pest Manag. Sci. 2022, 78, 1992–1999. [Google Scholar] [CrossRef] [PubMed]
- Jakuš, R.; Dudová, A. Experimental Use of Aggregation and Anti-Aggregation Pheromones against the Spruce Bark Beetle (Ips typographus) in Decaying Spruce Stands with a Lower Level of Canopy Closure. J. For. Sci.-UZPI Czech Repub. 1999, 45, 525–531. [Google Scholar]
- Jakuš, R.; Modlinger, R.; Kašpar, J.; Majdák, A.; Blaženec, M.; Korolyova, N.; Jirošová, A.; Schlyter, F. Testing the Efficiency of the Push-and-Pull Strategy during Severe Ips typographus Outbreak and Extreme Drought in Norway Spruce Stands. Forests 2022, 13, 2175. [Google Scholar] [CrossRef]
- Hurlbert, S.H. Pseudoreplication and the Design of Ecological Field Experiments. Ecol. Monogr. 1984, 54, 187–211. [Google Scholar] [CrossRef]
- Schlyter, F.; Birgersson, G.; Leufvén, A. Inhibition of Attraction to Aggregation Pheromone by Verbenone and Ipsenol: Density Regulation Mechanisms in Bark beetle Ips typographus. J. Chem. Ecol. 1989, 15, 2263–2277. [Google Scholar] [CrossRef] [PubMed]
- Frühbrodt, T.; Schebeck, M.; Andersson, M.N.; Holighaus, G.; Kreuzwieser, J.; Burzlaff, T.; Delb, H.; Biedermann, P.H.W. Verbenone—The Universal Bark Beetle Repellent? Its Origin, Effects, and Ecological Roles. J. Pest Sci. 2023, 97, 35–71. [Google Scholar] [CrossRef]
- Jakuš, R.; Blaženec, M.; Vojtěch, O. Use of Anti-Attractants in Specific Conditions of Protected Areas. Folia Oecologica 2011, 38, 46–51. [Google Scholar]
- Gillette, N.E.; Erbilgin, N.; Webster, J.N.; Pederson, L.; Mori, S.R.; Stein, J.D.; Owen, D.R.; Bischel, K.M.; Wood, D.L. Aerially Applied Verbenone-Releasing Laminated Flakes Protect Pinus Contorta Stands from Attack by Dendroctonus ponderosae in California and Idaho. For. Ecol. Manag. 2009, 257, 1405–1412. [Google Scholar] [CrossRef]
- Gillette, N.E.; Mehmel, C.J.; Webster, J.N.; Mori, S.R.; Erbilgin, N.; Wood, D.L.; Stein, J.D. Aerially Applied Methylcyclohexenone-Releasing Flakes Protect Pseudotsuga Menziesii Stands from Attack by Dendroctonus Pseudotsugae. For. Ecol. Manag. 2009, 257, 1231–1236. [Google Scholar] [CrossRef]
- Tolasz, R. Atlas podnebí Česka, 1st ed.; Univerzita Palackého: Olomouc, Czech Republic, 2007; ISBN 978-80-86690-26-1. [Google Scholar]
- Remeš, J. The University Forest Enterprise in Kostelec Nad Černỳmi Lesy–a Basis for Practical Education and Research at the Faculty of Forestry and Wood Sciences in Prague. For. Univ. Educ. Ex. Exp. 2017, 17–22. [Google Scholar]
- Buras, A.; Rammig, A.; Zang, C.S. Quantifying Impacts of the 2018 Drought on European Ecosystems in Comparison to 2003. Biogeosciences 2020, 17, 1655–1672. [Google Scholar] [CrossRef]
- Hlásny, T.; Zimová, S.; Merganičová, K.; Štěpánek, P.; Modlinger, R.; Turčáni, M. Devastating Outbreak of Bark Beetles in the Czech Republic: Drivers, Impacts, and Management Implications. For. Ecol. Manag. 2021, 490, 119075. [Google Scholar] [CrossRef]
- Cameron, A.C.; Trivedi, P.K. Regression Analysis of Count Data; Cambridge University Press: Cambridge, UK, 2013; ISBN 978-1-139-01356-7. [Google Scholar]
- VanRossum, G.; Drake, F.L. The Python Language Reference; Python Software Foundation: Amsterdam, The Netherlands, 2010; Volume 561. [Google Scholar]
- Anderbrant, O.; Schlyter, F.; Löfqvist, J. Dynamics of Tree Attack in The Bark Beetle Ips typographus under Semi-Epidemic Conditions. In Proceedings of the IUFRO Working Party and XVII International Congress of Entomology Symposium; Payne, T.L., Saarenmaa, H., Eds.; Integrated Control of Scolytid Bark Beetles: Vancouver, BC, Canada, 1988; pp. 35–49. [Google Scholar]
- Kaminska, A. Spatial autocorrelation based on remote sensing data in monitoring of Norway spruce dieback caused by the European spruce bark beetle Ips typographus L. in the Białowieża Forest. Sylwan 2022, 166, 719–732. [Google Scholar]
- Pirtskhalava-Karpova, N.; Trubin, A.; Karpov, A.; Jakuš, R. Drought Initialised Bark Beetle Outbreak in Central Europe: Meteorological Factors and Infestation Dynamic. For. Ecol. Manag. 2024; in print. [Google Scholar]


| Semiochemicals | Load Weight (mg/Dispenser) | ||
|---|---|---|---|
| Type, Source | Name | Year 2020 | Year 2021 |
| NHV, leaf | 1-hexanol | 1025 | 1012 |
| NHV, bark | 1-octene-3-ol | 1025 | 1012 |
| Anti-attractant, host bark | 1,8-cineol | 1537 | 1517 |
| NHV, bark | 3-octanol | 1522 | 1517 |
| NHV, bark | trans-conophthorin | 15 | 15 |
| Anti-attractant, host bark | trans-4-thujanol | - | 51 |
| Total | 5124 | 5124 | |
| Plot | Used in | Geoposition | Elevation (m) | Edge Orient. | Stand Age (Years) | Average DBH (cm) | ||
|---|---|---|---|---|---|---|---|---|
| 2020 | 2021 | Latitude | Longitude | |||||
| A | yes | yes | 49°58′10.44″ N | 14°49′42.95″ E | 419 | N | 87 | 45 |
| B | yes | yes | 49°58′8.17″ N | 14°51′18.46″ E | 412 | NE | 128 | 34 |
| C | yes | yes | 49°57′34.62″ N | 14°49′37.90″ E | 401 | N | 128 | 42 |
| D | yes | yes | 49°55′37.17″ N | 14°50′59.90″ E | 394 | SW | 85 | 45 |
| E | yes | yes | 49°54′56.07″ N | 14°52′38.25″ E | 431 | S | 85 | 41 |
| F | yes | yes | 49°56′4.48″ N | 14°52′36.26″ E | 389 | N | 107 | 47 |
| G | yes | yes | 49°56′14.61″ N | 14°52′10.08″ E | 449 | S | 93 | 48 |
| H | yes | no | 49°56′18.75″ N | 14°54′48.33″ E | 442 | S | 92 | 34 |
| I | yes | yes | 49°55′28.35″ N | 14°53′4.15″ E | 397 | N | 86 | 42 |
| J | yes | no | 49°56′9.88″ N | 14°54′21.81″ E | 438 | SW | 97 | 46 |
| K | yes | yes | 49°55′0.36″ N | 14°54′52.33″ E | 371 | SW | 138 | 39 |
| L | yes | no | 49°54′22.90″ N | 14°55′43.03″ E | 350 | SE | 122 | 33 |
| Plot | Bark Beetle-Killed Trees | |
|---|---|---|
| 2020 | 2021 | |
| A | 0 | 6 |
| B | 5 | 2 |
| C | 14 | 0 |
| D | 4 | 0 |
| E | 0 | 12 |
| F | 2 | 105 |
| G | 0 | 47 |
| H | 0 | 0 |
| I | 2 | 0 |
| J | 101 | - |
| K | 0 | 0 |
| L | 0 | - |
| Parameter | Coefficient | Standard Error | p-Value |
|---|---|---|---|
| Intercept | −1.5004 | 0.558 | 0.007 |
| distance_midpoint | 0.17 | 0.024 | <0.0001 |
| distance_midpoint squared | −0.0015 | 0.000 | <0.0001 |
| Parameter | Coefficient | Standard Error | p-Value |
|---|---|---|---|
| Intercept | −3.7793 | 0.888 | <0.0001 |
| distance_midpoint | 0.2245 | 0.034 | <0.0001 |
| distance_midpoint squared | −0.0017 | 0.000 | <0.0001 |
Disclaimer/Publisher’s Note: The statements, opinions and data contained in all publications are solely those of the individual author(s) and contributor(s) and not of MDPI and/or the editor(s). MDPI and/or the editor(s) disclaim responsibility for any injury to people or property resulting from any ideas, methods, instructions or products referred to in the content. |
© 2024 by the authors. Licensee MDPI, Basel, Switzerland. This article is an open access article distributed under the terms and conditions of the Creative Commons Attribution (CC BY) license (https://creativecommons.org/licenses/by/4.0/).
Share and Cite
Jakuš, R.; Trubin, A.; Singh, V.V.; Zabihi, K.; Jirošová, A.; Modlinger, R.; Majdák, A.; Korolyova, N.; Moliterno, A.A.C.; Kašpar, J.; et al. Spruce Protection against Ips typographus with Anti-Attractant Blend of Tree-Based Semiochemicals: From Small Experimental Plots to Stand Scales. Forests 2024, 15, 356. https://doi.org/10.3390/f15020356
Jakuš R, Trubin A, Singh VV, Zabihi K, Jirošová A, Modlinger R, Majdák A, Korolyova N, Moliterno AAC, Kašpar J, et al. Spruce Protection against Ips typographus with Anti-Attractant Blend of Tree-Based Semiochemicals: From Small Experimental Plots to Stand Scales. Forests. 2024; 15(2):356. https://doi.org/10.3390/f15020356
Chicago/Turabian StyleJakuš, Rastislav, Aleksei Trubin, Vivek Vikram Singh, Khodabakhsh Zabihi, Anna Jirošová, Roman Modlinger, Andrej Majdák, Nataliya Korolyova, Antonioni Acacio Campos Moliterno, Jaroslav Kašpar, and et al. 2024. "Spruce Protection against Ips typographus with Anti-Attractant Blend of Tree-Based Semiochemicals: From Small Experimental Plots to Stand Scales" Forests 15, no. 2: 356. https://doi.org/10.3390/f15020356
APA StyleJakuš, R., Trubin, A., Singh, V. V., Zabihi, K., Jirošová, A., Modlinger, R., Majdák, A., Korolyova, N., Moliterno, A. A. C., Kašpar, J., Slavík, M., Surový, P., Turčáni, M., & Schlyter, F. (2024). Spruce Protection against Ips typographus with Anti-Attractant Blend of Tree-Based Semiochemicals: From Small Experimental Plots to Stand Scales. Forests, 15(2), 356. https://doi.org/10.3390/f15020356