
Potential Distribution Projections for Senegalia senegal (L.) Britton under Climate Change Scenarios
by
 , ,
, ,
Jiaqi Fang
1,2,
Jianfei Shi
1,2,
Ping Zhang
1,2,
Minghao Shao
1,2,
Na Zhou
1,*,
Yongdong Wang
1 and
Xinwen Xu
1 1
Xinjiang Institute of Ecology and Geography, Chinese Academy of Sciences, Urumqi 830011, China
2
University of Chinese Academy of Sciences, Beijing 100049, China
*
Author to whom correspondence should be addressed.
Forests 2024, 15(2), 379; https://doi.org/10.3390/f15020379
Submission received: 14 January 2024
/
Revised: 9 February 2024
/
Accepted: 12 February 2024
/
Published: 18 February 2024
(This article belongs to the Section Forest Meteorology and Climate Change)
Abstract
:The gum acacia Senegalia senegal (L.) Britton (Fabales: Fabaceae) is a drought-tolerant plant belonging to the genus Acacia of the Leguminosae family, possessing significant economic and ecological value. Despite its importance, there is a knowledge gap regarding the potential impact of climate change on the distribution of S. senegal, crucial for the conservation of plant resources and optimizing its use in introductory silviculture. In this study, we selected 23 environmental variables and utilized the optimized maximum entropy (MaxEnt) model to analyze the key environmental factors affecting the distribution of S. senegal worldwide and simulate the current and future distribution range of S. senegal in Pakistan under the SSP1-2.6, SSP2-4.5, SSP3-7.0, and SSP5-8.5 climate change scenarios. The results highlight key environmental factors influencing the distribution of S. senegal, including BIO3 (isothermally), BIO4 (coefficient of seasonal variation of temperature), BIO11 (mean temperature of the coldest season), and BIO12 (annual precipitation). Regions with higher and less fluctuating temperatures exhibit a higher potential for S. senegal distribution. Currently, suitable habitats of S. senegal are concentrated in the southern region of Pakistan, covering provinces such as Punjab, Sindh, and Balochistan, with highly suitable habitats accounting for 6.06% of the total area. Under the current climatic conditions, this study identifies the spatial patterns of suitable habitats and their concentration in specific regions. With climate change, a notable expansion of suitable habitats towards higher latitudes is observed, with the most significant expansion under the extremely severe climate change scenario (SSP5-8.5), reaching 223.45% of the current level. The results of this study enhance our understanding of the dynamics of S. senegal distribution under climate change and offer valuable insights into the long-term introduction of S. senegal for afforestation and soil conservation in Pakistan. This study provides theoretical support for the sustainable development of the local ecosystem and socio-economy, emphasizing the importance of proactive measures to adapt to changing climatic conditions.
1. Introduction
Approximately 1/4th of the world’s land area is affected by desertification, and the establishment of protective forests is an important preventive and control measure adopted by countries to address ecological problems and natural disasters, particularly desertification [1,2,3]. The gum acacia Senegalia senegal (L.) Britton (Fabales: Fabaceae), which grows predominantly in tropical and subtropical arid zones, is an important multipurpose agroforestry species in desert regions [4,5]. It boasts widespread economic applications with a low-input production cycle and the gum Arabic it yields can be used in foods, beverages, feed, pharmaceuticals, cosmetics, industrial products, and fuelwood [6,7]. Senegalia senegal has demonstrated ecological value in addition to its economic versatility, and S. senegal-based agroforestry systems have been used for centuries in the Sahel, adapting to climate, topography, and geomorphological and anthropogenic changes [8]. Additionally, S. senegal exhibits the capability to fix atmospheric nitrogen (N2), increasing the soil inorganic nitrogen content and microbial biomass, presenting a potential alternative to address the scarcity of chemical fertilizers in the arid regions of Africa and counteract declining fertility resulting from shortened fallow periods [9,10,11]. Therefore, S. senegal plays a vital role in advancing socioeconomic development, maintaining agro-ecosystem stability, and facilitating ecological restoration and construction in arid areas, making it an optimal choice for protective forest species.
Species distribution models (SDMs) quantify a species’ ecological niche and project it onto a spatially referenced model. SDMs have become advantageous tools for predicting the potential geographical distribution and habitat suitability of species and are widely used across various disciplines [12,13,14]. Among SDMs, the maximum entropy model (MaxEnt), a machine learning method, determines the ecological requirements of species based on their distribution records and environmental factors [15,16]. Due to its broad applicability, objectivity, and high reliability, MaxEnt is extensively utilized in predicting species habitat areas, including the Chinese fir Cunninghamia lanceolata (Lamb.) Hook (Pinales: Cupressaceae) [12], the spiny-bellied frog Quasipaa boulengeleri (Günther, 1889) (Anura: Dicroglossidae) [14], the long tube lousewort Pedicularis longiflora (Rudolph) (Lamiales: Orobanchaceae) [17], and others. Although MaxEnt modeling has been widely studied, there are fewer projections of species distributions under the four carbon emission climate scenarios (SSP1-2.6, SSP2-4.5, SSP3-7.0, and SSP5-8.5). Most studies utilize global climate models (GCMs) from individual institutes, which do not accurately and comprehensively represent changes in habitat areas under future climate change scenarios [18,19,20]. Therefore, studying the habitat change of S. senegal under different climatic conditions is essential to enhance the success of plantation introduction.
The arid and semi-arid land area of Pakistan, constituting 80% of the national territory, has undergone severe degradation and desertification [21]. The introduction of S. senegal for afforestation is effective in alleviating desertification. However, limited knowledge exists regarding the distribution of potentially suitable habitats for S. senegal, particularly in the context of significant global climate change. Climate change exerts profound impacts on the geographic distribution and population dynamics of species, potentially hastening the loss of biodiversity [22,23,24,25]. For instance, Alabar et al. [26] forecasted the distribution of eight tropical dry forest plant species and observed a southward shift in their potential range. Guo Yanlong et al. [27] discovered that, under the most extreme warming scenarios, 22 tree species in southern China may lose over 50% of their potential distribution area. Tiago et al. [28] predicted that, due to climate change, the endemic orchid species Prosthechea jauana (Carnevali & I. Ramírez) W.E.Higgins (Orchidales: Orchidaceae) in Venezuela could lose up to 92% of its habitat by 2080. Therefore, investigating the environmental variables and suitable habitats of S. senegal amidst climate change and understanding the influence of environmental factors on its distribution can offer scientific and theoretical support for planning S. senegal planting areas.
In this study, we utilized the MaxEnt model and ArcGIS 10.8, incorporating current (1970–2000) climatic data and S. senegal distribution point data, to comprehensively analyze globally suitable habitats for S. senegal and identify the key environmental factors influencing its distribution. Additionally, we projected the potential distribution pattern of S. senegal in Pakistan in the future using climate data for four SSP scenarios, each representing different greenhouse gas emission intensities, across four future periods (2020–2040, 2040–2060, 2060–2080, and 2080–2100). In this study, we aim to elucidate the key environmental factors influencing the distribution of S. senegal worldwide, as well as the spatial pattern changes of S. senegal distribution in Pakistan under the backdrop of global climate change. Our goal is to provide a reference for the conservation and rational utilization of S. senegal plant resources and contribute insights for long-term afforestation planning programs.
2. Material and Methods
2.1. Occurrence Data
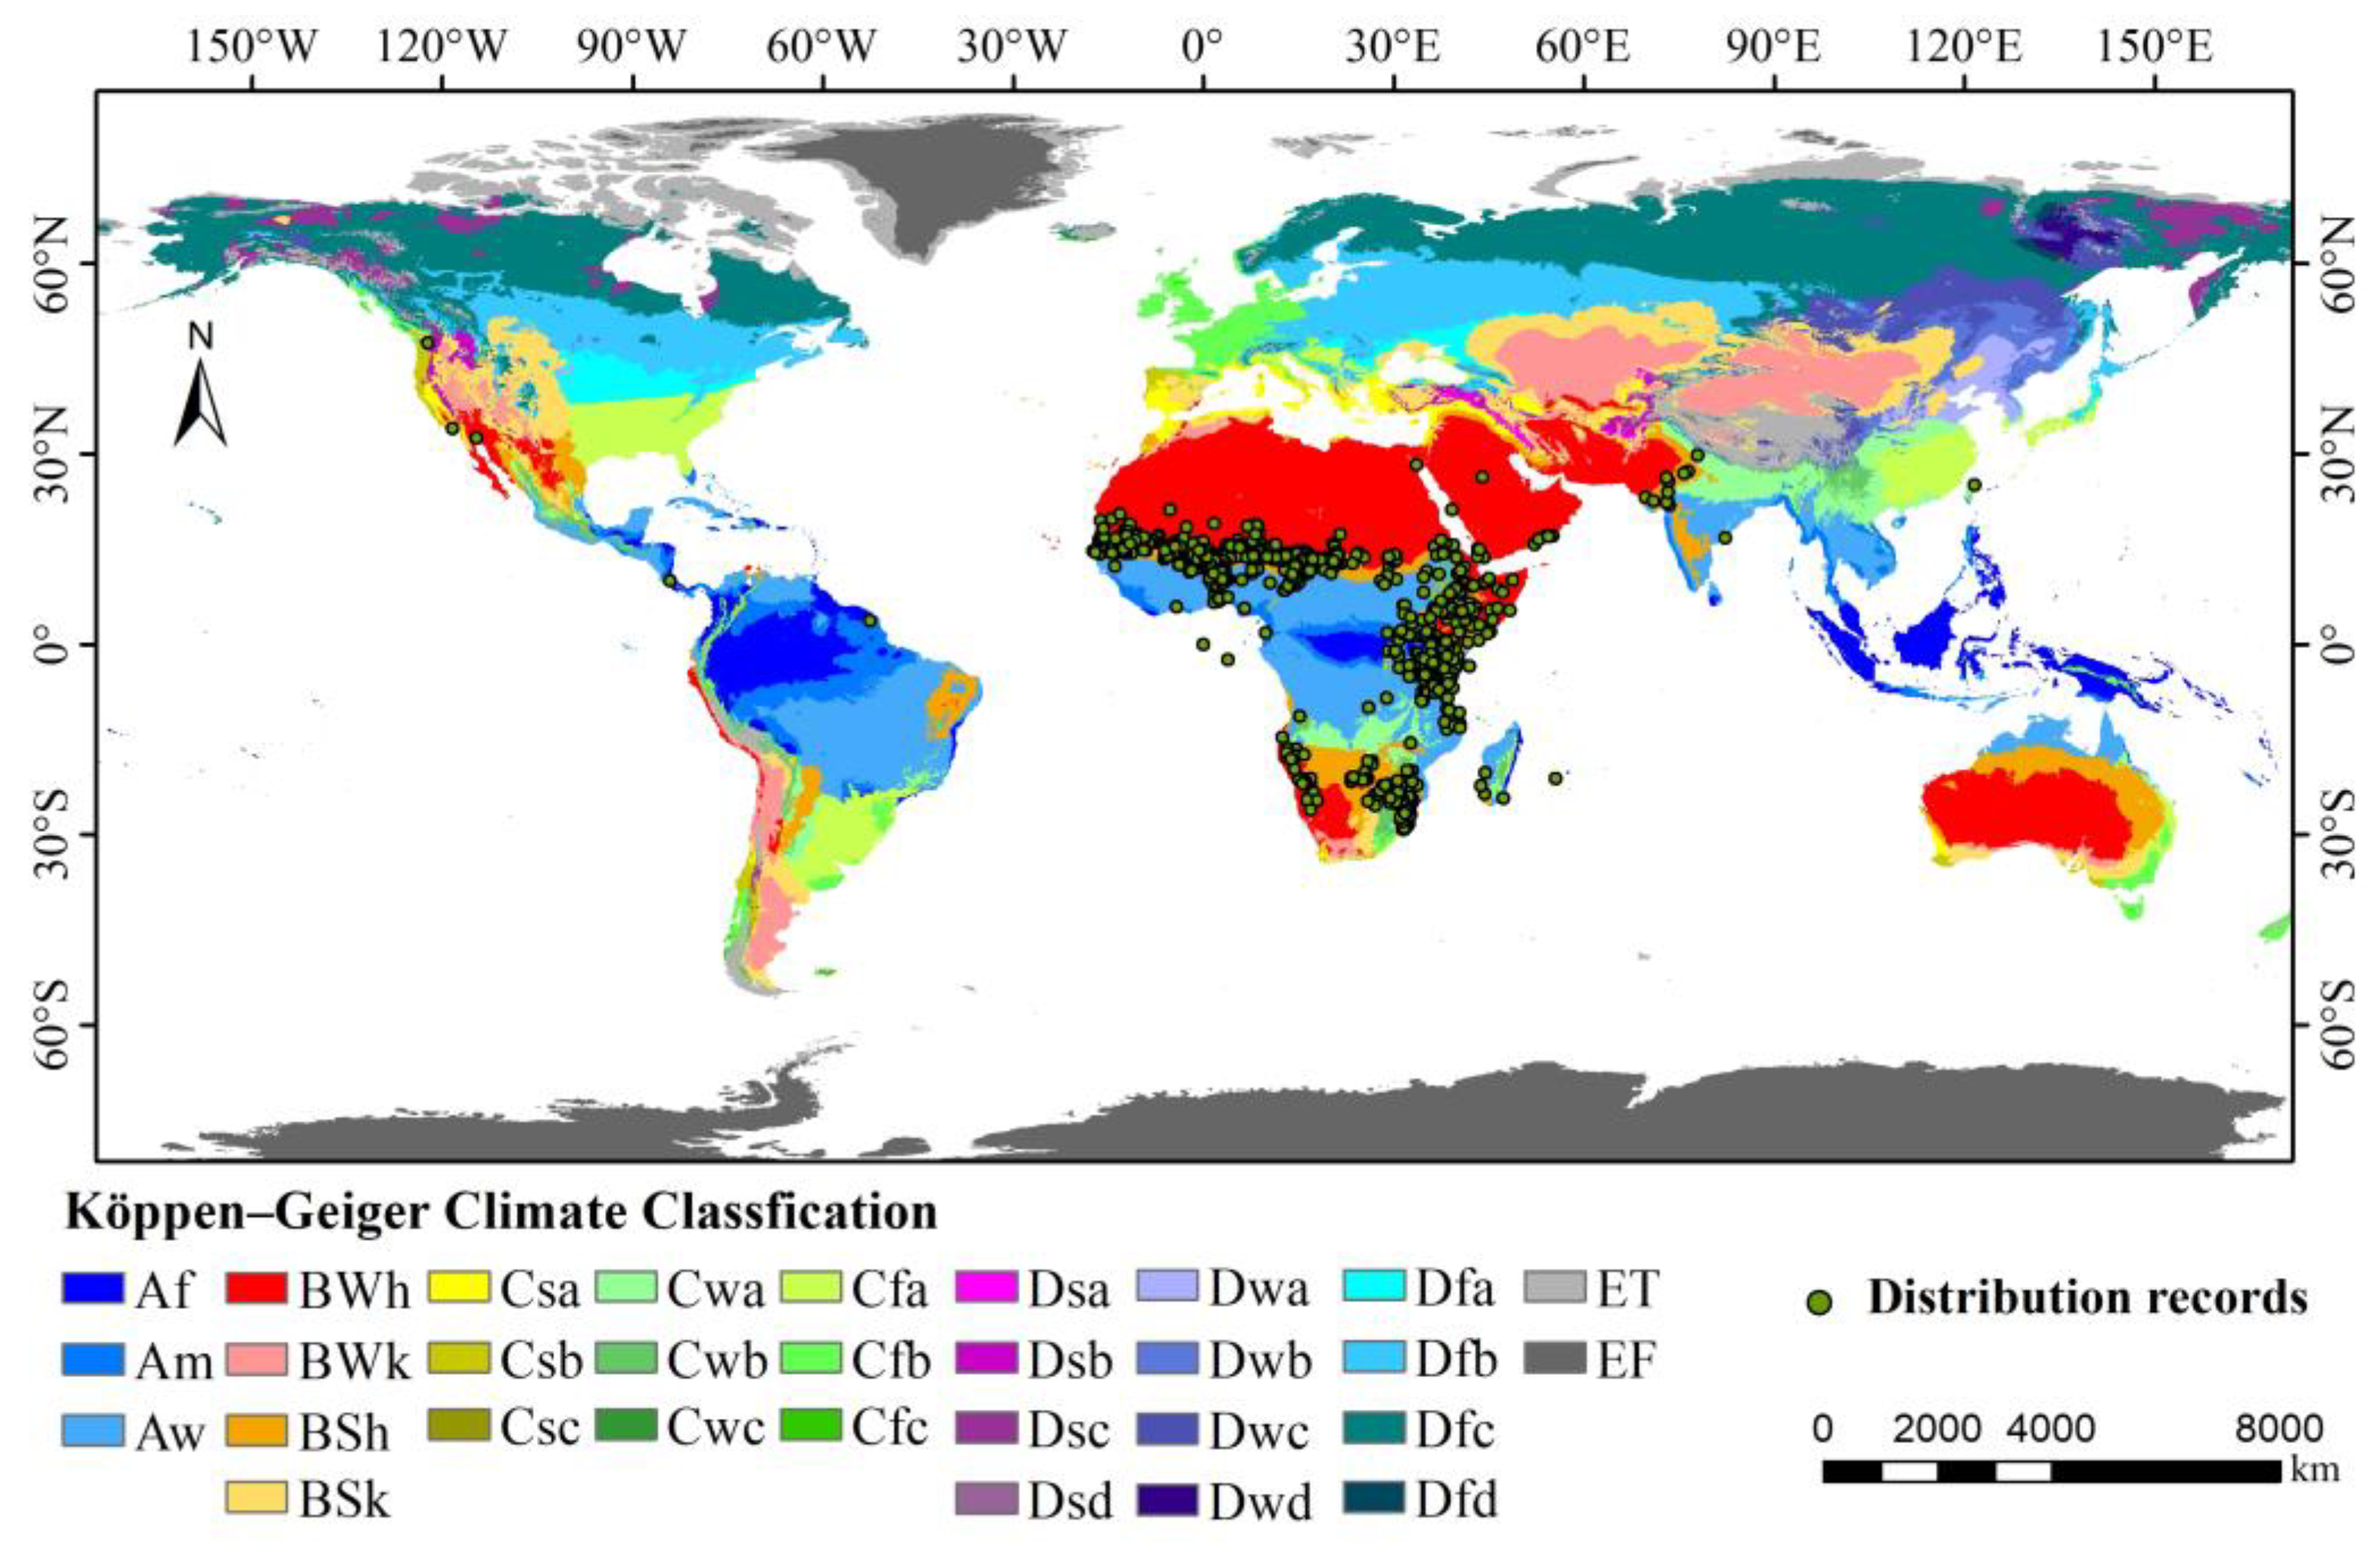
The occurrence data for S. senegal were collected from the Global Biodiversity Information Facility (GBIF; http://www.gbif.org), the Chinese Virtual Herbarium database (CVH; http://www.cvh.ac.cn), and the National Specimen Information Infrastructure (NSII; http://www.nsii.org.cn/2017/home.php). A total of 2711 occurrence data points were collected. Direct use of sample information with accurate latitude and longitude was made, while the coordinate information of sample points with place names but lacking coordinate information was completed via Google Earth. To prevent sampling bias from resulting in overly dense local distribution points and overfitting the model, it was imperative to meticulously screen and proofread the obtained coordinate point data using the R package “ENMeval v2.0.0” to remove overfitting data. It was ensured that the spatial resolution of the recorded occurrence matched that of the environmental variables. Ultimately, 1117 records of the global distribution of gum acacia trees were collected (Figure 1). As shown in Figure 1, S. senegal is mainly distributed in Africa, with some distribution in India in Asia. Its occurrence is predominantly in regions with tropical desert and tropical grassland climates, being greatly influenced by temperature and precipitation.
2.2. Environment Variables
We selected 23 environmental variables to model under the current (1970–2000) and future (2020–2100) climate prediction scenarios, encompassing 19 bioclimatic variables (BIO1–BIO19), elevation (Elev), soil available water content (AWC), topsoil salinity (TS), and subsoil salinity (SS) (Table 1). The Harmonized World Soil Database (HWSD; http://www.fao.org/soils-portal/) provided AWC, TS, and SS, while the WorldClim2.1 database (http://www.worldclim.org/) provided the 19 bioclimatic variables and elevation data at a spatial resolution of 2.5 Arc-min. For all future scenarios, all four types of shared social economy pathways (SSP1-2.6, SSP2-4.5, SSP3-7.0, and SSP5-8.5) were selected as environmental data sources. Moreover, to mitigate climate uncertainty arising from a single climate model, the average of future climate simulation data from four different institutes (MIROC 6, BCC-CSM2-MR, CNRM-CM 6-1, and CanESM5) was employed for future climate data [30].
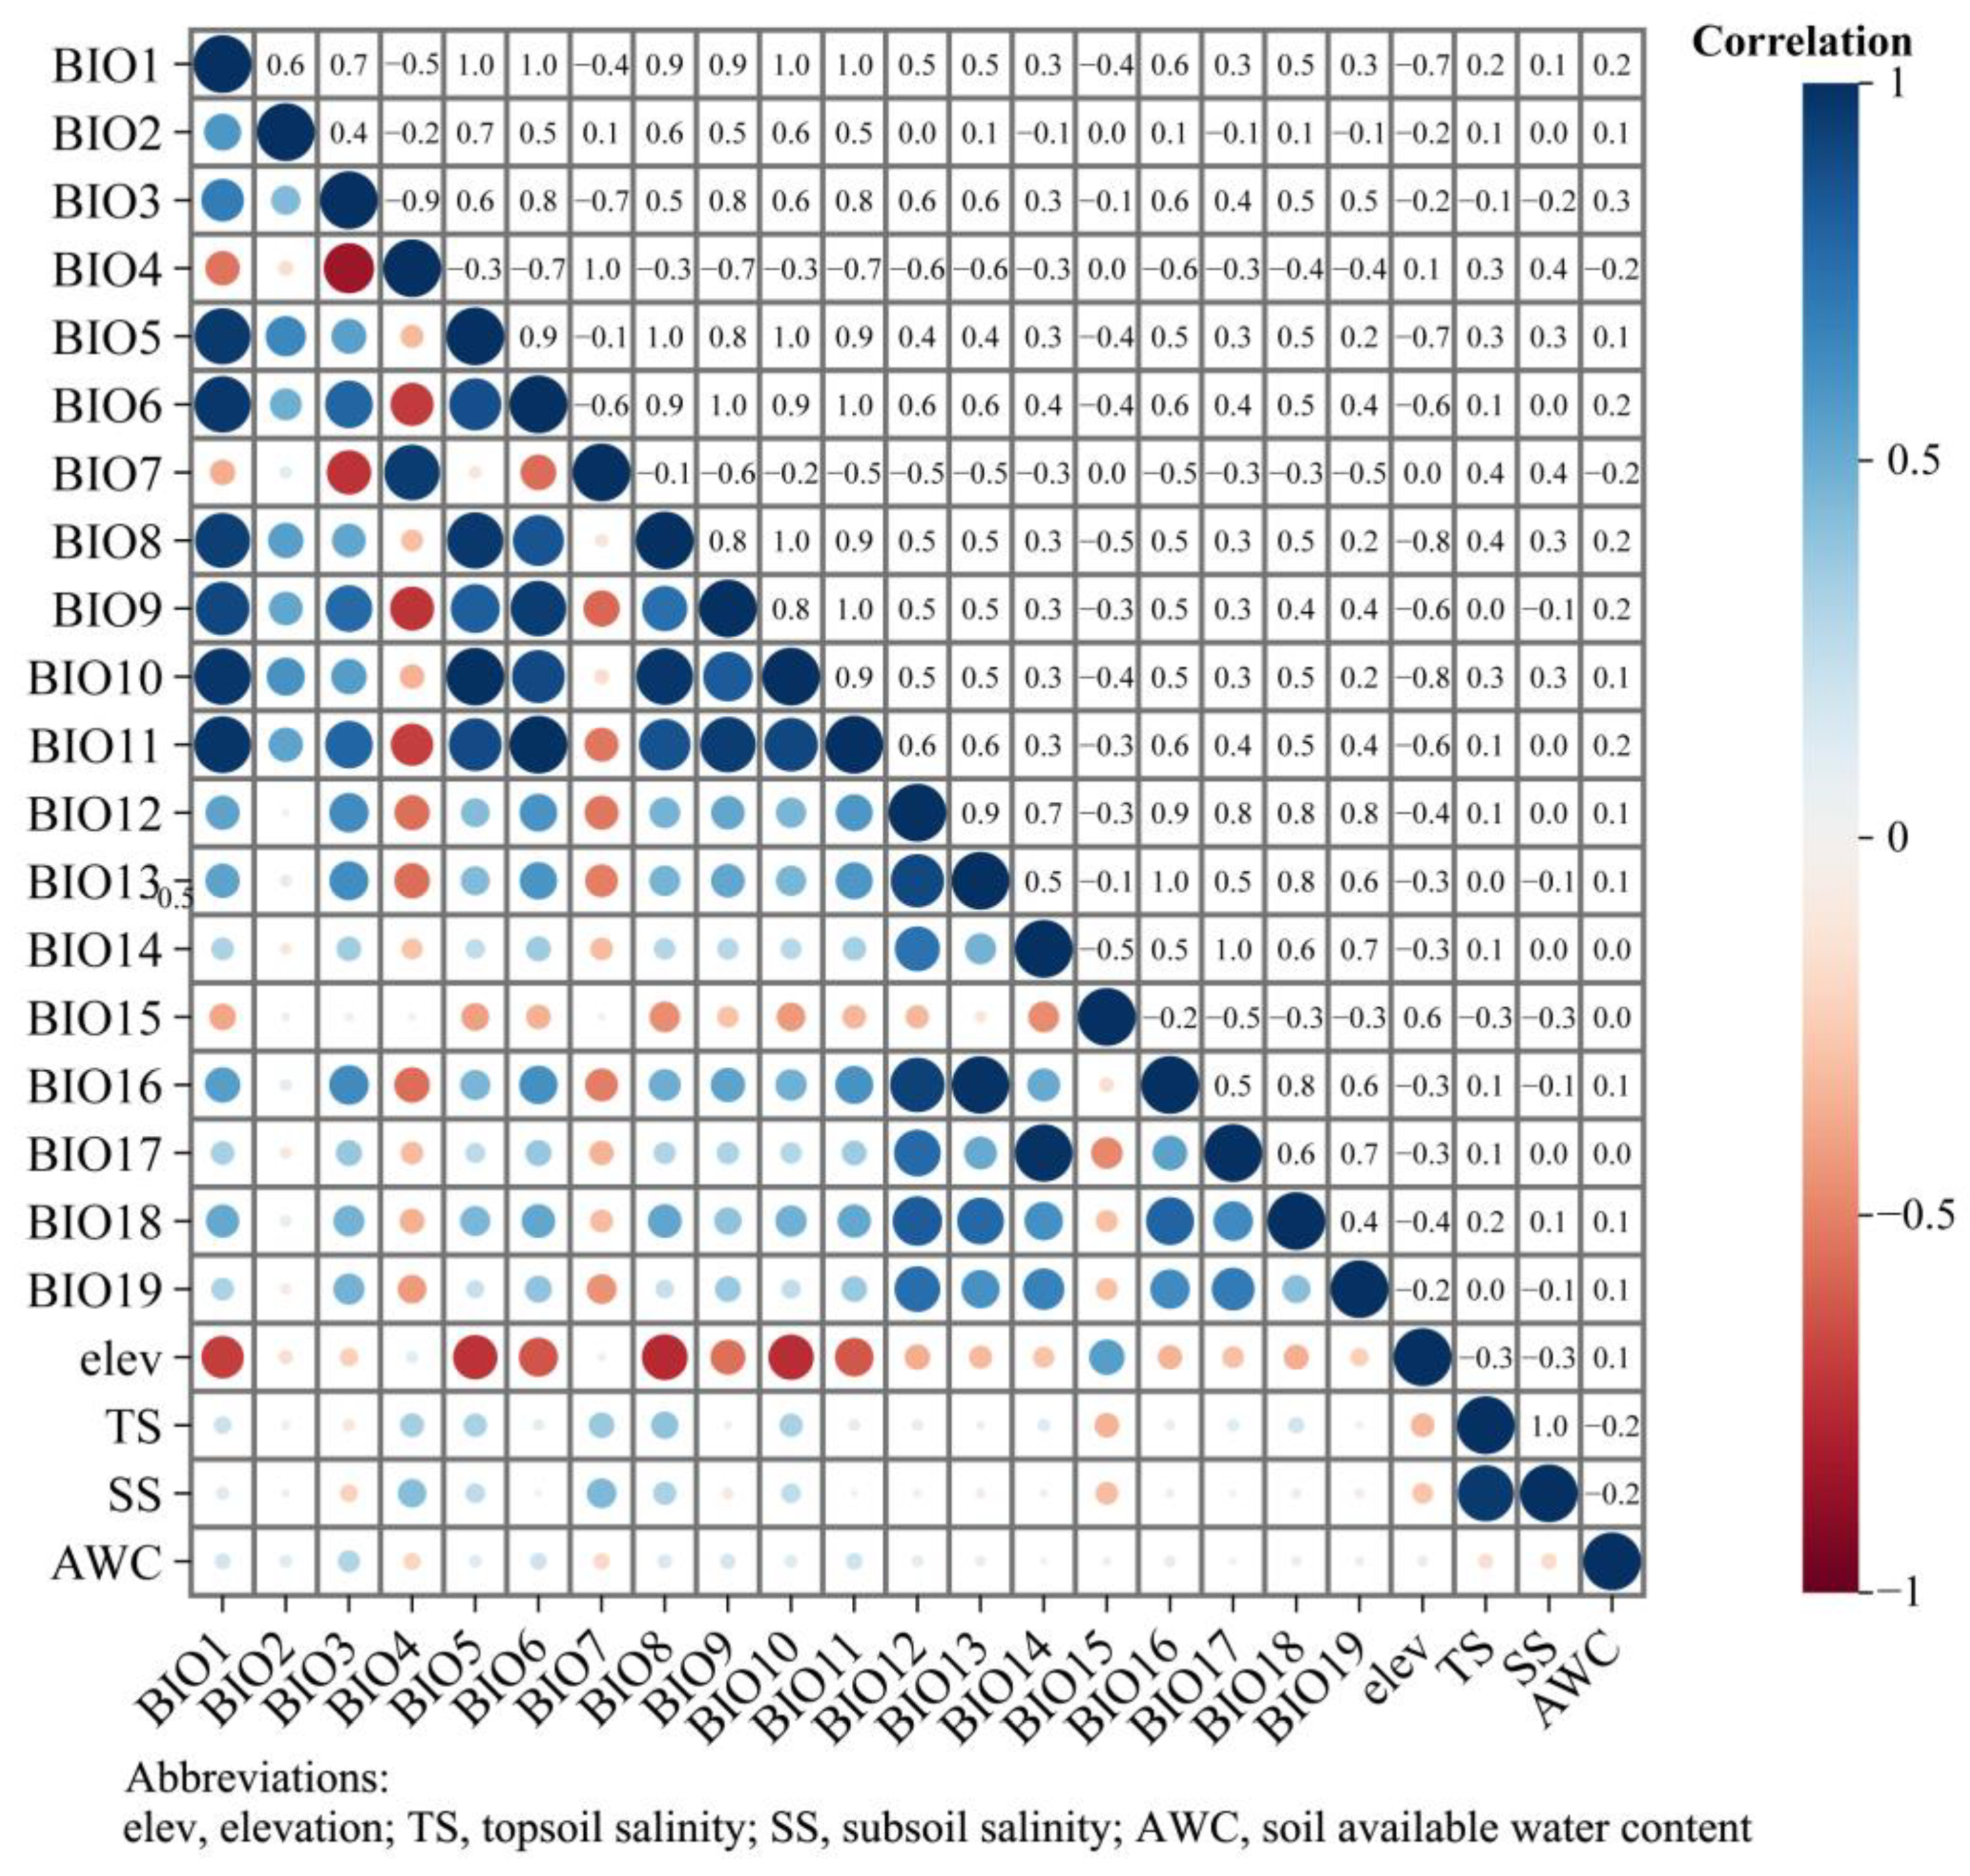
Correlations between environmental variables, all of which are used for model prediction, can lead to overfitting. Therefore, environmental variables were first analyzed for correlation using the R package “ENMTools v1.0.4” to obtain correlation coefficients (Figure 2). Then, based on the observed contributions of all environmental factors during the model training process (Table 1), environmental factors with correlation coefficients |r| ≥ 0.8 and contribution rates < 1.0 were excluded from the modeling process to reduce the risk of overfitting caused by collinearity. Following that, seven environmental variables demonstrating statistical and biological significance were selected from the 23 environmental factors for inclusion in the modeling process: BIO3, BIO11, BIO12, BIO14, BIO15, BIO19, and AWC.
2.3. Modeling Optimization
When simulating species distribution, MaxEnt is typically executed using default parameters. However, this may result in overfitting and increased complexity, reducing result accuracy. Hence, enhanced parameter optimization is imperative [31]. In this study, the R package “ENMeval” was used to optimize the MaxEnt model [32]. Eight regularization multipliers (RM) ranging from 0.5 to 4 at intervals of 0.5 were systemically combined with six feature combinations (FC): L, LQ, H, LQH, LQHP, and LQHPT. The Akaike information criterion correction (AICc) was used to evaluate the degree of fit and complexity of the model. Typically, the combination with a delta.AICc = 0 is considered the optimal choice [33,34]. In this study, when RM = 2 and FC = LQHPT, delta.AICc = 0, indicating this optimal parameter combination was used for MaxEnt modeling.
2.4. MaxEnt Modeling and Evaluation
Occurrence records of S. senegal and seven environmental variables were imported into MaxEnt 3.4.4. The optimal parameter combination (RM parameter set is 2, FC parameter set is LQHPT) was adopted. The maximum number of iterations was set to 10,000. The data output format was configured as logistic. Using cross-validation to extract the test set, all occurrence records are randomly divided into 10 equally sized subsets for iteration. For each iteration, one subset is selected as the validation set, and the remaining 9 subsets are used as the training set. The MaxEnt model is trained on the training set and validated on the corresponding validation set to obtain the model performance metrics. This process is repeated ten times to obtain the average values, thus mitigating uncertainty.
The accuracy assessment primarily relied on evaluating the area under the receiver operating characteristic (ROC) curve of the MaxEnt model output. The area under the curve (AUC) ranged from 0 to 1, with higher values indicating increased confidence in predictions. An AUC value <0.8 suggested low confidence, 0.8–0.9 indicated good accuracy and 0.9–1.0 represented excellent accuracy [35]. In this study, the AUC values of the 10-fold cross-validation range from 0.926 to 0.943, with a standard deviation of 0.005 and a mean of 0.933, signifying excellent accuracy.
2.5. Classification of Suitable Regions and Spatial Pattern Changes
The suitability values for S. senegal, as predicted by the MaxEnt model, were continuous raster data ranging from 0 to 1, with higher values indicating greater suitability for species growth. In the current classification of suitable areas, the Jenks natural break classification method was used to categorize habitats into four groups: inappropriate, low-suitability, medium-suitability, and highly suitable. This grouping strategy, utilized in future distribution models, ensures consistent grouping with minimized errors, thereby reducing the uncertainty associated with climate change [36].
Utilizing the current habitat as the standard, SDMtolbox in ArcGIS10.8 was used to classify habitat changes into three categories: unchanged, expanding, and shrinking. This classification was based on disparities between habitats under varying climatic conditions and their counterparts in the present environment. Changes in the geometric center position of habitats with medium and high suitability under different climatic conditions were calculated. Comparative analyses were conducted on the overall trends in the core suitable area of S. senegal across different periods to elucidate the influence of environmental changes on its distribution over time.
3. Results
3.1. Assessment of Key Environment Variables
Based on the output of the MaxEnt model, along with regularization training gain, test gain, contribution rate, and displacement importance from the knife-cutting method, this study identifies key environmental variables affecting the geographical distribution of S. senegal (Figure 3, Table 1). Table 1 shows that BIO3, BIO14, and BIO11 were the three environmental variables with the highest contribution rates, totaling 53.26%. BIO11, BIO12, and BIO6 were the top three factors with the highest permutation importance, accounting for 65.89%. As shown in Figure 3, the highest regularization training gains during univariate simulation were observed for BIO4 (1.1449), BIO3 (1.1403), and BIO6 (1.1102), whereas the three variables with the highest test gains were BIO4 (1.1736), AWC (1.1696), and BIO3 (1.1577). This suggests that these variables contain crucial information. Notably, when simulating nonspecific variables, the most significant reductions in regularization training gain, test gain, and AUC values were evident for BIO12 and AWC, indicating that these variables contain information that is not present in other variables. In summary, the dominant environmental variables influencing the distribution of S. senegal are BIO3 (isothermality), BIO4 (temperature seasonality), BIO11 (mean temperature of coldest quarter), and BIO12 (annual precipitation).
3.2. Response Curve Analysis of Key Environmental Variables
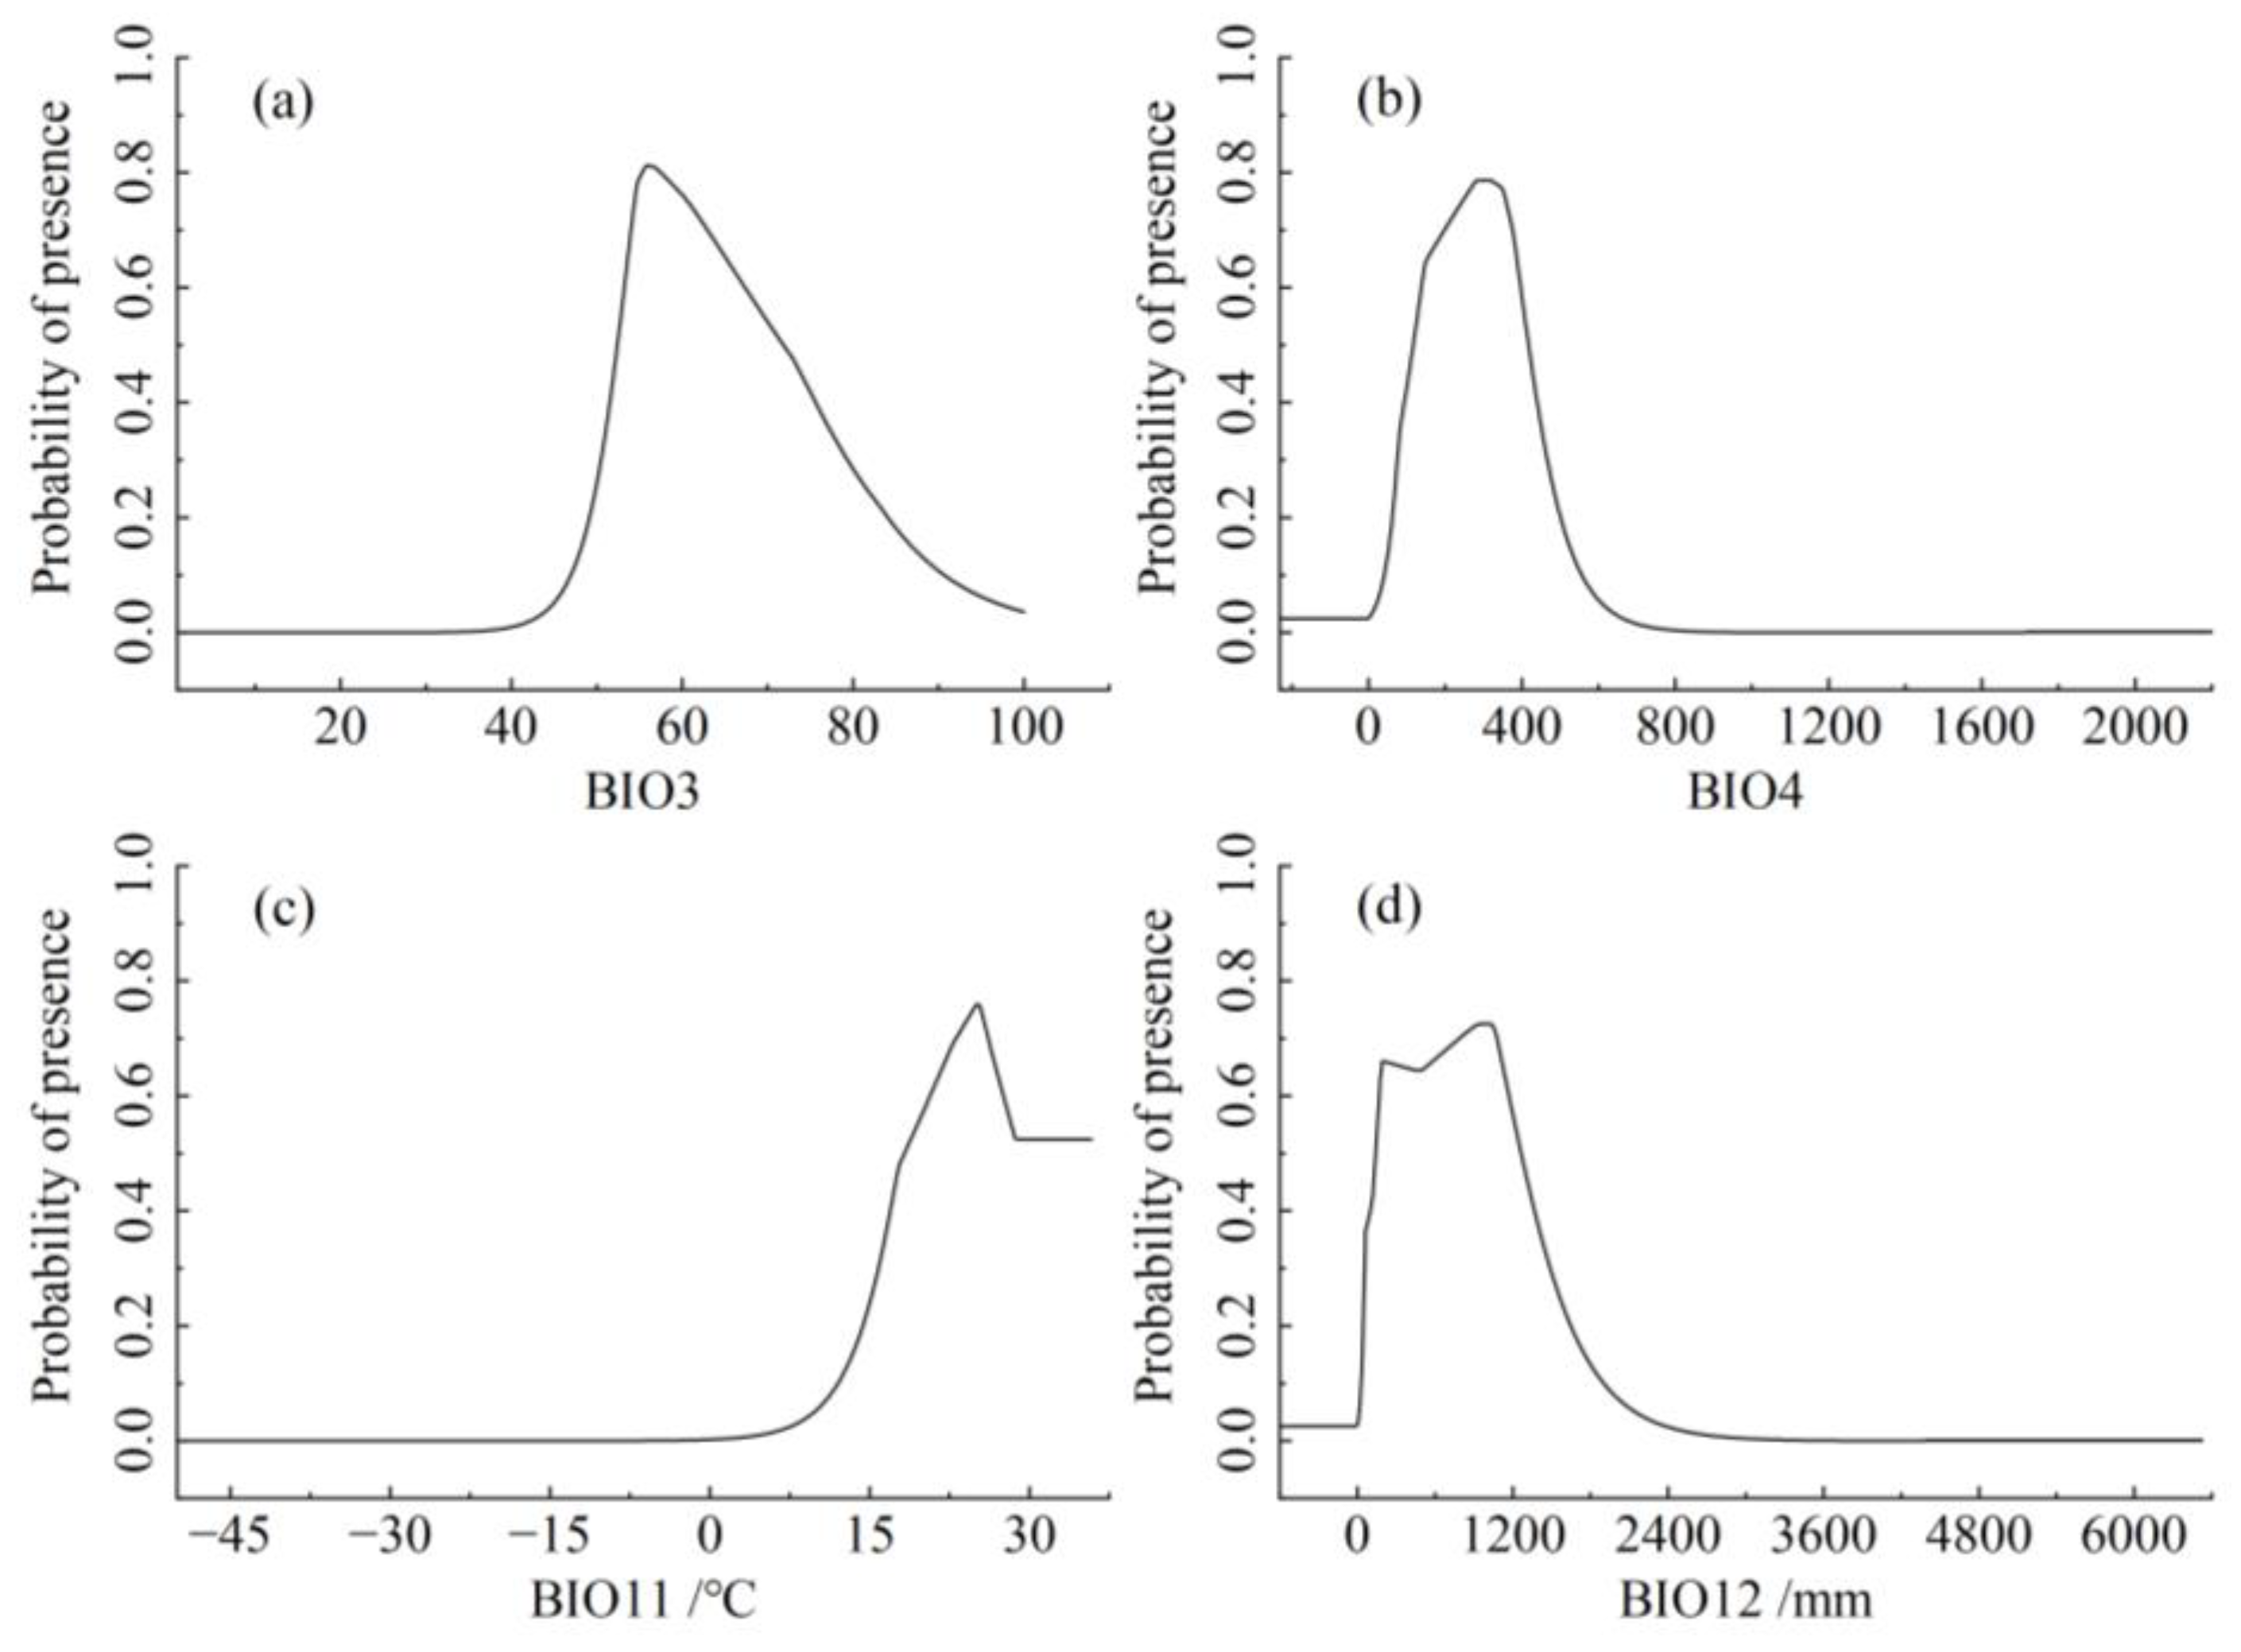
The single-factor response curve, derived from logistic regression analysis of key environmental factors, elucidates the relationship between the occurrence probability of S. senegal and environmental variables, offering insights into the impact of each dominant environmental variable on suitable habitats. Instances where the probability of occurrence exceeded 0.5 were considered conducive to plant growth. The probability of S. senegal occurrence was minimal when BIO3 was below 40, gradually increasing and peaking at BIO3 = 56.01, then decreasing with further BIO3 increments. BIO3 favored the growth of S. senegal within the range of 52.5–71.8. (Figure 4a). The BIO4, BIO11, and BIO12 trends were similar to those of BIO3, which showed an increasing-to-decreasing pattern. Optimal peaks for BIO4, BIO11, and BIO12 were 291.1, 25.19 °C, and 1014.7 mm, respectively. Occurrence probabilities above 0.5 were observed when BIO4 ranged from 115.9–416.31, BIO11 from 18.2–35.8 °C, and BIO12 from 129.88–1263.6 mm, favoring S. senegal growth (Figure 4).
3.3. Potentially Suitable Habitats under Current Climatic Conditions
The suitable distribution of S. senegal worldwide is shown in Figure 5. Among 1117 occurrence records of S. senegal, only 1.62% were found in unsuitable habitats. The model simulation of potentially suitable habitats broadly aligns with the occurrence records. These suitable habitats are predominantly concentrated in the tropics and subtropics, encompassing an area of 3.63 × 10⁷ km2. Africa exhibits the broadest distribution, harboring the largest range of highly suitable habitats. Additionally, potentially suitable habitats are identified in South America, Oceania, and Southern Asia, demonstrating areas of notable suitability.
Suitable habitats for S. senegal also exist in the southern coastal areas of Pakistan, a country in Southern Asia. Highly suitable areas are primarily situated in the significant cities of Karachi and Tharparkar in the Sind Provinces, covering an area of 53,300 km2, accounting for 6.06% of Pakistan’s total area. Medium-suitable areas include the eastern regions of the Gwadar District in Balochistan Province, as well as the southern regions of Sindh Province, covering an area of 70,300 km2, which accounts for 7.99% of the total area of Pakistan. Areas of low suitability cover 97,000 km2 or 11.02% of Pakistan’s total area, mainly located in the Sind Province, Bahawalpur and Rahimyar Khan Districts of Punjab Province, and Makran Division, Awaran, and Khuzdar Districts of the Balochistan Province.
3.4. Potentially Suitable Habitats in Pakistan under Different Future Climate Scenarios
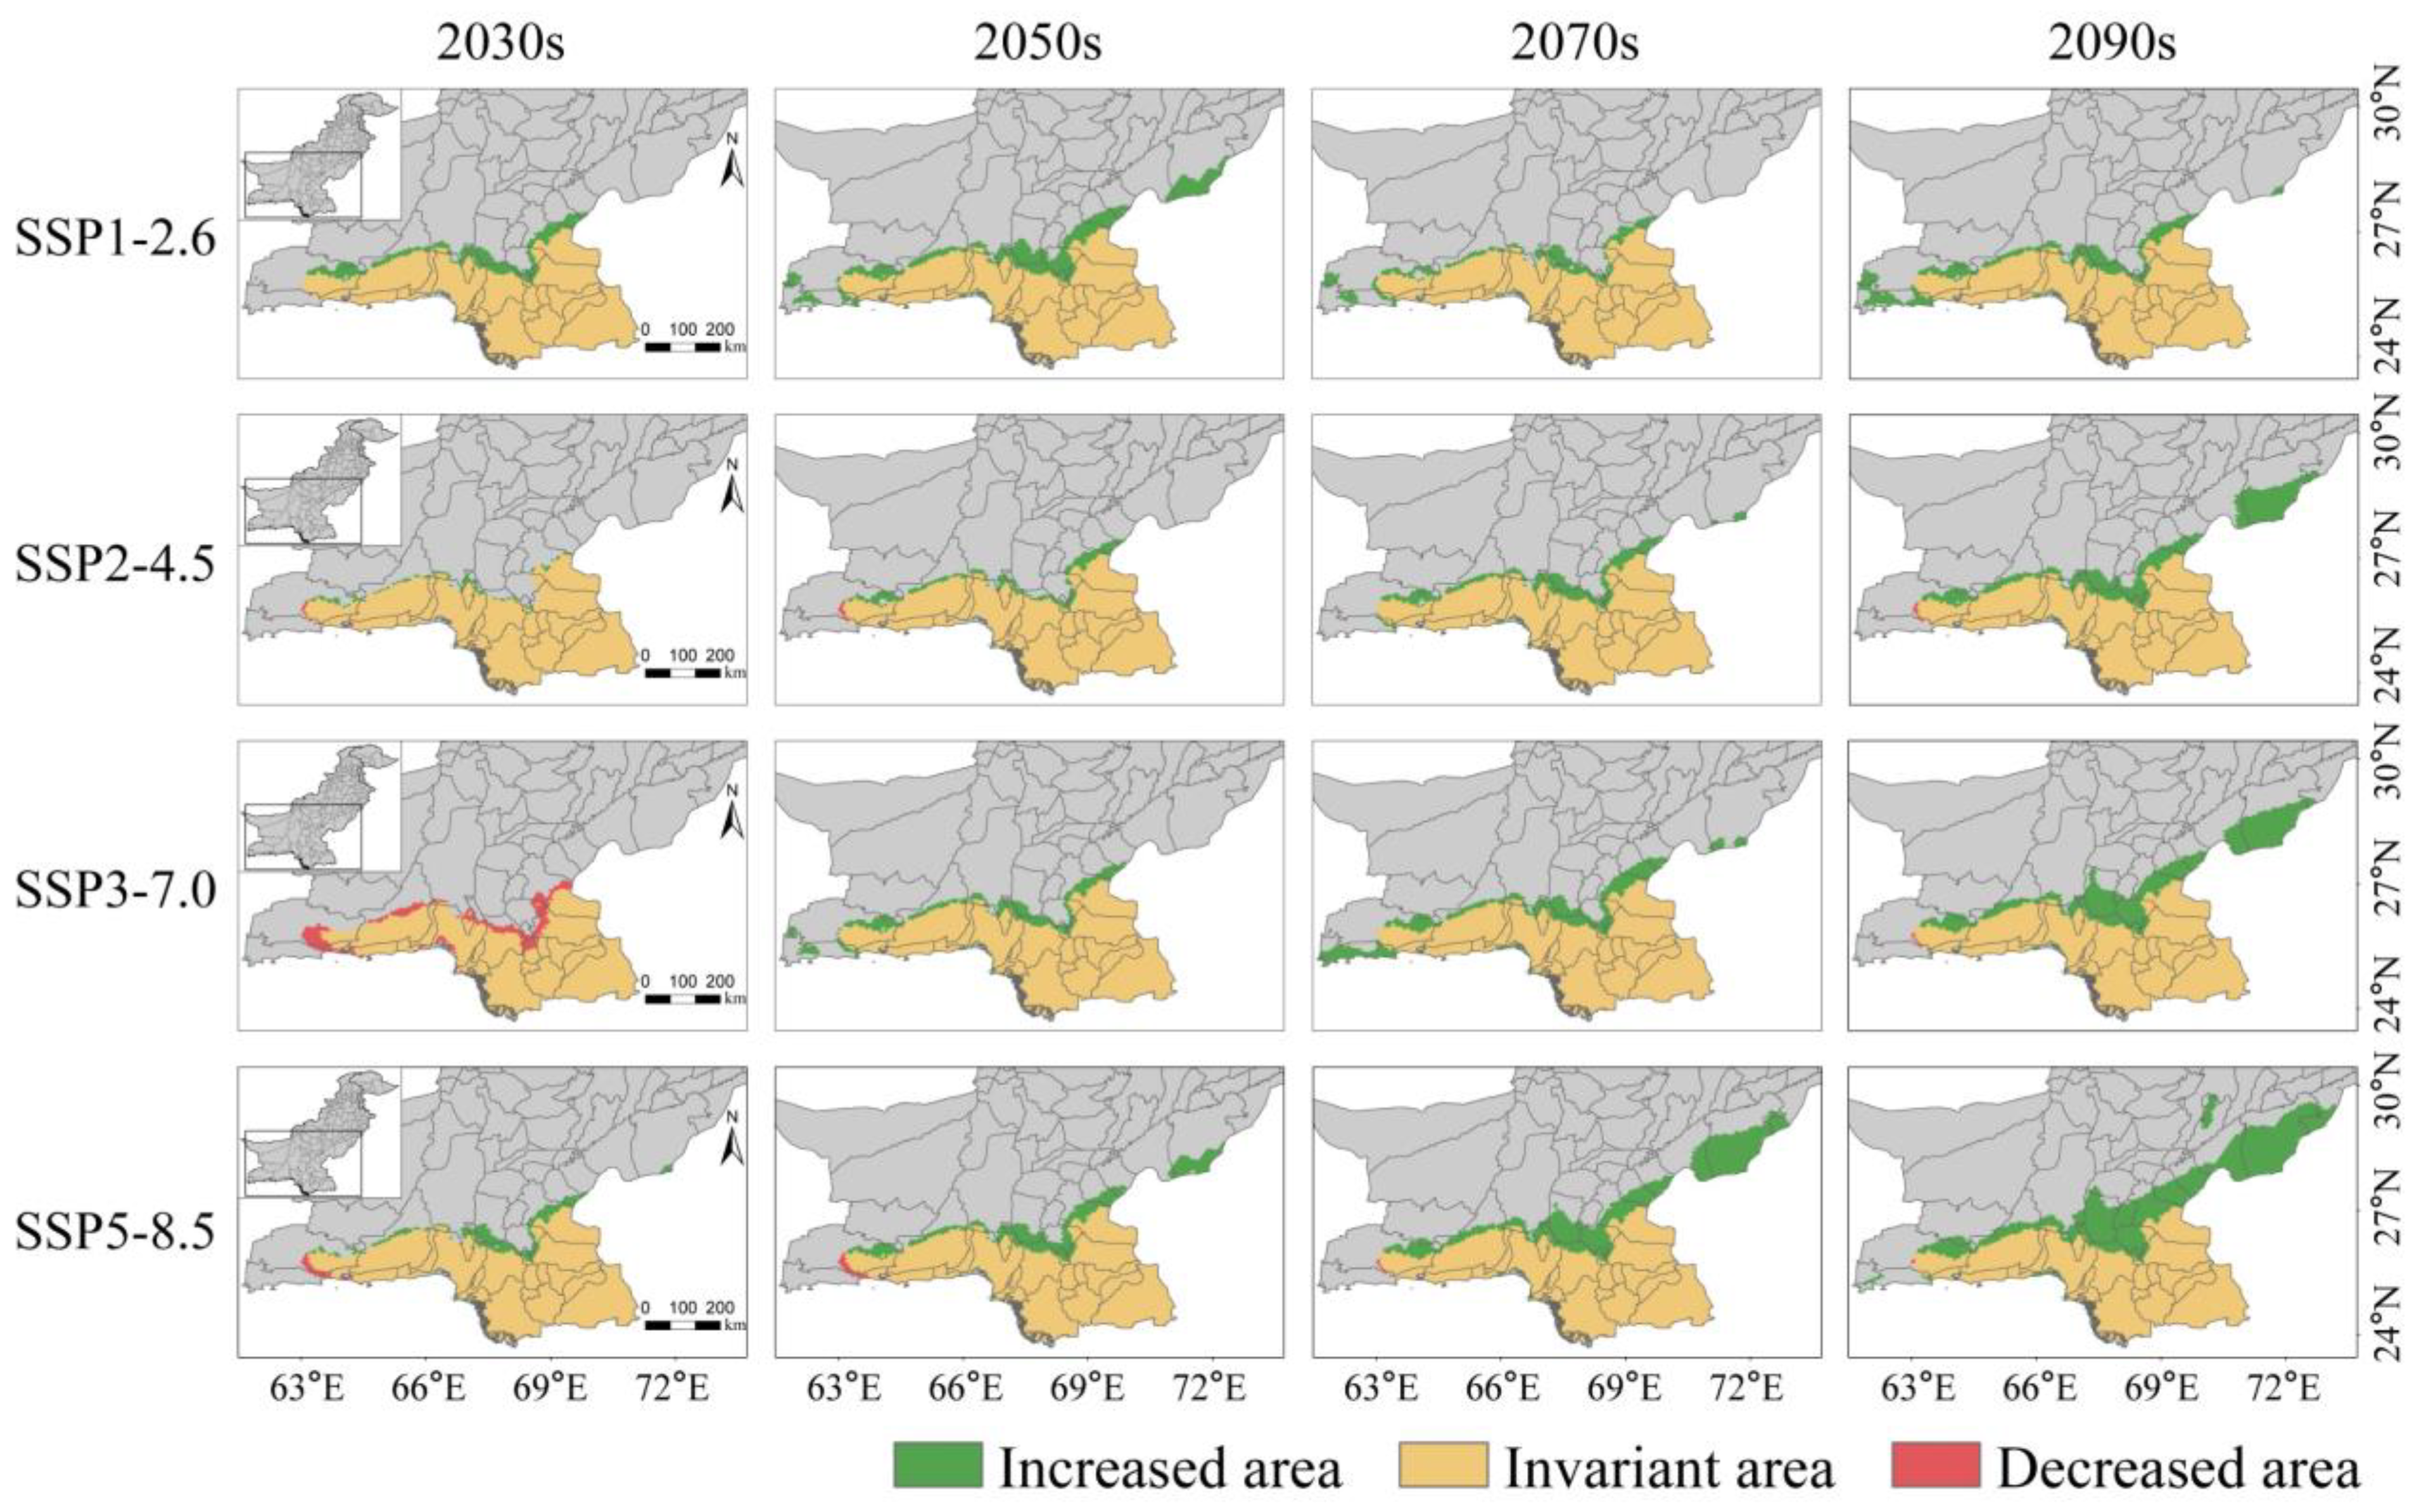
The habitats suitable for S. senegal under various climatic scenarios for the next four periods (2020s–2040s, 2040s–2060s, 2060s–2080s, and 2080s–2100s) are shown in Figure 6. Medium and highly suitable habitats continue to concentrate in the southern coastal areas of Pakistan, demonstrating an overall expanding trend, whereas low-suitable habitats experience significant expansion from the southern coasts northward into the Islamabad Capital Territory.
In the SSP1-2.6 scenario, the total suitable habitat for S. senegal experiences limited variability, ranging from 112.97%–125.37% of the current suitable distribution area, indicating an overall expanding trend. A reduction in total suitable area is observed only in the 2070s compared to the preceding period (2050s). However, all subsequent four periods of medium-suitability habitats show a decrease compared to the current one, with a maximum reduction of 21.75%.
In the SSP2-4.5 scenario, the total suitable habitat gradually expands over time to 105.77% of its current size by the 2030s and 140.79% by the 2090s. The middle-suitable habitat demonstrates relative stability, exhibiting a trend of initial contraction followed by expansion, with an expected reach of 102.00% by the 2090s.
In the SSP3-7.0 scenario, the total suitable habitat contracts to 86.16% of its current size in the 2030s and then gradually increases, with a significant expansion observed in 2090, reaching 151.56% of its current size. The medium-suitability habitat showed an expansion–contraction–expansion trend. The highly suitable habitat experiences a notable contraction in the 2030s to 63.94% of the current level, followed by gradual expansion.
In SSP5-8.5, a substantial increase in the total suitable habitat was observed, expanding to 118.55% of the current size in the 2030s, 130.16% in the 2050s, 161.58% in the 2070s, and nearly doubling to 195.60% of the current size by the 2090s. No significant changes were observed in the medium-suitable areas. The most significant change occurs in the highly suitable habitat, expanding to 223.45% of its current size by the 2090s.
3.5. Spatial Pattern Changes of Potential Habitat Regions in Pakistan
With increasing climatic severity (SSP1-2.6 to SSP5-8.5) and the passage of time, the medium and high habitats of S. senegal continued to expand slowly northward, reaching as far as the Bahawalpur District in Punjab Province. The shrinkage of suitable areas is infrequent and mainly occurs in the central part of the Gwadar District in Balochistan Province. The stable area, encompassing the eastern Gwadar District, southern Karat District, and most regions of Sindh Province, remained the largest in proportion and exhibited minimal change (112,200 km2 to 127,400 km2) (Figure 7).
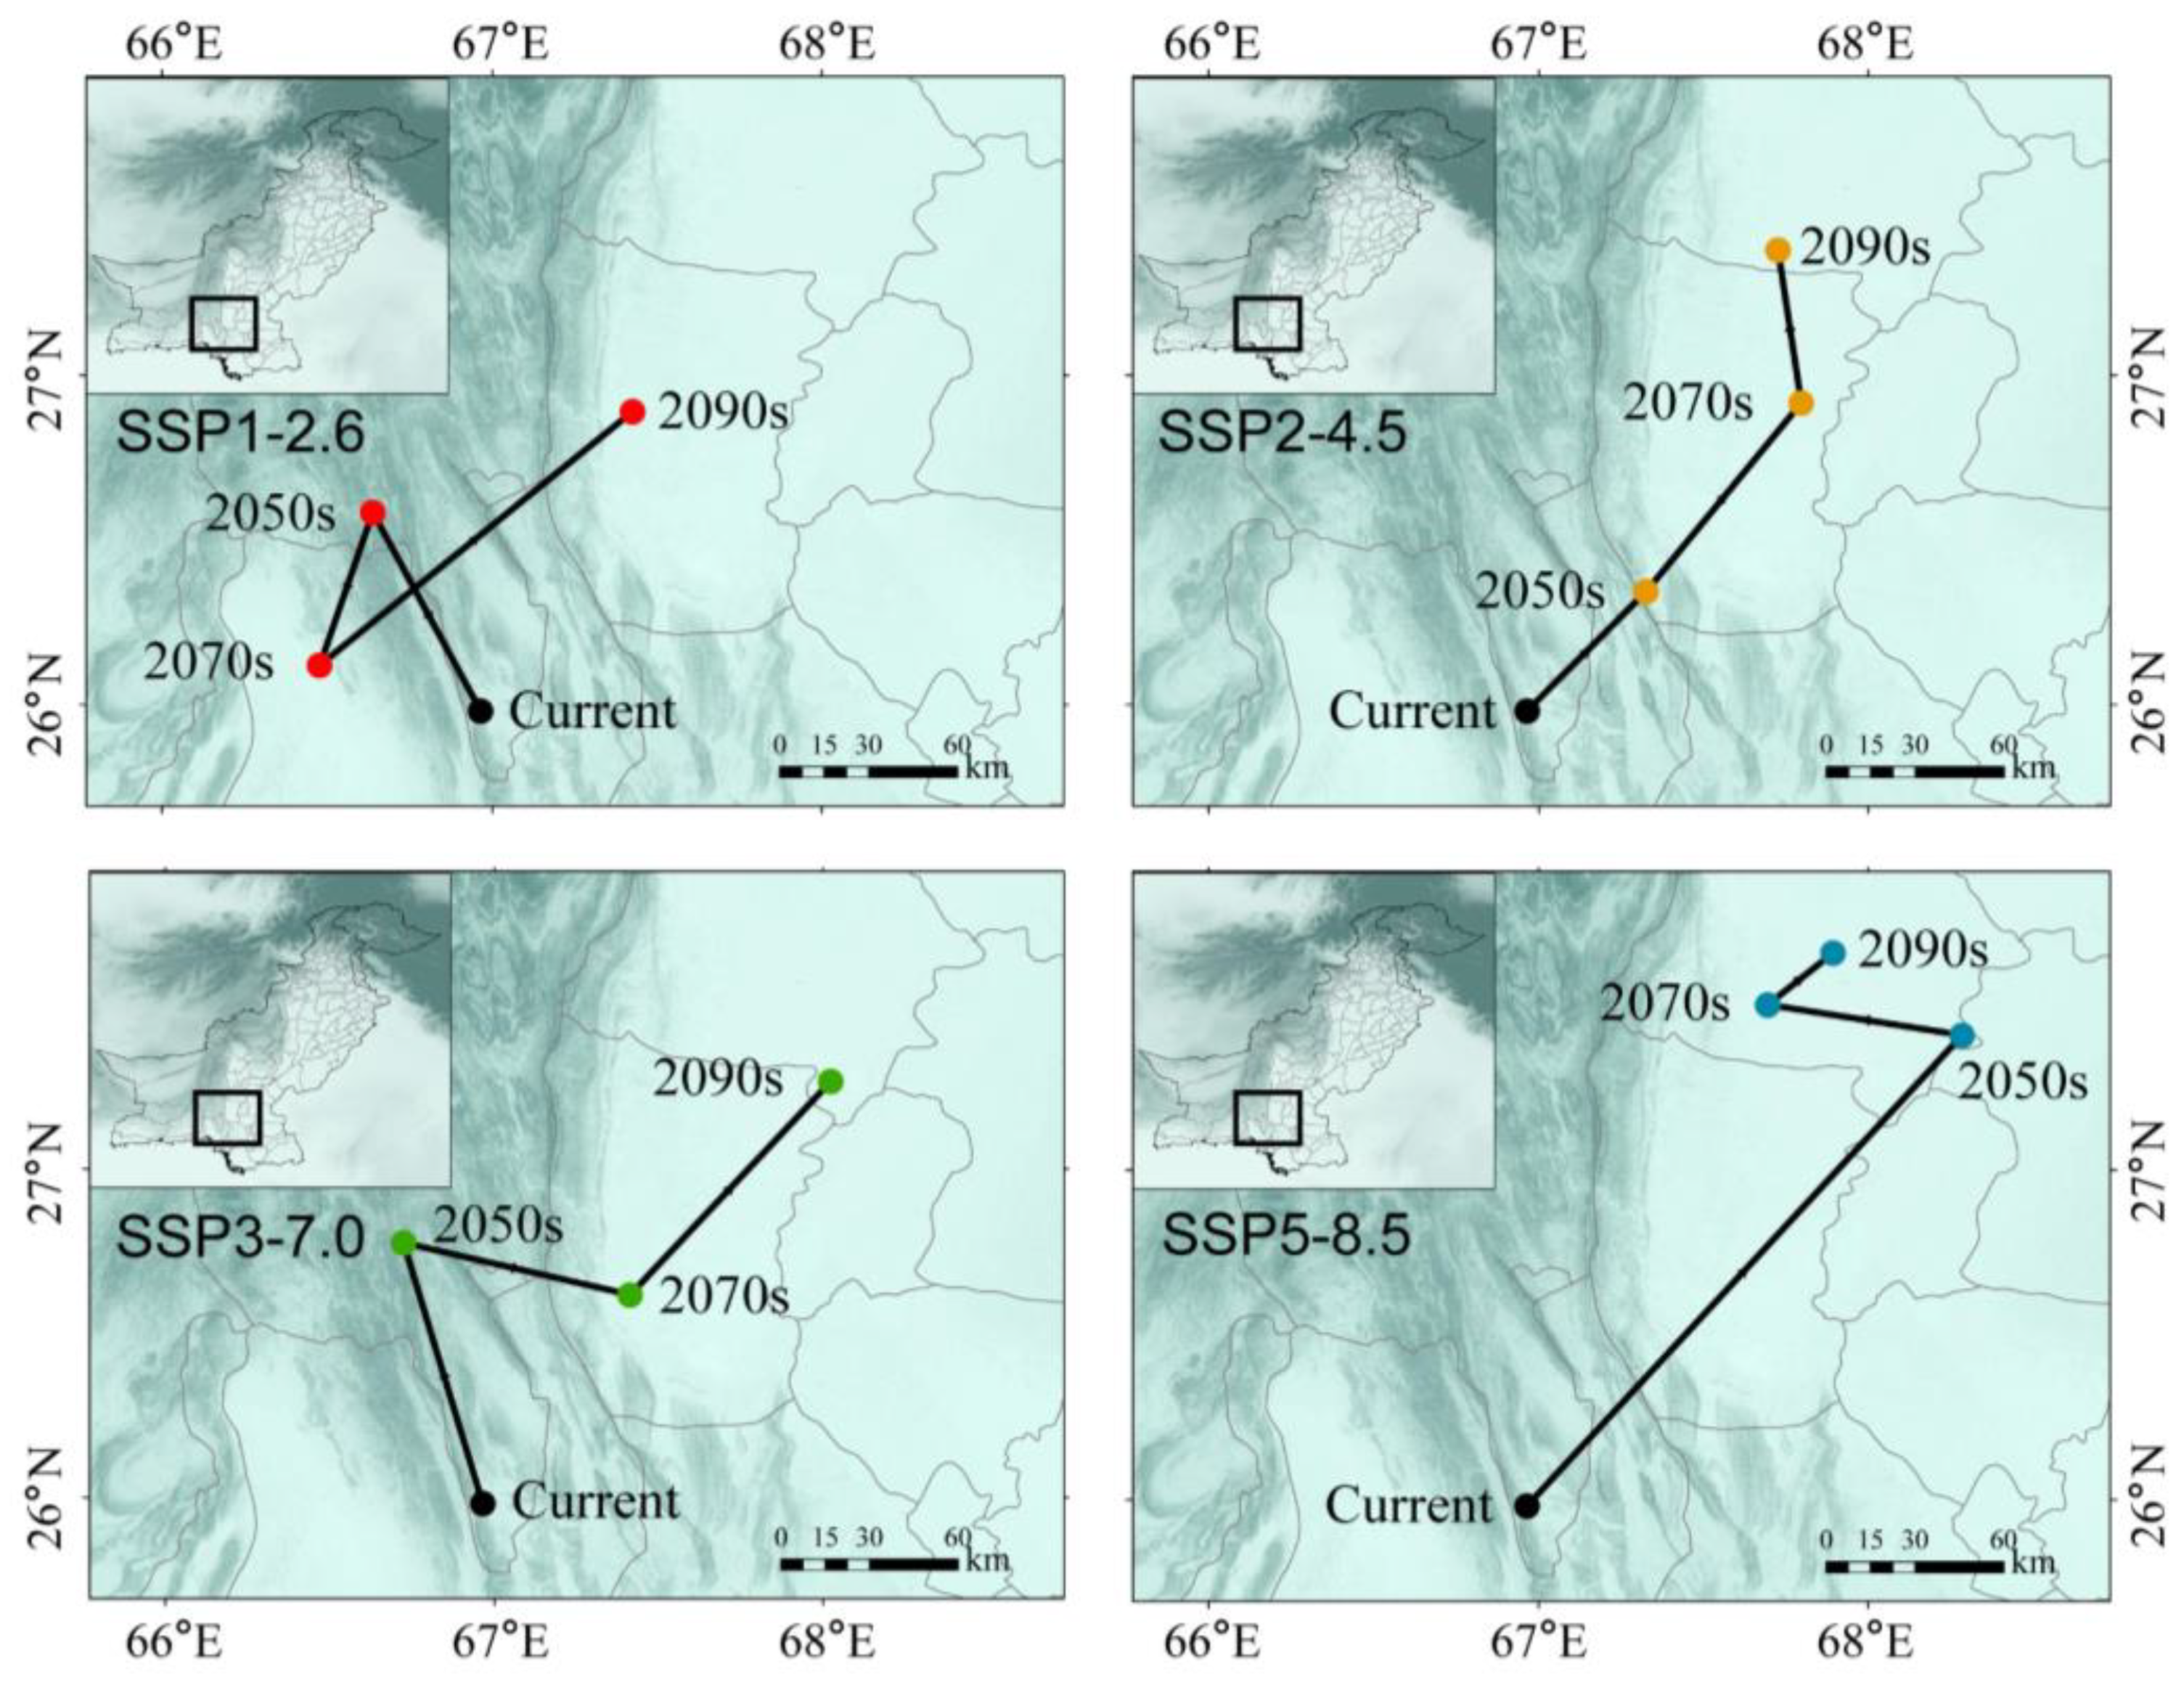
The geometric center point of the potentially suitable distribution area (distribution center) of S. senegal tended to migrate northward in different scenarios and at different times (Figure 8). In the SSP2-4.5 scenario, the distribution center migrated 56.27 km to the northeast in the 2050s, 82.79 km to the northeast in the 2070s, and 52.61 km to the northwest in the 2090s. In the SSP5-8.5 scenario, the migration of the distribution center is the most significant, especially in the 2050s, with a migration of 208.17 km to the northeast compared with the current. In the current climate scenario, the distribution center is situated in the Khuzdar District. By the 2090s, in each climate scenario, the distribution center has migrated to the Dadu and Qambar Districts near the Indus River basin. At different time periods, the magnitudes of four key environmental factors at the distribution center also change (Table 2). Compared to the present, in the 2090s, BIO3 and BIO12 both exhibit a significant decrease, while BIO4 and BIO11 show a significant increase.
4. Discussion
4.1. Effects of Environmental Variables on the Distribution of S. senegal
The geographical distribution of plants is mainly affected by climate [37], with hydrothermal conditions playing a dominant role in the distribution pattern of plants [38]. The knife-cut method, employed to derive training gain, contribution, and single-factor response curves, elucidates crucial environmental factors affecting species distribution. Waheed et al. [39] identified BIO1, BIO3, BIO8, and BIO12 as key bioclimatic variables influencing the growth of the Bengal quince Aegle marmelos (L.) Corrêa (Sapindales: Rutaceae) in Pakistan. Similarly, Khan et al. [40] demonstrated the significance of BIO3, BIO11, and BIO14 in determining the occurrence of the chilghoza pine Pinus gerardiana Wall. ex D. Don (Pinales: Pinaceae) in South Asia (Afghanistan, Pakistan, and India). Bhandari et al. [41] highlighted BIO4, BIO7, BIO12, and BIO15 as major climatic factors influencing the distribution of the tree rhododendron Rhododendron arboreum Sm. (Ericales: Ericaceae) in the central Himalayas. In this study, the most significant environmental factors affecting S. senegal distribution were identified as BIO3, BIO4, BIO11, and BIO12. Temperature factors (BIO3, BIO4, and BIO11) determine species adaptations and affect plant germination, growth, and development [42]. For example, BIO3, indicative of temperature change magnitude, is related to plant temperature sensitivity and cumulative temperature effectiveness [43]. Moisture factors (BIO12) play a key role in plant growth and water balance, directly influencing growth stability [42,44,45].
The use of environmental response curves facilitates the understanding of the relationship between species distribution probability and climatic variables. This study reveals that the distribution potential of S. senegal is higher in areas with higher and less fluctuating temperatures within a given range (Figure 4a–c). Precipitation also influences the distribution potential of S. senegal, with a higher probability of occurrence in areas with lower annual rainfall and a lower probability of occurrence in areas with higher annual rainfall (Figure 4d). Previous studies, including the work by Raddad et al. [46], have shown that the natural distribution area of S. senegal is primarily on stabilized sand dunes with an annual rainfall of approximately 280 mm or on sandy soils within the 280–500 mm isopach lines. Diatta et al. [4] reported that S. senegal usually grows in arid areas with low soil fertility and rainfall ranging from 200–800 mm. The results from this study further demonstrate that a suitable habitat for S. senegal is minimally affected by soil physicochemical properties, exhibits low soil fertility requirements, and has a high growth potential with rainfall between 129.88 and 1263.6 mm. In summary, our research findings regarding the suitable habitat range for S. senegal are similar to but not entirely consistent with other studies, which may be attributed to the multifaceted nature of plant survival influenced by various environmental factors [47,48,49]. While the response curve of a single factor can reflect the overall trend of its impact on plant survival, deriving thresholds from it as the suitable range for plants with regard to that factor is inaccurate. Additionally, we considered bioclimatic variables, topography, and soil factors in assessing the distribution of S. senegal. However, environmental factors influencing plant distribution may extend beyond these, and future research could incorporate additional environmental variables for modeling to achieve more accurate estimates of species potential distribution.
4.2. Changes in Suitable Habitat for S. senegal in Pakistan
Utilizing the MaxEnt model with optimized parameters, this study identified suitable distribution areas for S. senegal in the Sindh, Balochistan, and Punjab Provinces of Pakistan under current climatic conditions. Climate change can significantly impact the range of species, prompting migration to higher latitudes or altitudes [50,51]. Future projections, as indicated by increased precipitation intensity in the Northern Hemisphere’s middle and high latitudes, alongside higher temperatures and increased CO2 concentrations [52], suggest a potential adaptation of species to these changing conditions. The results of this study show that the range of S. senegal in Pakistan under the present climatic conditions was between 24° N and 30° N (Figure 6). However, under the four future climate change scenarios, the range of S. senegal will continue to expand to higher latitudes, potentially reaching a maximum range of 24–34° N (Figure 7). Similar to our study findings, Ashraf et al. [53] found that in Pakistan, the habitat of the Indian olive tree Olea ferruginea (syn. Olea europaea subsp. cuspidata) (Wall. & G.Don) Cif. (Lamiales: Oleaceae) in high-altitude and high-latitude areas will increase under future climate change scenarios. Ali et al. [54] showed that the west Himalayan fir Abies pindrow (Royle ex D.Don) Royle (Pinales: Pinaceae) in Pakistan migrate to higher latitudes owing to global warming and climate change. The economically important crop P. gerardiana Wall. in South Asia also shows a trend of northward migration [40]. In addition, species in various regions around the world are also following their suitable climatic conditions. For example, in Africa, the endemic rose Rosa arabica (Crép. ex Boiss.) Déségl. (Rosales: Rosaceae) in Egypt and the African bamboo Oxytenanthera abyssinica (A.Rich.) Munro (Poales: Poaceae) in Ethiopia are both migrating to higher altitude and higher latitude areas under two future climate change scenarios [55,56]. In Europe, the ecological niche of the false acacia Robinia pseudoacacia L. (Fabales: Fabaceae) tends to shift northeastward with climate change [57]. In the United States of America, the potential distribution areas of three major invasive plant species will also expand northward in the future [58]. These research findings indicate that, against the backdrop of global warming, plants in various regions of the Northern Hemisphere are showing a trend of migrating towards higher latitudes and altitudes. However, the adaptive capacity of different species to extreme climate change differs, leading to significant differences in their habitat ranges under distinct climate change scenarios [39,59]. Qazi et al. [60] showed that compared to SSP2-4.5, the areas of suitable zones of the shrub Buxus papillosa C.K.Schneid. (Euphorbiales: Buxaceae) and the Indian gentian Gentiana kurroo Royle (Gentianales: Gentianaceae) decreased in Pakistan under the SSP5-8.5 scenario (2070s), whereas the area of suitable zones of the shrub Rydingia limbata (Benth.) Scheen & V.A.Albert (Lamiales: Lamiaceae) increased. Gilani et al. [61] showed that compared to RCP4.5, the areas of the habitable zones of the Himalayan pine Pinus wallichiana A. B. Jacks (Pinales: Pinaceae) and the holm oak Quercus ilex L. (Fagales: Fagaceae) decreased in the RCP8.5 scenario (2050s), while A. pindrow, and other Himalayan trees, the birch Betula utilis D.Don (Fagales: Betulaceae), the cedar Cedrus deodara (Roxb.) G.Don (Pinales: Pinaceae), and the spruce Picea smithiana (Wall.) Boiss. (Pinales: Pinaceae) showed an increase in the areas of their suitable habitats. In this study, compared with SSP1-2.6, SSP2-4.5, and SSP4-7.0, the area of the S. senegal suitable zone increased significantly under the SSP5-8.5 scenario (the 2090s), with the most significant increase in the area of the low-suitability zone, suggesting that S. senegal continues to have a high level of resilience, even under extreme climate change conditions.
In addition, the results of the distribution center shift in the suitable area revealed that S. senegal is gradually shifting to higher latitudes in Pakistan, driven by different climatic factors (Figure 8). Specifically, the migration path of the distribution centers of suitable areas for S. senegal generally migrated towards smaller BIO3 and BIO12 and larger BIO4 and BIO11(Table 2), and the reason for this result may be related to the physiological characteristics of S. senegal. Gaafar et al. [62] demonstrated that S. senegal can utilize a well-developed root system to improve drought tolerance in a composite agroforestry system. Githae et al. [63] showed that S. senegal has a strong nitrogen fixation capacity that can enhance its adaptability to arid and infertile soil environments. S. senegal exhibits a rare adaptive response to water and drought stress, ensuring that it produces high biomass in extremely dry environments [62,64]. In summary, S. senegal can respond well to drastic climate change in the future, and the extension of cultivation through S. senegal may help Pakistan alleviate the environmental stresses caused by extreme climate change to some extent.
4.3. Recommendations for the Introduction of S. senegal for Afforestation in Pakistan
Senegalia senegal holds economic and ecological value and demonstrates robust growth under hot, dry, and infertile soil conditions. It is well-suited for extensive cultivation in Pakistan, especially in the southern coastal areas. Pakistan faces severe challenges related to land degradation and desertification, particularly in the irrigated areas of Punjab, Sindh, and Balochistan [65]. Poor irrigation and drainage, coupled with low local rainfall and higher evapotranspiration than annual precipitation, lead to salt accumulation in the soil profile, contributing to low soil fertility, reduced crop yields, and the loss of biodiversity [66]. In addition, sandy areas are predominantly located in regions with low development potential and moving sand dunes pose a significant threat to local agricultural facilities and settlements [65,67]. The results of this study indicate that S. senegal is less affected by soil fertility, is suitable for survival in high-temperature and low-rainfall environments, and has a high potential for survival in Sind Province, Balochistan Province, and Punjab (Figure 5). Moreover, suitable habitats rarely shrink under different climate change scenarios, tending to expand even under extreme climate change conditions (Figure 7). Therefore, we propose implementing S. senegal afforestation in the three southern provinces of Pakistan (Sindh, Balochistan, and Punjab), especially around the Cholistan, Thal Doab, Thar, and Kharan Desert patches, which will be crucial for protecting the security of agricultural production and promoting socioeconomic development.
5. Conclusions
In this study, the optimized MaxEnt model was used to predict potentially suitable habitats for S. senegal under four climate change scenarios ranging from positive to extremely severe. This predictive modeling offers a theoretical foundation for the judicious utilization and sustainable scientific management of S. senegal plant resources. Under current climatic conditions, suitable habitats are predominantly concentrated in the southern region of Pakistan, spanning the provinces of Punjab, Sindh, and Balochistan. Hydrothermal conditions, represented by BIO3, BIO4, BIO11, and BIO12, emerge as pivotal factors influencing the suitability of habitats for S. senegal. Notably, under various future climate change scenarios, habitats conducive to S. senegal rarely shrink, with an overarching tendency to expand towards higher latitudes, particularly under extremely severe climate change scenarios. Therefore, it is recommended to implement afforestation initiatives for S. senegal in the southern coastal areas of Pakistan, particularly in Gwadar, Lasbela, Karachi, Thatta, and Tharparkar. This strategic approach aims to enhance the success rate of S. senegal introductions and provide a reference for Pakistan’s afforestation efforts for sand stabilization, land protection, and ecological sustainability.
Author Contributions
J.F., writing—original draft, writing—review and editing, formal analysis, conceptualization, methodology; J.S., writing—original draft, writing—review and editing, conceptualization; P.Z., conceptualization, methodology; M.S., methodology; N.Z., funding acquisition. Y.W., funding acquisition, writing—review and editing; X.X., methodology. All authors have read and agreed to the published version of the manuscript.
Funding
This research was funded by Xinjiang Uygur Autonomous Region Regional Collaborative Innovation Project (No. 2021E01021), Autonomous Region Key Research and Development Program (No. 202107663) and “Silk Road Economic Belt” Ecological Construction Technology Demonstration National Base for International Science and Technology Cooperation.
Data Availability Statement
The data presented in this study are available on request from the corresponding author.
Conflicts of Interest
The authors declare that they have no known competing financial interests or personal relationships that could have appeared to influence the work reported in this paper.
References
- D’Odorico, P.; Bhattachan, A.; Davis, K.F.; Ravi, S.; Runyan, C.W. Global desertification: Drivers and feedbacks. Adv. Water Resour. 2013, 51, 326–344. [Google Scholar] [CrossRef]
- Huang, J.; Yu, H.; Guan, X.; Wang, G.; Guo, R. Accelerated dryland expansion under climate change. Nat. Clim. Chang. 2016, 6, 166–171. [Google Scholar] [CrossRef]
- Qi, K.; Zhu, J.; Zheng, X.; Wang, G.G.; Li, M. Impacts of the world’s largest afforestation program (Three-North Afforestation Program) on desertification control in sandy land of China. GISci. Remote Sens. 2023, 60, 2167574. [Google Scholar] [CrossRef]
- Diatta, O.; Sarr, M.S.; Hansen, J.K.; Diallo, A.M.; Nielsen, L.R.; Raebild, A.; Kjaer, E.D. Survival and growth of Acacia senegal (L.) Wild. (Senegalia senegal (L.) Britton) provenances depend on the rainfall at the site of origin. Ann. For. Sci. 2021, 78, 82. [Google Scholar] [CrossRef]
- Bakhoum, N.; Fall, D.; Fall, F.; Diouf, F.; Hirsch, A.M.; Balachandar, D.; Diouf, D. Senegalia senegal (synonym: Acacia senegal), its importance to sub-Saharan Africa, and its relationship with a wide range of symbiotic soil microorganisms. S. Afr. J. Bot. 2018, 119, 362–368. [Google Scholar] [CrossRef]
- Sanchez, C.; Nigen, M.; Tamayo, V.M.; Doco, T.; Williams, P.; Amine, C.; Renard, D. Acacia gum: History of the future. Food Hydrocoll. 2018, 78, 140–160. [Google Scholar] [CrossRef]
- Odee, D.W.; Wilson, J.; Cavers, S. Prospects for Genetic Improvement of Acacia Senegal: Can Molecular Approaches Deliver Better Gum Yield and Quality?. In Gum Arabic; Kennedy, J.F., Phillips, G.O., Williams, P.A., Eds.; The Royal Society of Chemistry: London, UK, 2011. [Google Scholar]
- Raddad, E.Y.; Luukkanen, O. The influence of different Acacia senegal agroforestry systems on soil water and crop yields in clay soils of the Blue Nile region, Sudan. Agric. Water Manag. 2007, 87, 61–72. [Google Scholar] [CrossRef]
- Diallo, M.D.; Goalbaye, T.; Mahamat-Saleh, M.; Sarr, P.S.; Masse, D.; Wood, S.A.; Diop, L.; Dick, R.P.; Diop, A.; Guisse, A. Effects of major woody species of the Senegalese Great Green Wall on N mineralization and microbial biomass in soils. Bois For. Trop. 2017, 333, 43–54. [Google Scholar]
- Yonli, H.H.; Sene, G.; Sanon, K.B.; Dianda, M.; Khasa, D.P. Senegalia senegal (L.) Britton Response to Microbial and Manure Amendments for the Rehabilitation of Waste Rock Dumps in the Essakane Gold Mining Site, Burkina Faso. Front. Environ. Sci. 2022, 10, 803009. [Google Scholar] [CrossRef]
- Fall, D.; Bakhoum, N.; Sall, S.N.; Zoubeirou, A.M.; Sylla, S.N.; Diouf, D. Rhizobial Inoculation Increases Soil Microbial Functioning and Gum Arabic Production of 13-Year-Old Senegalia senegal (L.) Britton, Trees in the North Part of Senegal. Front. Plant Sci. 2016, 7, 1355. [Google Scholar] [CrossRef]
- Zhao, Y.; Deng, X.; Xiang, W.; Chen, L.; Ouyang, S. Predicting potential suitable habitats of Chinese fir under current and future climatic scenarios based on Maxent model. Ecol. Inform. 2021, 64, 101393. [Google Scholar] [CrossRef]
- Evans, J.M.; Fletcher, R.J., Jr.; Alavalapati, J. Using species distribution models to identify suitable areas for biofuel feedstock production. Glob. Chang. Biol. Bioenergy 2010, 2, 63–78. [Google Scholar] [CrossRef]
- Zhao, Z.; Xiao, N.; Shen, M.; Li, J. Comparison between optimized MaxEnt and random forest modeling in predicting potential distribution: A case study with Quasipaa boulengeri in China. Sci. Total Environ. 2022, 842, 156867. [Google Scholar] [CrossRef]
- Kang, J.; Liu, M.; Qu, M.; Guang, X.; Chen, J.; Zhao, Y.; Huang, B. Identifying the potential soil pollution areas derived from the metal mining industry in China using MaxEnt with mine reserve scales (MaxEnt_MRS). Environ. Pollut. 2023, 329, 121687. [Google Scholar] [CrossRef]
- Phillips, S.J.; Anderson, R.P.; Schapire, R.E. Maximum entropy modeling of species geographic distributions. Ecol. Model. 2006, 190, 231–259. [Google Scholar] [CrossRef]
- Bao, R.; Li, X.; Zheng, J. Feature tuning improves MAXENT predictions of the potential distribution of Pedicularis longiflora Rudolph and its variant. PeerJ 2022, 10, e13337. [Google Scholar] [CrossRef]
- Araujo, M.B.; Anderson, R.P.; Marcia Barbosa, A.; Beale, C.M.; Dormann, C.F.; Early, R.; Garcia, R.A.; Guisan, A.; Maiorano, L.; Naimi, B.; et al. Standards for distribution models in biodiversity assessments. Sci. Adv. 2019, 5, eaat4858. [Google Scholar] [CrossRef]
- Araújo, M.B.; Whittaker, R.J.; Ladle, R.J.; Erhard, M. Reducing uncertainty in projections of extinction risk from climate change. Glob. Ecol. Biogeogr. 2005, 14, 529–538. [Google Scholar] [CrossRef]
- Sillero, N.; Barbosa, A.M. Common mistakes in ecological niche models. Int. J. Geogr. Inf. Sci. 2021, 35, 213–226. [Google Scholar] [CrossRef]
- Min, Y.; Zhang, Y.; Kang, J.; Feng, K. Study on Spatial-temporal Dynamic Monitoring of Degree of Desertification in CPEC based on MODIS Image. Remote Sens. Technol. Appl. 2021, 36, 827–837. [Google Scholar]
- Chen, I.C.; Hill, J.K.; Ohlemueller, R.; Roy, D.B.; Thomas, C.D. Rapid Range Shifts of Species Associated with High Levels of Climate Warming. Science 2011, 333, 1024–1026. [Google Scholar] [CrossRef]
- Harrison, P.A.; Berry, P.M.; Butt, N.; New, M. Modelling climate change impacts on species’ distributions at the European scale: Implications for conservation policy. Environ. Sci. Policy 2006, 9, 116–128. [Google Scholar] [CrossRef]
- Xiao, J.; Eziz, A.; Zhang, H.; Wang, Z.; Tang, Z.; Fang, J. Responses of four dominant dryland plant species to climate change in the Junggar Basin, northwest China. Ecol. Evol. 2019, 9, 13596–13607. [Google Scholar] [CrossRef]
- Bellard, C.; Bertelsmeier, C.; Leadley, P.; Thuiller, W.; Courchamp, F. Impacts of climate change on the future of biodiversity. Ecol. Lett. 2012, 15, 365–377. [Google Scholar] [CrossRef]
- Alabar, F.; Politi, N.; Nazaro, P.; Amoroso, M.; Rivera, L. Changes in the potential distribution of valuable tree species based on their regeneration in the Neotropical seasonal dry forest of north-western Argentina. Environ. Conserv. 2022, 49, 83–89. [Google Scholar] [CrossRef]
- Guo, Y.; Zhao, Z.; Zhu, F.; Li, X. Climate change may cause distribution area loss for tree species in southern China. For. Ecol. Manag. 2022, 511, 120134. [Google Scholar] [CrossRef]
- Vieira, T.L.; Barbosa-Silva, R.G.; Acosta, A.L.; van den Berg, C. Expanding the Distribution of Prosthechea jauana (Orchidaceae) in the Pantepui and Highlighting the Urgent Need for Conservation Strategies in the Region in Face of Climate Change. Plants 2024, 13, 222. [Google Scholar] [CrossRef]
- Beck, H.E.; McVicar, T.R.; Vergopolan, N.; Berg, A.; Lutsko, N.J.; Dufour, A.; Zeng, Z.; Jiang, X.; van Dijk, A.I.J.M.; Miralles, D.G. High-resolution (1 km) Köppen-Geiger maps for 1901–2099 based on constrained CMIP6 projections. Sci. Data 2023, 10, 724. [Google Scholar] [CrossRef]
- Shao, M.; Fan, J.; Ma, J.; Wang, L. Identifying the natural reserve area of Cistanche salsa under the effects of multiple host plants and climate change conditions using a maximum entropy model in Xinjiang, China. Front. Plant Sci. 2022, 13, 934959. [Google Scholar] [CrossRef]
- Warren, D.L.; Wright, A.N.; Seifert, S.N.; Shaffer, H.B. Incorporating model complexity and spatial sampling bias into ecological niche models of climate change risks faced by 90 California vertebrate species of concern. Divers. Distrib. 2014, 20, 334–343. [Google Scholar] [CrossRef]
- Muscarella, R.; Galante, P.J.; Soley-Guardia, M.; Boria, R.A.; Kass, J.M.; Uriarte, M.; Anderson, R.P. ENMeval: An R package for conducting spatially independent evaluations and estimating optimal model complexity for MAXENT ecological niche models. Methods Ecol. Evol. 2014, 5, 1198–1205. [Google Scholar] [CrossRef]
- Warren, D.L.; Seifert, S.N. Ecological niche modeling in Maxent: The importance of model complexity and the performance of model selection criteria. Ecol. Appl. 2011, 21, 335–342. [Google Scholar] [CrossRef]
- Elith, J.; Phillips, S.J.; Hastie, T.; Dudik, M.; Chee, Y.E.; Yates, C.J. A statistical explanation of MaxEnt for ecologists. Divers. Distrib. 2011, 17, 43–57. [Google Scholar] [CrossRef]
- Tarnian, F.; Kumar, S.; Azarnivand, H.; Chahouki, M.A.Z.; Mossivand, A.M. Assessing the effects of climate change on the distribution of Daphne mucronata in Iran. Environ. Monit. Assess. 2021, 193, 562. [Google Scholar] [CrossRef]
- Shao, M.; Wang, L.; Li, B.; Li, S.; Fan, J.; Li, C. Maxent Modeling for Identifying the Nature Reserve of Cistanche deserticola Ma under Effects of the Host (Haloxylon Bunge) Forest and Climate Changes in Xinjiang, China. Forests 2022, 13, 189. [Google Scholar] [CrossRef]
- Dillon, M.E.; Wang, G.; Huey, R.B. Global metabolic impacts of recent climate warming. Nature 2010, 467, U704–U788. [Google Scholar] [CrossRef]
- Sun, S.; Zhang, Y.; Huang, D.; Wang, H.; Cao, Q.; Fan, P.; Yang, N.; Zheng, P.; Wang, R. The effect of climate change on the richness distribution pattern of oaks (Quercus L.) in China. Sci. Total Environ. 2020, 744, 140786. [Google Scholar] [CrossRef]
- Waheed, M.; Haq, S.M.; Arshad, F.; Jameel, M.A.; Siddiqui, M.H.H.; Bussmann, R.W.W.; Manshoor, N.; Alamri, S. Where Will Threatened Aegle marmelos L., a Tree of the Semi-Arid Region, Go under Climate Change? Implications for the Reintroduction of the Species. Land 2023, 12, 1433. [Google Scholar] [CrossRef]
- Khan, A.M.; Li, Q.; Saqib, Z.; Khan, N.; Habib, T.; Khalid, N.; Majeed, M.; Tariq, A. MaxEnt Modelling and Impact of Climate Change on Habitat Suitability Variations of Economically Important Chilgoza Pine (Pinus gerardiana Wall.) in South Asia. Forests 2022, 13, 715. [Google Scholar] [CrossRef]
- Bhandari, M.S.; Meena, R.K.; Shankhwar, R.; Shekhar, C.; Saxena, J.; Kant, R.; Pandey, V.V.; Barthwal, S.; Pandey, S.; Chandra, G.; et al. Prediction Mapping Through Maxent Modeling Paves the Way for the Conservation of Rhododendron arboreum in Uttarakhand Himalayas. J. Indian Soc. Remote Sens. 2020, 48, 411–422. [Google Scholar] [CrossRef]
- Kogo, B.K.; Kumar, L.; Koech, R.; Kariyawasam, C.S. Modelling Climate Suitability for Rainfed Maize Cultivation in Kenya Using a Maximum Entropy (MaxENT) Approach. Agronomy 2019, 9, 727. [Google Scholar] [CrossRef]
- Ying, B.; Tian, K.; Guo, H.; Yang, X.; Li, W.; Li, Q.; Luo, Y.; Zhang, X. Prediction potential suitable habitats of Kandelia obvata in China under future climate scenarios based on MaxEnt model. Acta Ecol. Sin. 2024, 44, 224–234. [Google Scholar] [CrossRef]
- Thornton, P.K.; Jones, P.G.; Alagarswamy, G.; Andresen, J. Spatial variation of crop yield response to climate change in East Africa. Glob. Environ. Chang.-Hum. Policy Dimens. 2009, 19, 54–65. [Google Scholar] [CrossRef]
- He, Q.; Zhou, G. Climate-associated distribution of summer maize in China from 1961 to 2010. Agric. Ecosyst. Environ. 2016, 232, 326–335. [Google Scholar] [CrossRef]
- Raddad, E.Y.; Luukkanen, O. Adaptive genetic variation in water-use efficiency and gum yield in Acacia senegal provenances grown on clay soil in the Blue Nile region, Sudan. For. Ecol. Manag. 2006, 226, 219–229. [Google Scholar] [CrossRef]
- Benning, J.W.; Moeller, D.A. Plant-soil interactions limit lifetime fitness outside a native plant’s geographic range margin. Ecology 2021, 102, e03254. [Google Scholar] [CrossRef]
- Garcia, K.; Lasco, R.; Ines, A.; Lyon, B.; Pulhin, F. Predicting geographic distribution and habitat suitability due to climate change of selected threatened forest tree species in the. Philippines. Appl. Geogr. 2013, 44, 12–22. [Google Scholar] [CrossRef]
- Parmesan, C.; Yohe, G. A globally coherent fingerprint of climate change impacts across natural systems. Nature 2003, 421, 37–42. [Google Scholar] [CrossRef]
- Li, J.; Chang, H.; Liu, T.; Zhang, C. The potential geographical distribution of Haloxylon across Central Asia under climate change in the 21st century. Agric. For. Meteorol. 2019, 275, 243–254. [Google Scholar] [CrossRef]
- Bertrand, R.; Lenoir, J.; Piedallu, C.; Riofrio-Dillon, G.; de Ruffray, P.; Vidal, C.; Pierrat, J.-C.; Gegout, J.-C. Changes in plant community composition lag behind climate warming in lowland forests. Nature 2011, 479, 517–520. [Google Scholar] [CrossRef]
- Tang, M.; Chen, J.; Yang, L.; Jia, X.; Liu, J.; Duan, J. Distribution and change of major biofuel tree species in China under climate change. Acta Ecol. Sin. 2023, 43, 10156–10170. [Google Scholar] [CrossRef]
- Ashraf, U.; Ali, H.; Chaudry, M.N.; Ashraf, I.; Batool, A.; Saqib, Z. Predicting the Potential Distribution of Olea ferruginea in Pakistan incorporating Climate Change by Using Maxent Model. Sustainability 2016, 8, 722. [Google Scholar] [CrossRef]
- Ali, K.; Ahmad, H.; Khan, N.; Jury, S. Future of Abies pindrow in Swat district, northern Pakistan. J. For. Res. 2014, 25, 211–214. [Google Scholar] [CrossRef]
- Abdelaal, M.; Fois, M.; Fenu, G.; Bacchetta, G. Using MaxEnt modeling to predict the potential distribution of the endemic plant Rosa arabica Crep. in Egypt. Ecol. Inform. 2019, 50, 68–75. [Google Scholar] [CrossRef]
- Gebrewahid, Y.; Abrehe, S.; Meresa, E.; Eyasu, G.; Abay, K.; Gebreab, G.; Kidanemariam, K.; Adissu, G.; Abreha, G.; Darcha, G. Current and future predicting potential areas of Oxytenanthera abyssinica (A. Richard) using MaxEnt model under climate change in Northern Ethiopia. Ecol. Process. 2020, 9, 6. [Google Scholar] [CrossRef]
- Puchalka, R.; Dyderski, M.K.; Vitkova, M.; Sadlo, J.; Klisz, M.; Netsvetov, M.; Prokopuk, Y.; Matisons, R.; Mionskowski, M.; Wojda, T.; et al. Black locust (Robinia pseudoacacia L.) range contraction and expansion in Europe under changing climate. Glob. Chang. Biol. 2021, 27, 1587–1600. [Google Scholar] [CrossRef]
- Bradley, B.A.; Wilcove, D.S.; Oppenheimer, M. Climate change increases risk of plant invasion in the Eastern United States. Biol. Invasions 2010, 12, 1855–1872. [Google Scholar] [CrossRef]
- Arshad, F.; Waheed, M.; Fatima, K.; Harun, N.; Iqbal, M.; Fatima, K.; Umbreen, S. Predicting the Suitable Current and Future Potential Distribution of the Native Endangered Tree Tecomella undulata (Sm.) Seem. in Pakistan. Sustainability 2022, 14, 7215. [Google Scholar] [CrossRef]
- Qazi, A.W.; Saqib, Z.; Zaman-ul-Haq, M.; Gardezi, S.M.H.; Khan, A.M.; Khan, I.; Munir, A.; Ahmed, I. Modelling Impacts of Climate Change on Habitat Suitability of Three Endemic Plant Species in Pakistan. Pol. J. Environ. Stud. 2023, 32, 3281–3290. [Google Scholar] [CrossRef]
- Gilani, H.; Goheer, M.A.; Ahmad, H.; Hussain, K. Under predicted climate change: Distribution and ecological niche modelling of six native tree species in Gilgit-Baltistan, Pakistan. Ecol. Indic. 2020, 111, 106049. [Google Scholar] [CrossRef]
- Gaafar, A.M.; Salih, A.A.; Luukkanen, O.; El Fadl, M.A.; Kaarakka, V. Improving the traditional Acacia senegal-crop system in sudan: The effect of tree density on water use, gum production and crop yields. Agrofor. Syst. 2006, 66, 1–11. [Google Scholar] [CrossRef]
- Githae, E.W.; Gachene, C.K.K.; Njoka, J.T.; Omondi, S.F. Nitrogen Fixation by Natural Populations of Acacia Senegal in the Drylands of Kenya Using 15N Natural Abundance. Arid Land Res. Manag. 2013, 27, 327–336. [Google Scholar] [CrossRef]
- Diallo, A.M.; Nielsen, L.R.; Kjaer, E.D.; Petersen, K.K.; Raebild, A. Polyploidy can Confer Superiority to West African Acacia senegal (L.) Willd. Trees. Front. Plant Sci. 2016, 7, 821. [Google Scholar] [CrossRef] [PubMed]
- Akram, M.; Kahlown, M.A.; Soomro, Z.A. Desertification Control for Sustainable Land Use in the Cholistan Desert, Pakistan. In Proceedings of the International Scientific Conference on Desertification and Drylands Research, Tunis, Tunisia, 19–21 June 2006; Springer: Dordrecht, The Netherlands, 2008; pp. 483–492. [Google Scholar]
- Khan, A.N.; Ali, A. Desertification Risk Reduction Approaches in Pakistan. In Disaster Risk Reduction Approaches in Pakistan; AttaUrRahman, F.R.S., Khan, A.N., Shaw, R., Eds.; Disaster Risk Reduction; Springer: Tokyo, Janpan, 2015; pp. 161–173. [Google Scholar]
- Anjum, S.A.; Wang, L.-C.; Xue, L.-L.; Saleem, M.F.; Wang, G.-X.; Zou, C.-M. Desertification in Pakistan: Causes, impacts and management. J. Food Agric. Environ. 2010, 8, 1203–1208. [Google Scholar]
Figure 1.
Global distribution status of S. senegal. (Abbreviations in the map follow those of the Köppen–Geiger climate classification map [29]).
Figure 1.
Global distribution status of S. senegal. (Abbreviations in the map follow those of the Köppen–Geiger climate classification map [29]).
Figure 2.
Climate factor correlation heat map.
Figure 3.
Evaluation of environmental factors using the jackknife method (a–c).
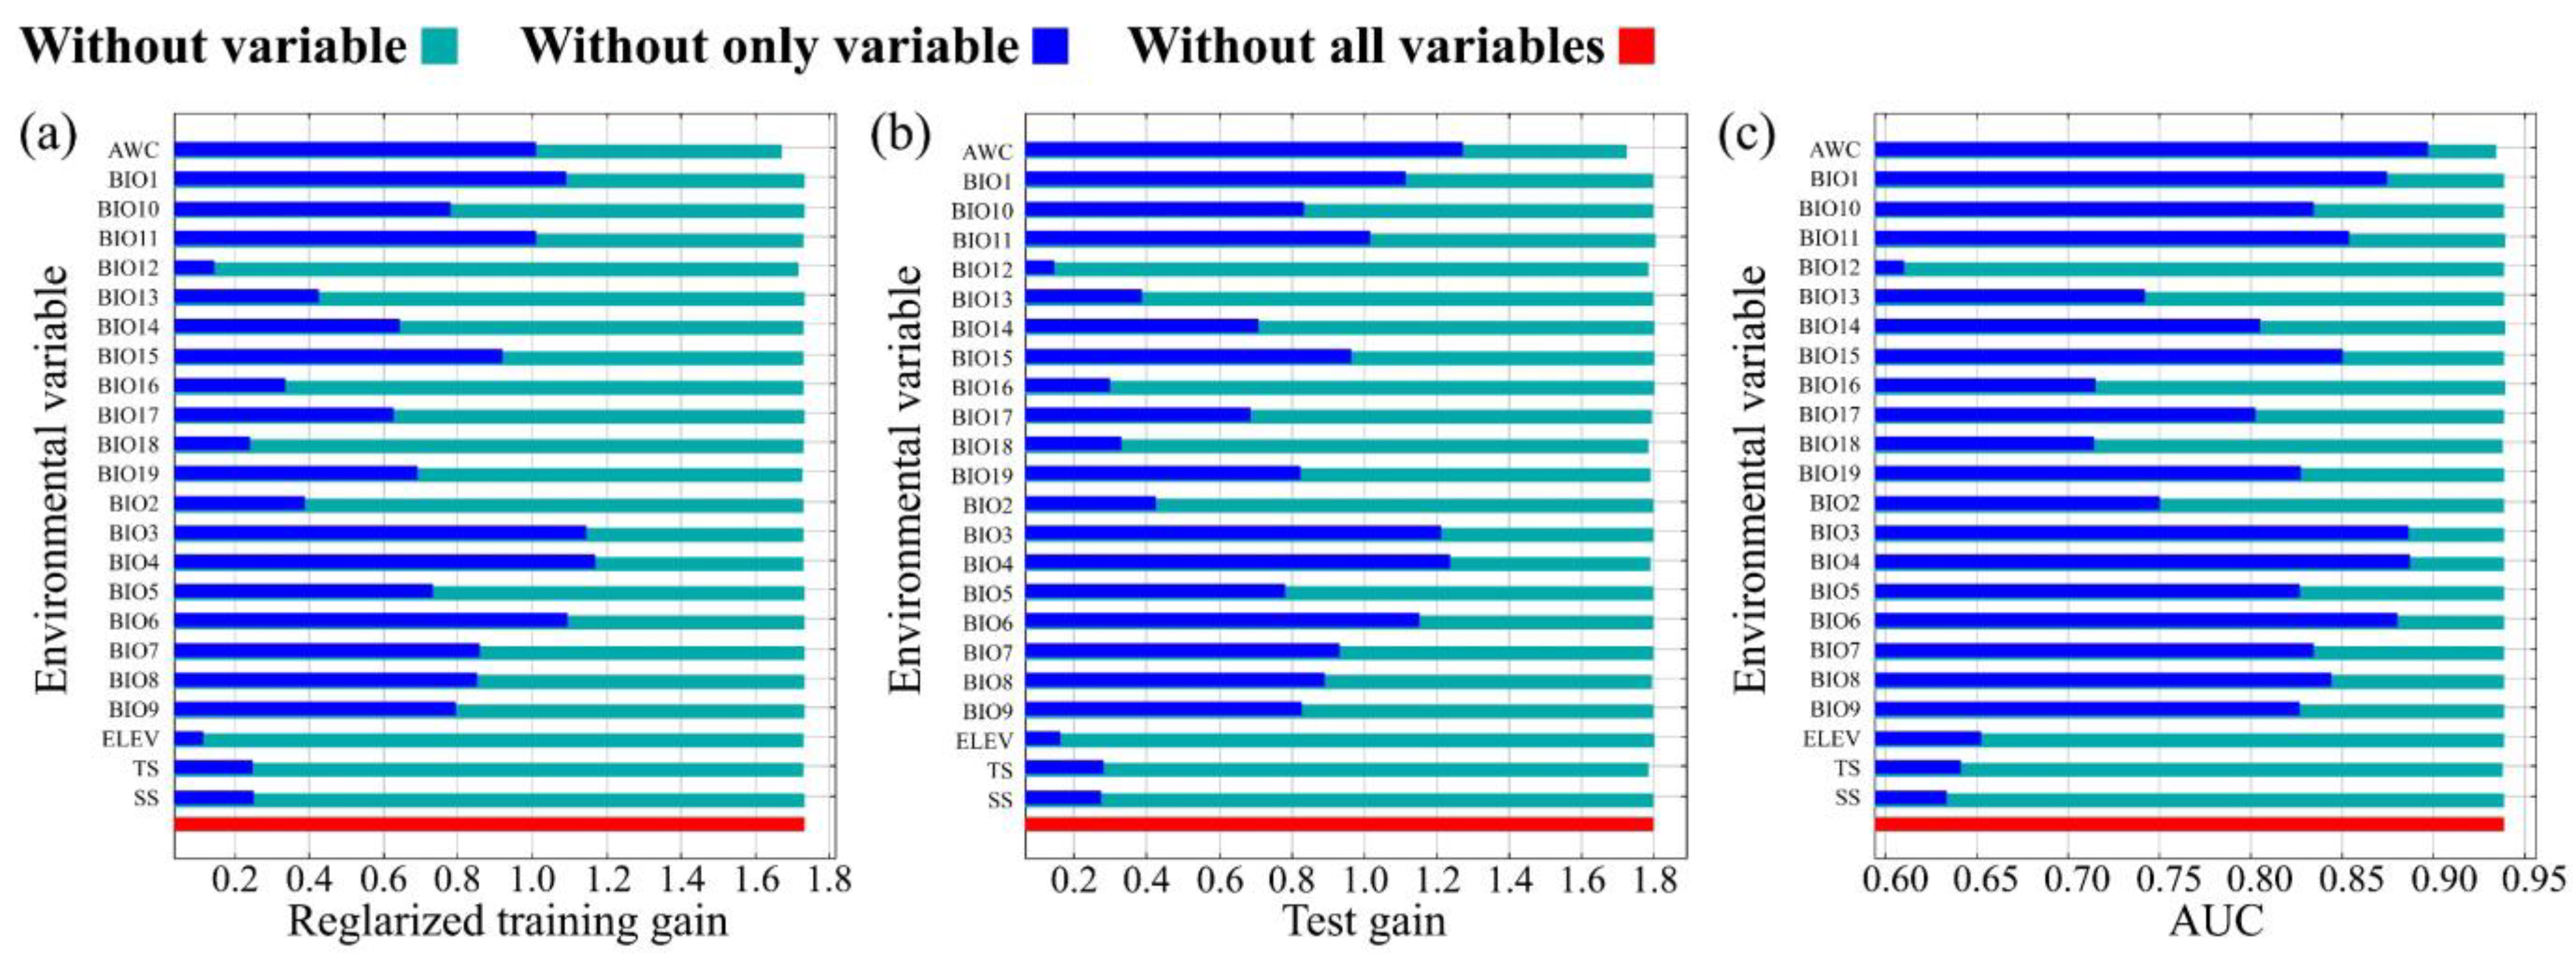
Figure 4.
The relationship between potentially suitable areas and single factor response variables. (a) BIO3 (Isothermality); (b) BIO4 (Temperature seasonality); (c) BIO11 (Mean temperature of coldest quarter); (d) BIO12 (Annual precipitation).
Figure 4.
The relationship between potentially suitable areas and single factor response variables. (a) BIO3 (Isothermality); (b) BIO4 (Temperature seasonality); (c) BIO11 (Mean temperature of coldest quarter); (d) BIO12 (Annual precipitation).

Figure 5.
Potentially suitable habitats for S. senegal under current climatic conditions.

Figure 6.
Potentially suitable habitat for S. senegal under future (2020–2100s) climatic scenarios. (The figure uses the 2030s to represent the 2020–2040s, 2050s to represent the 2040–2060s, 2070s for the 2060–2080s, and the 2090s to represent the 2080–2100s. Similarly, thereafter).
Figure 6.
Potentially suitable habitat for S. senegal under future (2020–2100s) climatic scenarios. (The figure uses the 2030s to represent the 2020–2040s, 2050s to represent the 2040–2060s, 2070s for the 2060–2080s, and the 2090s to represent the 2080–2100s. Similarly, thereafter).
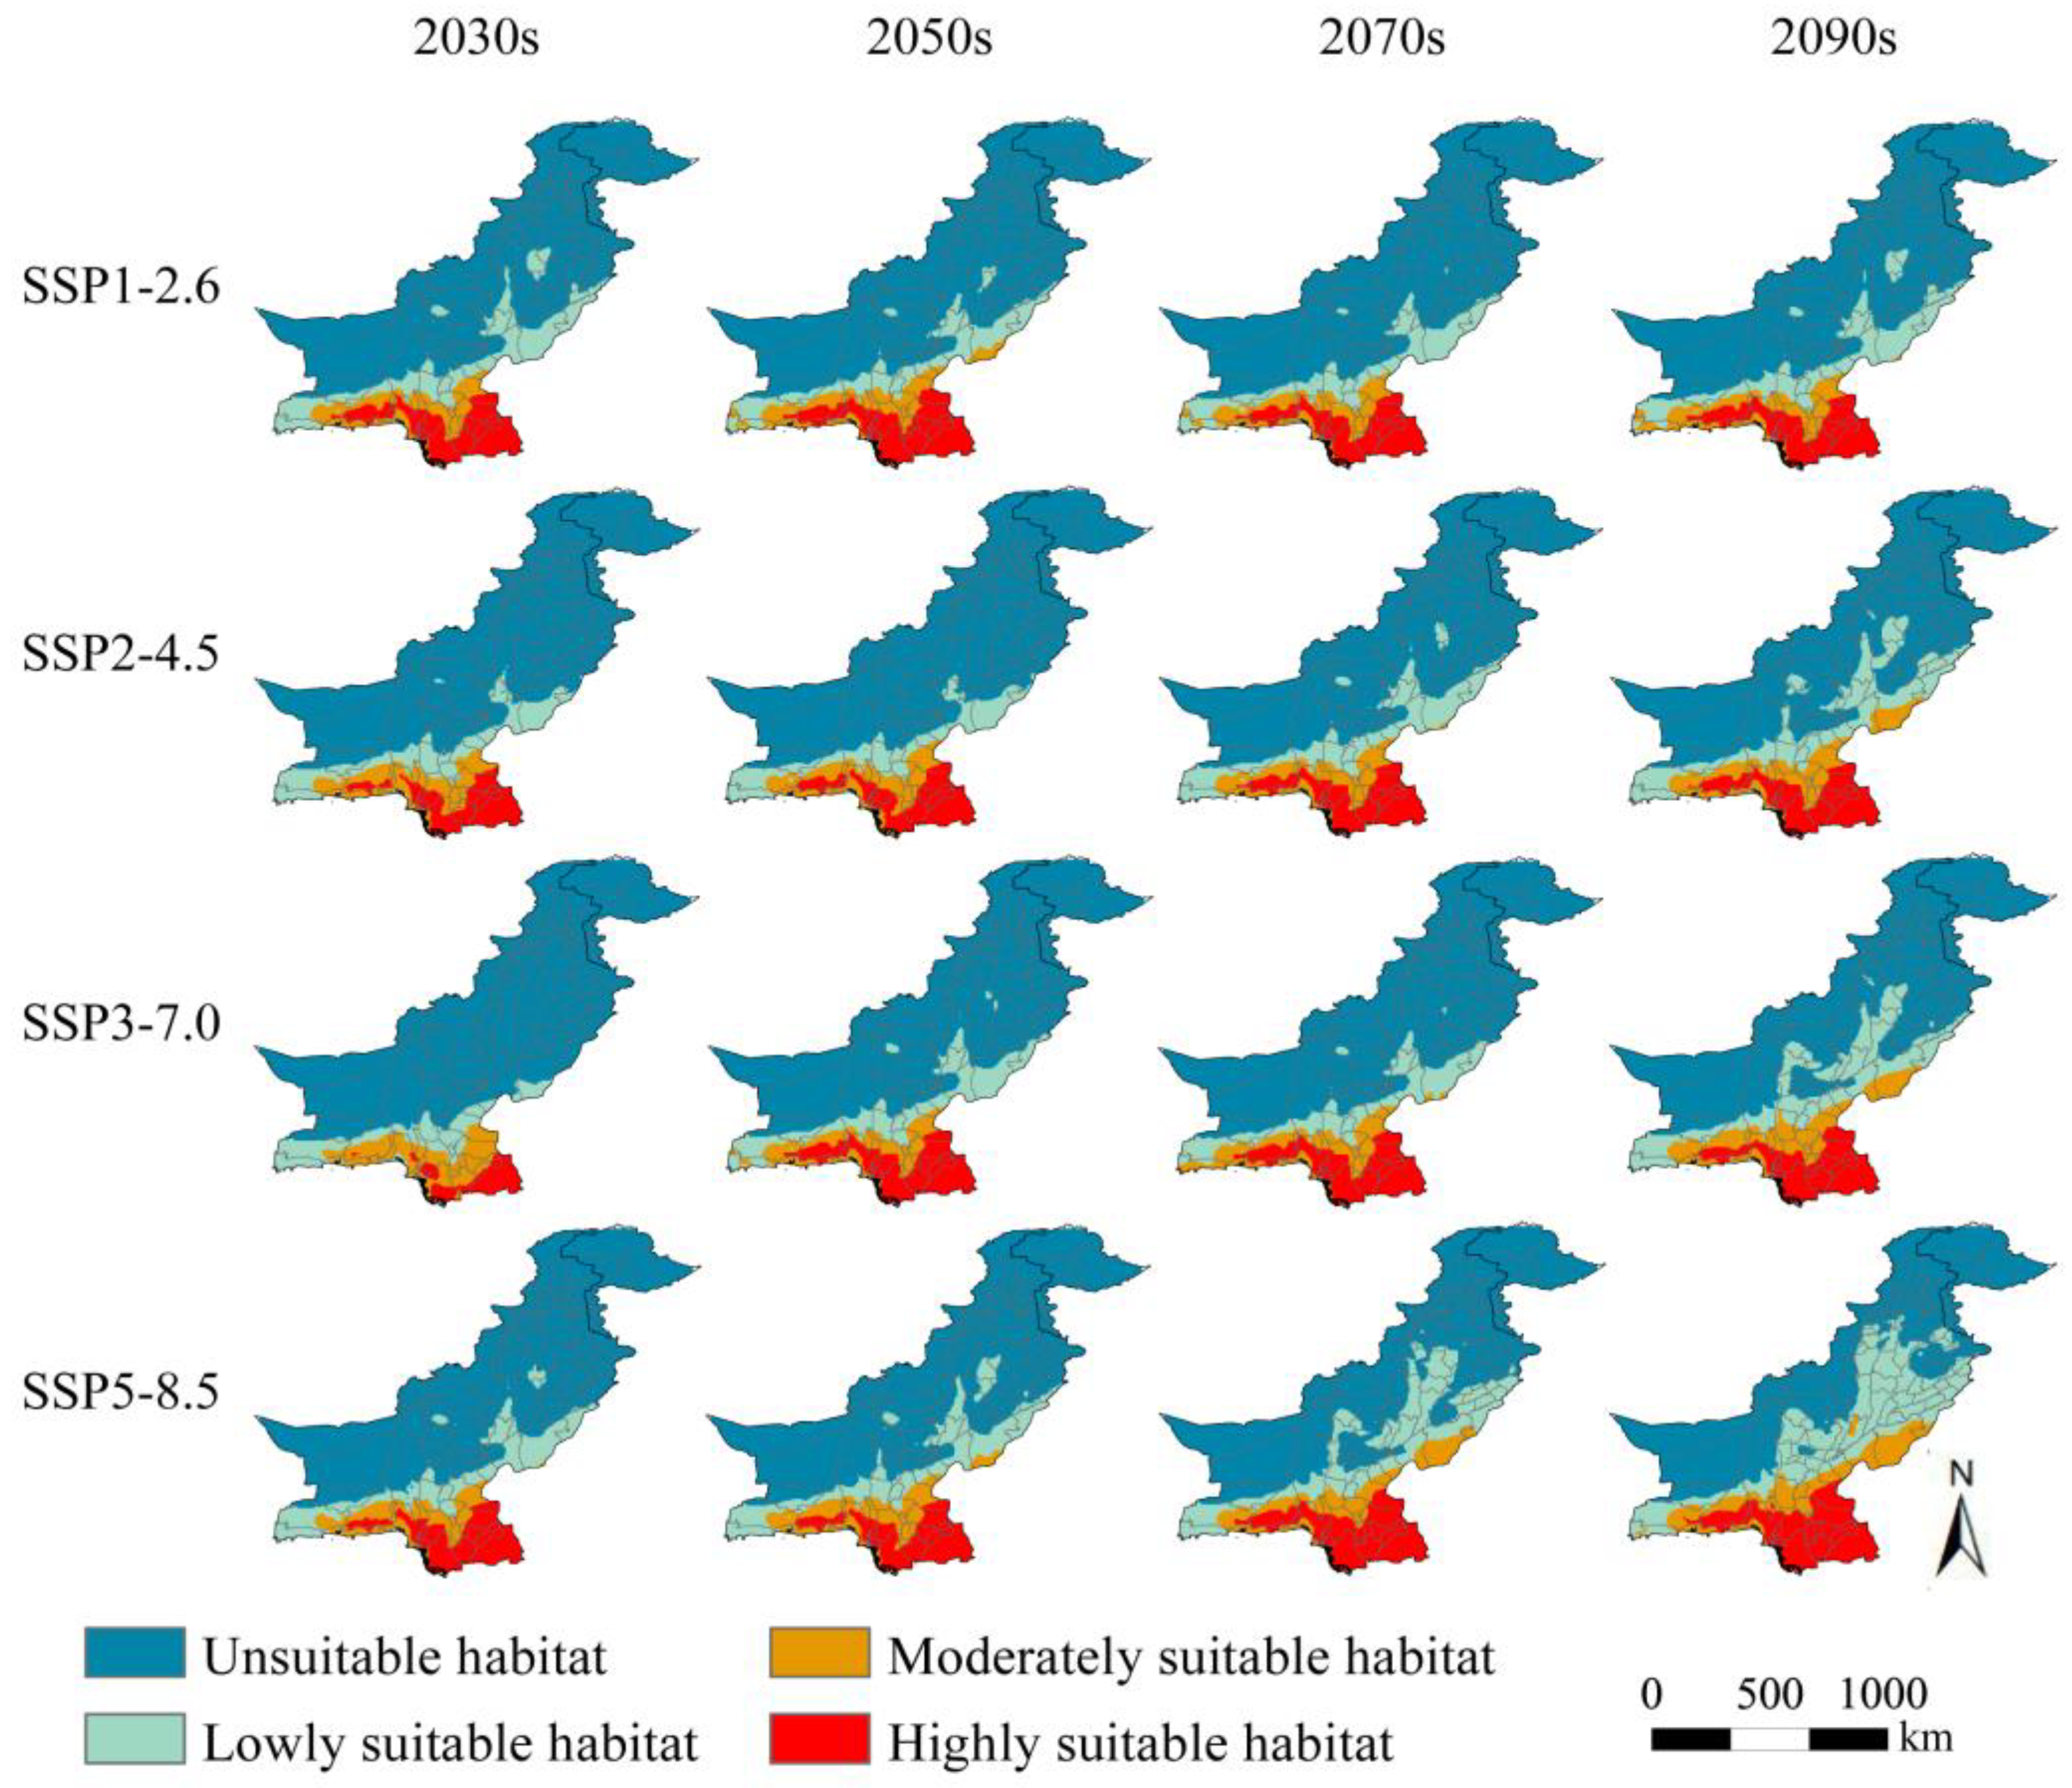
Figure 7.
Changes in potentially suitable areas of S. senegal from current to future climatic conditions.
Figure 7.
Changes in potentially suitable areas of S. senegal from current to future climatic conditions.
Figure 8.
Distribution center shift of S. senegal from current to future climatic conditions.

Table 1.
Potential environmental factors affecting S. senegal distribution.
| Number | Variable | Percent Contribution | Permutation Importance |
|---|---|---|---|
| 1 | Isothermality (BIO3) | 30.5 | 8.1 |
| 2 | Precipitation of driest month (BIO14) | 12.7 | 0.3 |
| 3 | Mean temperature of coldest quarter (BIO11) | 10 | 33 |
| 4 | Precipitation of coldest quarter (BIO19) | 5.9 | 1.4 |
| 5 | Annual mean temperature (BIO1) | 5.5 | 0 |
| 6 | Annual precipitation (BIO12) | 5.3 | 22.4 |
| 7 | Precipitation seasonality (BIO15) | 4.6 | 3.3 |
| 8 | Precipitation of wettest month (BIO13) | 3.7 | 0 |
| 9 | Available Water Content (AWC) | 3.6 | 5.7 |
| 10 | Min temperature of coldest month (BIO6) | 3.2 | 10.5 |
| 11 | Max temperature of warmest month (BIO5) | 2.6 | 0 |
| 12 | Mean temperature of warmest quarter (BIO10) | 2.3 | 0.6 |
| 13 | Mean temperature of wettest quarter (BIO8) | 2 | 0.1 |
| 14 | Mean diurnal range (BIO2) | 1.9 | 0.1 |
| 15 | Precipitation of wettest quarter (BIO16) | 1.3 | 2.6 |
| 16 | Temperature seasonality (BIO4) | 1.1 | 6 |
| 17 | Precipitation of warmest quarter (BIO18) | 0.9 | 1.9 |
| 18 | Mean temperature of driest quarter (BIO9) | 0.7 | 0 |
| 19 | Elevation (Elev) | 0.6 | 1.1 |
| 20 | Temperature annual range (BIO7) | 0.5 | 1 |
| 21 | Topsoil salinity (TS) | 0.5 | 1.2 |
| 22 | Precipitation of driest quarter (BIO17) | 0.2 | 0.7 |
| 23 | Subsoil salinity (SS) | 0.2 | 0 |
Table 2.
Changes in key environmental factors at the distribution center under future climate conditions.
Table 2.
Changes in key environmental factors at the distribution center under future climate conditions.
| Environmental Variables | Climate Scenario | Current | 2050s | 2070s | 2090s |
|---|---|---|---|---|---|
| BIO3 | SSP1-2.6 | 48.65 | 45.14 | 50.44 | 44.51 |
| SSP2-4.5 | 48.65 | 43.19 | 42.65 | 39.62 | |
| SSP3-7.0 | 48.65 | 43.48 | 43.59 | 39.29 | |
| SSP5-8.5 | 48.65 | 41.43 | 38.48 | 37.08 | |
| BIO4 | SSP1-2.6 | 550.62 | 626.35 | 563.49 | 744.97 |
| SSP2-4.5 | 550.62 | 653.49 | 744.72 | 768.59 | |
| SSP3-7.0 | 550.62 | 642.31 | 704.32 | 737.19 | |
| SSP5-8.5 | 550.62 | 743.82 | 753.74 | 756.59 | |
| BIO11/℃ | SSP1-2.6 | 16.81 | 15.46 | 21.31 | 19.30 |
| SSP2-4.5 | 16.81 | 17.98 | 19.79 | 20.07 | |
| SSP3-7.0 | 16.81 | 15.52 | 21.24 | 21.33 | |
| SSP5-8.5 | 16.81 | 19.55 | 21.60 | 22.83 | |
| BIO12/mm | SSP1-2.6 | 424.00 | 507.50 | 245.25 | 145.25 |
| SSP2-4.5 | 424.00 | 285.75 | 145.25 | 129.00 | |
| SSP3-7.0 | 424.00 | 454.75 | 165.25 | 129.00 | |
| SSP5-8.5 | 424.00 | 121.75 | 132.75 | 122.25 |
Disclaimer/Publisher’s Note: The statements, opinions and data contained in all publications are solely those of the individual author(s) and contributor(s) and not of MDPI and/or the editor(s). MDPI and/or the editor(s) disclaim responsibility for any injury to people or property resulting from any ideas, methods, instructions or products referred to in the content. |
© 2024 by the authors. Licensee MDPI, Basel, Switzerland. This article is an open access article distributed under the terms and conditions of the Creative Commons Attribution (CC BY) license (https://creativecommons.org/licenses/by/4.0/).
Share and Cite
MDPI and ACS Style
Fang, J.; Shi, J.; Zhang, P.; Shao, M.; Zhou, N.; Wang, Y.; Xu, X. Potential Distribution Projections for Senegalia senegal (L.) Britton under Climate Change Scenarios. Forests 2024, 15, 379. https://doi.org/10.3390/f15020379
AMA Style
Fang J, Shi J, Zhang P, Shao M, Zhou N, Wang Y, Xu X. Potential Distribution Projections for Senegalia senegal (L.) Britton under Climate Change Scenarios. Forests. 2024; 15(2):379. https://doi.org/10.3390/f15020379
Chicago/Turabian StyleFang, Jiaqi, Jianfei Shi, Ping Zhang, Minghao Shao, Na Zhou, Yongdong Wang, and Xinwen Xu. 2024. "Potential Distribution Projections for Senegalia senegal (L.) Britton under Climate Change Scenarios" Forests 15, no. 2: 379. https://doi.org/10.3390/f15020379
Note that from the first issue of 2016, this journal uses article numbers instead of page numbers. See further details here.