Abstract
Wood deterioration due to basidiomycetous decay fungi shortens the useful life span of wood and wood-based materials. Prescriptive preservative treatment is the most effective way to reduce the detrimental effects of these microorganisms, particularly in soil contact and areas of critical use (difficult to replace or vital to structure). Current American Wood Protection Association (AWPA) guidelines in the standardized use category system specify 3 zones of severity regarding wood decay fungal hazards but contain very little information on the diversity and abundance of these fungi colonizing soil and wood. In this study, amplicon based sequencing was utilized to compare fungal communities in wood and adjacent soil to provide baseline data on the fungi involved in the process. A thorough understanding of decay hazards is critical for the proper selection and use of wood in soil contact. The goal of this work is to provide baseline data on basidiomycete fungal diversity and species composition in different zones of the existing 3-zone AWPA hazard map as compared to the previous 5-zone hazard map and Scheffer decay indices and discuss the ecological implications for wood decay.
1. Introduction
Wood is an excellent building material possessing favorable carbon attributes, excellent strength to weight ratios and is harvested from a renewable resource [1]. Being of biological origin wood is subject to attack by biodeteriogens, chiefly wood decay fungi and termites [2]. Basidiomycetous fungi make up the largest proportion of fungi that degrade wood both above ground and in ground contact and are characterized as having two different decay modes, brown and white rot. More recently, this nomenclature has been expanded to include grey rot fungi, which contain traits of both brown and white rot fungi [3], but the impacts of these fungi in the built environment have received little attention. Regardless, the combined efforts of these groups can severely shorten the useful service life of wood and wood-based materials and cost estimates associated with repair and replacement number in the billions of US Dollars [2]. Chemical wood preservatives are the principle means of wood protection in the United States and, when used in accordance with standardized methods [4] and best use practices, can significantly increase the useful service life of wood and wood-based materials [5,6,7]. A key component of prescriptive preservative recommendations for wood is a thorough understanding of decay hazards and subsequent service life prediction models [4]. This can provide consumers with an approximation of performance based on historical data and field testing and can also be used to inform material comparisons and life cycle analyses [8].
The use category system of the American Wood Protection Association (AWPA) uses fungal decay hazard to describe deterioration rates in the continental United States and Hawaii [4] and is based on utility pole surveys conducted by the Rural Electrification Association (REA) in 1956 which was then published in the REA Pole performance study [9]. The existing map has gone through several iterations, first as a 4-zone map delineating zones of low to severe decay hazard. The map was updated to expand zones of intermediate decay hazard, and most recently the map was condensed from a 5-zone classification to a 3-zone classification that describes zones as either low, moderate, or high decay hazard. A more comprehensive history of the AWPA hazard map was discussed in an AWPA proceedings paper by Kirker et al. [10]. Generally, large scale surveys of utility pole service records indicate that utility poles have differential survival/replacement rates in different AWPA hazard zones [11].
Another commonly used metric to determine decay severity is the Scheffer index, which is a value calculated based on the number of days with rainfall above a threshold value and mean temperature above a threshold value [12,13]. There are several studies that demonstrate good agreement with Scheffer indices and above ground decay hazard [14,15,16]. However, efforts to apply the Scheffer index to ground contact decay hazards have not been fully successful [17], indicating that additional factors need further study. A missing component of current efforts to characterize decay hazard is biodiversity data. Improved molecular methods for characterization of microbes in the environment now allow for detailed characterizations of fungi and bacteria in soil, wood, and other environmental substrates [18,19,20]. Amplicon based sequencing is a powerful tool for conducting these types of analyses and has been used by Forest Products Laboratory (FPL) researchers to characterize soil exposed to preservatives long-term [21] and most recently wood exposed to leaf litter [22].
The goals of this research are to provide baseline biological data on basidiomycete fungal diversity inhabiting wood in ground contact as well as adjacent soil and relate them to the current AWPA hazard map and calculated Scheffer indices obtained during the study. A more thorough understanding of the communities of fungi that impact wood in service could provide opportunities for more advanced protection options based on targeted strategies. Pine and hardwood stands were selected in this study to examine the effects of overstory on subsequent fungal diversity and resultant decay hazards. Community analyses in PC-ORD identified fungal indicator species that are associated within the different zones to investigate possible compositional differences from zones of low to high decay hazard.
2. Materials and Methods
2.1. Sampling
Fifteen untreated southern pine field stakes (45.7 cm × 2.54 cm × 2.54 cm) per overstory type (pine or hardwood) were sent to 14 National Forests and installed at the University of Wisconsin-Madison Arboretum by researchers (N = 72) spanning across the 3 AWPA hazard zones in the summer of 2016. Table 1 lists National Forests included in this study along with supplemental decay hazard information. Field stakes were placed by foresters in the ground approximately 8 inches deep in each forest type in three “W” shaped transects with 5 stakes per transect at 10 paces (approximately 10 m) between stakes. Ten soil cores (obtained using an FPL manufactured PVC soil sampling probe (15.24 cm (depth) × 3.175 cm (outer diameter)) taken at the time of stake installation were combined into one sample and 3 replicate transects were collected beneath a dominant pine and a dominant hardwood forest. Upon receipt, samples were either placed immediately in a −30 °C freezer until they could be processed or mixed and aliquoted prior to being placed in a −30 °C freezer. Soil samples were hand-mixed with additional pounding with the soil sampler to break up soil aggregates. A 2 g aliquot was taken and stored at FPL at −30 °C for DNA analysis. The remaining soil samples were shipped to the University of Wisconsin Soil and Forage lab in Marshfield, WI for nutrient and physical analysis. Stakes were exposed to natural weather conditions for approximately 1-year and collected and returned to FPL by overnight shipping. Two National Forests were unable to locate the field stakes and were excluded from the study. Field stakes were visually rated using AWPA E-7 rating criteria and documented as sound or broken (either arrived broken or were so decayed they could easily be broken by hand) and whether there was visual evidence of termite feeding, white rot, brown rot, or soft rot decay [23]. Stakes were then frozen at −20 °C until DNA extraction could be completed. Sampling details and general condition of stakes are presented in Table 1.

Table 1.
Sampling Sites included in this study and associated decay hazard information. AWPA hazard zone information is from 2019 U-1 listings and Scheffer Index is calculated from nearest National Oceanic and Atmospheric Administration (NOAA) weather station to the sampling site for the year corresponding to their exposure. (Column legend: NF = national forest, AWPA = AWPA hazard zone, Scheffer = calculated Scheffer index, North = site latitudinal coordinates, West = site longitudinal coordinates, O/S = dominant overstory as indicated by either pine (P) or hardwood (H), dominant rot type confirmed by visual observation (brown rot = BR, white rot = WR, or soft rot = SR), and termite presence (Y or N).
Frozen field stakes were drilled using a ¼ inch paddle bit in four spots at one-inch intervals from the ground line down to acquire approximately 2 g of sawdust from each stake. Equipment and surfaces were surface disinfested by drenching then wiping with 70% ethanol between stakes. Sawdust from 5 stakes per transect was pooled, considered one replicate, and immediately frozen at −20 °C until DNA extraction. Sawdust was mixed and two 0.1 g samples were added to separate tubes containing 800 µL 2% CTAB + 0.1% beta mercaptoethanol. Samples were ground using a handheld drill and plastic pestle for approximately 30 s each and incubated 2 h at 65 °C on a hotplate. DNA in solutions was separated from sawdust by centrifugation at 14,000× g for 4 min then the two samples were combined on a spin column of a Promega Wizard SV DNA extraction kit (Madison, WI, USA) and DNA was extracted following manufacturer’s instructions. Extracted DNA was cleaned following the manufacturer’s instructions using the PowerClean Pro Cleanup kit (Qiagen, Hilden, Germany) and eluted in 50 µL DC5 to concentrate samples 1×. Soil samples were processed using Powersoil DNA extraction kits (Qiagen, Hilden, Germany) following manufacturer’s instruction, and cleaned using the same protocol as sawdust samples.
2.2. Amplicon Based Sequencing
DNA obtained from wood and soil was quantified by absorbance in UV 96-well plate on a hybrid multimode reader (Synergy H1, Biotek, Winooski, VT, USA). Wood DNA was below 10 ng/µL and was used undiluted, soil DNA was diluted to 10 ng/µL in TE (Tris EDTA) before PCR reactions. PCR was conducted using Phusion taq polymerase (New England Biolabs, Ipswich, MA) following the conditions provided by Bueé et al. [24] in triplicate (25 ng per reaction for soil DNA). Primers ITS1F and ITS2 were synthesized by IDT with the addition of 72 different combinations of dual-index barcoded primers designed by the University of Wisconsin-Madison Biotechnology Center DNA Sequencing Facility (Madison, WI, USA). Gel electrophoresis was conducted with 2% agarose to visually confirm a range of 400–500 bp product sizes and no template controls. Primer dimers were removed after triplicate PCRs were combined by Select a Size DNA Clean and Concentrator kit (Zymo Research, Irvine, CA, USA) by selecting for 200 bp and lower products to be eliminated. DNA was then quantified using Quant-iT ds DNA Assay Kit (ThermoFisher Scientific, Waltham, MA, USA) and a hybrid multimode reader (Synergy H1, Biotek, Winooski, VT, USA). Samples were pooled in equimolar concentrations (10 mM) then submitted to University of Wisconsin-Madison Biotechnology Center DNA Sequencing Facility for paired end read sequencing using the Illumina MiSeq (San Diego, CA, USA) sequencing analysis.
Metagenomic data was processed using the AmpTk v3.1 pipeline [25]. For this analysis, overlapping 2 × 250 bp Illumina MiSeq reads were merged using USEARCH9 [26], forward and reverse primers were removed from the merged reads, and the reads were trimmed or padded with N’s to a set length of 250 bp. Processed reads were quality trimmed based on accumulation of expected errors less than 1.0 [26] and clustered using the UPARSE algorithm using default parameters (singletons removed, 97% OTU radius). An operational taxonomic unit (OTU) table was generated by mapping the original reads to the OTUs using VSEARCH 1.9.1 [27] and the OTU table was subsequently filtered to eliminate “index-bleed” at 0.5%. Taxonomy was assigned using a combination of UTAX and global alignment (USEARCH [28]) to the UNITE database [29] and non-fungal OTUs were removed prior to downstream data processing. OTUs were used for this study, but the authors do acknowledge the growing preference for the use of amplicon sequence variants (ASVs) as they provide greater taxonomic resolution [30,31,32], but for the purpose of this study, OTUs were the preferred output based on our sampling and downstream data analysis methods.
2.3. Downstream Data Analyses
2.3.1. Community Analysis
Fungal community analyses were performed using PC-ORD 7.09. All samples were normalized by relative abundance within each sample to account for uneven sequence distribution [26]. Nonmetric multidimensional scaling (NMDS) ordinations [33,34] were used to visually assess differences in basidiomycete community composition and prominent gradients among grouping variables including substrate (wood/soil), forest type (conifer/hardwood), and fungal decay hazard zones (AWPA Hazard Zone Maps/geographic region). NMS is widely used in community ecology for graphical representation because it preserves the distance properties among samples, is based on ranked distances, avoids assumptions of linear relationships among the variables, and is suitable for non-normal data [35,36]. The Sørensen distance measure was used to calculate distance matrices as is generally applied in molecular sampling studies with abundance data [37]. All NMS ordinations were performed in autopilot mode with the “slow and thorough” setting.
Multi-response permutation procedure (MRPP) was used to assess statistical differences between the ecological groups of interest visualized in NMS ordinations [38,39,40]. MRPP is a nonparametric technique that allows comparison of groups by distance (dissimilarity) in multiple variables at the same time. This statistical technique provides a p-value to evaluate differences, as well as an A-value to explain the chance-corrected within-group agreement (the effect size between two or more groups). A-values range from 1 (items are identical within groups) to negative values (groups are less different than expected by chance) with A = 0 indicating groups are as heterogenous as expected by chance [36].
2.3.2. Diversity Indices
Whereas ordinations are graphical depictions of species composition and do not provide a quantitative measure of fungal abundance, PC-ORD was also used to calculate values for species richness, evenness, Shannon diversity and Simpson diversity of each treatment group in addition to the NDMS ordinations. Those metrics are defined below [37]:
Species richness—the number of different species in an ecological community. It is derived from summing all non-zero elements in a column or row.
Evenness—the similarity in number of species of between ecological community. It is derived from dividing the Simpsons index (H, shown below) by the natural log (ln) of the richness value.
Shannon–Wiener diversity (H)—a calculated diversity index that accounts for relative abundance of species rather than total number of species. It assumes all species are represented in a sample and that they are randomly sampled. Shannon–Wiener is also sometimes referred to as an information statistic index. The equation is shown below as Equation (1).
H = ∑_(i = 1)^R〖p_1 lnp_i 〗
Simpson diversity—The Simpson index (D) is commonly referred to as a dominance index because it gives more weight to common or dominant species. The result is that a few rare species with low abundance will not affect the outcomes. The equation for the Simpson index is shown as Equation (2).
D = 1 − (∑〖n(n − 1)〗)/(N(N − 1))
Basidiomycete richness, evenness, and diversity (Shannon/Simpson) patterns between AWPA hazard map decay zones were analyzed using Minitab® (v.21.1.1) and treatment comparisons were performed using a one-way ANOVA. When appropriate, post hoc means comparisons were performed using Tukey’s HSD. Indicator species analysis (ISA) was used to investigate whether certain fungal taxa were statistically associated with the defined groupings of interest [41].
2.3.3. Indicator Species Analysis
Indicator species were determined using the methods of Dufrêne and Legendre [41] as detailed in McCune and Grace [36]. Briefly, sample units (OTUs) were used to calculate proportional abundance of OTUs in a particular group (treatment) to compare abundance across all other groups using the formula shown in Equation (3):
where RA = relative abundance (x) of the jth species in k groups, across all groups = g.
〖RA〗_(jk) = x_kj/(∑_(k = 1)^gx_kj)
Second, proportional frequency of species in each group were calculated on a binary transformed (presence-absence) matrix to obtain relative frequency of each species (OTU) using the formula shown in Equation (4):
where RF = relative or proportional frequency of species j in k groups.
〖RF〗_kj = (∑_(i = 1)^(n_k) b_ijk )/n_k
The results of the formulae above are then multiplied to obtain an indicator value (IVkj) and statistical significance is determined using a Monte Carlo simulation of 1000 iterations. Indicator values range from 0 to 100, zero being no indication and 100 meaning perfect indication or that the presence of a particular species is always associated with a given condition [36].
2.3.4. Additional Climate Metadata
New Scheffer indices were calculated following Scheffer [12] protocols using weather data collected from the NOAA website over the time period that stakes were exposed. Average monthly temperatures and days with greater than or equal to 0.01 inch of rain were accumulated from 1–3 weather stations near each National Forest from August 2016 through July 2017. Data were averaged over the stations and a Sheffer index value was calculated using Scheffer’s formula shown in Equation (5):
where is the mean air temperature in month i (degrees Fahrenheit) and is the number of days in month i with precipitation greater than or equal to 0.01 inches, with any negative values of or set equal to zero.
To test additional correlations not related to the existing hazard map, regional classification variables were also created to decouple forest conditions and determine spatial effects.
3. Results
3.1. Assessment of Field Stakes Prior to Extraction
Before drilling the wooden stakes for DNA extraction, they were visually rated upon receipt to the laboratory. Of the 334 reacquired stakes, only 24 failed when pressure was applied (Table 1). As stakes were mailed to us grouped by transect, they were also visually inspected for evidence of rot type (brown, white, soft) and termite damage as a group. Forty-four percent of returned groups of stakes showed signs of white rot while only 4% showed signs of brown rot and 6% showed signs of soft rot. Of the 22 groups with stake failures, 10 included evidence of termite feeding damage.
3.2. DNA Extraction
The quantities of DNA extracted from soil and wood were variable but in general more DNA was extracted from soil than wood, as expected. From the soil samples, we obtained between 28 and 322 μg/g, while from wood we extracted between 0.21 and 7 ug/g with some samples being below detection level. DNA quantities extracted from soil were higher for hardwood forest soils than pine forest soils.
3.3. Sequencing Data
A total of 8179 OTUs, which can be considered analogous to fungal species at 97% or greater similarity, were obtained. Repetitive and non-informative OTUs were also filtered from the dataset for a total of 7312 OTUs. Due to the relative importance of basidiomycete fungi to the decomposition process, only basidiomycetous fungi were used in this analysis which represented a total of 2025 basidiomycete OTUs from the total data set. Future studies will expand on this data set to include additional saprophytic fungi such as soft rots and molds.
3.4. Community Analysis
The first step in analyzing the data set was to make broad comparisons based on species composition. NMDS in PC-ORD [36] was used to generate plots that offer a visual representation of basidiomycete fungal communities based on species composition across defined AWPA hazard zones. The first comparison was basidiomycete fungi present in wood versus those in soil (Figure 1). For all ordinations, stress values are indicated in parenthesis in figure captions, these values represent a measure of the difference between distance in the reduced dimension and the complete multidimensional space [36]. There was very little overlap between these communities which was expected given that wood represents a more specialized substrate with spatially restricted access.
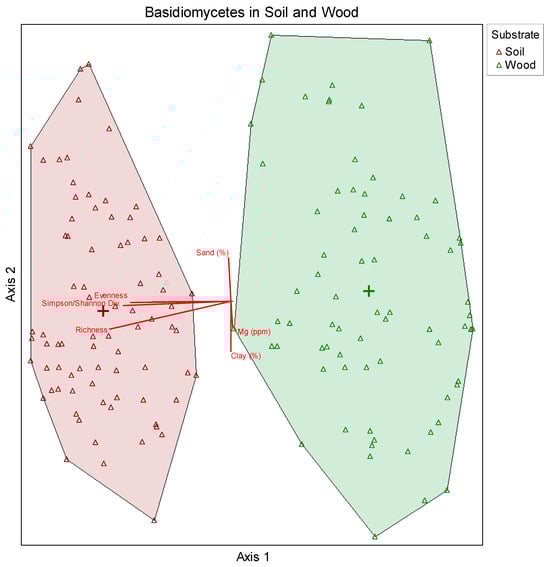
Figure 1.
Non-metric multidimensional scaling (NMDS) ordination showing relative differences between fungal community composition in wood and soil. Groups clustered separately indicating that they are dissimilar in overall species composition, driven primarily by Axis 1. Greater spacing between wood samples also indicates more variability in fungal species composition relative to soil. Axis 3 represented 0.025% of the variation (Stress value = 18.81494).
Q1: Is basidiomycete soil fungal diversity similar to the observed fungal diversity in wood?
Soil represents a pool of potential inoculum for wood in soil contact, but the question remains what fungi persist in soil versus what fungi colonize and degrade the wood? NMDS ordinations indicated that soil and wood are dissimilar in their overall basidiomycete species composition although many species exhibited overlap occurring in both wood and soil. There was a total of 2025 basidiomycete OTUs present in all substrates, with 1964 OTUs present in soil and 739 present in wood. Of these totals, 1286 OTUs were unique to soil, while 61 were unique to wood. A total of 678 OTUs co-occurred in wood and soil. Based on MRPP analyses, basidiomycete communities were found to be significantly different with respect to community assemblage in wood vs. soil (p ≤ 0.00001).
Q2: Do zones of higher fungal decay hazard contain higher basidiomycete diversity?
The results are shown in Table 2. Lower diversity was noted in the wood samples, which is not surprising given the nutritional and spatial limitations of wood. In wood, no clear trend was noted between fungal diversity measures, but a general downward trend was noted and that was more distinct in soil than wood. These results would imply that fungal species richness is not simply higher in zones of more severe decay hazard. When comparing sites, stands, hazard and Scheffer zones, mean diversity measures were higher in zones of low hazard, followed by intermediate and severe (Table 2). Correlation coefficients were calculated using Pearson’s correlation coefficient in Microsoft Excel and Ave. Scheffer, Study-year Scheffer and AWPA Zone were all negatively correlated with species diversity −0.578, −0.567, −0.60, respectively.
Table 2.
Mean diversity measures for each sampling group. NF = forest location, Stand = pine or hardwood (HW), AWPA zone refers to the current use class (U1) infographic, Scheffer is a calculated Scheffer value, followed by mean diversity measures (S) = species richness, (E) = species evenness, (H) = Shannon Weiner diversity index, and (D) = Simpson’s diversity index.
These results are complimentary to previous studies looking at competitive interactions in wood decay fungi [42], that indicate more diverse assemblages are present in more moderate, temperate climates and more severe, tropical climates consist of well adapted species that outcompete and colonize the substrate more quickly and completely. Based on these results, the basidiomycete communities in more severe climates are not necessarily more diverse, but are comprised of different species, which may be more aggressive, combative, or temporally restricted in their habits. More work needs to be performed to further investigate these concepts, but the outcomes could change how we view wood protection in sub-tropical and tropical cl1imates.
Q3: Is basidiomycete fungal diversity in soil and wood different over AWPA hazard zones?
Ordinations by AWPA hazard zones are shown below (Figure 2). Referring to the 5-zone map, the trend follows a similar pattern as noted on the site comparisons. The less severe zones (low, moderate, and intermediate) tend to group together and high and severe zones, which represent a more severe decay hazard, had a more distinct fungal species composition. There is also a clear delineation from left to right along axis 2 indicating a gradual shift in species composition from zones of high to low hazard. In comparing the 3-zone map to the 5-zone map, the 3-zone map clustered in direct accordance with the high, medium, and low designations, whereas there was uncertainty in clustering of zones of intermediate decay hazards as delineated in the 5-zone map. Based on these observations, the 3-zone map seems better suited to describe regional decay hazards, except for areas with specific microclimatic variation [43,44,45].
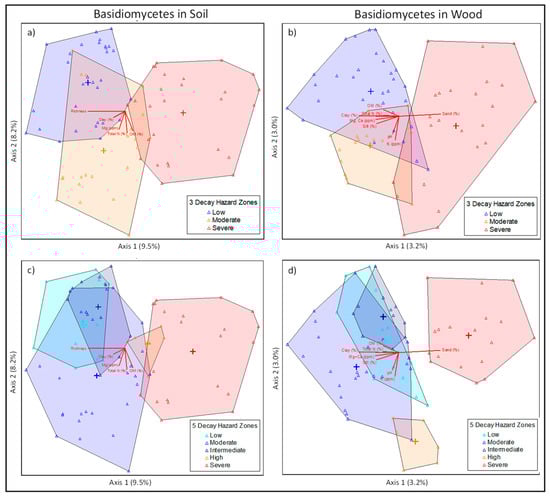
Figure 2.
Comparing NMDS Ordinations between the 3 (a,b) and 5 (c,d)-zone AWPA hazard maps for both soil (left column) and wood samples (right column), species clustering was better suited to the 3-zone map and did not properly resolve zones of intermediate decay hazard (Stress value = 16.81637).
Q4: Does forest overstory impact basidiomycete fungal diversity colonizing wood?
Ordinations of wood fungal community by site are shown below (Figure 3). More temperate sites clustered more closely indicating that they are more similar regarding fungal species composition and more subtropical sites (Ocala, Desoto, and San Juan) clustered more to the right of the ordination which indicates that the species composition is unique from the other sites. This observation is likely also influenced by soil characteristics and will be the subject of a more comprehensive study into this area to be published in the future. Overstory, listed as stand in the figure legend had a lesser influence on species composition than site, with locations clustering more closely than overstory types.
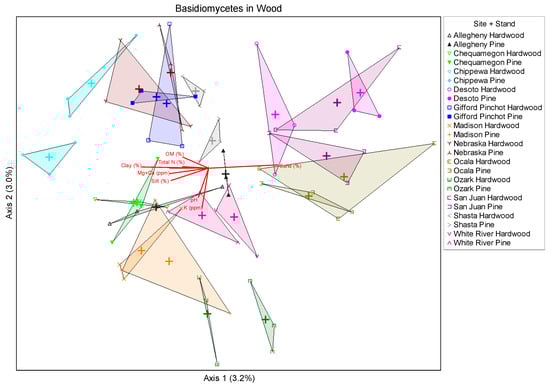
Figure 3.
Non-metric multidimensional scaling of basidiomycete fungi detected in wood for all site-stand combinations. Results show generalized clustering of more tropical sites, and little effect due to stand type. Vectors indicate relative importance of various soil factors on clustering (Stress value = 21.25197).
4. Discussion
4.1. Soil and Wood Have Distinctly Different Basidiomycete Communities
More variation in basidiomycete species composition in wood was noted compared to soil, likely because wood presents a more ephemeral environment as opposed to soil which is buffered by more readily available moisture and nutrient inputs [46]. The structural and nutritional complexity of wood presents a much more difficult habitat that only certain fungi are adapted to colonize and persist in [47]. Interspecific fungal interactions can also limit the suitability of the substrate for colonization [48]. The role of latent fungi in wood has also been the focus of recent works in the area of coarse woody debris breakdown. Several studies have theorized [49,50] that woody biomass is to some extent “pre-wired” for deterioration based on the assemblages of tree-associated saprophytes that persist in the standing tree that are not eliminated during primary processing [51]. This has received limited attention in lumber but was discussed in recent work by Cappellazzi et al. [52], who found that latent fungal opportunists persisted even in creosote treated utility poles that were not subjected to pre-sterilization methods. These studies could potentially explain the observed dissimilarity of the soil and wood assemblages, particularly the 61 basidiomycete OTUs that were specific to wood.
4.2. Greater Decay Hazard Zone Designation Does Not Equate to Greater Fungal Basidiomycete Diversity Based on Our Sampling
Based on the results of our sampling, basidiomycete richness does not increase with increasing decay hazard in both soil and wood. Statistical differences were noted between zones with respect to all diversity measures, but only richness showed the clearest downward trend. Species richness decreases as hazard zone increases, meaning that there are more basidiomycete species present in wood samples from moderate and low decay hazard zones. Basidiomycete richness plotted over the 3 AWPA zones is shown in Figure 4.
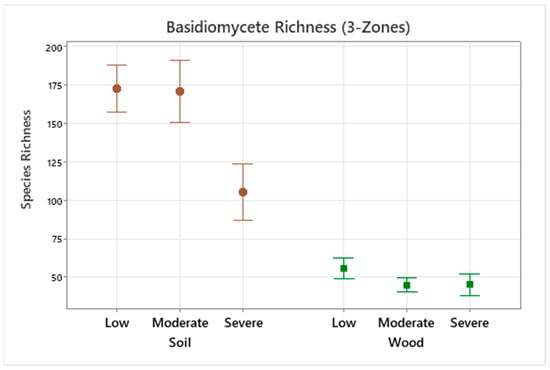
Figure 4.
Mean basidiomycete species richness for both soil (brown circle) and wood (green square) plotted over the 3 AWPA hazard zones. Significant differences were noted between low, moderate, and severe decay hazard zones with zones of severe decay hazard having significantly lower species richness (p = 0.003) in soil.
In macro-ecology, there is an extensive framework that attempts to explain and untangle species richness across latitudinal gradients. However, at the micro scale, many of these assumptions do not effectively translate and in some cases are the exact opposite, particularly for fungi [53,54]. Pianka [55] reviewed six foundational theories of latitudinal gradients: time theory, predation, spatial heterogeneity, competition, climatic stability, and the productivity hypotheses. While it is outside the scope of this study to compare and contrast each of these, there are useful comparisons to be made based on these concepts. Of these six theories, three (competition, predation, and climatic stability) support the notion that tropical environments have more restricted habitat requirements, which could influence perceived biodiversity in each region. While this study and the data collected herein do not attempt to quantify or polarize any of these effects, it is worth noting that these are influences that can, in part, affect community structure and function. Temporal and spatial heterogeneity of habitats are also important concepts to understand as they relate to species diversity. Habitats that are subjected to more temperate climates often exhibit higher diversity due to lower selection pressure on inhabitants, which may partly explain why temperate sites exhibited higher diversity in our sampling. The results of this study indicated that greater decay hazard does not correlate with higher fungal diversity in either soil or wood. These results were reported in several recent fungal biodiversity surveys conducted at both local [56] and worldwide scales [57,58,59].
4.3. A 3-Zone Hazard Map Adequately Explains Fungal Decay Hazard with Respect to Basidiomycete Community Composition in the Continental US
The AWPA decay hazard map serves as an infographic to depict regional differences in wood decay potential in the conterminous United States [4]. The map was originally proposed in 1973 and included as a 4 then 5-zone map based on the discussions of the respective committee. A 3-zone map was substituted in 2020 based on the recommendations of several utilities founded on their long term replacement data and preliminary data from this study. In our study, the 3-zone decay hazard map differentiates basidiomycete communities better than the 5-zone map, particularly in wood. As these are the first amplicon data to examine basidiomycete communities from wood and soil throughout the AWPA hazard map range, it appears the revision of the 5-zone map to 3 zones accurately reflects decay fungal communities and changes in the observed natural decay hazards across the United States. Areas subject to microclimatic variation (irrigation ditches, low-lying terrain, places with high moisture and/or improper drainage) would present an exception to these recommendations and decay severity may vary based on these parameters, an idea substantiated by several other studies [44,45,60]. Another factor that relates to microclimatic effects is overstory composition, which has been shown to be an important driver of fungal diversity and wood decomposition but has been more extensively studied in leaf litter decomposition than solid wood decomposition [61,62]. Home field advantage is a popular theory often used to describe these relationships, but in our study, results were largely inconclusive. Pine stakes were installed in both oak and pine habitats, but clear differences in decay outcomes were not observed.
4.4. Effects of Forest Overstory Were Inconclusive, but Still Found to Be Less than Site Effects
In comparing pine and hardwood stands, the decay outcomes were inconclusive. In forest decomposition and litter turnover literature, home field advantage is frequently used to help explain higher turnover rates in leaf litter [63], but these do not completely explain decomposition rates in coarse woody debris (CWD), as evidenced by Purahong et al. [63,64,65]. This concept has not been directly applied to processed lumber to the authors knowledge, but the persistence of decay inoculum present on forest residues is widely recognized and the extent to which these interact with wood in exterior exposure would suggest potential causality. In our study, higher decay rates were not always observed in pine overstories and in many cases, the pine field stakes failed at a higher rate in hardwood stands. In comparing soil and wood fungal communities, more similarity was not noted between hardwood and pine stands and instead location (site) had much more pronounced effects on species composition. More detailed studies looking at decay responses of multiple wood species subjected to home field conditions are needed to determine if processed lumber is subject to similar outcomes as has been noted for leaf litter and forest decomposition.
4.5. Indicator Species Analysis (ISA)
To compare differences due to substrate (soil vs. wood), indicator species were determined for both wood and soil. Nine fungal taxa were found to be significantly associated with wooden substrates (p = 0.0002). The proceeding information presented on trophic mode, growth form and other traits was obtained using Funguild results unless referenced otherwise. Data for these analyses are presented in Supplemental Table S1. These included a fairly diverse array of basidiomycetous fungi: a thermotolerant and xerophilic species (Geminibasidium spp. (IV = 95.6)), 2 parasites of other basidiomycetes (Saitomyza podzolica (IV = 86.5) and Soliccocomyza terricola (IV = 64.7)), 2 corticioid taxa (Tylospora spp. (IV = 52.6) and Piloderma byssinum (IV = 52.6)), 2 agaricoid taxa (Innocybe lanatodisca (IV = 66.7) and Hygrocybe conica (IV = 64.3)) and 2 additional taxa only identified to the order level (Leucosporidiales (IV = 75.3) and Polyporales (IV = 64.1)). Eleven taxa were found to be significantly associated with soil (p = 0.0002). Of these, 2 were classified as white rot fungi (Hyphochnicium subrigescens (IV = 95.8) and Resinicium bicolor (IV = 75)), 2 were classified as brown rot fungi (Coniophora fusispora (IV = 72.2) and Coniophora arida (IV = 61.1)), while the remainder were not grouped according to traits, but included Physisporinus spp. (IV = 95.7), Armillaria sp. (IV = 85.6), Clitocylbula lacerata (IV = 81.9), Scopuloides hydnoides (IV = 77.6), Sistroterma brinkmannii (IV = 62.5), Hypholoma fasiculare (IV = 58.8) and an unknown Mycena sp. (IV = 54.2).
Given that the overall objective of this study is to understand those fungi that inhabit and degrade wood, soil fungi were included in the indicator species comparisons between the 3 and 5-zone hazard maps and instead focused only on those fungi detected in wood. The overall distribution was more even-looking in the 3-zone compared to the 5-zone map; the 5-zone map contained many indicator taxa in the moderate, intermediate, and severe hazard zones, but few in the low and high hazard groups. The resultant table from the ISA for the 5-zone map for wood basidiomycetes is presented as Supplemental Table S1. Fifteen taxa were found to be significantly associated with severe hazard zones, and several of these taxa overlap both the 3- and 5-zone classification, again see Supplemental Table S1 for full listing and statistical data. Focusing on the 3-zone decay hazard map, wood basidiomycetes were grouped into low, moderate, and severe decay hazard zones. In low hazard zones, 2 brown rot species showed a high degree of association Coniophora fusispora (p = 0.0002, IV = 86.2) and Coniophora arida (p = 0.0068, IV = 72.8) along with slightly lower degrees of association for Phallus hadriani (p = 0.0032, IV = 69.9) and Hymenochaete acerosa (p = 0.0034, IV = 60). In zones of moderate decay hazard, 3 white rot fungi were found to be highly associated: Hypochnicium subrigescens (p = 0.0004, IV = 97.9), Scytinostroma sp. (p = 0.0004, IV = 72.3) and Steccherinum fimbriatum (p = 0.0002, IV = 70.8), while the remaining taxa were mostly ectomycorrhizal: Physisporinus sp. (p = 0.0004, IV = 98.6), Mycena sp. (p = 0.0004, IV = 61.8) and Tomentella stuposa (p = 0.00002, IV = 54.4). Two additional taxa were found to be highly associated but were only classified to the family level (See Supplemental Table S1 for full details). In zones of severe decay hazard, the brown rot Fibroporia radiculosa was found to be highly associated (p = 0.0002, IV = 87.2), as was the white rot fungus Peniophorella praetermissa (p = 0.0006, IV = 87.2). The remaining taxa were ectomycorrhizal species: Arrhenia rustica (p = 0.0006, IV = 88.8), Gerronema strombodes (p = 0.001, IV = 66.7), and Tricholoma caligatum (p = 0.0006, IV = 72.1).
5. Conclusions
The results obtained from this work yielded several interesting conclusions. First, soil and wood were found to have distinct assemblages of fungi compared to each other. Soil exhibited higher species richness which is not surprising given the spatial and temporal limitations of wood. Second, the data indicate that greater hazard does not equate to higher basidiomycete species diversity. Third, the comparisons generated in this study suggest the updates made to the AWPA hazard map do more closely agree with the species composition found across the sampling area, but a more comprehensive sampling would be required to substantiate this result. Overstory effects were inconclusive, and future efforts will attempt to better address this phenomenon in the context of wood protection. Finally, preliminary indicator species lists were generated for broad categories, but future work will focus on more detailed analyses of indicator species using finer detail (soil parameters, national forest, stand type). The results reported in this study provide a framework for future and more in-depth study.
The community analysis presented in this report only contains the basidiomycetous fungi extracted from a dataset of all fungi and do not fully characterize the entire decay community or co-associated non-decay fungi. The decision to narrow our observations were solely based on the premise that brown and white rot fungi are the predominant drivers of soil contact decay in wood [2]. Future analyses will seek to broaden the exploration of fungal communities to all fungal phyla and further explore the differences between AWPA decay hazard zones, as well as deeper taxonomic associations.
The observations and patterns discussed in this paper are based at the 97% OTU or “species” level and future analysis of higher taxonomic levels (Family/Genus) that appear to separate between substrate and decay hazard zones may provide insight into ecological function that could be paired with guild-level information.
While lists of indicator species for site, stand, and decay hazard zones are presented within this paper, more effort needs to be directed towards understanding the ecological implications of the presence or absence of certain species within a given condition. More comprehensive analyses on the impacts of soil characteristics on resultant decay hazards will be completed in a future paper.
Supplementary Materials
The following supporting information can be downloaded at: https://www.mdpi.com/article/10.3390/f15020383/s1, Supplementary Table S1 [58,66,67,68,69,70,71,72,73,74,75,76].
Author Contributions
Conceptualization, G.T.K. and A.B.B.; methodology, G.T.K., A.B.B. and W.J.H.; software, J.A.P. and N.J.B.; validation, G.T.K., A.B.B., S.V.G. and J.C.; formal analysis, G.T.K. and J.C.; investigation, G.T.K., A.B.B., S.V.G. and J.C.; resources, S.V.G.; data curation, G.T.K.; writing—original draft preparation, G.T.K., A.B.B., J.C. and S.V.G.; writing—review and editing, A.B.B., J.C., J.A.P. and S.V.G., visualization, J.C.; supervision, G.T.K.; project administration, G.T.K. and W.J.H.; funding acquisition, G.T.K. and W.J.H. All authors have read and agreed to the published version of the manuscript.
Funding
This research was funded by USDA-FS Green Building Coalition, grant number 16-JV-11111136-076.
Data Availability Statement
All resultant amplicon based sequence data has been archived on the NCBI sequencing archive under PRJNA1072037.
Acknowledgments
The authors wish to thank the USFS Staff located at the national forest sites who aided in the deployment and collection of field stakes analyzed in this study (Phillip Nyland—White River NF, John Lee—Nebraska NF, Jim Gries—Chippewa NF, Joshua Hanson—Allegheny NF, Anna Courtney—Shasta NF, Brad Harrick—UW Arboretum, Madison, WI, Brad Kriekhaus—Gifford Pinchot NF, Jonathan Kazmierski—Daniel Boone NF, Greg Vickers—Ozark NF, Michael Esters—Bienville NF, Jorge Guevara—Ocala NF, and Grizelle Gonzalez—El Yunque NF). Also, special thanks to Bruce Smith and Joseph Destree (FPL metal shops) for the fabrication of the soil sampling probes used in this study.
Conflicts of Interest
The authors declare no conflicts of interest.
References
- Jakes, J.E.; Arzola, X.; Bergman, R.; Ciesielski, P.; Hunt, C.G.; Rahbar, N.; Tshabalala, M.; Wiedenhoeft, A.C.; Zelinka, S.L. Not Just Lumber—Using Wood in the Sustainable Future of Materials, Chemicals, and Fuels. JOM 2016, 68, 2395–2404. [Google Scholar] [CrossRef]
- Zabel, R.A.; Morrell, J.J. Wood Microbiology: Decay and Its Prevention; Academic Press: Cambridge, MA, USA, 2012. [Google Scholar]
- Riley, R.; Salamov, A.A.; Brown, D.W.; Nagy, L.G.; Floudas, D.; Held, B.W.; Levasseur, A.; Lombard, V.; Morin, E.; Otillar, R. Extensive sampling of basidiomycete genomes demonstrates inadequacy of the white-rot/brown-rot paradigm for wood decay fungi. Proc. Natl. Acad. Sci. USA 2014, 111, 9923–9928. [Google Scholar] [CrossRef]
- American Wood Protection Association. Use Category System: User Specification for Treated Wood; Book of Standards; American Wood Protection Association: Birmingham, AL, USA, 2019. [Google Scholar]
- Woodward, B.; Kirker, G.; Lebow, P.; Lebow, S. Long-term durability of pressure-treated wood in a severe test site. Adv. Civ. Eng. Mater. 2013, 2, 178–188. [Google Scholar]
- Lebow, S.; Woodward, B.; Lebow, P. Documenting the Durability and Service Life of Pressure-treated Wood. In Proceedings of the 108th Annual Meeting of the American Wood Protection Association, Nashville, TN, USA, 29 April–2 May 2012; Volume 108, pp. 166–170. [Google Scholar]
- Woodward, B.M.; Hatfield, C.A.; Lebow, S.T. Comparison of Wood Preservatives in Stake Tests: 2011 Progress Report; Research Note FPL-RN-02; US Dept. of Agriculture, Forest Service, Forest Products Laboratory: Madison, WI, USA, 2011; 120p.
- Kutnik, M.; Suttie, E.; Brischke, C. 10—Durability, efficacy and performance of bio-based construction materials: Standardisation background and systems of evaluation and authorisation for the European market. In Performance of Bio-Based Building Materials; Woodhead Publishing: Sawston, UK, 2017; pp. 593–610. [Google Scholar]
- Association, R.E. Pole Inspection and Maintenance; 1973; pp. 161–164. [Google Scholar]
- Kirker, G.T.; Bishell, A.B.; Hickey, W.J. AWPA biodeterioration hazard map revisited. In Proceedings of the One Hundred Thirteenth Annual Meeting of the American Wood Protection Association, Las Vegas, NV, USA, 9–11 April 2017; McCowan, C., Gothard, T., Staula, B., Eds.; American Wood Protection Association: Birmingham, AL, USA, 2017; pp. 90–96. [Google Scholar]
- Pope, T. Wood pole survivor rates by decay hazard zone initial inspection vs. recycle inspection. Proc. Am. Wood Prot. Assoc. 2004, 100, 255–262. [Google Scholar]
- Scheffer, T.C. A climate index for estimating potential for decay in wood structures above ground. For. Prod. J. 1971, 21, 25–31. [Google Scholar]
- Carll, C.G. Decay Hazard (Scheffer) Index Values Calculated from 1971–2000 Climate Normal Data; General Technical Report FPL-GTR-179; US Department of Agriculture, Forest Service, Forest Products Laboratory: Madison, WI, USA, 2009; p. 179.
- Morris, P.I.; Laks, P.; Larkin, G.; Ingram, J.K.; Stirling, R. Above-Ground Decay Resistance of Selected Canadian Softwoods at Four Test Sites after Ten Years of Exposure. For. Prod. J. 2016, 66, 268–273. [Google Scholar]
- Carll, C.G.; Highley, T.L. Decay of wood and wood-based products above ground in buildings. J. Test. Eval. 1999, 27, 150–158. [Google Scholar]
- Larkin, G.; Laks, P. To Decay or Not to Decay: An Accelerated Field Test of the Validity of the Scheffer Index; Document IRG/WP; International Research Group on Wood Protection: Stockholm, Sweden, 2008; p. 08-20392. [Google Scholar]
- Lebow, S.T.; Highley, T. Regional Biodeterioration Hazards in the United States; ACS Publications: Washington, DC, USA, 2008. [Google Scholar]
- Daniel, R. The metagenomics of soil. Nat. Rev. Microbiol. 2005, 3, 470–478. [Google Scholar] [CrossRef] [PubMed]
- Xu, J. Invited review: Microbial ecology in the age of genomics and metagenomics: Concepts, tools, and recent advances. Mol. Ecol. 2006, 15, 1713–1731. [Google Scholar] [CrossRef] [PubMed]
- Purahong, W.; Wubet, T.; Lentendu, G.; Schloter, M.; Pecyna, M.J.; Kapturska, D.; Hofrichter, M.; Kruger, D.; Buscot, F. Life in leaf litter: Novel insights into community dynamics of bacteria and fungi during litter decomposition. Mol. Ecol. 2016, 25, 4059–4074. [Google Scholar] [CrossRef]
- Kirker, G.T.; Bishell, A.B.; Jusino, M.A.; Palmer, J.M.; Hickey, W.J.; Lindner, D.L. Amplicon-based sequencing of soil fungi from wood preservative test sites. Front. Microbiol. 2017, 8, 1997. [Google Scholar] [CrossRef]
- Kirker, G.T.; Bishell, A.; Cappellazzi, J.; Palmer, J.; Bechle, N.; Lebow, P.; Lebow, S. Role of Leaf Litter in Above-Ground Wood Decay. Microorganisms 2020, 8, 696. [Google Scholar] [CrossRef]
- American Wood Protection Association. Standard Field Test for Evaluation of Wood Preservatives to be Used in Ground Contact (UC4A, UC4B, UC4C); stake test. E7-13. 2013 AWPA Book of Standards; American Wood Protection Association: Birmingham, AL, USA, 2013; pp. 431–439. [Google Scholar]
- Buee, M.; Reich, M.; Murat, C.; Morin, E.; Nilsson, R.H.; Uroz, S.; Martin, F. 454 Pyrosequencing analyses of forest soils reveal an unexpectedly high fungal diversity. New Phytol. 2009, 184, 449–456. [Google Scholar] [CrossRef]
- Palmer, J.M.; Jusino, M.A.; Banik, M.T.; Lindner, D.L. Non-biological synthetic spike-in controls and the AMPtk software pipeline improve mycobiome data. Peerj 2018, 6, e4925. [Google Scholar] [CrossRef]
- Edgar, R.C.; Flyvbjerg, H. Error filtering, pair assembly and error correction for next-generation sequencing reads. Bioinformatics 2015, 31, 3476–3482. [Google Scholar] [CrossRef]
- Schloss, P.D. Application of a database-independent approach to assess the quality of operational taxonomic unit picking methods. Msystems 2016, 1, e00027-16. [Google Scholar] [CrossRef]
- Edgar, R.C. Search and clustering orders of magnitude faster than BLAST. Bioinformatics 2010, 26, 2460–2461. [Google Scholar] [CrossRef] [PubMed]
- Abarenkov, K.; Henrik Nilsson, R.; Larsson, K.H.; Alexander, I.J.; Eberhardt, U.; Erland, S.; Høiland, K.; Kjøller, R.; Larsson, E.; Pennanen, T. The UNITE database for molecular identification of fungi–recent updates and future perspectives. New Phytol. 2010, 186, 281–285. [Google Scholar] [CrossRef] [PubMed]
- Krunic, M.; Venhuizen, P.; Mullauer, L.; Kaserer, B.; von Haeseler, A. VARIFI-Web-Based Automatic Variant Identification, Filtering and Annotation of Amplicon Sequencing Data. J. Pers. Med. 2019, 9, 10. [Google Scholar] [CrossRef] [PubMed]
- Forster, D.; Lentendu, G.; Filker, S.; Dubois, E.; Wilding, T.A.; Stoeck, T. Improving eDNA-based protist diversity assessments using networks of amplicon sequence variants. Environ. Microbiol. 2019, 21, 4109–4124. [Google Scholar] [CrossRef] [PubMed]
- Tipton, L.; Zahn, G.L.; Darcy, J.L.; Amend, A.S.; Hynson, N.A. Hawaiian fungal amplicon sequence variants reveal otherwise hidden biogeography. Microb. Ecol. 2021, 1–10. [Google Scholar] [CrossRef] [PubMed]
- Kruskal, J.B. Multidimensional scaling by optimizing goodness of fit to a nonmetric hypothesis. Psychometrika 1964, 29, 1–27. [Google Scholar] [CrossRef]
- Mather, P.M. Computational Methods of Multivariate Analysis in Physical Geography; John Wiley & Sons: Hoboken, NJ, USA, 1976. [Google Scholar]
- Clarke, K.R. Non-parametric multivariate analyses of changes in community structure. Aust. J. Ecol. 1993, 18, 117–143. [Google Scholar] [CrossRef]
- McCune, B.; Grace, J.B.; Urban, D.L. Analysis of Ecological Communities; MjM Software Design: Gleneden Beach, OR, USA, 2002; Volume 28. [Google Scholar]
- McCune, B.; Mefford, M. Multivariate Analysis of Ecological Data, Version 3.0; MjM Software: Gleneden Beach, OR, USA, 1997.
- Mielke, P.W., Jr.; Berry, K.J.; Johnson, E.S. Multi-response permutation procedures for a priori classifications. Commun. Stat. Theory Methods 1976, 5, 1409–1424. [Google Scholar] [CrossRef]
- Neyman, J.; Pearson, E.S. The testing of statistical hypotheses in relation to probabilities a priori. In Proceedings of the Mathematical Proceedings of the Cambridge Philosophical Society, Cambridge, UK, 30 October 1933; pp. 492–510. [Google Scholar]
- Parchami, A.; Mashinchi, M.; Partovi Nia, V. A consistent confidence interval for fuzzy capability index. Appl. Comput. Math. 2008, 7, 119–125. [Google Scholar]
- Dufrêne, M.; Legendre, P. Species assemblages and indicator species: The need for a flexible asymmetrical approach. Ecol. Monogr. 1997, 67, 345–366. [Google Scholar] [CrossRef]
- Boddy, L. Interspecific combative interactions between wood-decaying basidiomycetes. FEMS Microbiol. Ecol. 2000, 31, 185–194. [Google Scholar] [CrossRef]
- Brischke, C.; Rapp, A.O. Influence of wood moisture content and wood temperature on fungal decay in the field: Observations in different micro-climates. Wood Sci. Technol. 2008, 42, 663–677. [Google Scholar] [CrossRef]
- Pouska, V.; Macek, P.; Zíbarová, L. The relation of fungal communities to wood microclimate in a mountain spruce forest. Fungal Ecol. 2016, 21, 1–9. [Google Scholar] [CrossRef]
- Boddy, L. Microclimate and moisture dynamics of wood decomposing in terrestrial ecosystems. Soil Biol. Biochem. 1983, 15, 149–157. [Google Scholar] [CrossRef]
- Rayner, A.; Boddy, L. Fungal communities in the decay of wood. In Advances in Microbial Ecology; Springer: Berlin/Heidelberg, Germany, 1988; pp. 115–166. [Google Scholar]
- Frankland, J.C. Mechanisms in fungal succession. Fungal Community Its Organ. Role Ecosyst. 1992, 2, 383–401. [Google Scholar]
- Hiscox, J.; Clarkson, G.; Savoury, M.; Powell, G.; Savva, I.; Lloyd, M.; Shipcott, J.; Choimes, A.; Cumbriu, X.A.; Boddy, L. Effects of pre-colonisation and temperature on interspecific fungal interactions in wood. Fungal Ecol. 2016, 21, 32–42. [Google Scholar] [CrossRef]
- Boddy, L. Latent decay fungi: The hidden foe? Arboric. J. 1994, 18, 113–135. [Google Scholar] [CrossRef]
- Fukasawa, Y.; Matsukura, K. Decay stages of wood and associated fungal communities characterise diversity–decomposition relationships. Sci. Rep. 2021, 11, 8972. [Google Scholar] [CrossRef] [PubMed]
- Parfitt, D.; Hunt, J.; Dockrell, D.; Rogers, H.J.; Boddy, L. Do all trees carry the seeds of their own destruction? PCR reveals numerous wood decay fungi latently present in sapwood of a wide range of angiosperm trees. Fungal Ecol. 2010, 3, 338–346. [Google Scholar] [CrossRef]
- Cappellazzi, J.; Maguire, K.; Nelson, R.; Morrell, J.J. Incidence of decay in creosote-treated Scots pine poles in Ireland. Holzforschung 2018, 72, 1079–1086. [Google Scholar] [CrossRef]
- Větrovský, T.; Kohout, P.; Kopecký, M.; Machac, A.; Man, M.; Bahnmann, B.D.; Brabcová, V.; Choi, J.; Meszárošová, L.; Human, Z.R. A meta-analysis of global fungal distribution reveals climate-driven patterns. Nat. Commun. 2019, 10, 5142. [Google Scholar] [CrossRef]
- Unterseher, M.; Schnittler, M.; Dormann, C.; Sickert, A. Application of species richness estimators for the assessment of fungal diversity. FEMS Microbiol. Lett. 2008, 282, 205–213. [Google Scholar] [CrossRef]
- Pianka, E.R. Latitudinal gradients in species diversity: A review of concepts. Am. Nat. 1966, 100, 33–46. [Google Scholar] [CrossRef]
- Unterseher, M.; Tal, O. Influence of small scale conditions on the diversity of wood decay fungi in a temperate, mixed deciduous forest canopy. Mycol. Res. 2006, 110, 169–178. [Google Scholar] [CrossRef]
- Unterseher, M.; Jumpponen, A.; Opik, M.; Tedersoo, L.; Moora, M.; Dormann, C.F.; Schnittler, M. Species abundance distributions and richness estimations in fungal metagenomics—Lessons learned from community ecology. Mol. Ecol. 2011, 20, 275–285. [Google Scholar] [CrossRef] [PubMed]
- Tedersoo, L.; Bahram, M.; Põlme, S.; Kõljalg, U.; Yorou, N.S.; Wijesundera, R.; Ruiz, L.V.; Vasco-Palacios, A.M.; Thu, P.Q.; Suija, A. Global diversity and geography of soil fungi. Science 2014, 346, 1256688. [Google Scholar] [CrossRef]
- Tedersoo, L.; Nara, K. General latitudinal gradient of biodiversity is reversed in ectomycorrhizal fungi. New Phytol. 2010, 185, 351–354. [Google Scholar] [CrossRef]
- Pouska, V.; Macek, P.; Zíbarová, L.; Ostrow, H. How does the richness of wood-decaying fungi relate to wood microclimate? Fungal Ecol. 2017, 27, 178–181. [Google Scholar] [CrossRef]
- Veen, G.; Snoek, B.L.; Bakx-Schotman, T.; Wardle, D.A.; van der Putten, W.H. Relationships between fungal community composition in decomposing leaf litter and home-field advantage effects. Funct. Ecol. 2019, 33, 1524–1535. [Google Scholar] [CrossRef]
- Palozzi, J.E.; Lindo, Z. Are leaf litter and microbes team players? Interpreting home-field advantage decomposition dynamics. Soil Biol. Biochem. 2018, 124, 189–198. [Google Scholar] [CrossRef]
- Purahong, W.; Pietsch, K.A.; Bruelheide, H.; Wirth, C.; Buscot, F.; Wubet, T. Potential links between wood-inhabiting and soil fungal communities: Evidence from high-throughput sequencing. MicrobiologyOpen 2019, 8, e00856. [Google Scholar] [CrossRef] [PubMed]
- Purahong, W.; Kahl, T.; Krüger, D.; Buscot, F.; Hoppe, B. Home-field advantage in wood decomposition is mainly mediated by fungal community shifts at “home” versus “away”. Microb. Ecol. 2019, 78, 725–736. [Google Scholar] [CrossRef]
- Purahong, W.; Arnstadt, T.; Kahl, T.; Bauhus, J.; Kellner, H.; Hofrichter, M.; Krüger, D.; Buscot, F.; Hoppe, B. Are correlations between deadwood fungal community structure, wood physico-chemical properties and lignin-modifying enzymes stable across different geographical regions? Fungal Ecol. 2016, 22, 98–105. [Google Scholar] [CrossRef]
- Cannon, P.F.; Kirk, P.M. (Eds.) Fungal Families of the World; Cabi: Oxon, UK, 2007. [Google Scholar]
- Lawrey, J.D.; Diederich, P. Lichenicolous Fungi–Worldwide Checklist, Including Isolated Cultures and Sequences. 2016. Available online: http://www.lichenicolous.net (accessed on 9 May 2017).
- Kirk, P.M.; Cannon, P.F.; Minter, D.W.; Stalpers, J.A. Ainsworth & Bisby’s Dictionary of the Fungi; CAB International: Wallingford, UK, 2008. [Google Scholar]
- Rinaldi, A.C.; Comandini, O.; Kuyper, T.W. Ectomycorrhizal fungal diversity: Seperating the wheat from the chaff. Fungal Divers. 2008, 33, 1–45. [Google Scholar]
- Kurtzman, C.; Fell, J.W.; Boekhout, T. (Eds.) The Yeasts: A Taxonomic Study; Elsevier: Amsterdam, The Netherlands, 2011. [Google Scholar]
- Tedersoo, L.; May, T.W.; Smith, M.E. Ectomycorrhizal lifestyle in fungi: Global diversity, distribution, and evolution of phylogenetic lineages. Mycorrhiza 2010, 20, 217–263. [Google Scholar] [CrossRef] [PubMed]
- Andrews, J.H.; Berbee, F.M.; Nordheim, E.V. Microbial antagonism to the imperfect stage of the apple scab pathogen, Venturia inaequalis. Phytopathology 1983, 73, 228–234. [Google Scholar] [CrossRef]
- Jones, E.B.; Slooff, W.C. Candida aquatica sp. n. isolated from water scums. Antonie Van Leeuwenhoek 1966, 32, 223–228. [Google Scholar] [CrossRef] [PubMed]
- Gilbertson, R.L.; Ryvarden, L. North American Polypores; Fungiflora: Oslo, Norway, 1987; ISBN 978-0945345060. [Google Scholar]
- List Compiled by John Plischke III. Available online: http://home.comcast.net/~grifola/fungionfungi.pdf (accessed on 8 February 2024).
- Xin, M.-X.; Zhou, P.-J. Mrakia psychrophila sp. nov., a new species isolated from Antarctic soil. J. Zhejiang Univ. Sci. B 2007, 8, 260–265. [Google Scholar] [CrossRef]
Disclaimer/Publisher’s Note: The statements, opinions and data contained in all publications are solely those of the individual author(s) and contributor(s) and not of MDPI and/or the editor(s). MDPI and/or the editor(s) disclaim responsibility for any injury to people or property resulting from any ideas, methods, instructions or products referred to in the content. |
© 2024 by the authors. Licensee MDPI, Basel, Switzerland. This article is an open access article distributed under the terms and conditions of the Creative Commons Attribution (CC BY) license (https://creativecommons.org/licenses/by/4.0/).