Abstract
The significance of mangroves and the associated risks they face have prompted government and the private sector to invest in projects aimed at conserving and restoring mangroves. Despite this interest, there is currently little information available on the effectiveness of these investments in mangrove conservation and restoration efforts. Therefore, this study aimed to use Sentinel-2 imagery with 10-m resolution through the Google Earth Engine to evaluate the effectiveness of these projects in mangrove areas in two regions: the Tahiry Honko project in Madagascar and the Abu Dhabi Blue Carbon Demonstration Project in the United Arab Emirates. The study compared the U-Net and SVM for mangrove classification. The U-Net model demonstrated superior performance, achieving an accuracy of 90%, with a Kappa coefficient value of 0.84. In contrast, the SVM had an overall accuracy of 86% and Kappa coefficient of 0.78. The analysis of changes in the mangrove area using U-Net model revealed a decline of 355 ha over four years in the Tahiry Honko project, while in the Abu Dhabi Project, the mangrove area increased by 5857 ha over 5 years. These findings can provide valuable information for policy-makers and management strategies.
1. Introduction
Mangroves are forest ecosystems located in inter-tidal regions that reduce coastal erosion [1], provide breeding and feeding grounds [2], improve water quality [3], and support the well-being of local communities [4]. Mangroves capture and store carbon in biomass and soils with potential applications in limiting climate change [5]. In recent decades, 35–65% of global mangrove ecosystems have been destroyed due to anthropogenic activities and climate change [6], releasing over 300 Tg of carbon dioxide equivalent (CO2e) between 2000 and 2012 [7]. For these reasons, it is vital to conserve and restore mangrove areas to maintain and enhance mangrove carbon stocks—referred to as ‘blue carbon’– and to better account for CO2 sources and sinks [6].
A growing number of blue carbon projects have been initiated internationally for the conservation of pristine mangroves and for the restoration and reforestation of degraded mangrove areas [8]. In 2010, the International Blue Carbon Initiative was launched at UNFCCC COP-16 to protect coastal ecosystems through conservation and restoration plans—and to improve and apply best practice methodologies for blue carbon accounting, suitable management, and fulfilling the Paris agreement.
Due to the expense and resource intensity of direct on-ground monitoring of mangrove changes, remote sensing technologies are increasingly being applied and improved as cost-effective tools for mapping and monitoring mangrove forests at different scales from passive optical sensors to new generation of active remote sensing technology [9,10,11,12]. Starting from 2014, the Sentinel-2 Multi-Spectral Instrument (MSI) has demonstrated its capability to effectively map and monitor mangroves with both impressive spatial and temporal resolutions [9,13,14,15,16]. Furthermore, the Sentinel-2 data can be analyzed using the Google Earth Engine (GEE) cloud computing platform, which helps address the difficulties associated with handling large datasets for large-scale mapping [6,17]. Recently, advanced image classification methods have been developed to assist in processing remote sensing images for mangrove classification and for change detection, such as random forest (RF) [18,19], support vector machines (SVM) [20,21], decision trees (DT) [22,23], and artificial neural networks (ANNs) [19,24,25]. Mangrove classification studies have shown that distinguishing between mangroves with shrubs and aquatic plants remains a challenging task, primarily due to spectral similarity. Consequently, recent attention has shifted towards applying deep learning models for classification in mangrove areas. The advantage of using these models lies in their ability to autonomously extract feature categories from remote sensing images with high accuracy, even with limited data [26,27]. Among various deep learning techniques, the convolutional neural networks (CNNs) have demonstrated remarkable success in image classification [28,29,30]. One of the most famous CNNs is the U-Net semantic segmentation model, which has proven effective in mangrove studies [31,32,33,34]. Guo. Y. et al. [35] applied U-Net model for mapping mangrove distribution from 1990 to 2015 along the Maritime Silk Road using Landsat data and showed the accuracy of 81% for classification of mangrove forests in this region. Fu et al. [36] compared the SVM and Res-Net deep learning algorithm for mangrove classification from 1991 to 2021 using Landsat data in Hainan Island, achieving an overall accuracy of 96.43% for Res-Net and 93.11% for the SVM model. Hence, in the present research, the SVM and U-Net models were selected for monitoring mangrove areas to evaluate the accuracy of traditional machine learning method and U-Net segmentation model classification.
Despite advancements in remote sensing technology and image classification, few studies have utilized remote sensing to evaluate the effectiveness of conservation and restoration efforts in mangrove areas [37,38]. For instance, Jia et al. [39] employed 123 Landsat images to map changes in mangrove forest in China between 1973 and 2015, before and after conservation efforts. The results indicated an increasing trend in mangrove cover following the implementation of conservation actions. Similarly, Zhen et al. [40] utilized Landsat and SAR data to map mangrove forests in reserve mangrove areas in China by employing the SVR model to enhance accurate information for the development of conservation policies. Evaluating mangrove cover change through Landsat data revealed an increasing rate of 3.74% in Pakistan due to planting and conservation [41]. Rondon et al. [38] studied a systematic review to show mangrove distribution and cover under conservation initiatives using remote sensing in the Gulf Cooperation Council countries. Additionally, Maung et al. [42] compared U-Net and Artificial Neural Network models derived from PlanetScope and Sentinel-2 imagery for land cover/land use classification in a mangrove conservation project in Myanmar. Their findings demonstrated the high accuracy (94.05%) of the U-Net model when using PlanetScope data compared to Sentinel-2.
Considering the benefit of achieving high classification accuracy in mangrove monitoring and acknowledging research gaps in the evaluation of conservation projects, this study focuses on two the Global Environment Facility (GEF) blue forests project sites, one in the Bay of Assassins in southeast Madagascar, and one in Abu Dhabi, the United Arab Emirates (UAE). The selection of these sites was guided by data availability and the significance of the mangrove carbon conservation initiatives implemented. In this regard, the objectives of this study are: (1) compare the performance of U-Net convolutional neural network and SVM model with hand engineered features; (2) classify and generate a regional mangrove map with 10-m resolution Sentinel-2 imagery with high accuracy of image classification; (3) detect mangrove changes since the commencement of conservation and restoration efforts.
2. Materials
2.1. Study Sites
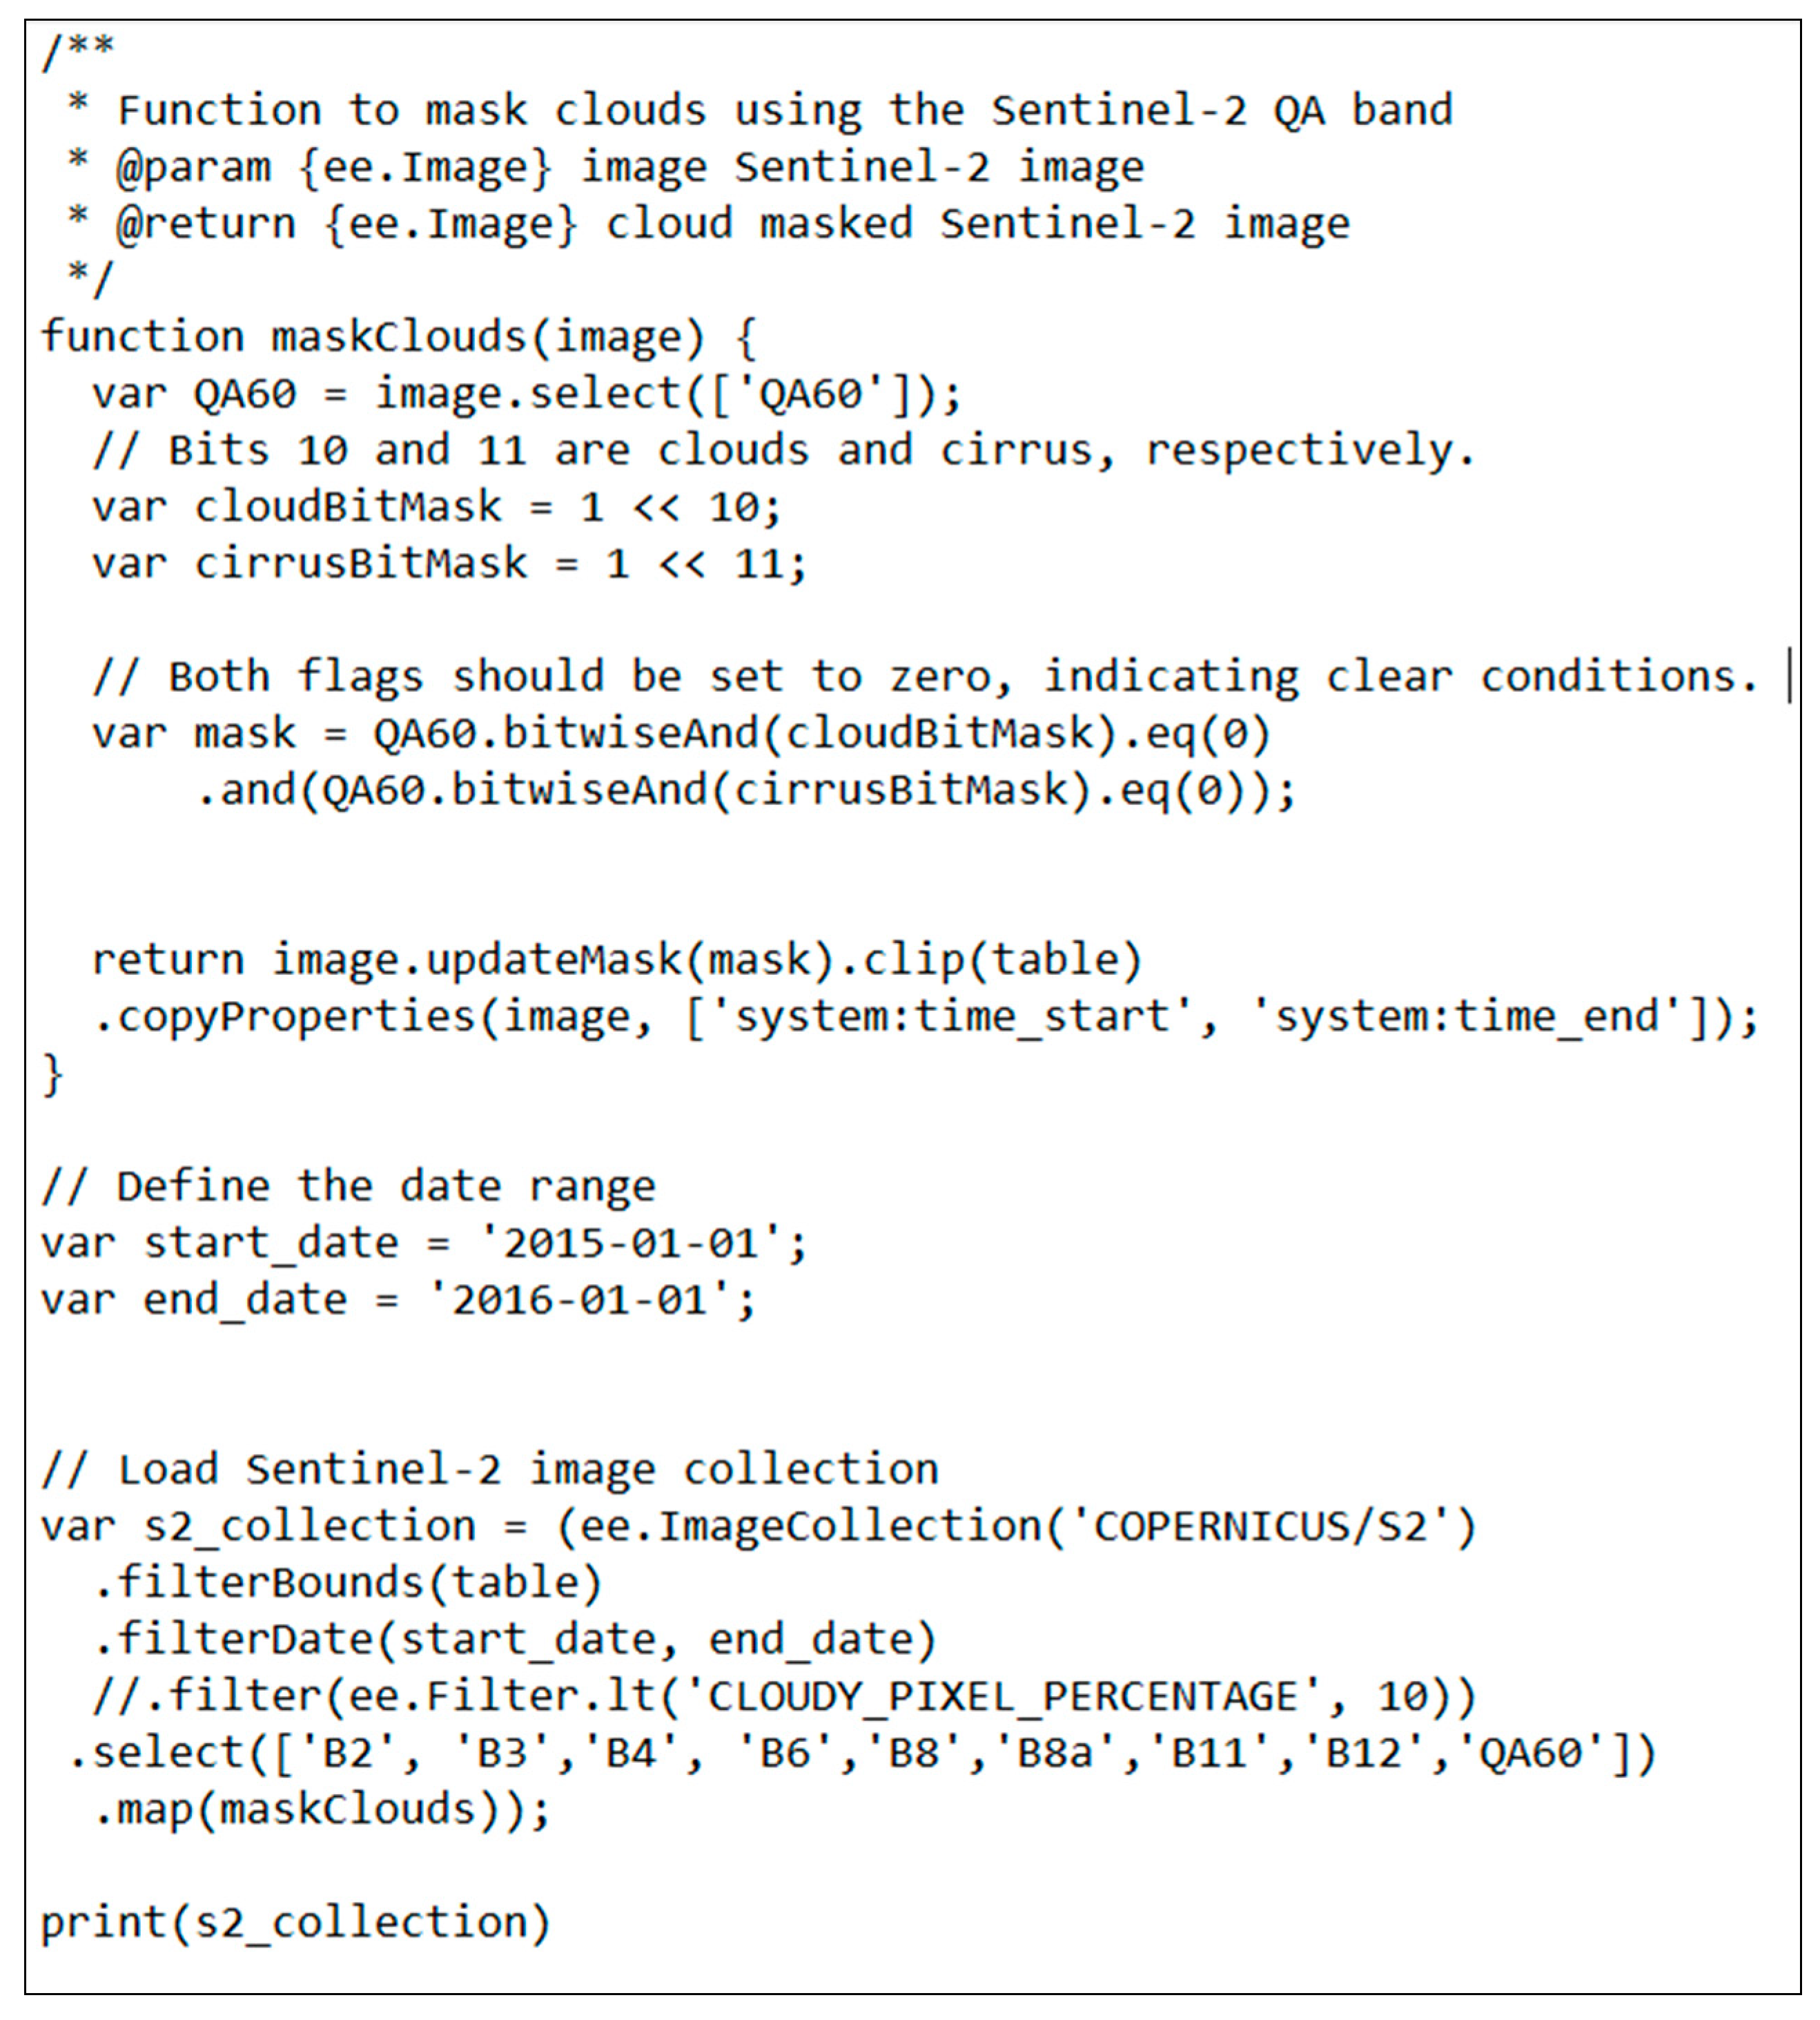
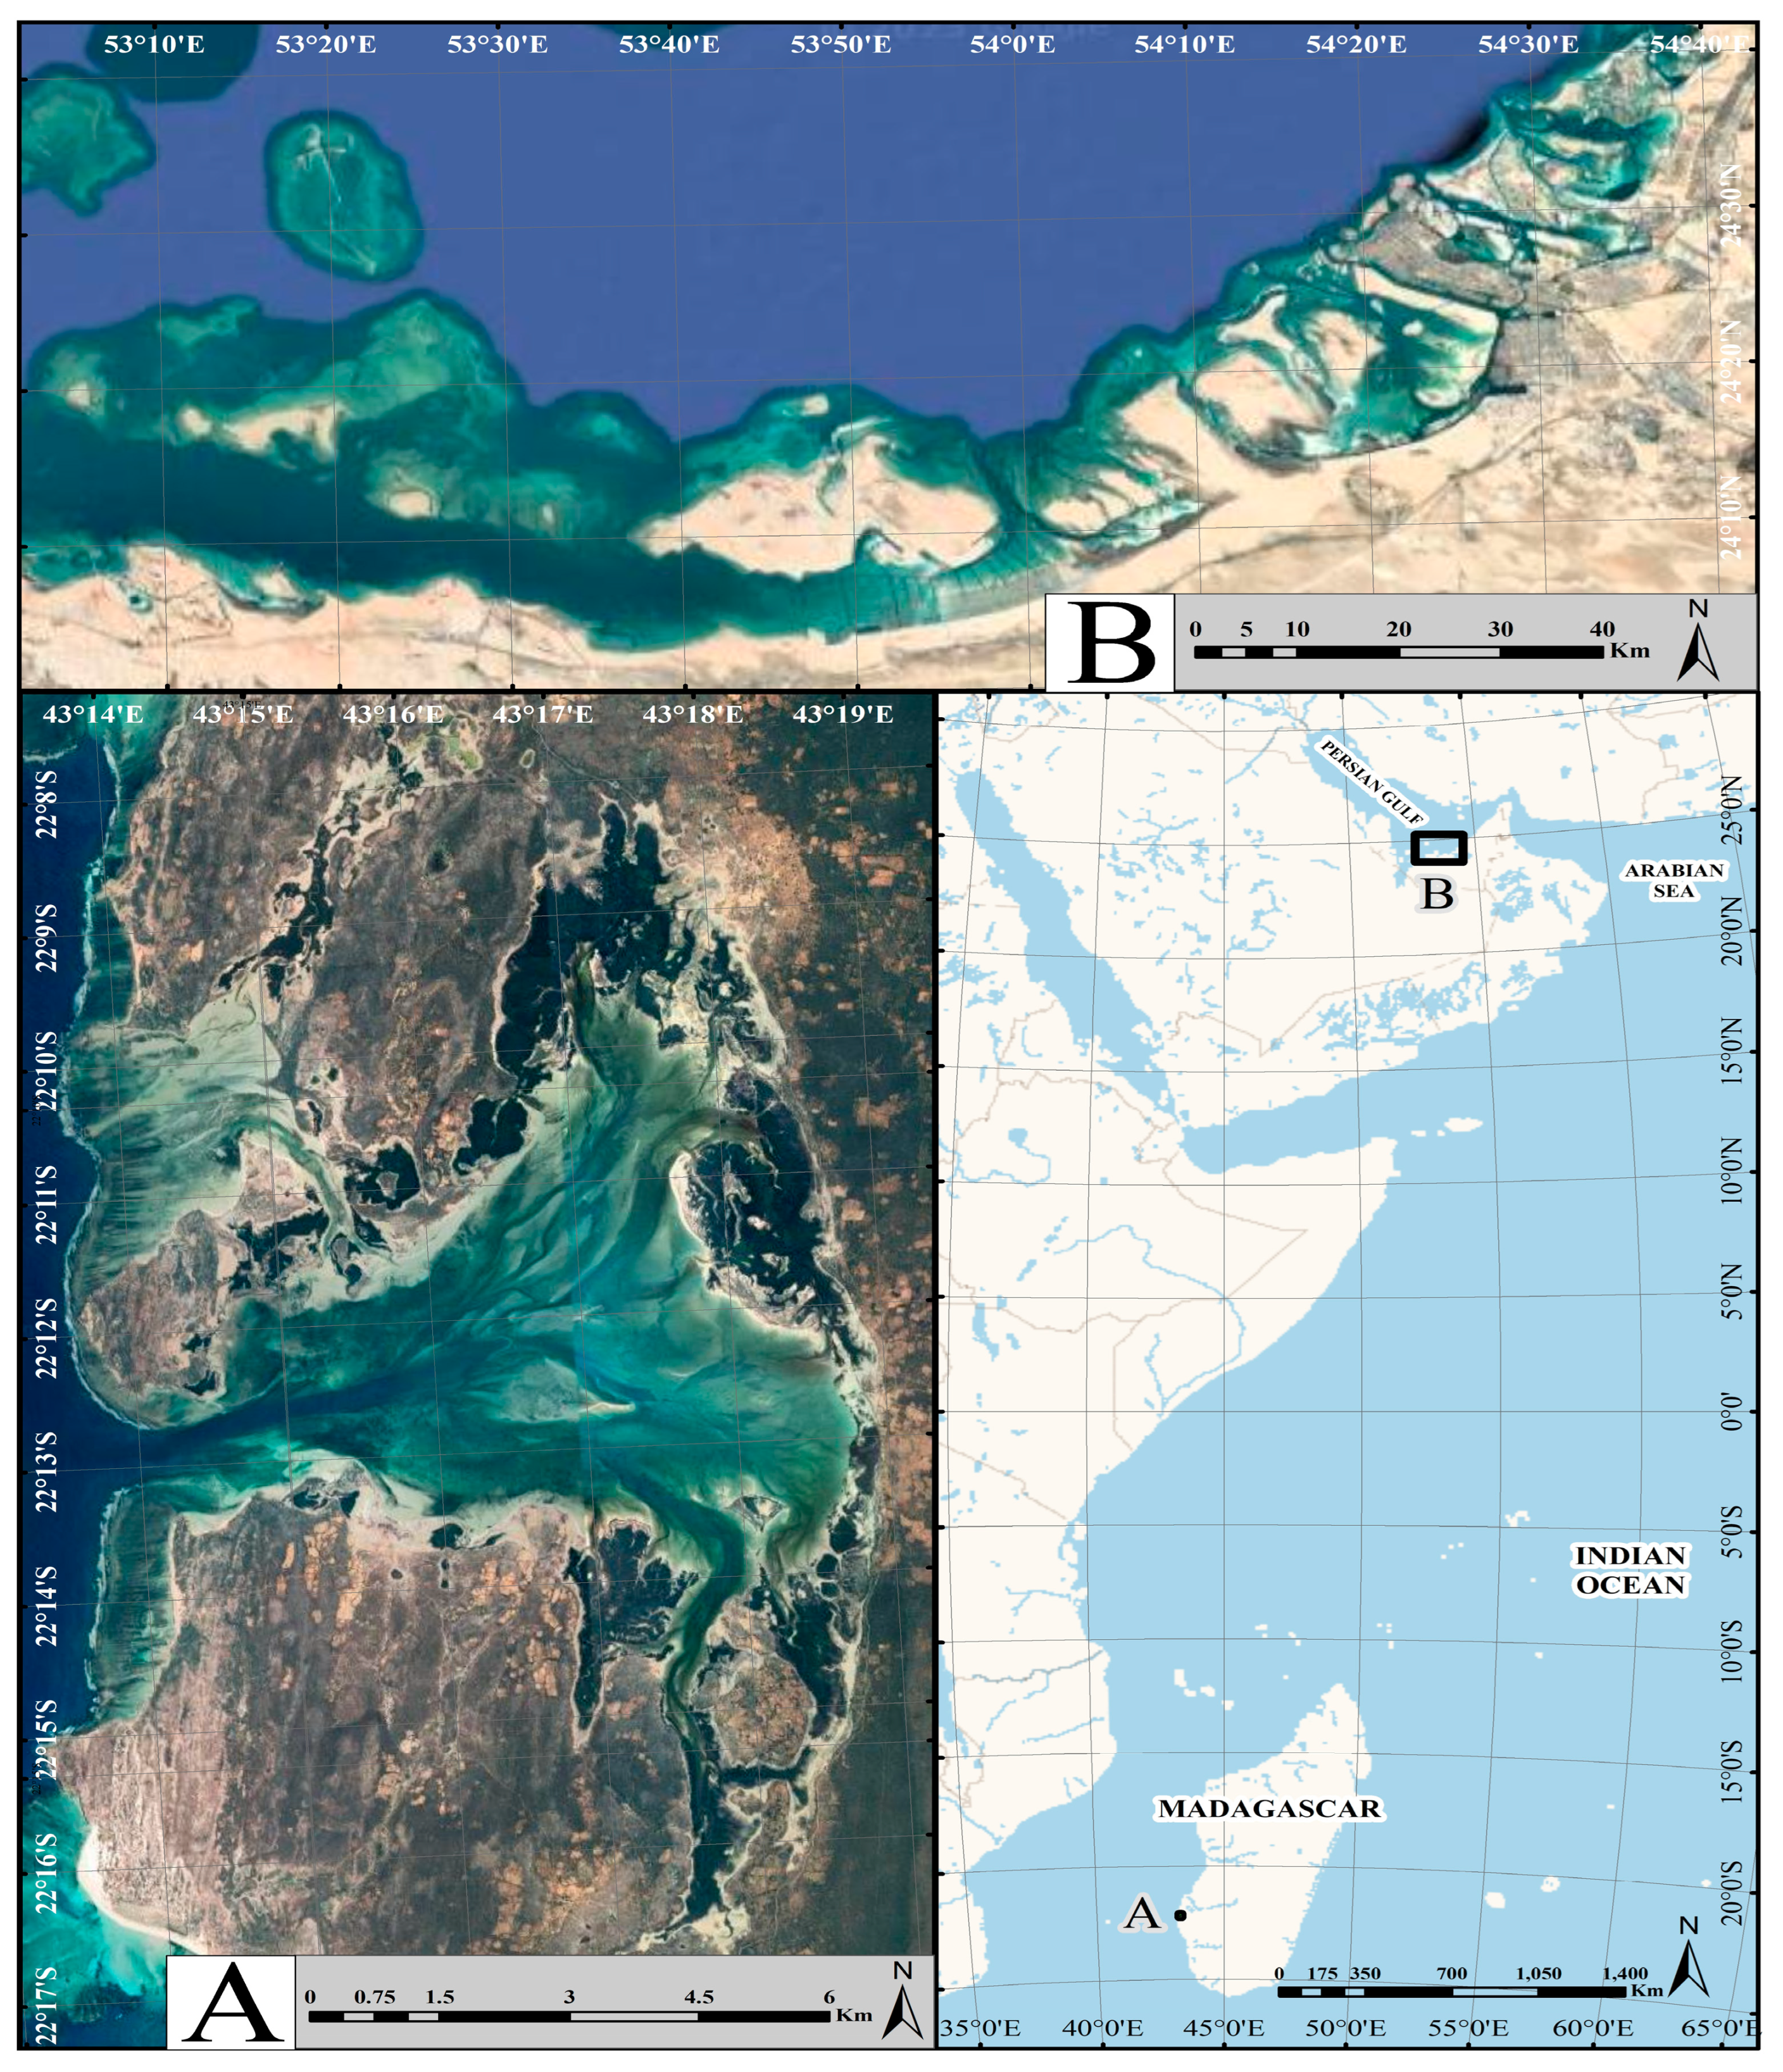
The first study area, the Tahiry Honko project of 189 km2 including 10 villages, surrounds the Bay of Assassins (Helodrano Fagnemotse) in southwest Madagascar (22°11′ S and 43°12′ E), inside the boundaries of the Velondriake Locally Managed Marine Area (LMMA). The area has a semi-arid climate with approximately less than 400 mm rainfall per year and the predominant mangrove species are Bruguiera gymnorrhiza, Rhizophora mucronata, Xylocarpus granatum, Ceriops tagal, Avicennia marina, Sonneratia alba, and Lumnitzeria racemosa. The Tahiry Honko project is the world’s largest community-led carbon sequestration project focused on a mangrove ecosystem. It is a community-based PES (Payment for Ecosystem Services) initiative for selling of Plan Vivo certificates generated by avoiding 1300 tons of carbon dioxide emission per year. The local community residing in conditions of severe poverty relies on mangroves for timber, charcoal production, fishing, and aquaculture. Thus, residents have been employed to replant 10 hectares of mangroves every year and improve mangrove management actions. The income from selling carbon credits will be invested in local communities, infrastructure projects and important services for education. In Madagascar, 21% of mangrove forests were lost between the years 1990 and 2010 (approximately 58,000 ha) [26]. Therefore, the marine conservation NGO Blue Ventures and the Velondrike Association promote locally led conservation, replanting, and sustainable management of over 1200 hectares of mangroves in Madagascar [43].
The second study area, known as the Abu Dhabi Blue Carbon Demonstration Project, is within the coastal area of Abu Dhabi Emirates, from 24°45′ N and 54°37′ E, and has an area of 1480 km2. Average rainfall is less than 100 mm per year and salinity is higher than 70 PSU (practical salinity unit) in lagoons during summer. This project is facilitated by AGEDI (Abu Dhabi Environmental Data Initiative) and supported by UNEP, UNEP-WCMC (World Conservation Monitoring Centre, the United Kingdom) [44]. It is the first phase of a larger, ongoing effort to conserve blue carbon ecosystems and understand how they can be supported through policy and finance initiatives. Approximately 14,000 hectares (ha) of mangrove forests are scattered throughout the region, particularly around the margins of mud banks and lagoons on the outer islands and behind the barrier islands near Abu Dhabi Island. Mangrove forests are also located at Umm Al Quwain, Ras al Khaimah, the northern Emirates, and in Khor Kalba on the Gulf of Oman. The only native mangrove species across the Abu Dhabi coastline is Avicennia marina, which is able to tolerate the high soil salinity, high ambient temperatures, and limited freshwater fluxes [37] (Figure 1).
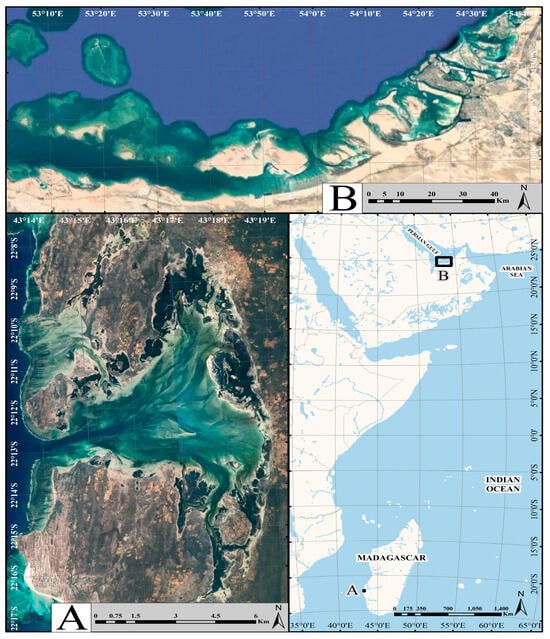
Figure 1.
The locations of the study sites: (A) Madagascar; (B) Abu Dhabi.
2.2. Sentinel-2 Imagery
The Tahiry Honko project in Madagascar and the Abu Dhabi Blue Carbon Demonstration Project in the United Arab Emirates were initiated in 2015. These projects involve regular verification and monitoring, which are scheduled every four to five years. The first round of verification and monitoring for the Madagascar project began in 2019, and for the Abu Dhabi project, it started in 2020. Moreover, the field data provided by the field sampling team of projects were collected in 2015, when the project commenced. Therefore, we opted to utilize Sentinel-2 data to ensure consistency in data collection since the inception of the project and to facilitate the assessment of remote sensing images based on field sampling data and references data simultaneously.
Sentinel-2 imagery is a European platform launched by the European Space Agency in 2015. Sentinel-2 has 13 spectral bands, including Bands 2, 3, 4, and 8 at 10 m, Bands 5, 6, 7, 8A, 11, and 12 at 20 m, and Bands 1, 9, and 10 at 60 m spatial resolutions at a revisit time of 5 days. The red-edge bands of Sentinel-2 are sensitive to absorption of chlorophyll contents from canopy to distinguish mangrove forests from non-mangroves. Images from the Sentinel-2 MSI are freely available, and they provide multispectral data at a finer spatial resolution compared to Landsat data [12].
In the current research, Sentinel-2 imagery (Level 1C Top of Atmosphere reflectance product), with four original bands at 10 m spatial resolution—R (665 µm), G (560 µm), B (490 µm), NIR (842 µm)—and vegetation red edge bands 6 (0.740 µm), 8A (0.865 µm), SWIR-1 (1610 µm) and SWIR-2 (2190 µm) at 20 m spatial resolution, was acquired for the Madagascar site (in 2015 and 2019) and for the Abu Dhabi site (in 2015 and 2020).
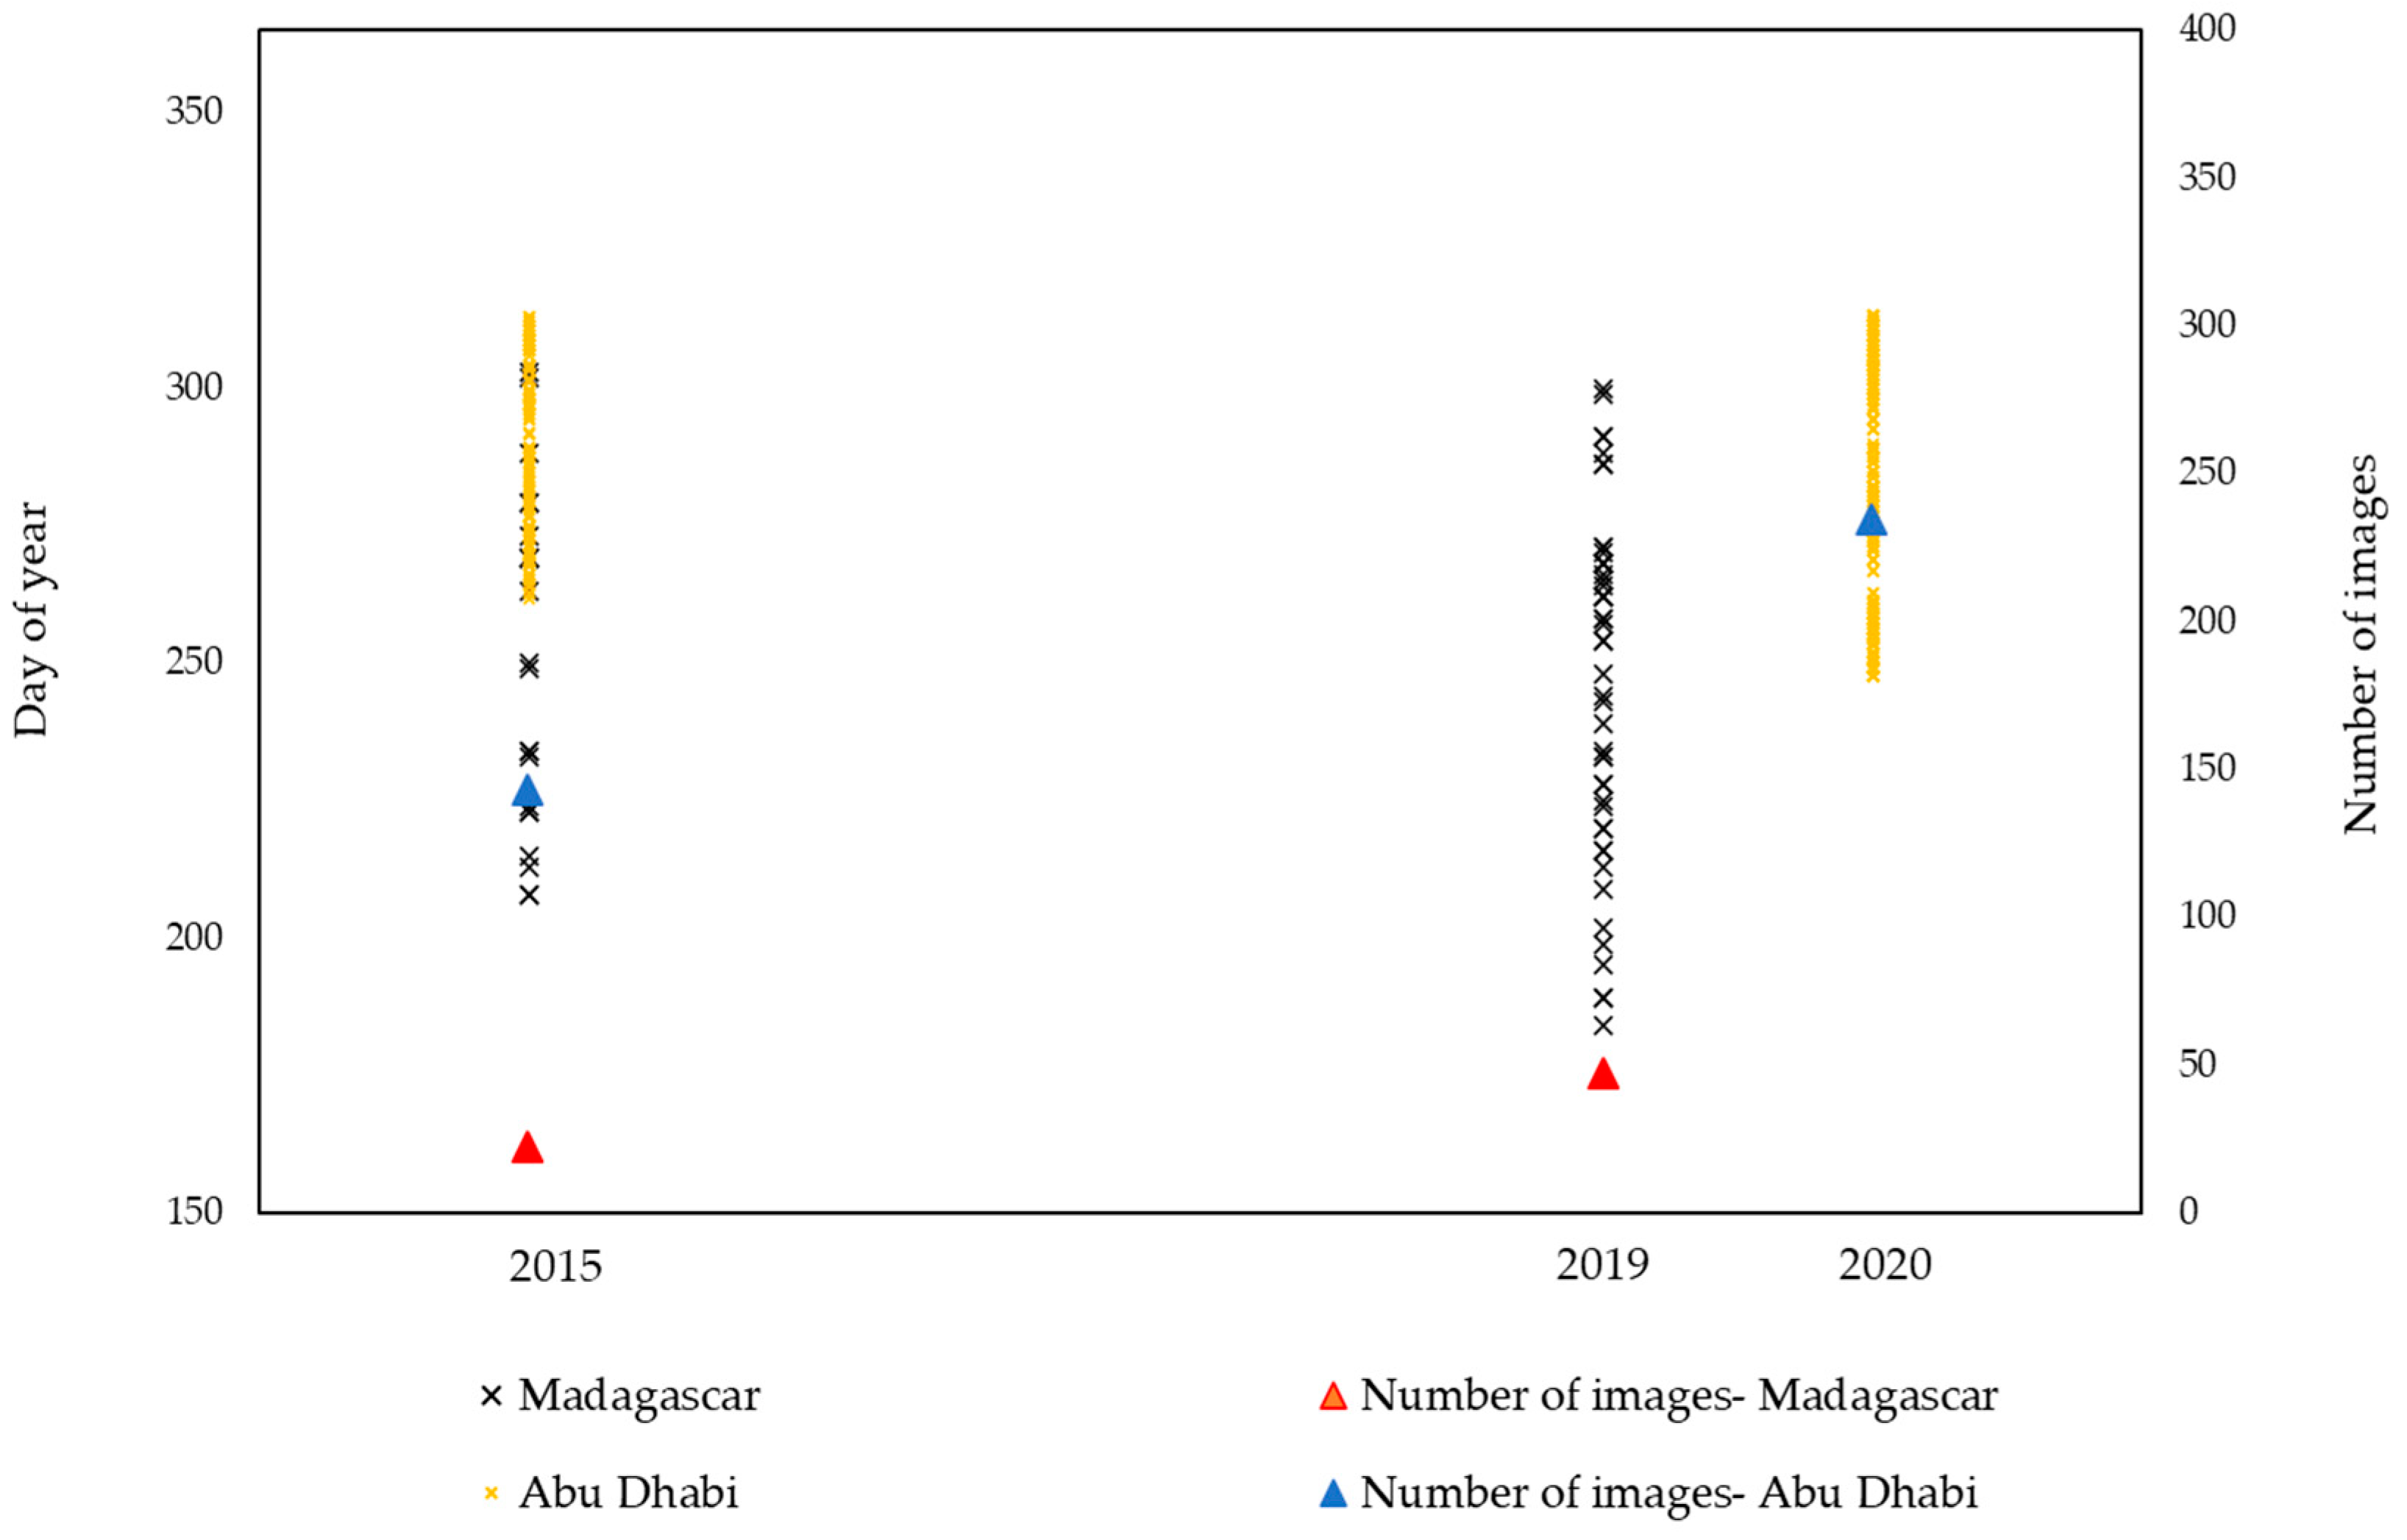
A total of 446 Sentinel-2 images were used in our study, with 69 images for Madagascar spanning from July 2015 to October 2019 and 377 images for Abu Dhabi from July 2015 to October 2020, focusing on low tidal heights (Appendix A).
2.3. Reference Samples
The classification schemes were based on reference samples produced through visual interpretation and acquired from high spatial resolution images available on Google Earth and ArcMap. The Global Mangrove Watch (GMW) [45] was also used as a reference sample. Additionally, the results of these data were combined with filed sampling data. We excluded images containing less than 1% of mangrove pixels, as they are unsuitable for mangrove detection.
Filed samples data for the Tahiry Honko project were collected by the field team of Blue Ventures, and for the Abu Dhabi project, field data were gathered and provided by a collaborative effort involving the Marine Division of the Terrestrial and Marine Biodiversity Sector within the Environment Agency-Abu Dhabi (EAD), along with contributions from the Abu Dhabi Global Environmental Data Initiative (AGEDI). The field survey was conducted from July to October 2015 and 2019 in Madagascar and from July to October 2015 and 2020 in Abu Dhabi [43]. A total of 56 plots measuring 20 m × 20 m in Madagascar and 35 plots measuring 30 m × 30 m in Abu Dhabi were determined through random stratified sampling following the mythologies outlined by Jones et al. [46]. In each plot, tree height, canopy cover, and diameter were measured for each tree with a diameter exceeding 50 cm above the highest prop root.
The land cover was categorized into four classes: closed-canopy (CC: dense mangroves with tall, mature stands, where mangrove canopy cover is >70%), open-canopy (OC: young, short to medium stands, where mangrove canopy cover is <70%), water (waterbody, areas dominated by natural waterbodies/artificial waterbodies) and other (other vegetation types such as grass, woodland, active cultivation, and terrestrial forest).
These four classes were selected based on the project design documents for “Tahiry Honko” and “the Abu Dhabi blue carbon demonstration” [43]. Mangrove subclass categories were further delineated following the results of Jones et al. [46]. The definitions for mangrove types were established using broad categories distinguished by canopy-cover and density, derived from SRTM and ground sampling data.
A total of 500 sample points were designated across both study sites to evaluate the classification accuracy using GEE for Madagascar in 2015 and 2019, and for Abu Dhabi in 2015 and 2020, through visual interpretation. The reference samples were split to training, and validation for all classification models. Of these samples, 70% were selected randomly for training, while 30% remaining were used for testing. The inclusion of randomly selected reference samples contributed to a decreased bias in the classification results. The random splitting process was executed at the polygon unit to ensure that training and testing samples were spatially independent. In addition, several polygons from narrow patches and spare areas within mangrove areas were incorporated into the mangrove test samples to enhance the evaluation of classification performance for classification.
3. Methodology
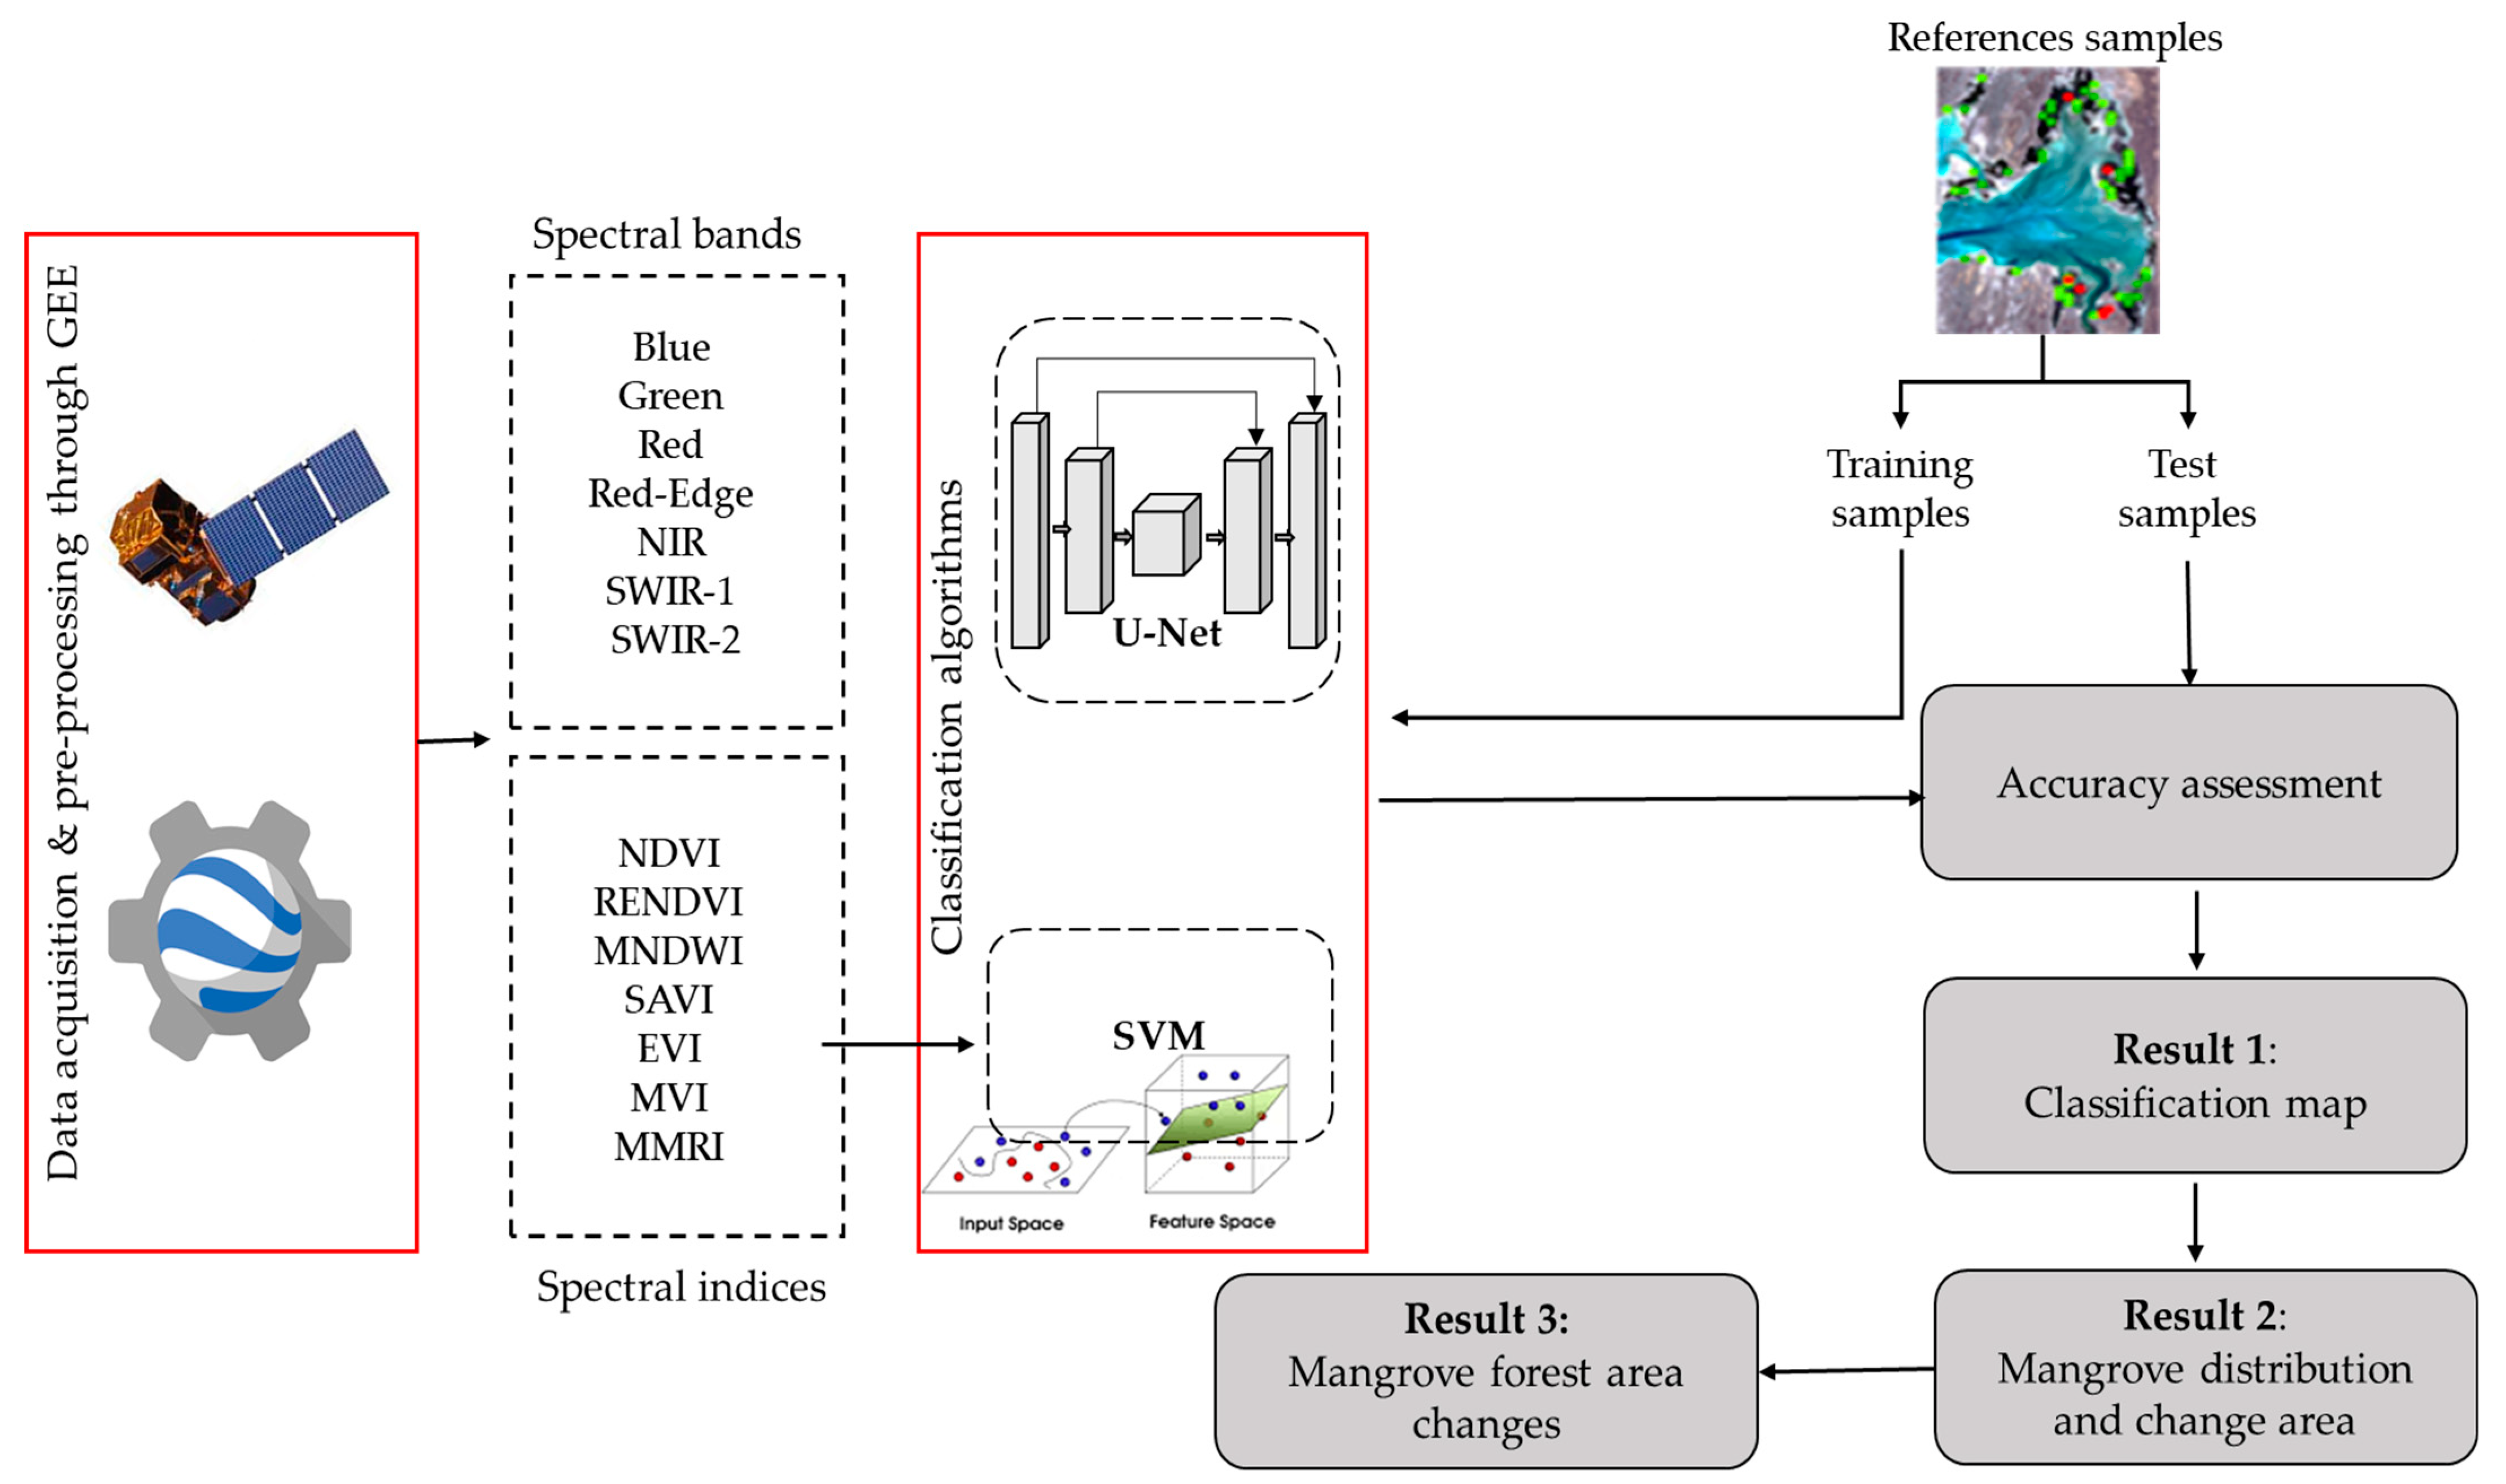
The proposed methodology to detect and map mangrove forests is based on two classification models, SVM and U-Net, and consists of five main steps: (1) data acquisition and pre-processing of Sentinel-2 imagery through Google Earth Engine, (2) training and validation of classification algorithms, (3) evaluating the performance of U-Net and SVM for feature extraction and classification, (4) identifying the most appropriate classification method for mapping mangrove forests, and (5) estimating changes in mangrove coverage. Figure 2 shows an overview of the main stages of the methodology that was used in this research.
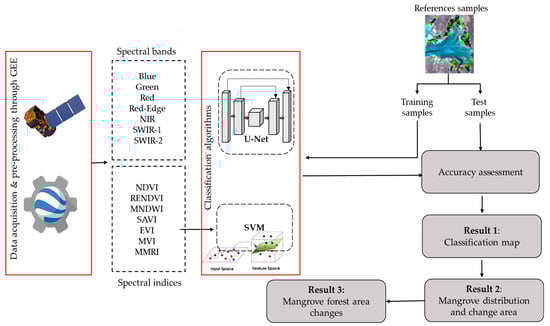
Figure 2.
Overview of the main stages of the proposed procedure used in the study.
3.1. Sentinel-2 Data Pre-Processing
The Sentinel-2 L1C images were obtained and pre-processed on Google Earth Engine (GEE) cloud computing platform (Image Collection ID: COPERNICUS/S2). Initially, these images were converted into top-of-atmosphere reflectance data through radiometric correction, then bands of 20 m resolution were resampled to 10 m before calculating the spectral indices using nearest neighbor method in GEE Python API. In the next step, due to the importance of cloud masking, all Sentinel-2 images with lower than 10% cloud coverage were used. The cloud masking procedure employed the Quality Assessment (QA) band (var QA60 = image.select([‘QA60’]) and the median reducer function provided by GEE. A median function was employed to downscale and merge the images, resulting in the creation of a cloud-free Sentinel-2 mosaic image representing the study area [17].
3.2. Vegetation Indices
Seven vegetation indices (VIs) derived from spectral bands of Sentinel-2 imagery were added to SVM model to explore their influence on the model classification accuracy (Table 1), including NDVI (Nominalized Difference Vegetation Index), RENDVI (Red-Edge Normalized Different Vegetation Index), MNDWI (Modified Normalized Difference Water Index), SAVI (Soil Adjusted Vegetation Index), EVI (Enhanced Vegetation Index), MVI (Mangrove Vegetation Index), and MMRI (Modular Mangrove Recognition Index). These indices can identify green vegetation and open surface water [32]. NDVI index is a widely used indicator for mangrove forest studies, obtained by employing a normalized algorithm that utilizes data from both the visible (red) and near-infrared (NIR) regions. The inclusion of the NIR band in the NDVI index is valuable in identifying healthy vegetation in contrast to various other wavelengths. The MVI index employs three specific Sentinel-2 bands, namely green, NIR, and SWIR. It calculates the index as (NIR-Green)/(SWIR-Green) to differentiate between greenness and moisture in mangrove forests. The MMRI index combines two traditional indices, one focused on vegetation and the other on water, to augment the distinction between mangrove and non-mangrove cover. The calculation of vegetation indices was performed using Python 3.11 for the study areas.

Table 1.
Spectral bands and indices extracted from Sentinel-2 data considered in this study.
3.3. Classification
The selection of SVM and U-Net models over other algorithms in this study was based on the limited number of available training samples, as revealed by our literature review [20,30]. SVM and U-Net demonstrated effectiveness in handling small training datasets, which is particularly relevant to our dataset, making them ideal classification models for our research.
As a non-parametric classification method, the Support Vector Machine is used for data analysis and pattern recognition. This method makes the data linearly distinguishable by introducing a “kernel function” that maps data into a high-dimensional feature space. The radial basin function (RBF) is the most popular kernel function that was selected for this study. The main parameters for SVM with a radial basis function kernel are cost (regularization parameter of the error term) and gamma (handling nonlinear classification hyperparameter). In this research, the most effective values for the cost and gamma parameters of the radial basis function are 100 and 1, respectively. These values were efficiently determined in parallel using the grid search method. This method was implemented in MATLAB R2022a. The operating system of the experimental platform was Windows 10, and the processor was 11th Gen Intel® CoreTM i7—1165G7 (Intel, Santa Clara, CA, USA).
The U-Net is a CNN-based algorithm with an encoder and a decoder [55]. The U-Net model uses convolutional layers as a basic layer for recognition of spectral and spatial patterns at various scales. By passing through several hidden layers, the encoder section is used to extract spatial characteristics from satellite imagery. Downsampling filters were used to reduce the spatial resolution and to increase the “spectral” resolution in each pass. A convolution block in the encoder part comprises two 3 × 3 convolution operations that proceeds a max-pooling operation with a pooling size of 2 × 2 and stride of 2. We repeated this block four times, and after each downsampling, we doubled the number of filters in the convolution. As a final step, by a series of two 3 × 3 convolution operations we linked the encoder and decoder.
On the contrary, the decoder creates the segmentation map from the encoder characteristics. In the decoder part, the images are passed through other hidden layers, and they lose their spectral resolution while achieving the final land cover classification with high spatial resolution. The segmentation map is created by the decoder from the encoder output. In the decoder part, the image is passed through other hidden layers that execute the reverse process of the encoder part. As a result, the image loses spectral resolution in each pass, as it gains spatial resolution to generate the final land cover classification.
The decoder upsamples the feature map through 2 × 2 transposed convolution operations while, in the meantime, it reduces the feature channels to half. This is followed by a repeated series of two 3 × 3 convolution processes. We repeated the sequence of upsampling and two convolution operations four times, as at each iteration, we reduced the number of filters to half. As a final step, using a 1 × 1 convolution operation, we generated the last segmentation map. Except for the final layer, all convolutional layers in the U-Net employ the rectified linear unit (ReLU) as an activation function. The chosen optimizer model was Adam, initialized with a learning rate of 0.01. The training process utilized the slice size of 128 × 128 pixels and the batch size of 23 and each epoch was iterated 200 times. In this study, the U-Net model developed was trained using TensorFlow 2.12 in Python.
3.4. Accuracy Assessment of the Algorithms
To evaluate the mangrove classification maps generated by SVM and U-Net models, we conducted a statistical accuracy assessment using reference sample points. In this study, the confusion matrix was used to accuracy assessment including the user’s accuracy (UA), producer’s accuracy (PA), overall accuracy (OA), and kappa coefficient (K) for assessing the model uncertainties. We divided the number of correct predictions by the total number of predictions to calculate OA that expressed as a percentage, and we divided the number of correctly identified predictions in each map class by the number in that reference class to calculate PA. UA was calculated by dividing the number correctly identified in a given map class by the number claimed to be in that map class. OA is expressed as a percentage and 100% accuracy shows a perfect classification. Following the evaluation of the SVM and U-Net models, the U-Net model was applied to generate classification maps for Madagascar (2015 and 2019) and Abu Dhabi (2015 and 2020) using GIS software (V10.8.1).
4. Results
4.1. Accuracy Assessment Results
The confusion matrix was generated to evaluate the classification accuracy by calculating overall accuracy and kappa coefficient for SVM and U-Net algorithms in both areas. Since this study focused on closed-canopy and open-canopy mangrove forests, when assessing classification accuracy, water and other land cover classes were excluded due to the large portion of water and other land cover types that would otherwise contribute to the overall accuracy. Table 2 shows the U-Net model’s high potential for classification in this study, with an overall accuracy over 90%. The highest classification accuracy was recorded in Abu Dhabi in 2015, with an overall accuracy of 92.72% and kappa coefficient of 0.89%.
Table 2.
Accuracy assessment of U-Net classification model in Madagascar for 2015 and 2019 and Abu Dhabi for 2015 and 2020.
Table 3 presents the accuracy assessment of the SVM classification model in Madagascar and Abu Dhabi. The results showed that the SVM model performed well in both years in Madagascar and Abu Dhabi, achieving an overall accuracy exceeding 80%. The producer’s accuracy highlighted the SVM proficiency in classifying closed-canopy and open-canopy types. The highest accuracy classification occurred in Madagascar in 2015, with an overall accuracy and kappa coefficient reaching 90.26% and 0.85, respectively.
Table 3.
Accuracy assessment of SVM classification model in Madagascar for 2015 and 2019 and Abu Dhabi for 2015 and 2020.
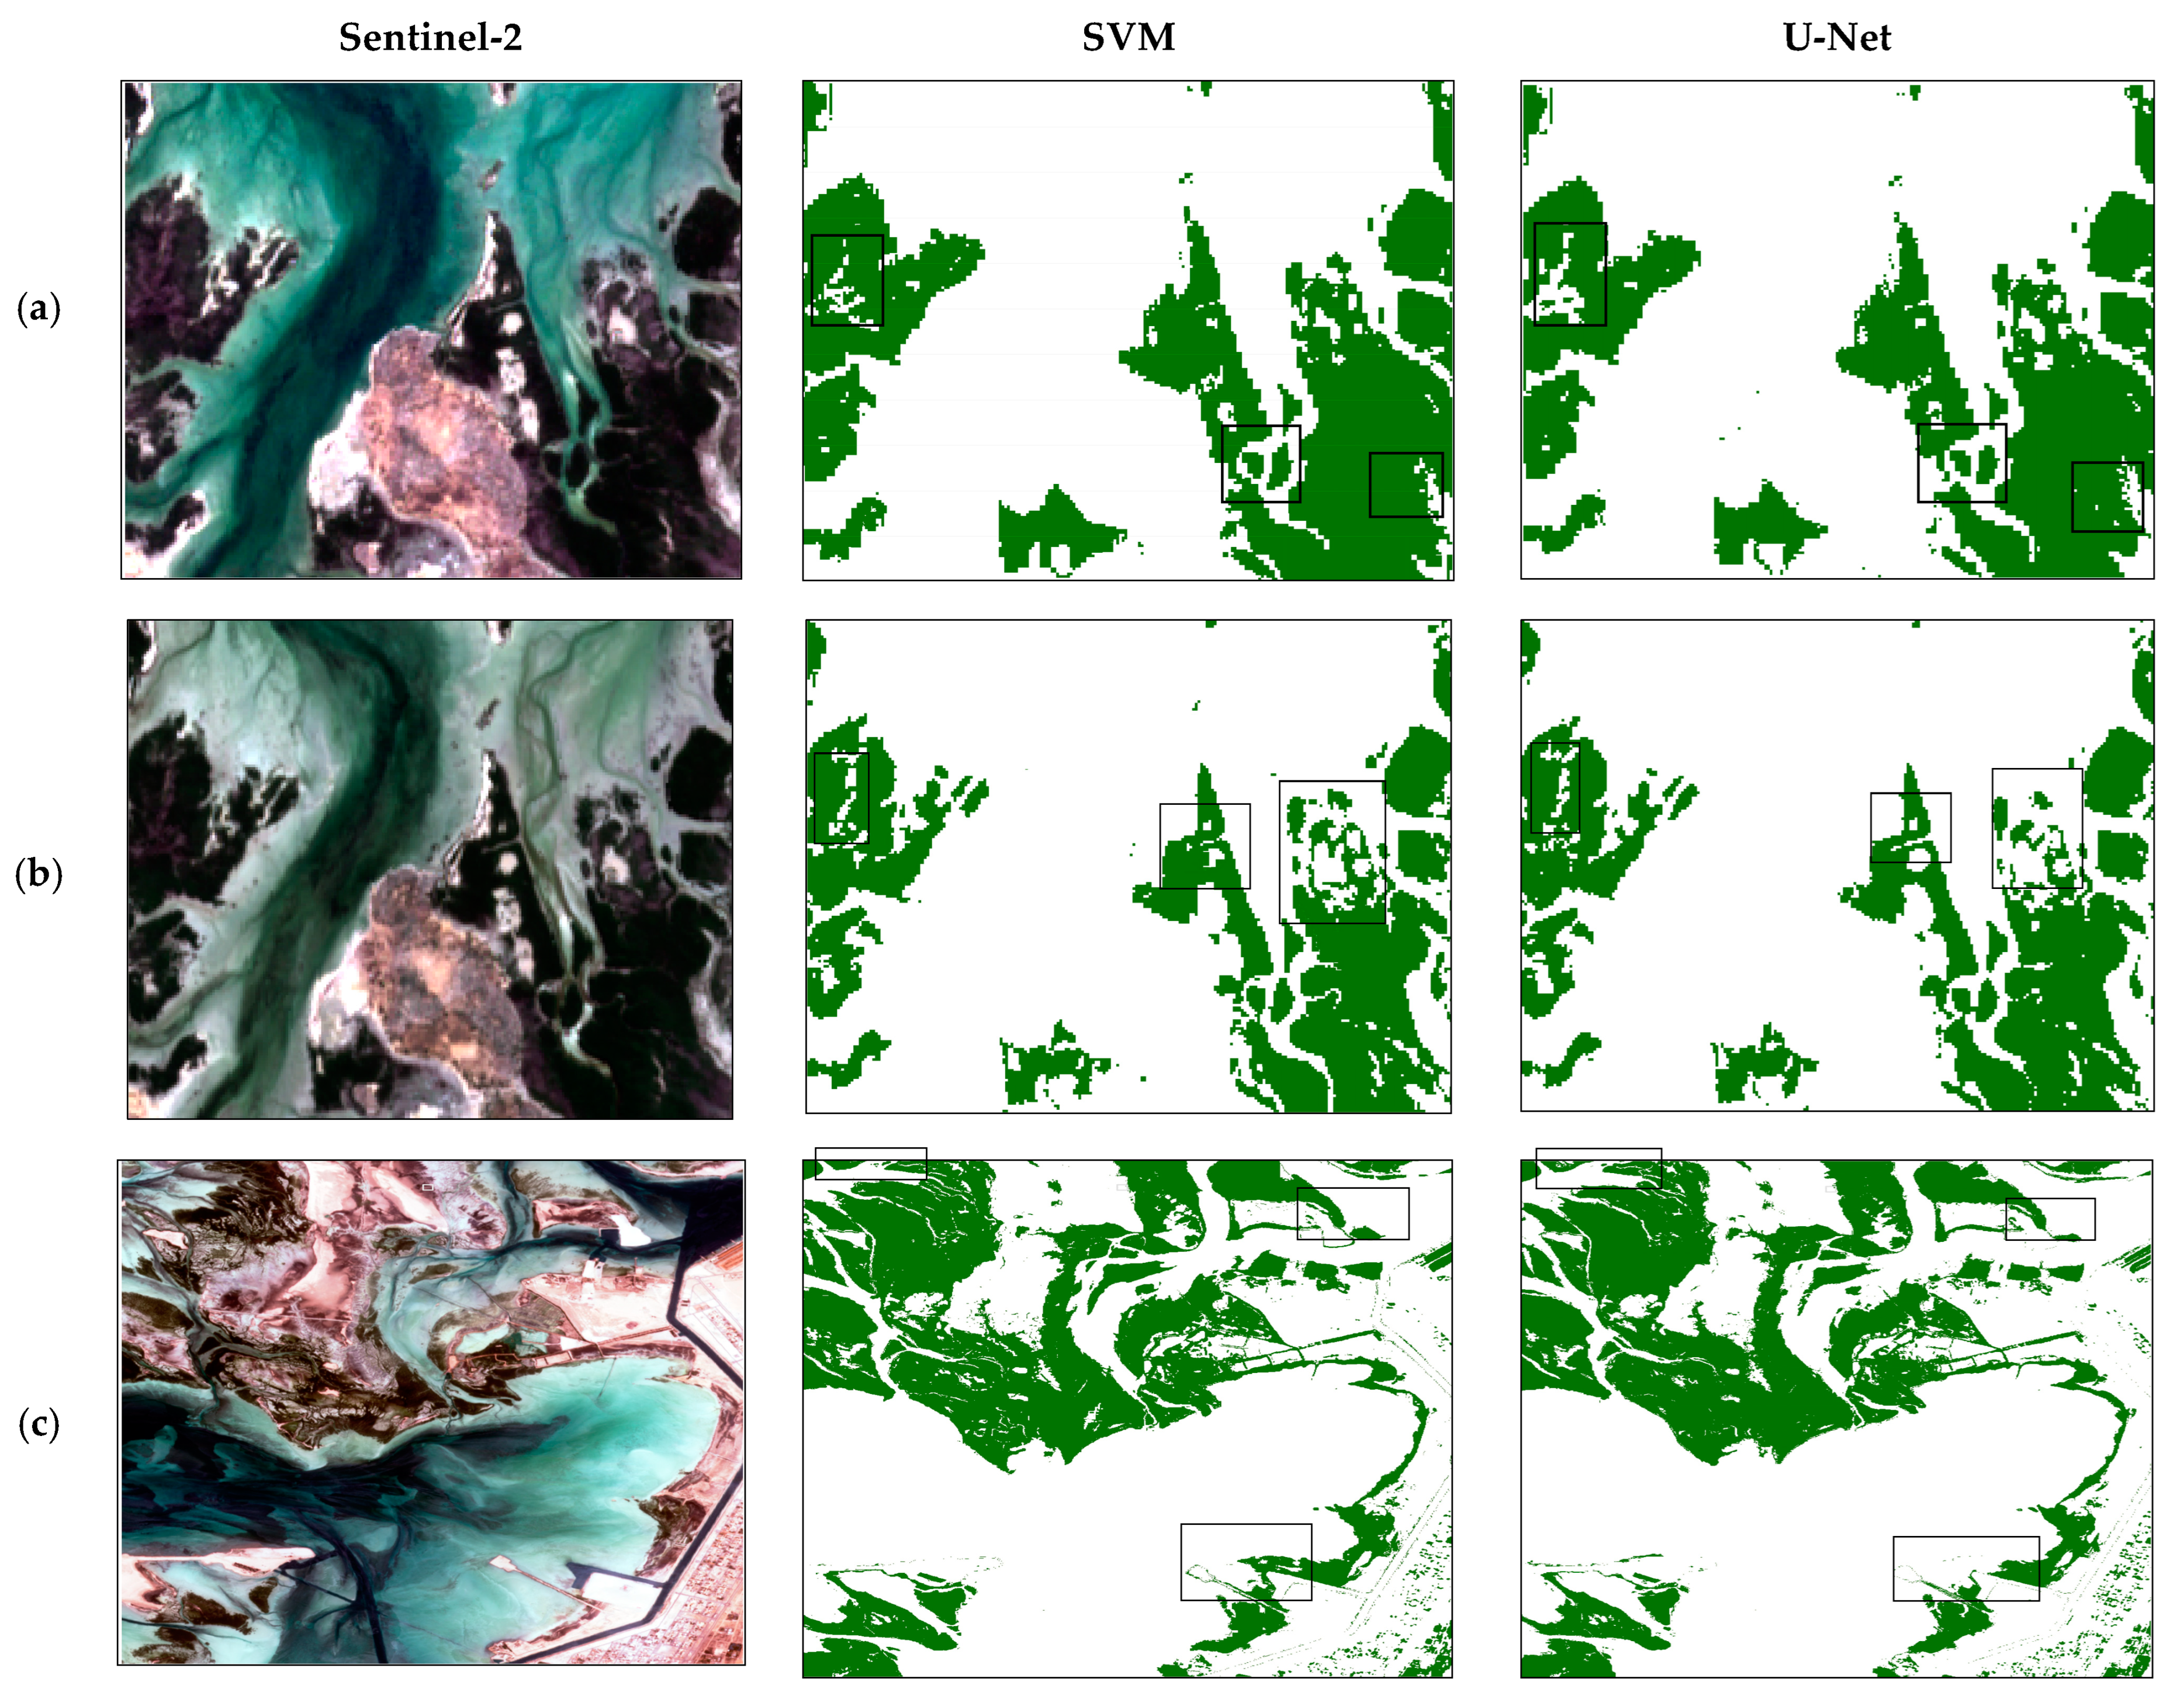
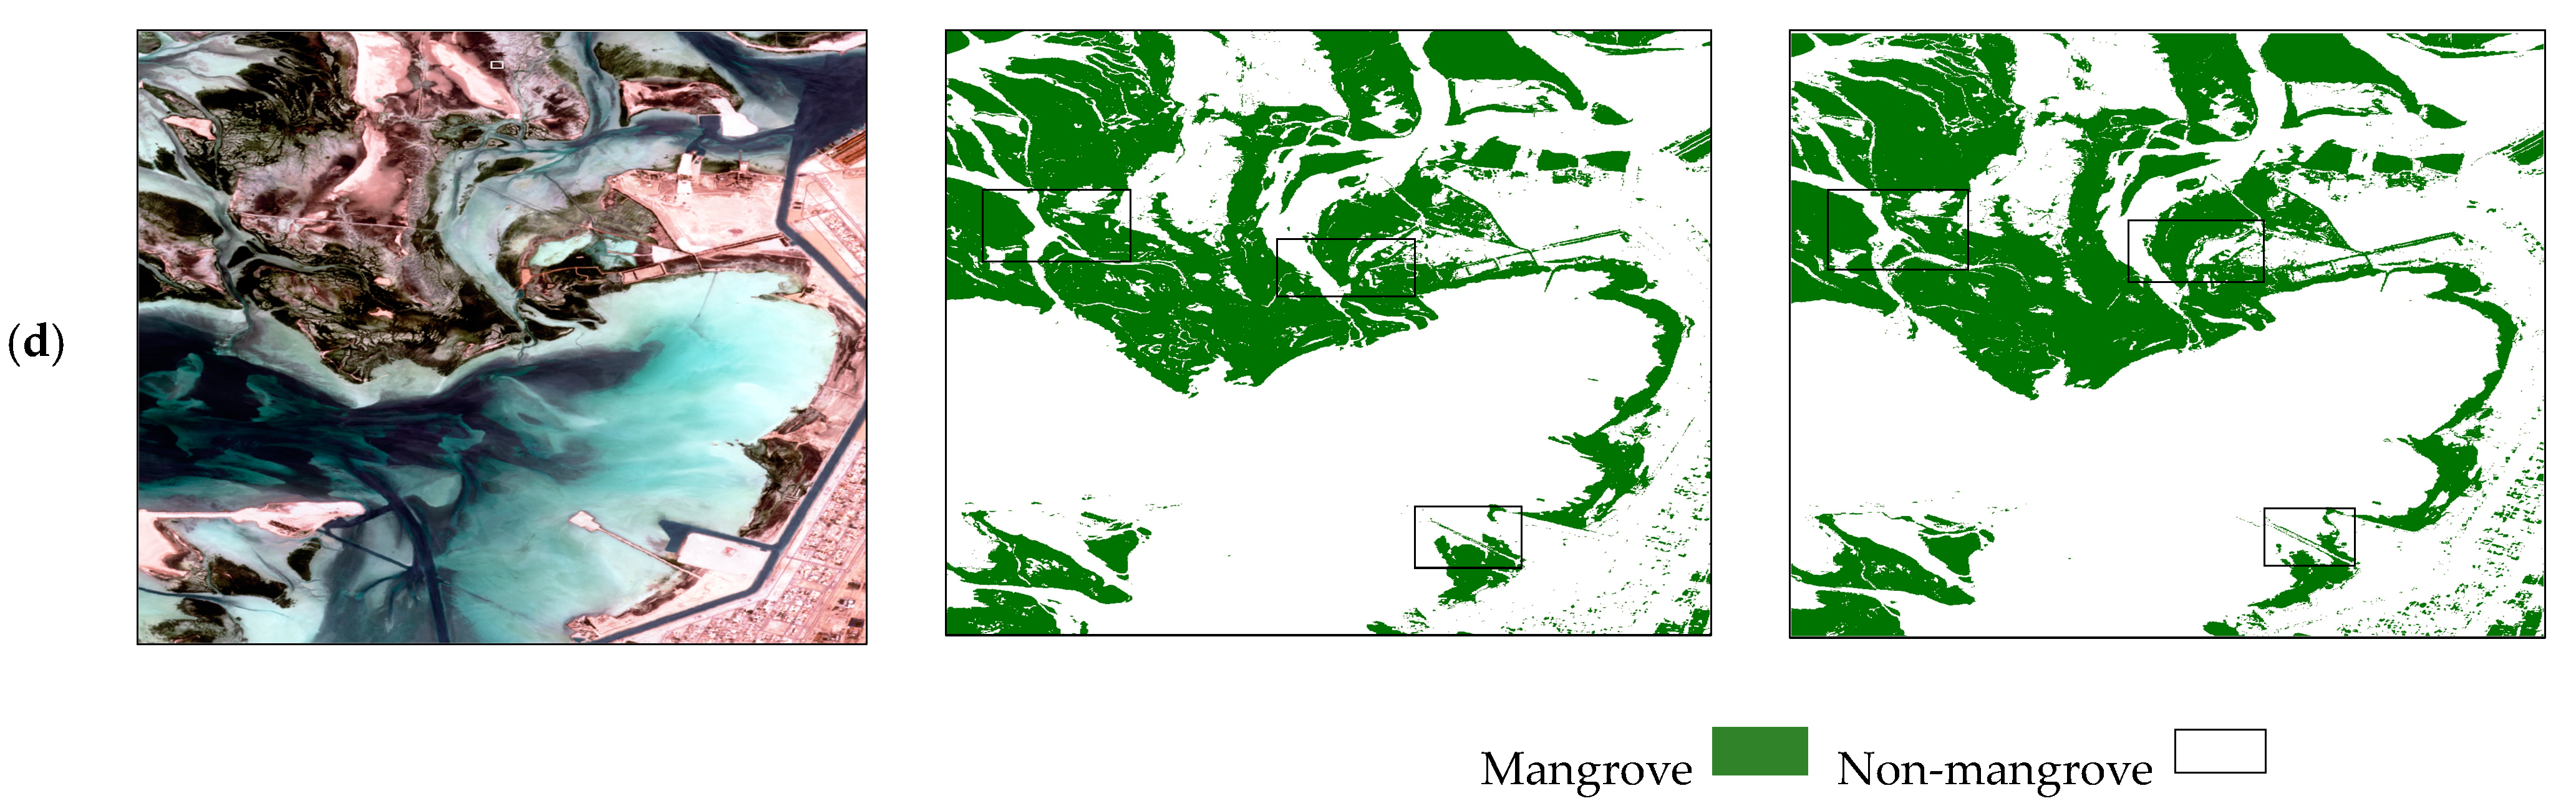
Figure 3 presents the extraction results of mangroves and non-mangrove using the SVM and U-Net model, compared with Sentinel-2 remote sensing imagery in Madagascar and Abu Dhabi. A comparison between the SVM machine learning model and the U-Net segmentation deep learning model revealed that both models achieved the highest accuracy in all metrics when classifying closed-canopy and open canopy areas. Particularly, the U-Net model demonstrated superior accuracy in distinguishing mangrove areas from other features with similar spectral information. However, it was observed that vegetation near water bodies was misclassified as mangrove area by the SVM model.
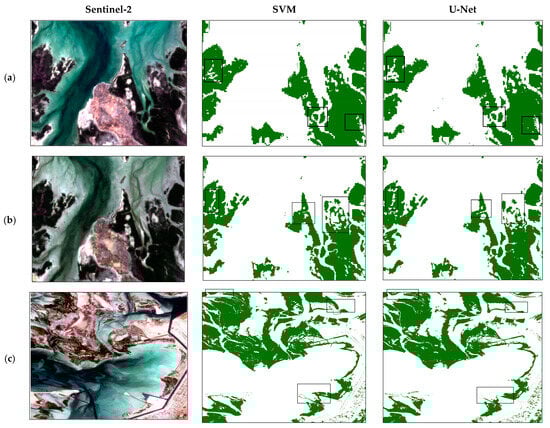

Figure 3.
The extraction results of mangroves and non-mangroves using Sentinel-2 image, SVM model, and U-Net model. (a) Madagascar 2015; (b) Madagascar 2019; (c) Abu Dhabi 2015; (d) Abu Dhabi 2020. The black rectangles show a comparison of results obtained from U-Net and SVM classification methods.
The SVM model faced challenges in extracting mangroves from Sentinel-2 images with other features, such as water and aquatic plants. Some noise, cloud effects, and misclassified pixels were observed during the identification of mangrove area from other vegetations. Furthermore, the high accuracy of the SVM model suggested that incorporating seven vegetation indices into this model could prove beneficial for detecting mangrove areas. In contrast, the U-Net model demonstrated the ability to discern mangroves from other vegetation types with details from Sentinel-2 images, indicating its superior performance in generating a classification map in the current study (Figure 4).
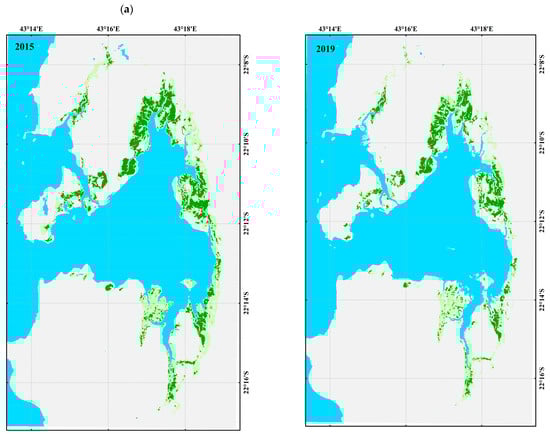
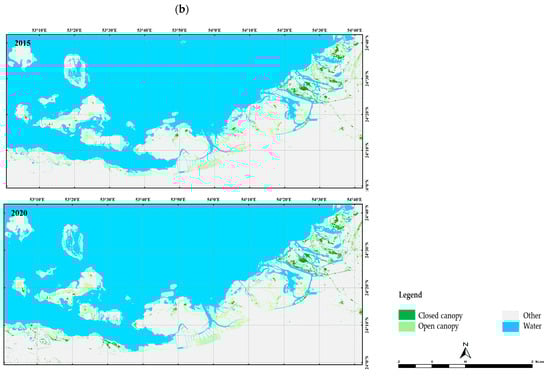
Figure 4.
The classified images using U-Net deep learning in (a) Madagascar and (b) Abu Dhabi.
4.2. Analysis of Changes in the Mangrove Area
Based on the accuracy assessment of the U-Net model, this model was utilized to analyze and map changes in mangrove areas in Madagascar and Abu Dhabi over the conservation implementation period. The observed trends in mangrove areas offer valuable insights into the impact of conservation efforts in these regions.
The results revealed an overall decreasing trend in the mangrove area at the Madagascar site between 2015 and 2019, contrasted by an increasing trend at the Abu Dhabi site from 2015 to 2020. The classification results for 2015 and 2019 in Madagascar indicated total mangrove areas of 1737.16 ha and 1382.79 ha, respectively, while non-mangrove areas were 17,174.89 ha and 18,271.9 ha, respectively (Table 4). Notably, approximately 20% (354.37 ha) of mangroves in Madagascar disappeared during the five-year period. Further analysis revealed that closed-canopy coverage decreased from 616.44 ha in 2015 to 513.99 ha in 2019, representing a 17% decline in area. Meanwhile, open-canopy coverage in 2015 was 1120.72 ha, reducing to 868.80 ha in 2019, constituting a 22% reduction. The most substantial transition occurred in open-canopy mangroves to other class (434 ha) and closed-canopy mangroves to open-canopy mangroves (216 ha).
Table 4.
Changes in mangrove forests and other classification types from 2015 to 2019 in Madagascar and Abu Dhabi.
Conversely, the findings from Abu Dhabi indicated a contrasting trend, with a noteworthy increase in the mangrove area observed from 2015 to 2020, accounting for approximately 11% (5857 ha). The classification results reflected a positive shift in the mangrove area during this conservation period, with the total mangrove area being 53,711 ha and 59,268 ha in 2015 and 2020, respectively. In 2015, the closed-canopy area covered 9428 ha and increased by 12,875 ha in 2020, marking a 36.6% positive change. Additionally, the open-canopy area was 43,983 ha in 2015 and increased to 46,393 in 2020, constituting a 5.48% increase.
These findings emphasize that, despite conservation efforts, Madagascar experienced a significant loss of approximately 20% of its mangrove area within the five-year period. This underscore ongoing threats such as deforestation, population growth, climate change factors, or inadequacies in conservation measures in this region. In contrast, Abu Dhabi demonstrated a notable success, with 7547 ha of non-mangrove area transformed into open-canopy mangroves, primarily attributed to newly planted and restored areas.
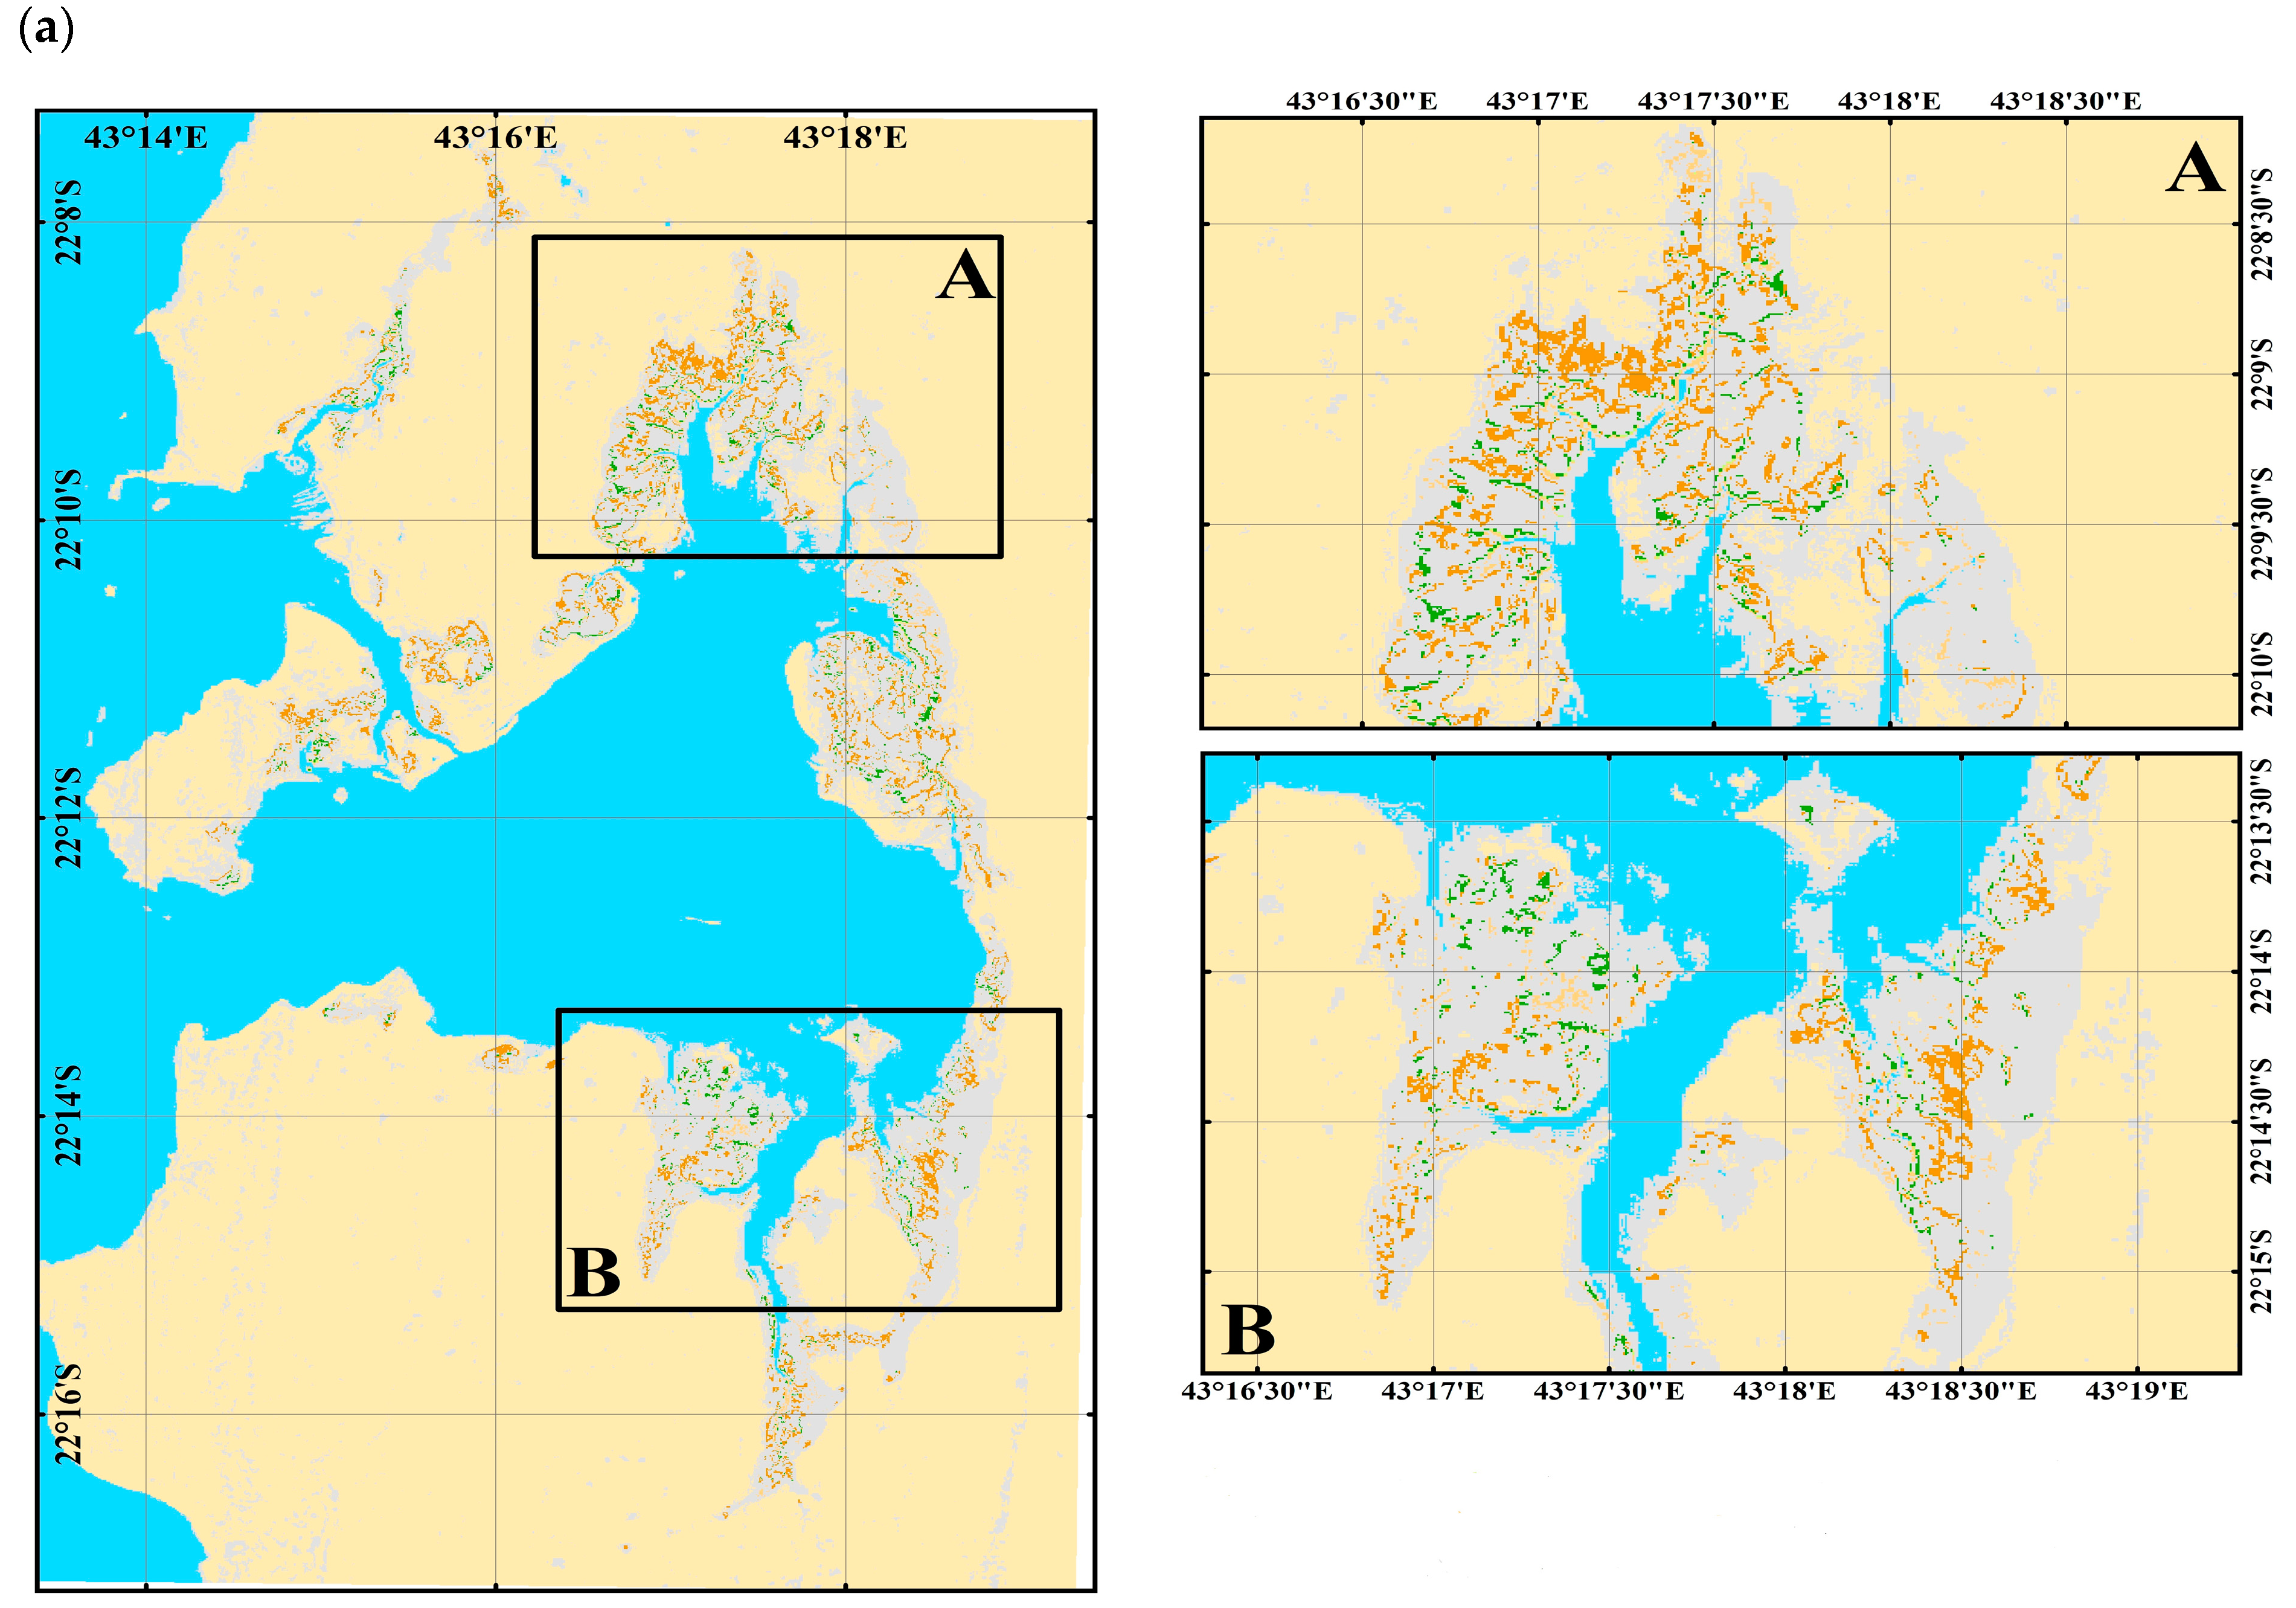
Figure 5 illustrates the spatial distribution of changes in mangrove areas in Madagascar and Abu Dhabi during the conservation implementation.
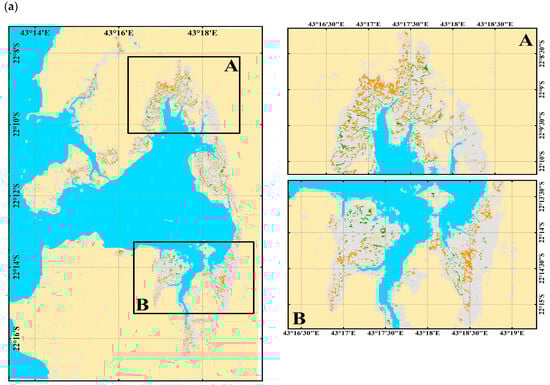
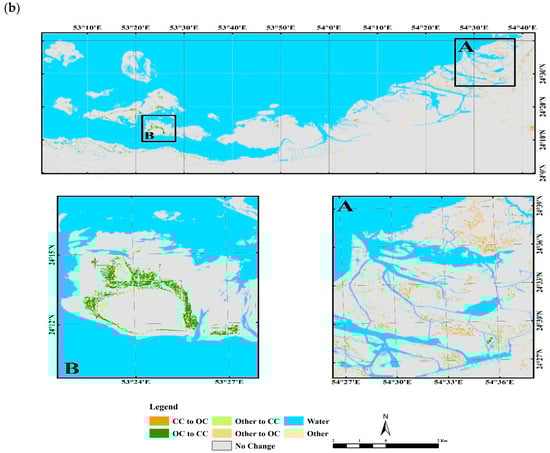
Figure 5.
Land cover transition over the period 2015 to 2019 in (a) Madagascar and 2015 to 2020 in (b) Abu Dhabi using U-Net convolutional neural network.
5. Discussion
5.1. Comparison of SVM and U-Net Classification Methods
Monitoring and assessing the success of blue forest projects is crucial to evaluate the effectiveness of conservation interventions, improve management strategies, and provide valuable data for decision makers. However, studies on quantitative evaluation of mangrove recovery through conservation and restoration are limited. To the best of our knowledge, this study is the first to use Sentinel-2 data, U-Net, and SVM algorithms to assess changes in mangrove area in two different blue forests projects.
In current research, the SVM machine learning and the U-Net deep learning algorithms were evaluated to classify closed-canopy, open-canopy mangroves, water, and other types of vegetation. In addition, a high accurate classification model was used to show changes in mangrove area in both conservation projects.
The results clearly demonstrated the superior performance of the U-Net convolutional neural network over traditional state-of-the-art SVM classifier at both study sites. It was observed that the U-Net model produced higher accuracy (>90%) in the classification of mangrove areas in Madagascar and Abu Dhabi. This study determined that SVM is also effective in extracting closed-canopy and open-canopy mangroves. These findings align with Singh et al. [56], who used SVM supervised classification model to distinguish mangrove forests and degraded mangroves from various vegetation classes in India based on Landsat data. The SVM classified image demonstrated the highest kappa accuracy (94.53%) for the 2000 image, with accuracies of 94.14% and 89.45% for the 2009 and 1991 images, respectively. Hati et al. [57] utilized Sentinel-2, images for mangrove classification and SVM model, achieving an overall accuracy of 79.81%. In another study, the combination of optical data and SAR revealed the highest overall accuracy (95%) for mangrove forest classification using the SVM model in the Dongzhai Port National Nature Reserve in China [40]. However, it is noteworthy that the SVM algorithm often faces challenges in accurately distinguishing mangrove forests from aquatic plants and water bodies. For example, Jiang et al. [11] reported that the RF algorithm achieved an overall accuracy of 95.89% with a kappa coefficient of 0.95, whereas the SVM recorded an overall accuracy of 95.35% with a kappa coefficient of 0.94. The SVM algorithm exhibited overfitting during the mangrove classification process, attributed to the significant similarity in spectral information. Consequently, previous studies have indicated that machine learning algorithms have yet to address the misclassification issue in mangrove forests classification.
Recently, the U-Net model has proved highly beneficial for tasks such as land use/land cover classification using satellite imagery, due to its inherent capacity for feature learning within its convolutional layers [27,28,30,32,58]. The unique architecture of U-Net, which uses the convolutional layers for feature learning, can reduce issues and increase the accuracy of multiple features extraction with small dataset [46]. Mapping mangrove species in Mai Po, Hong Kong using CNN, SVM, and RF revealed that CNN had the highest accuracy (82%) for classification when fine resolution optical images were used [59]. Fu et al. [36] conducted a comparison between the SVM and U-Net classification models spanning from 1991 to 2021. The results revealed overall accuracies of 93.11 ± 1.54% and 96.43 ± 1.15% for SVM and U-Net, respectively. In a related study, Wei et al. [33] demonstrated the superior performance of the U-Net model in mangrove classification, achieving an overall accuracy of 96.5% and F1-score of 91.5. In contrast, the RF model attained only 53.0% for overall accuracy and 31.4% for F1-score. Moreover, differentiating small-sized mangrove seedlings from other vegetation in reforestation areas posed a challenge. Therefore, the application of advanced deep learning techniques can enhance accuracy in identifying mangrove cover.
The outcomes of this study demonstrated the ability of Sentinel-2 images with a spatial resolution of 10 m in mangrove mapping. To achieve this, we employed the Google Earth Engine platform for the acquisition and pre-processing of Sentinel-2 images. Sentinel-2 is equipped with four red-edge bands that are sensitive to canopy moisture and chlorophyll concentration, and it has been found to possess superior capability compared to other optical data to detect mangroves [12,13,53]. GEE offers significant advantages in managing a vast volume of imagery with high spatial resolution, complemented by rapid processing capabilities [60]. GEE eliminates the need to download and process data on local stand-alone computers, thereby overcoming barriers associated with hardware limitations and technical expertise required for remote sensing [61]. In the image processing stage, GEE provides functions and algorithms for cloud detection and masking. This ability is crucial in mangrove classification, as cloud coverage can obstruct the observation of the land surface. GEE’s cloud masking features play an important role in ensuring that the analysis is conducted using high-quality, cloud-free imagery. Moreover, GEE has been applied as a powerful tool to address challenges related to the limited references samples, following to produce an automatic mangrove classification map using Sentinel-2 and machine learning algorithms [17]. However, it is crucial to emphasize that the current iteration of GEE platform lacks support for the application of deep learning models [14]. In this study, mangrove classification maps were exclusively generated using Sentinel-2 images. Nevertheless, it is recommended that future studies should consider integrating Sentinel-2 and SAR data available in GEE to enhance classification accuracy. This enhanced accuracy is attributed to the incorporation of various bands and spectral as well as physical characteristics of land covers. This finding aligns with the results of Hu et al. [9], who reported that Sentinel-2 (with an F1-Score of 0.89) outperforms Sentinel-1 SAR (with an F1-Score of 0.88) in mangrove extraction. Furthermore, the combination of Sentinel-2 and SAR imagery yields the highest accuracy (F1-Score of 0.94).
5.2. Remote Sensing Techniques for the Conservation and Restoration of Mangroves
The U-Net model was applied to assess changes in mangrove areas in the Bay of Assassins in southeast Madagascar and Abu Dhabi, the United Arab Emirates (UAE), using Sentinel-2 L1C imagery. Despite concerted efforts in mangrove conservation and restoration, the Tahiry Honko project in Madagascar experienced a notable decline in mangrove area, specifically 354.37 ha between 2015 and 2019. This observed reduction suggests a significant threat of deforestation driven anthropogenic activities and actions by community members.
The Tahiry Honko project aimed to build community resilience and mitigate carbon dioxide emission (approximately 1300 tons per year) by generating sustainable income through the sale of carbon credits. The revenue generated from the sale of carbon credits will benefit ten villages, comprising approximately 4000 residents across 895 households. The project aimed to engage all members of the community, including women and young people, through a participatory approach. Residents of these villages identified priority infrastructure projects to invest the funds in, including schools, wells, and health clinics. The project opted to support livelihood alternatives, such as sea cucumber farming, seaweed cultivation, and training in beekeeping techniques, thereby providing local residents with opportunities to increase household income and diversify sources of earnings [43].
Previous studies have highlighted the use of wood of mangrove trees as a building material for fences and houses and producing lime which has been an important factor of deforestation in the Bay of Assassins during the last decade [43,46,62]. Interestingly, the growth of pollution is perceived by the government as the contributor to mangrove destruction. Poverty is also identified as one of the main factors contributing to mangrove degradation in this area [63]. Despite accreditation from the Plan Vivo Standard in response to evidence of mangrove decline, monitoring revealed the Tahiry Honko project’s failure to meet replanting and conservation targets [64]. Rakotomahazo et al. [65] examined the implementation of PES schemes associated with the mangroves of the Bay of Assassins. Their findings showed challenges, such as clear legal frameworks, inadequate coordination between sectoral ministries, and the weakness of government organizations. These factors have contributed to lower motivation and collaboration among local communities in mangrove conservation efforts.
In contrast, there was a notable expansion of mangrove area in the Abu Dhabi project, with an increase of approximately 5857 ha observed from 2015 to 2020. These findings agree with the outcomes reported by Elmahdy et al. [37]. Their results indicated a growth of around 467.82 ha in both dense and dispersed mangroves during the period from 2010 to 2019. These positive changes can be attributed to plantation activities, as well as heightened public awareness and conservation efforts by local authorities over the last years. The UAE Ministry of Climate Change and Environment announced a national plan to plant 100 million mangroves by 2030 [44]. Rondon et al. [38] showed that mangrove cover in the UAE remain stable from 2020 to 2022 due to government conservation initiatives. Almahasheer [66] used Landsat imagery to depict the spatial coverage of mangroves in Umm AnNar, Khor Kalba, Mosaffah, and Khor Ra’s al-khaimah mangal before conservation efforts. In these regions, mangrove cover experiences losses attributed to urban development and tourism industry along the coastal shoreline of Abu Dhabi.
Similar positive trends were observed globally, with studies such as Wang et al. [67] showing a significant increase in mangrove area in China from 235.26 ha in 1990 to 873.27 ha in 2022, using Landsat data. Fan et al. [68] indicated the impact of the Chinese government in implemented mangrove restoration projects during 2000–2020 using Landsat data via GEE, contributing to the rise in mangrove area from 6655.87 ha to 14,607.93 ha in this region. The utilization of WorldView-2 imagery by Tinh et al. [69] revealed a growing trend in mangrove coverage along the Mekong Delta coast, escalating from 79,593 ha in 2015 to 90,777 ha in 2020, attributed to the planted mangrove species.
The Abu Dhabi Blue Carbon Demonstration Project aimed to preserve the Emirate’s environmental and cultural heritage with a focus on carbon sequestration in mangrove areas. The finding from the project have been integrated into various key reports and strategies, including Abu Dhabi’s National Biodiversity Strategies and Action Plans report, the Environmental Performance Index report, and Business Planning of the Environment Agency Abu Dhabi for climate change program. The protecting mangrove areas for this project was estimated at USD 50,000/ha [44].
The Abu Dhabi project is a research-driven initiative intended to explore options to include blue carbon ecosystems in national accounts and contribute to NDCs. It is publicly funded through government and international development finance. In 2022, the United Arab Emirates submitted its second NDC to the UNFCCC. Carbon sequestration through land use and forest was included, with the note that planting of 100 million mangrove seedlings by 2030 was intended with activities beginning after 2030. It is likely the Abu Dhabi blue carbon project will contribute to this. In contrast, the Tahiry Honko project in Madagascar operates within a voluntary carbon market framework, and its revenues are generated from the sale of carbon credit units to international buyers. As noted previously, this involves regular independent external verification of project outcomes (in 2022, 2027, 2032, and 2037). There are no documents available on the Plan Vivo website dated later than 2018, so it is unclear whether the 2022 verification has been conducted.
Despite these constraints, this study has made two key contributions. First, the study highlights the fact that blue forests projects have not yet established or demonstrated an evidence base for the effectiveness of conservation and restoration interventions in market mechanisms. While one of the two case studies assessed here demonstrated increased mangrove area following project activities, the other did not—and what appears to have been more successful is the publicly funded and government-stewarded initiative rather than the voluntary market project. This means that finance flows to blue forests projects may still not be achieving the intended outcomes in some cases. Second, the methodology developed and applied in this study provides further evidence for the value of remote sensing technologies in the carbon dynamics of ecosystem management.
This is a key challenge in reducing investment risk in blue forests initiatives. Climate change mitigation and adaptation are critical issues and nature-based solutions to climate challenges require technological innovations to reduce cost and improve clarity in monitoring and assessment. In combination with deep learning and machine learning approaches, rapidly evolving remote sensing technologies will allow far better modeling of carbon dynamics as well as biomass change. This is a necessary step in improving finance flows to projects that apply effective interventions and achieve genuine carbon sequestration outcomes.
However, the study faced limitations, including the limited availability of ground sampling data, which impacted classification model accuracy and mangrove change estimation. Moreover, for a more comprehensive evaluation of conservation efforts, it is advisable to analyze the long-term trends in mangrove areas both before and after conservation interventions. Establishing a baseline understanding of historical land use patterns provides the basis for effective conservation planning. This process aids in the identification of areas with high ecological value, areas under threat, and regions where human activities have led to significant changes in land cover.
6. Conclusions
This study assesses the outcome of GEF Blue Forests conservation and restoration initiatives in terms of mangrove area change over a four- and five-year period. To track the changes of the mangrove area in the Tahiry Honko project in Madagascar and the Abu Dhabi Blue Carbon Demonstration Project in the United Arab Emirates, Sentinel-2 Level 1C imagery from GEE platform was employed, along with SVM and U-Net algorithms. The SVM and U-Net models exhibited average accuracy of 86.1% and 91.26%, respectively, highlighting the superior classification performance of the U-Net deep learning model in mangrove extraction for both regions. Analysis of changes in mangrove areas revealed a decline of 354 ha in the Bay of Assassins in Madagascar due to human destruction. Conversely, the Abu Dhabi site showcased a notable increase in total mangrove area by 5857 ha, signaling success in protecting mangroves and natural recovery. The technological approaches applied in this study and the findings hold significant implications for both public policymakers and private sector investors. The mapping and monitoring of mangrove forests can provide crucial insights for decision-making-related conservation and management strategies, including REDD+ and market-based blue carbon initiatives.
Author Contributions
Conceptualization, R.F.; methodology, R.F., C.J.W., L.V. and K.K.; validation, R.F., C.J.W., L.V. and K.K.; formal analysis, R.F.; investigation, R.F.; data curation, R.F.; writing—original draft preparation, R.F.; writing—review and editing, R.F., C.J.W., L.V., K.K., S.T. and J.R.; supervision, C.J.W., L.V. and K.K.; project administration, R.F., C.J.W., L.V. and K.K. All authors have read and agreed to the published version of the manuscript.
Funding
This research received no external funding.
Data Availability Statement
The data will be available upon request to the corresponding author.
Acknowledgments
The authors would like to give special thanks to Blue Ventures conservation in Madagascar and Abu Dhabi Environmental Data Initiative for sharing free mangrove sampling data. Raheleh Farzanmanesh acknowledges the Melbourne Research Scholarship awarded by the University of Melbourne.
Conflicts of Interest
Sebastian Thomas is director of Blue Praxis Pty Ltd. The remaining authors declare that the research was conducted in the absence of any commercial or financial relationships that could be construed as a potential conflict of interest. Blue Praxis Pty Ltd. had no role in the design of the study; in the collection, analyses, or interpretation of data; in the writing of the manuscript, or in the decision to publish the results.
Appendix A
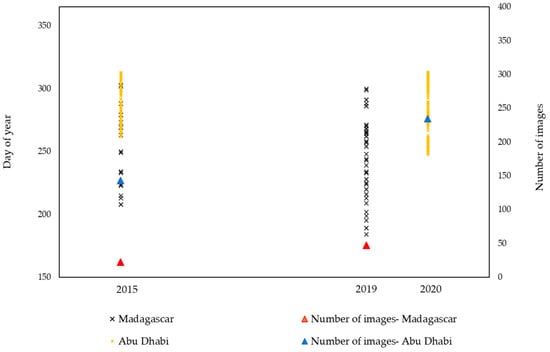
Figure A1.
Sentinel-2 remote sensing data used in this paper.
Figure A1.
Sentinel-2 remote sensing data used in this paper.
Appendix B
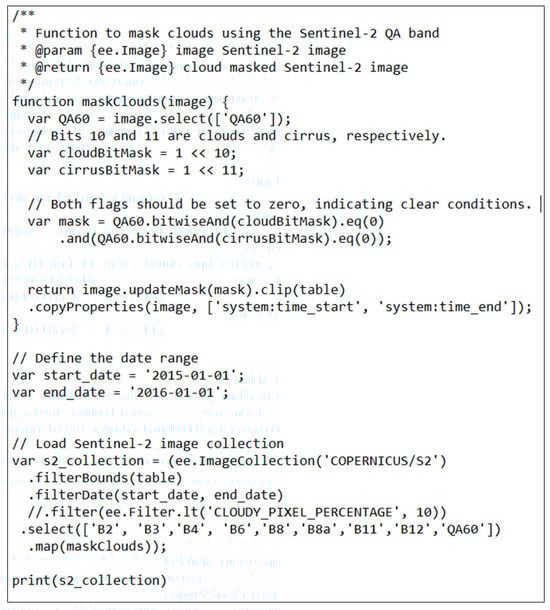
Figure A2.
Google Earth Engine code for Sentinel-2.
Figure A2.
Google Earth Engine code for Sentinel-2.
References
- Karimi, Z.; Abdi, E.; Deljouei, A.; Cislaghi, A.; Shirvany, A.; Schwarz, M.; Hales, T.C. Vegetation-induced soil stabilization in coastal area: An example from a natural mangrove forest. Catena 2022, 216, 106410. [Google Scholar] [CrossRef]
- Benzeev, R.; Hutchinson, N.; Friess, D.A. Quantifying fisheries ecosystem services of mangroves and tropical artificial urban shorelines. Hydrobiologia 2017, 803, 225–237. [Google Scholar] [CrossRef]
- Guntur, G.; Sambah, A.B.; Arisandi, D.M.; Jauhari, A.; Jaziri, A.A. Study on water quality around mangrove ecosystem for coastal rehabilitation. IOP Conf. Ser. Earth Environ. Sci. 2018, 106, 012041. [Google Scholar] [CrossRef]
- Ke, G.N.; Utama, I.; Wagner, T.; Sweetman, A.K.; Arshad, A.; Nath, T.K.; Neoh, J.Y.; Muchamad, L.S.; Suroso, D. Influence of mangrove forests on subjective and psychological wellbeing of coastal communities: Case studies in Malaysia and Indonesia. Front. Public Health 2022, 10, 898276. [Google Scholar] [CrossRef]
- Kauffman, J.B.; Adame, M.F.; Arifanti, V.B.; Schile-Beers, L.M.; Bernardino, A.F.; Bhomia, L.M.; Donato, D.C.; Feller, I.C.; Ferreira, T.O.; Jesus Garcia, M.C.; et al. Total ecosystem carbon stocks of mangroves across broad global environmental and physical gradients. Ecol. Monogr. 2020, 90, e01405. [Google Scholar] [CrossRef]
- Giri, C. Recent advancement in mangrove forests mapping and monitoring of the world using earth observation satellite data. Remote Sens. 2021, 13, 563. [Google Scholar] [CrossRef]
- Hamilton, S.E.; Friess, D.A. Global carbon stocks and potential emissions due to mangrove deforestation from 2000 to 2012. Nat. Clim. Chang. 2018, 8, 240–244. [Google Scholar] [CrossRef]
- Ellison, A.M.; Felson, A.J.; Friess, D.A. Mangrove rehabilitation and restoration as experimental adaptive management. Front. Mar. Sci. 2020, 7, 327. [Google Scholar] [CrossRef]
- Hu, L.; Xu, N.; Liang, J.; Li, Z.; Zhao, F. Advancing the mapping of mangrove forests at national-scale using Sentinel-1 and Sentinel-2 time-series data with Google Earth Engine: A case study in China. Remote Sens. 2020, 12, 3120. [Google Scholar] [CrossRef]
- Farzanmanesh, R.; Koshelham, K.; Thomas, S. Technological opportunities for measuring and monitoring blue carbon initiatives in mangrove ecosystems. Remote Sens. Appl. Soc. Environ. 2021, 24, 100612. [Google Scholar] [CrossRef]
- Jiang, Y.; Zhang, L.; Yan, M.; Qi, J.; Fu, T.; Fan, S.; Chen, B. High-resolution mangrove forests classification with machine learning using Worldview and UAV Hyperspectral data. Remote Sens. 2021, 13, 1529. [Google Scholar] [CrossRef]
- Wang, D.; Wan, B.; Qiu, P.; Tan, X.; Zhang, Q. Mapping mangrove species using combined UAV-LiDAR and Sentinel-2 data: Feature selection and point density effects. Adv. Space Res. 2022, 69, 1494–1512. [Google Scholar] [CrossRef]
- Chen, N. Mapping mangrove in Dongzhaigang, China using Sentinel-2 imagery. J. Appl. Remote Sens. 2020, 14, 014508. [Google Scholar] [CrossRef]
- Zhu, B.; Liao, J.; Shen, G. Combining time series and land cover data for analyzing spatio-temporal changes in mangrove forests: A case study of Qinglangang Nature Reserve, Hainan, China. Ecol. Indic. 2021, 131, 108135. [Google Scholar] [CrossRef]
- Toosi, B.; Soffianian, A.R.; Fakheran, S.; Waser, L.T. Mapping disturbance in mangrove ecosystems: Incorporating landscape metrics and PCA-based spatial analysis. Ecol. Indic. 2022, 136, 109818. [Google Scholar] [CrossRef]
- Zhao, C.P.; Qin, C.Z. A detailed mangrove map of China for 2019 derived from Sentinel-1and -2 images and Google Earth images. Geosci. Data J. 2022, 9, 74–88. [Google Scholar] [CrossRef]
- Ghorbanian, A.; Zaghian, S.; Asiyabi, R.M.; Amani, M.; Mohammadzadeh, A.; Jamali, S. Mangrove Ecosystem Mapping Using Sentinel-1 and Sentinel-2 Satellite Images and Random Forest Algorithm in Google Earth Engine. Remote Sens. 2021, 13, 2565. [Google Scholar] [CrossRef]
- Mondal, P.; Liu, X.; Fatoyinbo, T.M.; Lagomasino, D. Evaluating combinations of Sentinel-2 data and machine-learning algorithms for mangrove mapping in west Africa. Remote Sens. 2019, 11, 2928. [Google Scholar] [CrossRef]
- Liu, X.; Fatoyinbo, T.E.; Thomas, N.M.; Guan, W.W.; Zhan, Y.; Mondal, P.; Lagomasino, D.; Simard, M.; Trettin, C.C.; Deo, R.; et al. Large- scale high-resolution coastal mangrove forests mapping across west Africa with machine learning ensemble and satellite big data. Front. Earth Sci. 2021, 8, 560933. [Google Scholar] [CrossRef]
- Manna, S.; Raychaudhuri, B. Mapping distribution of Sundarban mangroves using Sentinel-2 data and new spectral metric for detecting their health condition. Geocarto Int. 2020, 35, 434–452. [Google Scholar] [CrossRef]
- Cherian, S.M.; Rajitha, K. Random forest and support vector machine classifiers for coastal wetland characterization using the combination of features derived from optical data and synthetic aperture radar dataset. J. Water Clim. Chang. 2024, 15, 29–49. [Google Scholar] [CrossRef]
- Ma, C.; Ai, B.; Zhao, J.; Xu, X.; Huang, W. Change detection of mangrove forests in coastal Guangdong during the past three decades based on remote sensing data. Remote Sens. 2019, 11, 921. [Google Scholar] [CrossRef]
- Purwanto, A.D.; Wikantika, K.; Deliar, A.; Darmawan, S. Decision Tree and Random Forest classification algorithms for mangrove forest mapping in Sembilang National Park, Indonesia. Remote Sens. 2023, 15, 16. [Google Scholar] [CrossRef]
- Maung, W.S.; Sasaki, J. Assessing the natural recovery of mangroves after human disturbance using neural network classification and Sentinel-2 imagery in Wunbaik mangrove forest, Myanmar. Remote Sens. 2021, 13, 52. [Google Scholar] [CrossRef]
- Ghorbanian, A.; Ahmadi, S.A.; Amani, M.; Mohammadzadeh, A.; Jamali, S. Application of artificial neural networks for mangrove mapping using multi-temporal and multi-source remote sensing imagery. Water 2022, 14, 244. [Google Scholar] [CrossRef]
- Murray, X.; Apan, A.; Deo, R.; Maraseni, T. Rapid assessment of mine rehabilitation areas with airborne LiDAR and deep learning: Bauxite strip mining in Queensland, Australia. Geocarto Int. 2022, 37, 11223–11252. [Google Scholar] [CrossRef]
- Altarez, R.D.D.; Apan, A.; Maraseni, T. Deep learning U-Net classification of Sentinel-1 and 2 fusions effectively demarcates tropical montane forest’s deforestation. Remote Sens. Appl. Soc. Environ. 2023, 29, 100887. [Google Scholar] [CrossRef]
- Faza, S.; Nababan, E.B.; Efendi, S.; Basyuni, M.; Rahmat, R.F. An initial study of deep learning for mangrove classification. IOP Conf. Ser. Mater. Sci. Eng. 2018, 420, 012093. [Google Scholar] [CrossRef]
- Wan, L.; Zhang, H.; Lin, G.; Lin, H. A small-patched convolutional neural network for mangrove mapping at species level using high-resolution remote-sensing image. Ann. GIS 2019, 25, 45–55. [Google Scholar] [CrossRef]
- Guo, M.; Yu, Z.; Xu, Y.; Huang, Y.; Li, C. ME-Net: A deep convolutional neural network for extracting mangrove using Sentinel-2A data. Remote Sens. 2021, 13, 1292. [Google Scholar] [CrossRef]
- Dang, K.B.; Nguyen, M.H.; Nguyen, D.A.; Phan, T.T.H.; Giang, T.L.; Pham, H.H.; Nguyen, T.N.; Tran, T.T.V.; Bui, D.T. Coastal wetland classification with deep U-Net convolutional networks and Sentinel-2 imagery: A case study at the Tien Yen Estuary of Vietnam. Remote Sens. 2020, 12, 3270. [Google Scholar] [CrossRef]
- Xu, C.; Wang, J.; Sang, Y.; Li, K.; Liu, J.; Yang, G. An effective deep learning model for monitoring mangroves: A case study of the Indus Delta. Remote Sens. 2023, 15, 2220. [Google Scholar] [CrossRef]
- Wei, Y.; Cheng, Y.; Yin, X.; Xu, Q.; Ke, J.; Li, X. Deep learning-based classification of high-resolution satellite images for mangrove mapping. Appl. Sci. 2023, 13, 8526. [Google Scholar] [CrossRef]
- Zhang, H.; Jiang, Z.; Zheng, G.; Yao, X. Semantic segmentation of high-resolution remote sensing images with improved U-Net based on transfer learning. Int. J. Comput. Intell. Syst. 2023, 16, 181. [Google Scholar] [CrossRef]
- Guo, Y.; Liao, J.; Shen, G. Mapping large-scale mangroves along the maritime silk road from 1990 to 2015 using a novel deep learning model and Landsat data. Remote Sens. 2021, 13, 245. [Google Scholar] [CrossRef]
- Fu, C.; Song, X.; Xie, Y.; Wang, C.; Luo, J.; Fang, Y.; Cao, B.; Qiu, Z. Research on the spatiotemporal evolution of mangrove forests in the Hainan Island from 1991 to 2021 based on SVM and Res-UNet algorithms. Remote Sens. 2022, 14, 5554. [Google Scholar] [CrossRef]
- Elmahdy, S.I.; Ali, T.A.; Mohamed, M.M.; Howari, F.M.; Abouleish, M.; Simonet, D. Spatiotemporal mapping and monitoring of mangrove forests changes from 1990 to 2019 in the Northern Emirates, UAE using random forest, Kernel Logistic Regression and Naive Bayes Tree Models. Front. Environ. Sci. 2020, 8, 102. [Google Scholar] [CrossRef]
- Rondon, M.; Ewane, E.B.; Abdullah, M.M.; Watt, M.S.; Blanton, A.; Abulibdeh, A.; Burt, J.A.; Rogers, K.; Ali, T.; Reef, R.; et al. Remote sensingbased assessment of mangrove ecosystems in the Gulf Cooperation Council countries: A systematic review. Front. Mar. Sci. 2023, 10, 1241928. [Google Scholar] [CrossRef]
- Jia, M.; Wang, Z.; Wang, C.; Mao, D.; Zhang, Y. A new vegetation index to detect periodically submerged mangrove forest using single-tide Sentinel-2 imagery. Remote Sens. 2019, 11, 2043. [Google Scholar] [CrossRef]
- Zhen, J.; Liao, J.; Shen, G. Mapping mangrove forests of Dongzhaigang nature reserve in China using Landsat 8 and Radarsat-2 Polarimetric SAR data. Sensors 2018, 18, 4012. [Google Scholar] [CrossRef]
- Gilani, H.; Iqra Naz, H.; Arshad, M.; Nazim, K.; Akram, U.; Abrar, A.; Asif, M. Evaluating mangrove conservation and sustainability through spatiotemporal (1990–2020) mangrove cover change analysis in Pakistan. Estuar. Coast. Shelf Sci. 2021, 249, 107128. [Google Scholar] [CrossRef]
- Maung, W.S.; Tsuyuki, S.; Guo, Z. Improving land use and land cover information of Wunbaik mangrove area in Myanmar using U-Net model with multisource remote sensing datasets. Remote Sens. 2024, 16, 76. [Google Scholar] [CrossRef]
- Blue Ventures. Tahiry Honko: Community Mangrove Carbon Project, Southwest Madagascar; Blue Ventures: Bristol, UK, 2023. [Google Scholar]
- AGEDI. Spatial Data Assessment. Abu Dhabi Blue Carbon Demonstration Project. UNEP WCMC/GRID-Arendal. 2023. Available online: https://agedi.org/item/abu-dhabi-blue-carbon-demonstration-project/ (accessed on 15 October 2023).
- Global Mangrove Watch. 2023. Available online: https://www.globalmangrovewatch.org/ (accessed on 20 March 2023).
- Jones, T.G.; Glass, L.; Gandhi, S.; Ravaoarinorotsihoarana, L.; Carro, A.; Benson, L.; Ratsimba, H.R.; Giri, C.; Randriamanatena, D.; Cripps, G. Madagascar’s mangroves: Quantifying nation-wide and ecosystem specific dynamics, and detailed contemporary mapping of distinct ecosystems. Remote Sens. 2016, 8, 106. [Google Scholar] [CrossRef]
- Sentinel-2-hub. 2023. Available online: https://docs.sentinel-hub.com/api/latest/data/sentinel-2-l1c/ (accessed on 20 March 2023).
- Rouse, J.W.; Haas, R.H.; Deering, D.W.; Schell, J.A. Monitoring the Vernal Advancement and Retrogradation (Green Wave Effect) of Natural Vegetation. In NASA/GSFC Type III Final Report; Remote Sensing Center, Texas A&M University: College Station, TX, USA, 1973. [Google Scholar]
- Fernandez-Manso, A.; Fernandez-Manso, O.; Carmen, Q. Sentinel-2A red-edge spectral indices suitability for discriminating burn severity. Int. J. Appl. Earth Obs. 2016, 50, 170–175. [Google Scholar] [CrossRef]
- Bradley, B. Remote detection of invasive plants: A review of spectral, textural and phenological approaches. Biol. Invasions 2013, 16, 1411–1425. [Google Scholar] [CrossRef]
- Huete, A.R. A Soil Adjusted Vegetation Index (SAVI). Remote Sens. Environ. 1988, 25, 295–309. [Google Scholar] [CrossRef]
- Liu, H.Q.; Huete, A.R. A feedback-based modification of the NDVI to minimize canopy background and atmospheric noise. IEEE Trans. Geosci. Remote Sens. 1995, 33, 457–465. [Google Scholar] [CrossRef]
- Baloloy, A.B.; Blanco, A.C.; Ana, R.R.S.; Nadaoka, K. Development and application of a new mangrove vegetation index (MVI) for rapid and accurate mangrove mapping. ISPRS J. Photogramm. 2020, 166, 95–117. [Google Scholar] [CrossRef]
- Diniz, C.; Cortinhas, L.; Nerino, G.; Rodrigues, J.; Sadeck, L.; Adami, M.; Souza-Filho, P.W.M. Brazilian mangrove status: Three decades of satellite data analysis. Remote Sens. 2019, 11, 808. [Google Scholar] [CrossRef]
- Ronneberger, O.; Fischer, P.; Brox, T. U-net: Convolutional networks for biomedical image segmentation. In Proceedings of the 18th International Conference on Medical Image Computing and Computer-Assisted Intervention, Munich, Germany, 5–9 October 2015; Springer: Berlin/Heidelberg, Germany, 2015; pp. 234–241. [Google Scholar]
- Singh, S.K.; Srivastava, P.K.; Gupta, M.; Thakur, J.K.; Mukherjee, S. Appraisal of land use/land cover of mangrove forest ecosystem using support vector machine. Environ. Earth Sci. 2014, 71, 2245–2255. [Google Scholar] [CrossRef]
- Hati, J.P.; Samanta, S.; Chaube, N.R.; Misra, A.; Giri, S.; Pramanick, N.; Gupta, K.; Majumdar, S.D.; Chanda, A.; Mukhopadhyay, A.; et al. Mangrove classification using airborne hyperspectral AVIRIS-NG and comparing with other spaceborne hyperspectral and multispectral data. Egypt. J. Remote Sens. Space Sci. 2021, 24, 273–281. [Google Scholar]
- Solórzano, J.V.; Mas, J.F.; Gao, Y.; Gallardo-Cruz, J.A. Land use land cover classification with u-net: Advantages of combining Sentinel-1 and Sentinel-2 imagery. Remote Sens. 2021, 13, 3600. [Google Scholar] [CrossRef]
- Li, Q.; Wong, F.K.K.; Fung, T. Mapping multi-layered mangroves from multispectral, hyperspectral, and LiDAR data. Remote Sens. Environ. 2021, 258, 112403. [Google Scholar] [CrossRef]
- Amani, M.; Ghorbanian, A.; Ahmadi, S.A.; Kakooei, M.; Moghimi, A.; Mirmazloumi, S.M.; Moghaddam, S.H.A.; Mahdavi, S.; Ghahremanloo, M.; Parsian, S.; et al. Google Earth Engine cloud computing platform for remote sensing big data applications: A comprehensive review. IEEE J. Sel. Top. Appl. Earth Obs. Remote Sens. 2020, 13, 5326–5350. [Google Scholar] [CrossRef]
- Yancho, J.M.M.; Jones, T.G.; Gandhi, S.R.; Ferster, C.; Lin, A.; Glass, L. The Google Earth Engine mangrove mapping methodology (GEEMMM). Remote Sens. 2020, 12, 3758. [Google Scholar] [CrossRef]
- Scales, I.R.; Friess, D.A. Patterns of mangrove forest disturbance and biomass removal due to small-scale harvesting in southwestern Madagascar. Wetl. Ecol. Manag. 2019, 27, 609–625. [Google Scholar] [CrossRef]
- Scales, I.R.; Friess, D.A.; Glass, L.; Ravaoarinorotsihoarana, L. Rural livelihoods and mangrove degradation in south-west Madagascar: Lime production as an emerging threat. Oryx 2018, 52, 641–645. [Google Scholar] [CrossRef]
- Rabemananjara, Z.H.; Rakotosoa, A.; Ratosovon, A.A.N. Assessment of Socio-Economic Role of Mangroves and Their Conservation Framework in Madagascar. Technical Report Profiling the Socioeconomic Role of Mangroves. “BMZ-MG204200 Save Our Mangroves Now. 69/CTR-S/FY21/TNR, June 2021, 94p. Published by: WWF, IUCN and Wetlands International. Germany. Available online: www.mangrovealliance.org/save-our-mangroves-now (accessed on 13 October 2022).
- Rakotomahazo, C.; Ranivoarivelo, N.L.; Razanoelisoa, J.; Todinanahary, G.G.; Ranaivoson, E.; Remanevy, M.E.; Ravaoarinorotsihoarana, L.A.; Lavitra, T. Exploring the policy and institutional context of a Payment for Ecosystem Services (PES) scheme for mangroves in southwestern Madagascar. Mar. Policy 2023, 148, 105450. [Google Scholar] [CrossRef]
- Almahasheer, H. Spatial coverage of mangrove communities in the Arabian Gulf. Environ. Monit. Assess. 2018, 190, 85. [Google Scholar] [CrossRef] [PubMed]
- Wang, Y.; Wang, X.; Khan, S.; Zhou, D.; Ke, Y. Evaluation of mangrove restoration effectiveness using remote sensing indices-a case study in Guangxi Shankou Mangrove National Natural Reserve. China. Front. Mar. Sci. 2023, 10, 1280373. [Google Scholar] [CrossRef]
- Fan, C.; Hou, X.; Zhang, Y.; Li, D. Satellite Data Reveal Concerns Regarding Mangrove Restoration Efforts in Southern China. Remote Sens. 2023, 15, 4151. [Google Scholar] [CrossRef]
- Tinh, P.H.; MacKenzie, R.A.; Hung, T.D.; Vinh, T.V.; Ha, H.T.; Lam, M.H.; Hanh, N.T.H.; Tung, N.X.; Hai, P.M.; Huyen, B.T. Mangrove restoration in Vietnamese Mekong Delta during 2015-2020: Achievements and challenges. Front. Mar. Sci. 2022, 9, 1043943. [Google Scholar] [CrossRef]


Disclaimer/Publisher’s Note: The statements, opinions and data contained in all publications are solely those of the individual author(s) and contributor(s) and not of MDPI and/or the editor(s). MDPI and/or the editor(s) disclaim responsibility for any injury to people or property resulting from any ideas, methods, instructions or products referred to in the content. |
© 2024 by the authors. Licensee MDPI, Basel, Switzerland. This article is an open access article distributed under the terms and conditions of the Creative Commons Attribution (CC BY) license (https://creativecommons.org/licenses/by/4.0/).