Abstract
Understory topography serves as a crucial data source, playing an instrumental role in numerous forest ecosystem applications. However, the use of synthetic aperture radar interferometry and optical stereo for the acquisition of ASTER (Advanced Spaceborne Thermal Emission and Reflection Radiometer), SRTM (Shuttle Radar Topography Mission), and GLO-30 (Copernicus Digital Elevation Model) DEM presents unique challenges, particularly in forested environments. These challenges are primarily due to limitations in penetration capability and the effects of foreshortening. ICESat-2/ATLAS, with its higher spatial sampling rate and strong penetrability, presents a new opportunity for estimating forest height parameters and understory terrain. We assessed the vertical accuracy of ASTER, SRTM, GLO-30, and ATLAS in the forest study areas of the United States compared to the reference dataset DTM provided by G-LiHT and we will further discuss the influence of different ground altitudes, forest types, slopes, and aspects on vertical accuracy. The study reveals that in a forested environment, ICESat-2 ATL03 exhibits the highest accuracy at the footprint scale, with a correlation coefficient (R2) close to 1 and Root Mean Square Error (RMSE) = 1.96 m. SRTM exhibits the highest accuracy at the regional scale, with an R2 close to 0.99, RMSE = 11.09 m. A significant decrease in accuracy was observed with increasing slope, especially for slopes above 15°. With a sudden increase in altitude, such as in mountainous situations, the accuracy of vertical estimation will significantly decrease. Aspect and forest cover indeed influence the accuracy of the four DEM products, but this influence lacks a clear pattern. Our results show that ICESat-2 and SRTM data might show sufficient and stable vertical accuracy in a forested environment.
1. Introduction
The forest ecosystem, a cornerstone of terrestrial ecosystems, is pivotal in regional and global carbon cycling. Precise estimation of understory topography is essential for measuring forest structural parameters, while the spatial distribution of forest structural parameters is crucial for monitoring changes in the forest ecosystem [1,2]. A variety of remote sensing data and Digital Elevation Model (DEM) products have demonstrated significant potential in accurately capturing understory topography [3]. In recent years, a diverse array of global or near-global DEM products has become publicly accessible at no cost. These include frequently utilized elevation data such as SRTM (Shuttle Radar Topography Mission) DEM, ASTER (Advanced Spaceborne Thermal Emission and Reflection Radiometer) DEM, and GLO-30 (Copernicus Digital Elevation Model). Despite the availability of these DEM products providing multiple methods to evaluate forest canopy height, the inability of short-wavelength Synthetic Aperture Radar (SAR) or optical satellite sensors to penetrate the vegetation canopy negatively affects the vertical accuracy of the products [4]. This constraint has become a limiting factor for accurate predictions of understory topography and canopy height. Therefore, it is necessary to systematically evaluate various DEM products and analyze their elevation accuracy under different understory topographies to select the most suitable DEM product.
DEM is the most commonly used foundational data for representing digital landform morphology [5], including Digital Terrain Models (DTM) and Digital Surface Models (DSM). DEMs find wide applications across various fields such as topographic mapping [6], land management [7], geology [8], hydrology [9], forestry [10], urban planning, design, and management [11]. Common methods for acquiring DEMs include SAR technology [12], stereo image matching techniques [13], and interpolation methods [14]. Different DEM products, such as AW3D30 (ALOS World 3D) DEM, SRTM DEM, and TanDEM-X DEM, employ various acquisition technologies. For example, AW3D30 DEM and ASTER DEM utilize stereophotogrammetry, while SRTM DEM and TanDEM-X DEM are generated using Interferometric Synthetic Aperture Radar (InSAR) technology. However, due to differences in imaging configurations and SAR data processing methods, these DEM products exhibit certain levels of error. Particularly in forested environments, dense vegetation and tree cover make accurate surface modeling more challenging [15]. In past studies, Moradas et al. [16] used GNSS receiver measurements as a reference to comparatively analyze the elevation accuracy of ASTER GDEM2, SRTM3, AW3D30, and TanDEM-X. The calculated results showed Root Mean Squared Error (RMSE) values of 6.91 m, 5.11 m, 6.25 m, and 1.67 m for these four DEMs, respectively. These findings indicate that ASTER exhibited lower accuracy, especially in areas with high forest cover. On the other hand, Li et al. [17] found a global-scale discrepancy of 3.6 m in SRTM DEM, with most of the error attributed to the wavelength of SRTM that prevented penetration through forest canopies to reach the ground, consequently leading to lower accuracy in forested areas. However, GNSS data only provide point-like validation data, making it challenging to use for global-scale data validation work.
Hubacek et al. [18] employed geodetic methods to validate the accuracy of the digital terrain model of the 4th generation (DMR 4G) and DMR 5G obtained through Czech aerial laser scanning. This validation approach requires a significant investment of time and human resources. Conducting field measurements in large-scale forested or remote areas may incur high costs, and the necessary time and expenses could limit the scale and depth of the research. Additionally, in certain regions, the complex terrain might make accurate measurements challenging using traditional surveying tools. Therefore, current research tends to utilize spaceborne LiDAR data as a reference to assess the vertical accuracy of DEM data. This approach allows for obtaining terrain data at a higher resolution while covering extensive geographic areas, thus addressing limitations associated with traditional methods. In comparison to traditional field measurements, the use of spaceborne LiDAR data proves to be more cost-effective, especially in research involving large-scale, remote, or complex terrain, providing a more viable option for scientific investigations. For instance, Mahesh et al. [19] used ICESat (Ice, Cloud, and land Elevation Satellite)/GLAS (Geoscience Laser Altimeter System) data to evaluate the vertical accuracy of AW3D30 v3, SRTM DEM V3, and ASTER GDEM V2 under different coastal geomorphic conditions. The calculated results indicated that AW3D30 had a root mean square error (RMSE) of 2.48 m, SRTM DEM V3 had an RMSE of 3.02 m, and ASTER GDEM V2 had an RMSE of 8.02 m. This suggests that AW3D30 is most suitable for representing terrain elevations. Bhardwaj Ashutosh et al. [20] analyzed the data accuracy of ALOS and TanDEM-X DEMs under different rugged terrain conditions, with TanDEM-X having an RMSE of 17.4 m and ALOS (PALSAR RTC HR DEM) having an RMSE of 13.88 m. This indicates that in terms of penetration capability and resolution, ALOS DEM outperforms TanDEM-X 90 DEM. Similarly, Liu et al. [4] used spaceborne LiDAR data to evaluate the quality of SRTM-1 DEM, SRTM-3 DEM, ASTER GDEM2, AW3D30 DEM, and TanDEM relative to different terrain morphological features (elevation, slope, and aspect) and land cover types. The results showed that SRTM-1 DEM had the best quality, with an RMSE of 8.0 m, while ASTER GDEM2 had the poorest quality, with an RMSE of 10.1 m. These evaluations, based on spaceborne LiDAR data, provide a comprehensive analysis. Due to its open-source nature and global coverage, it serves as an exemplary tool for validating DEM data in forested environments.
Compared to using spaceborne LiDAR data, employing airborne LiDAR (LiDAR) to assess DEM accuracy provides more comprehensive regional data and facilitates spatial distribution error analysis. For example, Vassilaki et al. [21] used airborne LiDAR data to validate that TanDEM-X DEM has a clear advantage in the global DEM series under various latitudes, terrain types, and land cover conditions. Specific results indicate that the RMSE range for TanDEM-X DEM is between 1.0 and 8.7 m, AW3D30’s RMSE range is between 2.6 and 49.0 m, ASTER’s RMSE range is between 8.3 and 80.2 m, while SRTM (v001) and SRTM (v003) have RMSE ranges of 3.0–8.7 m and 7.3–20.5 m. Le et al. [22], using airborne LiDAR-generated DEM and DSM as a reference, evaluated the vertical accuracy of ASTER, AW3D30, SRTM, and TanDEM-X 90m as DEM and DSM. Experimental results found that regarding DEM use, the MERIT product had a mean error (ME) of 2.82 m, the SRTM product had an ME of 4.74 m, while the TanDEM-X product had the poorest accuracy, with an ME value of 10.39 m. In terms of DSM use, the TanDEM-X product had an ME of −3.69 m, and the AW3D30 product showed relatively higher accuracy with an ME of −5.34 m. The spatial distribution of errors is influenced by land cover types, with errors being more severe in forested areas compared to residential areas. In summary, using airborne LiDAR data as a validation basis enables a more comprehensive exploration of the accuracy performance of various DEM products in different situations. In comparison to using spaceborne LiDAR data, this method offers greater advantages. However, due to the cost and operational range limitations of airborne LiDAR data in forested areas, research on assessing terrain accuracy beneath forest canopies remains relatively limited. With the provision of high-precision forest area DEM data by ICESat-2/ATLAS, the comparison and analysis of understory topography accuracy has garnered widespread academic interest.
In 2018, ICESat-2/ATLAS was launched, introducing the use of photon-counting technology with a micro-pulse multi-beam laser altimeter system. This new-generation system, known as Advanced Topographic Laser Altimeter System (ATLAS), employs single-photon, multi-beam laser profiling, marking and locating each photon individually with time stamps [23,24]. ICESat-2/ATLAS rapidly and accurately acquires three-dimensional photon cloud data of the Earth’s surface. It can even partially penetrate vegetation to obtain three-dimensional laser ground footprints, granting ICESat-2 higher resolution and precision in exploring understory topography elevation [25,26]. Research found that the ICESat-2 data display its ability to estimate forested elevation data. For instance, Zhu et al. [27] selected study areas like HARV, SCBI, SJER, and the Duke Forest SoAP site. They used airborne LiDAR DTM data to validate ground elevation accuracy. Experimental results indicated that ICESat-2 data exhibited high accuracy during both day and night conditions, with an average R2 of 1 and average RMSE ranging from 3.04 to 4.57 m. The study further compared terrain slope estimates from ICESat-2 to those from SRTM and GDEM models, showing ICESat-2’s superiority in terrain slope estimation. Xing and Huang et al. [28] utilized G-LiHT (Goddard’s LiDAR, Hyperspectral, and Thermal) airborne data to verify terrain data in a forested area within Aiken, South Carolina, USA. This study also affirmed the exceptionally accurate performance of ICESat-2’s elevation data across various laser pointing angles and intensity types. Collectively, these studies lead to the conclusion that ICESat-2 data yield highly accurate understory topography in forested regions. This technology provides a novel means to study global forest ecosystems and offers robust support for analyzing surface elevation and terrain characteristics. Although there are currently spaceborne LiDAR data using the waveform-based (GEDI) and photon-based (ATLAS) systems, previous studies [29] have shown that ATLAS data have an advantage over GEDI in estimating understory terrain, while GEDI data have an advantage in estimating forest structural parameters. Despite the discrete nature of spaceborne LiDAR data, which differs from grid-based DEM, few existing studies comprehensively analyze and evaluate ATLAS and open-source DEM products. These studies are crucial for estimating the accuracy of ground in understory environments, a key factor in subsequent forest ecosystem research.
ICESat-2/ATLAS, ASTER, SRTM, and GLO-30 can be obtained for free and represent different data production methods (LiDAR, SAR, and stereophotogrammetry). Therefore, we chose ICESat-2/ATLAS, ASTER, SRTM, and GLO-30 data as our study data. This paper aims to assess the accuracy of ICESat-2/ATLAS data with used DEM datasets (ASTER, SRTM, and GLO-30) in estimating understory terrain, providing robust data support for forestry applications. The following summarizes the main contributions of this study. (1) For the first time, the accuracy of spaceborne LiDAR data and open-accessed DEM as a whole was evaluated in estimating understory terrain. This evaluation utilized airborne LiDAR, which demonstrated higher precision. (2) The paper will focus on the ability of data in the form of LiDAR footprint and regional scale to estimate understory topography. (3) This study will investigate the effects of ground altitude, slope, aspect, and forest cover type on the estimation of vertical accuracy. This yielded insights into the strengths and weaknesses of different products, offering recommendations for the applicability of these DEM products in specific applications. This holds significant importance for further understory topography analysis and selection of suitable applications.
2. Study Material
2.1. Study Area
The Aiken study area in South Carolina, USA is located between 33.56° N and 33.78° N latitude, and 81.69° W and 81.73° W longitude. Aiken County is situated in southwestern South Carolina and has a subtropical moist climate. The vegetation types in the research area include forest (95.9%), wetland (3.8%), and artificial surfaces (0.2%) (see Figure 1). The landforms in the research area are predominantly low hills, with gentle slopes in the forested areas. Elevations range from 111 m to 154 m.
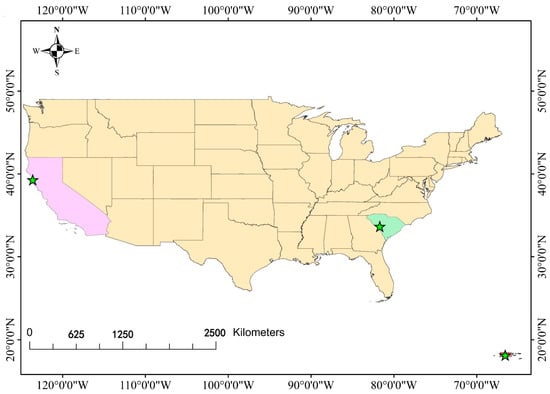
Figure 1.
Location of three study areas in the USA (The pentagram marks the specific location of the study area).
The Mendocino County study area in California, USA is located between 38.95° N and 39.65° N latitude, and 123.54° W and 123.66° W longitude. Mendocino County is situated in western California and has a Mediterranean climate. The vegetation types in the research area include forest (98.6%) and grassland (1.3%). The landforms in the research area are primarily hilly, with slopes in the forested areas. The elevations range from 84 m to 653 m.
The Puerto Rico study area is located between 17.97° N and 18.34° N latitude, and 66.31° W and 66.83° W longitude. The research area is situated in the southwestern part of Puerto Rico and has a tropical marine climate. The landforms in the research area consist of hills and mountains, with slopes in the forested areas. Elevations range from 0 m to 744 m.
Understory terrain primarily consists of relatively gentle slopes, steep hillsides, deep valleys, and high-altitude areas. Additionally, different regions may have varying types of vegetation, ranging from coniferous forests to broadleaf forests, directly impacting the characteristics of the understory terrain. The three study areas exhibit significant differences in geographical location, climate, forest cover types, terrain, and altitude ranges, essentially encompassing a wide range of understory terrain situations. These study areas possess unique features in terms of terrain, weather conditions, and forest cover types, which can result in different effects on the acquisition and analysis of terrain elevation data.
2.2. Study Data
ICESat-2/ATLAS, ASTER, SRTM, and GLO-30 can be obtained for free and represent different data production methods. This study aims to utilize three types of data. By employing airborne data with centimeter-level accuracy (G-LiHT DTM) as validation data, the research aims to evaluate the accuracy of understory terrain height estimation from ICESat-2/ATLAS ATL03 products, and three common and free DEM datasets (ASTER DEM, SRTM DEM, and GLO-30 DEM). The performance will be assessed under different ground altitudes, slopes, and aspects. Additionally, the study plans to analyze the impact of various forest cover types on the measurement height errors using forest cover data. Table 1 shows the data to be used in the study.

Table 1.
Basic parameters of the study data.
2.2.1. ICESat-2/ATLAS Data Product
The satellite data from ICESat-2/ATLAS are provided to the public in the conventional HDF5 data structure format by the U.S. National Snow and Ice Data Center. The data include metadata, ancillary data, 6-track positioning data, orbit data, quality assessment information, and more. The data are categorized into four levels: 0, 1, 2, and 3. Level 0 contains raw telemetry data and is not publicly available. The satellite provides a total of 21 data products, numbered from ATL00 to ATL21 (excluding ATL05). Among these, the data products relevant to understory Digital Elevation Models are ATL03 and ATL08, both of which are widely used in this experiment. ATL03 (Global Geolocated Photon Data) is an ICESat-2 L2-level data product, providing time, latitude, longitude, confidence level, and ellipsoid height for each photon event received from the satellite’s downlink [30]. ATL08 (Land and Vegetation Height) data is an ICESat-2 L3A data product, recording photon classifications as well as estimated terrain and canopy heights along 100-m segments of the ground track.
ATL03 is a Global Geolocated Photon Data product that provides information for five different surface types (land, ocean, sea ice, inland water, and land ice). It uses a “confidence” parameter to distinguish between noise points and raw photon points and applies noise filtering algorithms to filter noise points [27]. The data include the time (T) when each photon event occurs, as well as the longitude (Lon), latitude (Lat), and Earth surface elevation (EL) in the WGS84 coordinate system. They also provide rough differentiation between potential signal and background events, along with other parameters useful for advanced processing [31]. The photon’s longitude, latitude, elevation, and other information are recorded within the ATL03/gtx/heights group according to this index.
ATL08 (Land and Vegetation Height) data is an ICESat-2 Level 3A data product that records photon classification and estimates of terrain height and canopy height along 100-m segments of the ground track [32]. It utilizes the Differential, Regressive, and Gaussian Adaptive Nearest Neighbor (DRAGANN) method for noise filtering the ATL03 data. Simultaneously, it employs NASA’s official classification algorithm to classify photon clouds, categorizing them into canopy top photons, canopy photons, ground photons, and noise photons [33]. The photon classification status is represented by the parameter class_pc_flag. In ATL08 data, the photon classification information is stored according to the 20 m segments from the ATL03 file.
In this study, we utilized the elevation data provided by the strong beams of ATL03 and ATL08 from ICESat-2/ATLAS as the DEM data, comparing them with three other DEM products. ATL03 and ATL08 can be downloaded from https://search.earthdata.nasa.gov/search/free, accessed on 15 March 2023.
2.2.2. ASTER GDEM
The ASTER DEM is a data product that utilizes optical stereo photogrammetry to acquire global elevation data. This model is based on the advanced spaceborne thermal emission and reflection radiometer sensor, which was launched aboard the Terra satellite by NASA in 1999. The Earth’s surface is then divided into 1° × 1° tiles to create the GDEM [34]. It used the WGS84 reference ellipsoid and is based on the EGM96 geoid. These data cover all land areas between 83° N and 83° S, accounting for 99% of the Earth’s land surface. The latest version of ASTER GDEM is ASTER GDEM v3, jointly released by NASA on 5 August 2019. ASTER GDEM v3 builds upon GDEM v2 by incorporating an additional 360,000 pairs of optical stereo images to reduce elevation voids and improve water body elevation accuracy. This version shows significant improvements in terms of effective coverage and altitude accuracy. The version used in this study is the latest one, ASTER GDEM V003, which can be freely downloaded from (https://search.earthdata.nasa.gov/search/, accessed on 15 March 2023) along with experimental data.
2.2.3. SRTM DEM
The Shuttle Radar Topography Mission (SRTM) is an international project carried out through a collaboration between NASA and the National Geospatial-Intelligence Agency (NGA). The mission took place aboard the Space Shuttle Endeavour from 11–22 February 2000. Using two Interferometric Synthetic Aperture Radar sensors, namely the C-band radar system (SIR-C) and the X-band radar system (X-SAR), the mission aimed to generate high-resolution elevation data for nearly the entire global land surface [35,36]. The SRTM data were designed to achieve a horizontal accuracy of 20 m and a vertical accuracy of 16 m. The horizontal reference used is the WGS84 ellipsoid, based on the EGM96 geoid reference. The V4.1 version has benefited from various processing and interpolation techniques to enhance data accuracy and quality. The research utilized the SRTM1 data with a resolution of 30 m. The experimental data can be freely downloaded from https://dwtkns.com/srtm30m/, accessed on 15 March 2023.
2.2.4. GLO-30 DEM
The Copernicus DEM (GLO-30 DEM) is a type of DEM used to represent the Earth’s surface, including features such as buildings, infrastructure, and vegetation. The Copernicus DEM offers three different instances: EEA-10, GLO-30, and GLO-90. The GL0-30 is a global DEM that is based on radar satellite data acquired by the TanDEM-X mission between 2011 and 2015 [37]. For this study, the GLO-30 dataset was chosen due to previous research indicating its highest accuracy and lowest pixel noise among global 30 m DEM. The experimental data can be freely downloaded from https://earthengine.google.com/, accessed on 15 March 2023.
2.2.5. G-LiHT Data
G-LiHT (Goddard’s LiDAR, Hyperspectral, and Thermal Imager) is a relatively cost-effective and highly rugged portable airborne imaging system equipped with a VQ-480 miniaturized LiDAR for providing vertical and horizontal distribution information of tree canopies. G-LiHT can emit discrete laser pulses and it provides 1 m spatial resolution data products including Canopy Height Models (CHM), DTM, point clouds, and hyperspectral images [38]. These data products are used for measuring forest understory terrain and canopy height. The G-LiHT official provides a set of algorithms for processing raw data. This algorithm employs a grid-based Delaunay triangulation morphological filter that creates an irregular Triangulated Irregular Network (TIN) using the lowest elevation points (ground echoes). The TIN is then interpolated to generate a Digital Terrain Model by adjusting grid sizes in proportion to flight altitude, laser repetition rate, surface roughness, and reflectance to ensure sufficient point cloud coverage within each grid.
Despite the acquisition time of G-LiHT data being different from the ASTER, SRTM, GLO-30, and ATLAS data used in this experiment, there have been no geological disasters in the terrain of the research area over the past 20 years. The focus of the study on the accuracy of the terrain under the canopy makes the time difference irrelevant. Consequently, this study employs 1 m resolution DTM products generated using the official algorithm from data collected over three study areas as validation data. The relevant data can be freely downloaded from the G-LiHT official website (https://glihtdata.gsfc.nasa.gov).
2.2.6. Forest Cover Data
Since the GLC_FCS30-2020 data can provide reference data for different forest cover types, in order to explore the accuracy of different DEM data in estimating the understory terrain under different forest cover types, the study chose to use GLC_FCS30-2020 data as the reference data. The GLC_FCS30-2020 product is projected in the GCS_WGC_1984 coordinate system, with a spatial resolution of 30 m and a temporal cycle of 5 years [39]. It provides global 30 m fine surface cover dynamic monitoring results from 1985 to 2020, covering a total of seven time periods (1985, 1990, 1995, 2000, 2005, 2010, 2015, and 2020). This dataset encompasses ten distinct forest cover types, including tropical rainforest, herbaceous cover, woody or shrub cover (orchards), open evergreen broadleaf forest, closed evergreen broadleaf forest, open deciduous broadleaf forest, closed deciduous broadleaf forest, open evergreen needleleaf forest, closed deciduous needleleaf forest, open deciduous needleleaf forest, closed deciduous needleleaf forest, open mixed forest, and closed mixed forest. These data are available for free download at https://doi.org/10.5281/zenodo.3986871, accessed on 25 March 2023.
3. Methods
The technical route in this paper can be summarized into three main components, as illustrated in Figure 2. The first part involves processing ICESat-2/ATLAS data by removing a significant portion of low-precision data points to enhance overall accuracy. The second part utilizes G-LiHT DTM data as validation, comparing ICESat-2/ATLAS ATL03 with three other DEM products (ASTER DEM, SRTM DEM, and the GLO-30 DEM) as understory terrain data, assessing differences and similarities among datasets. The third part conducts a detailed analysis of factors such as slope, aspect, and forest cover types, examining their influence on the performance of the four elevation datasets as understory topography products. In summary, the technical approach encompasses data processing, comparative analysis using G-LiHT DTM, and a detailed assessment of the impact of terrain features on the accuracy of elevation datasets. These three components constitute the core of the research methodology presented in the paper.
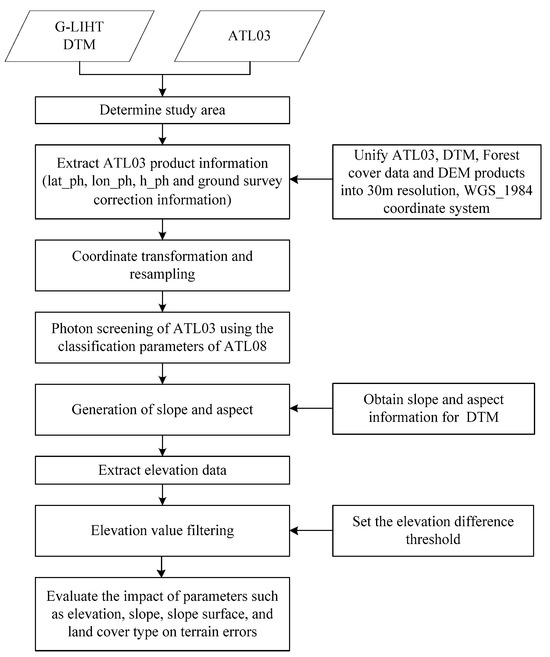
Figure 2.
Technical route.
- Study Area Selection
The study area was defined by selecting the overlapping region between the satellite orbits of ICESat-2/ATLAS ATL03 data and DTM data provided by G-LiHT. Table 2 lists the filenames of the ATLAS and G-LiHT data used in the study.
Table 2.
ATLAS and G-LiHT data file names.
- 2.
- Extraction of ATL03 Product Information
The data used in this paper consist of NASA’s official ATL03 and ATL08 data, with ATL08 data containing numerous descriptive parameters (e.g., surface roughness, slope, canopy height, and coverage). Therefore, in this experiment, ATL08 data are used to provide corresponding label data for ATL03 data. Using PhoREAL v3.30 software, the data are associated by extracting the relevant segments. The “segment_id” field from the ATL03 strong beam is matched with the “ph_segment_id” field in the ATL08 strong beam, resulting in the starting photon index for this set, referred to as “ph_index_beg”. The relative photon indices (“classed_pc_indx”) within the group are added to the starting photon index, resulting in the photon data transmit time index found in the ATL03 file, denoted as the photon data transmit time index [28]. This process enables the extraction of various ATL03 data products, including latitude (“lat_ph”), longitude (“lon_ph”), elevation (“h_ph”), and ground correction information (“geoid”).
- 3.
- Coordinate Transformation and Resampling
In this experiment, the reference DTM data provided by the G-LiHT airborne system are based on the UTM Zone 12N projection coordinate system for the horizontal datum and the NAVD88 system for the vertical datum, with a spatial resolution of 1 m. The ATL03 data have a horizontal datum of GCS_WGS_1984 and a vertical datum of EGM96, with a spatial resolution of 17 m. The other three DEM products have a spatial resolution of 30 m each. The SRTM and ASTER products share the same horizontal datum of GCS_WGS_1984 and vertical datum of EGM96, while the GLO-30 product has a horizontal reference datum of WGS84 and a vertical reference datum of EGM2008. Therefore, prior to conducting the experiment, all elevation data need to be uniformly adjusted to have a horizontal datum of GCS_WGS_1984 and a vertical datum of EGM96 using ArcGIS 10.8 software. Additionally, the spatial resolution of all data should be resampled to 30 m for consistency.
- 4.
- Ground Photon Selection
In the study, we chose to use GLC_FCS30-2020 data to ensure that study data were under forest environments. Due to the composition of three pairs of laser beams emitted by ATLAS with a strong-to-weak energy ratio of 4:1, the precision of ground photon capture is higher for the strong beams than for the weak beams [40]. As a result, this experiment matched the elevation data from the strong beams of ATL03 with the corresponding data from ASTER, SRTM, and GLO-30. In forested areas, the LiDAR data are distributed irregularly in three-dimensional space, comprising both ground points and vegetation points. To obtain an accurate DTM, this study filters the ground photons from the ATL03 photon cloud data based on the classification parameter “Classed_pc_flag” from ATL08. The values of “Classed_pc_flag” can be 0, 1, 2, or 3, corresponding to noise photons, ground photons, canopy photons, and canopy top photons, respectively. For this research, “Classed_pc_flag=1” (ground photons) and “Signal_Con=4” from ATL03 are selected to represent ground photons within the forest understory vegetation.
- 5.
- Generation of Slope and Aspect
ArcGIS software is employed to calculate the slope and aspect of the processed DTM along with the G-LiHT DTM. This leads to the creation of corresponding slope and aspect maps.
- 6.
- Extraction of Elevation Data
The basic attributes of DTM, ATL03, and the ASTER DEM, SRTM DEM, and GLO-30 DEM products have been unified using ArcGIS software. At this stage, the “Extract Multi Values to Points” function provided by ArcGIS is utilized to extract the corresponding elevation values for each product from their respective positions along the ground track.
- 7.
- Setting Elevation Difference Threshold
The elevation difference threshold is typically set based on the accuracy of the reference DEM. In this experiment, the threshold for elevation differences was set according to the accuracy of the DTM. Generally, the elevation difference threshold is set to twice the RMSE (Root Mean Square Error) value, and in areas with complex terrain, it can be set to 1.5–2 times the RMSE value. Therefore, in forested areas, the elevation difference thresholds are typically set at 20 m (approximately twice the RMSE value). Interpolation between “dem_h” and “Height_1” was calculated and data points with elevation differences that exceeded the threshold were removed as total error. Among them, “Height_1” proposed the most consistent terrain elevation provided by ATL03 with good accuracy, which can be used as the topographic elevation value representing the understory topography. The dem_h is the reference terrain height in ATL08 data. The difference between the two partly reflects the accuracy of the data points, and this step helps to eliminate most of the low-precision data points, improve the accuracy of understory topography data, and increase the reliability of subsequent experiments. A total of 790 data were involved in the evaluation.
- 8.
- Evaluation of the Impact of Elevation, Slope, Aspect, and Land Cover Types on Topographic Errors
In this study, G-LiHT DTM data are utilized as the reference dataset to assess the elevation accuracy of different DEM datasets. Multiple methods are employed to compare and analyze accuracy, evaluating their performance under varying slopes, aspects, and land cover conditions. The evaluation is based on metrics such as mean error (ME) [28], root mean square error (RMSE) [28], standard deviation (STD) [4], and Correlation coefficient (R2) [28]. These evaluation metrics will help determine the performance of different DEM datasets under various conditions, offering a comprehensive assessment of their elevation accuracy. The following formulas are used for calculation:
In the equation, “zi” represents the DTM surface elevation provided by G-LIHT, “hi” represents the actual elevation value of the different DEM data (ATLAS, ASTER, SRTM, and GLO-30), “n” represents the quantity of study data points, and represents the average value of different DEM data.
4. Results and Discussion
4.1. Overall Evaluation of the Elevation Accuracy
The G-LiHT data in the study were acquired and are not temporally coincident with ASTER v003, SRTM v003, GLO-30, and ATLAS data. However, the study mainly focuses on the accuracy of estimating understory terrain using various DEM products. Through reviewing data from different study areas, the authors did not find any significant changes in understory terrain and did not show differences over time. Table 3 shows the statistical indicators for different study areas, and Table 4 shows the overall accuracy evaluation indicators for all the study areas.
Table 3.
Accuracy evaluation indicators for different study areas.
Table 4.
Overall accuracy evaluation indicators of the study area.
According to the results in Table 3, it can be observed that ICEsat-2 ATL03 exhibits the highest correlation with DTM data, and the differences in errors for it as an under-canopy DEM are relatively small across various study areas. In the Aiken study area, ASTER data perform the worst, with ME, RMSE, and STD of 7.95 m, 8.13 m, and 2.51 m, respectively. In the California study area, GLO-30 data show the largest ME and RMSE, at 17.33 m and 18.57 m, while ASTER data have the highest STD of 7.74 m. In the Puerto Rico study area, ASTER data have the largest ME and RMSE, 18.62 m and 20.28 m and SRTM data have the highest STD of 10.53 m. Across different study areas, the accuracy of the four products varies to some extent, with ICEsat-2 ATL03 data exhibiting the most stability, while the other three products are more influenced by different terrain and landform conditions. Consequently, future research should comprehensively analyze the performance of the four DEM data under different conditions to explore the reasons for the fluctuations in DEM products.
When using G-LiHT’s DTM as the reference truth, the error statistics for the four DEM products in the study area are presented in Table 4. In reference to the DTM, ATL03 data show the highest correlation, with the smallest absolute value of ME and the lowest RMSE and STD. The correlation between ASTER data and the DTM is 0.99, with an ME error of 3.76 m, and the highest STD error of 12.94 m, slightly surpassing ATL03. SRTM data’s correlation with the DTM is also 0.99, with an ME of 5.01 m and an RMSE of 11.09 m. Its STD error value is lower than ATL03 but higher than the other two DEM products, at 9.90 m. Similar to ASTER and SRTM, the correlation between GLO-30 and DTM is 0.99. However, GLO-30 has the largest ME and RMSE errors, and an STD error of 11.76 m, lower only than ASTER. This indicates that in forested areas, the accuracy of SRTM is slightly better than ASTER. This contrasts with the findings of Purinton et al. [37], who previously found that ASTER product accuracy is superior to SRTM. This difference could be attributed to Purinton et al.’s study being conducted in the arid and steep central Andes Mountains, where there is almost no vegetation on bare surfaces, while the current study focuses on forested areas. Furthermore, the conclusions of this study align with those of Gao et al. [41] and Zhu et al. [27], indicating that within vegetation-covered areas, the accuracy of SRTM exceeds that of ASTER. However, this experiment concluded that GLO-30 performs worse than ASTER in forested-covered areas and demonstrates that the DEM data provided by ATL03 in the form of footprints have an absolute advantage over gridded DEM data.
Figure 3 illustrates the frequency histograms of height differences between the four open DEM products and the DTM when using DTM as the reference truth. From Figure 3, it is evident that the error distributions of these DEM products approximate a normal distribution, but with varying shapes or peak positions. This implies that they exhibit certain errors in responding to surface object elevations. Among these error distributions, ATL03 data have the smallest error values, indicating that spaceborne LiDAR performs superiorly in capturing elevation in vegetated areas, yielding DEMs with higher accuracy compared to traditional methods. The other three DEM products all display a noticeable overestimation trend. This could be attributed to the time gap between the data acquisition of these products and G-LiHT data, which might have been affected by vegetation growth and changes on the Earth’s surface, consequently influencing the analysis results.
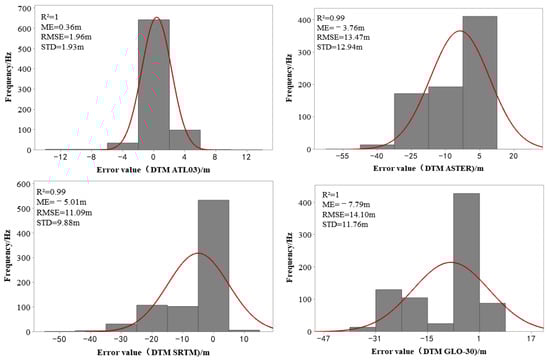
Figure 3.
Histogram of the error distribution of the four DEM species (The red line represents the error curve).
Furthermore, Figure 3 also demonstrates a relationship between the concentration of error distribution and accuracy. A more concentrated error distribution suggests smaller errors and higher accuracy of the DEM product. We speculate that the differences in error curve shapes and peak positions among these DEM products might be related to the elevation and surface vegetation cover types of the study area. To delve deeper into this matter, this study will further analyze the precision differences of DEM products under different ground altitudes and forest cover types. This will aid in gaining a better understanding of the performance of different DEM products under forest environment conditions and provide a foundation for subsequent related forest research.
4.2. Influence of Ground Altitude on DEM Errors
To analyze the relationship between ground altitude and DEM errors, and due to the limited availability of study data, the DEM errors are categorized into three elevation ranges: 0–150 m, 150–300 m, and >300 m. Figure 4 displays the ME, RMSE, and STD values of different DEM products within these elevation ranges.
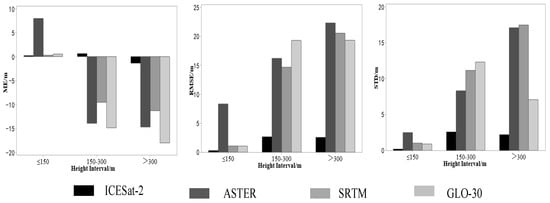
Figure 4.
ME, RMSE, and STD error values for four DEM products in different elevation ranges.
As shown in Figure 4, with the increase in terrain elevation, the absolute values of ME, RMSE, and STD for the four DEM products exhibit an upward trend. During this process, different DEM products show some variations in performance. For the ATL03 product, the increase in errors is minimal with the rise in terrain elevation, indicating a relatively stable accuracy of ATL03 at high elevations. The ASTER product performs relatively well in the lower elevation range (0–150 m), but errors significantly increase with higher terrain elevation. In the elevation range of 0–150 m and above 300 m, ASTER shows the highest values in all error metrics, indicating lower accuracy in providing understory elevation data. The SRTM product performs well in the elevation range of 0–150 m. However, as terrain elevation increases, SRTM’s error values rise rapidly. In the elevation range of 150–300 m, SRTM performs slightly better than ASTER and GLO-30, and in elevations above 300 m, SRTM’s performance is only better than ASTER. The accuracy of GLO-30 is similar to SRTM in the elevation range of 0–150 m, but errors increase significantly in the 150–300 m range, resulting in the lowest accuracy. However, in elevations above 300 m, GLO-30’s error values do not show a significant increase.
The results indicate that the accuracy of DEM products is influenced by the elevation of the terrain. The observed phenomenon may be attributed to limitations in optical photogrammetric measurements and short-wavelength SAR (such as X-band and C-band) measurements at high elevations, making it challenging to obtain precise ground elevation [4]. This leads to an increase in errors across various DEM products. The relative stability of ATL03 at high elevations is attributed to its LiDAR-based measurements, which prove advantageous in forest-covered areas. Considering the sudden change in ground elevation, we found that this elevation change is more concentrated in sudden changes such as mountains or hills, based on the location of the data. With a sudden increase in altitude, such as in mountainous situations, the accuracy of vertical estimation will significantly decrease. These findings provide a crucial foundation for subsequent research related to forest terrain.
4.3. DEM Precision under Different Forest Covers
This study utilizes the GLC_FCS30-2020 product as a reference for the forest cover data. Based on the distribution of G-LiHT reference data within the selected study area, three vegetation cover types were identified: closed evergreen needleleaf forest, closed evergreen broadleaf forest, and closed mixed forest. Figure 5 presents the ME, RMSE, and STD error values for four sets of DEM data under different forest types.
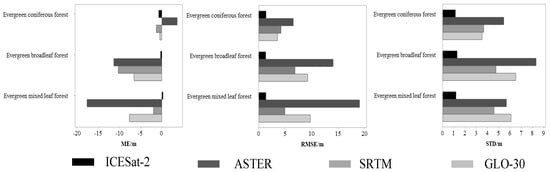
Figure 5.
ME, RMSE, and STD error values for 4 DEM products in a range of different surface cover types.
As shown in Figure 5, it is evident that different forest types have varying degrees of impact on the accuracy of each DEM product. For ATL03, different forest types have a relatively minor impact on its accuracy, with minimal variations in ME, RMSE and STD errors. This indicates that ATL03 is less sensitive to vegetation effects, and its accuracy is almost unaffected by forest types. In contrast, the ASTER product shows significant differences in performance among different vegetation cover types. Its accuracy is slightly better in closed evergreen needleleaf forests compared to closed evergreen broadleaf forests and closed mixed forests. Additionally, ASTER’s error values in each forest cover area are higher than the other three products, with average ME, RMSE and STD of −13.08 m, 13.21 m, and 6.47 m. The errors of SRTM show relatively small variations among different forest types, but its accuracy varies across different forest cover areas. The precision is highest in closed evergreen needleleaf forests and lowest in closed evergreen broadleaf forests, with average ME, RMSE, and STD of −4.52 m, 5.33 m, and 4.32 m, respectively. The performance of GLO-30 is also influenced by different forest cover types. It exhibits accuracy second only to ATL03 in closed evergreen needleleaf forests, but noticeable variations in errors occur in closed evergreen broadleaf forests and closed mixed forests, with fluctuations more pronounced than SRTM. GLO-30’s average ME, RMSE, and STD errors are −4.91 m, 7.53 m, and 5.37 m, respectively. A comprehensive analysis of various evaluation indicators shows that SRTM outperforms ASTER and GLO-30 but falls short of ATL03. Moreover, it is evident from Figure 5 that as the surface vegetation structure changes, the accuracy of the four DEM products is better in closed evergreen needleleaf forests than in closed evergreen broadleaf forests, while the accuracy in closed mixed forests falls in between. This difference may be attributed to the smaller leaf area of needleleaf forests, resulting in a lesser impact on DEM products.
In summary, different forest types have varying effects on the accuracy of various DEM products, leading to variations in DEM accuracy. Among these products, ATL03 demonstrates higher stability across different forest types, while SRTM is the least influenced by forest types among the selected raster DEMs. These differences primarily arise from the ICEsat-2/ATLAS sensor’s vertical downward approach in receiving returned photons, enhancing its spatial resolution and measurement accuracy [35]. In contrast, sensors carried by ASTER, SRTM, and GLO-30 measure electrons or electromagnetic waves, which are unable to penetrate vegetation and structures entirely to reach the ground. This results in varying degrees of elevation bias in the obtained height values. These research findings underscore the impact of different forest types on DEM accuracy and provide valuable guidance for future in-depth studies.
4.4. Precision of the DEM at Different Slopes
This study further quantitatively analyzed the variation of elevation errors with slope by resampling and categorizing the slope of the study area into four categories: (0°, 6°], (6°, 15°], (15°, 25°], and >25°. To provide a more intuitive representation of the accuracy of DEM data under different slope levels, trends of the absolute values of ME errors, RMSE errors, and STD errors of the four DEM products are plotted against slope variation, as shown in Figure 6.
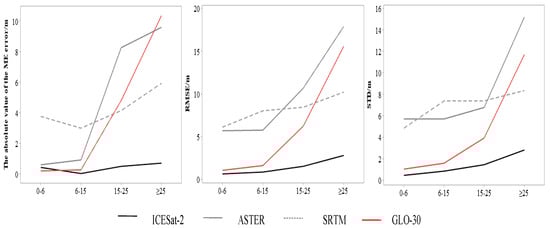
Figure 6.
Effect of slope on the accuracy of DEM data.
As shown in Figure 6, different DEM products exhibit varying sensitivity to slope. ATL03 achieves the highest accuracy in different slope intervals, and its precision is minimally affected by changes in slope. This indicates that ATL03 maintains stable accuracy across various slope conditions. ASTER’s accuracy is significantly influenced by slope, especially in steep slope areas (>15°), where the error curve shows a noticeable increase. SRTM maintains relatively consistent accuracy across different slope levels, with minimal variations in precision even in larger slope areas, suggesting stability in high slope conditions. GLO-30 performs well in gentle slope areas but experiences a sharp decline in accuracy in steep slope regions, lacking stability. The phenomena can be attributed to the fact that slope may introduce geometric distortions in optical and SAR image processing [35], affecting the extraction of true elevation. With increasing slope, the terrain becomes more complex, posing challenges for optical photogrammetric and SAR technologies in accurately measuring ground elevation. Additionally, steep slope areas typically have denser vegetation cover, making it more challenging to obtain accurate understory DEM through optical photogrammetry and short-wavelength SAR. The findings of this study align with those of Neuenschwander et al. [42], who found that ICESat-2 data exhibit smaller average differences and RMSE values in flat areas with minimal elevation changes due to geographic mislocation, but these values significantly increase in steep terrain. Similar to the observations by Osama et al. [43], who noted that after removing height uncertainties in observations, slope has a minor impact on ATL08 data but significantly affects DEM data from ASTER, SRTM, and TanDEM.
In summary, this experiment not only confirms the limited impact of slope on ATL03 within forested areas but also suggests that GLO-30 may be more suitable for gentle slope regions, while SRTM may be better suited for obtaining understory DEM in larger area coverage with a slope of >6°.
4.5. Precision of DEMs at Different Aspects
To analyze the accuracy of DEM data under different aspects, the DEM-derived aspects were divided into eight categories: (337.5°, 22.5°], (22.5°, 67.5°], (67.5°, 112.5°], (112.5°, 157.5°], (157.5°, 202.5°], (202.5°, 247.5°], (247.5°, 292.5°], and (292.5°, 337.5°]. By referring to Figure 7, one can visually observe the performance of the four DEM data sets under different aspects.
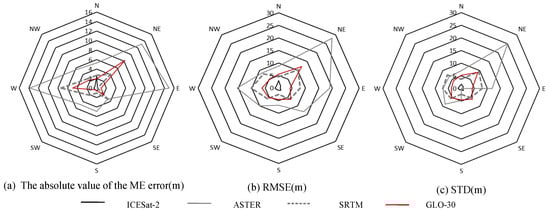
Figure 7.
Effect of aspects on the accuracy of different DEMs.
Based on the analysis of Figure 7, it can be observed that different aspects have a certain impact on the accuracy of various DEM products. The accuracy of ATL03 is least affected by aspect, showing minimal variations in errors, with average ME, RMSE, and STD of 0.67 m, 1.26 m, and 1.00 m, respectively, with the largest error occurring in the northern aspect. In contrast, ASTER’s accuracy is significantly influenced by the slope aspect, with average ME, RMSE, and STD of 8.23 m, 13.77 m, and 10.49 m, particularly pronounced in the east–west direction. SRTM and GLO-30 also exhibit changes in accuracy under different slope aspects. SRTM has average ME, RMSE, and STD of 2.95 m, 6.96 m, and 10.49 m, respectively, while GLO-30 has average ME, RMSE, and STD of 2.69 m, 6.15 m, and 5.28 m, respectively. Although GLO-30’s average errors are slightly lower than SRTM, SRTM’s accuracy is less affected by the slope aspect, indicating greater stability.
Based on the above analysis, it can be observed that the accuracy of various DEMs is influenced by the slope aspect, with ATL03 being the least affected, ASTER being the most severely affected, and SRTM and GLO-30 experiencing some degree of impact. The potential influence of the slope aspect on elevation accuracy may be attributed to the orientation of satellite sensors in ascending and descending orbits, as well as the angles of incidence in radar measurements [41]. Consequently, the accuracy of DEM products varies across different slope aspects. However, this study has not identified a specific pattern in the variation of DEM accuracy under the influence of slope aspect. Future research could enhance its findings by incorporating additional research data and expanding the study area to further analyze the impact of the slope aspect on DEMs.
4.6. Limitations of Our Study
One of the limitations of our study was that it only used three common global DEM products. Several studies have attempted to assess the accuracy of global DEMs’ different performances in forested terrain. Based on our study and previous research, ASTER, SRTM, and GLO-30 would be more promising and they cover common data sources and processing methods. Our results show that currently, the most accurate evaluating indicator freely available DEM is SRTM. However, new higher-quality commercial products may have shown higher elevation accuracy. In our future work, we will continue to pay attention to continuously updated data products and explore their ability to estimate understory terrain.
5. Conclusions
This study selected high-precision G-LiHT DTM data as the reference dataset and utilized metrics such as ME, RMSE, STD, and R2 to assess the accuracy of four DEM datasets: ICESat-2 ATL03, ASTER, SRTM, and GLO-30. Additionally, this research investigated the error distribution patterns of these four DEM datasets under various slopes, aspects, and forest cover types. The following conclusions were drawn:
- ICESat-2 ATL03 exhibits the highest accuracy in forest-covered regions. Its correlation coefficient (R2) with the reference DTM is closest to 1, with RMSE of 1.96 m and STD of 1.93 m. SRTM exhibits the highest accuracy at the regional scale, with an R2 close to 0.99, RMSE = 11.09 m, indicating higher accuracy compared to ASTER and GLO-30 products.
- The quality of the DEM products is related to the ground altitude. The accuracy of the four DEM products decreases with increasing sudden increases in altitude, such as in mountainous situations.
- The quality of DEM products is significantly affected by the slope factor. The accuracy of DEM products decreases with increasing slope, especially for slopes greater than 15°.
- Aspect and forest cover indeed influence the accuracy of the four DEM products, but this influence lacks a clear pattern.
The ICESat-2 holds a distinct advantage in estimating forested terrain. Based on the experimental results, it is recommended that SRTM products be used for future scale studies in forested areas. The conclusions drawn from this study can serve as a valuable reference for the selection of DEM products in similar research involving land cover types and topographic variability in the future.
Author Contributions
J.H. and Y.Y., Methodology; Y.Y., formal analysis; J.H., investigation; J.H., resources; Y.Y., data curation; Y.Y., writing—original draft preparation; J.H., writing—review and editing. All authors have read and agreed to the published version of the manuscript.
Funding
This work was supported by the National Natural Science Foundation of China (Grant No. 42071351), the National Key Research and Development Program of China (Grant Nos. 2020YFA0608501 and 2017YFB0504204), the Liaoning Revitalization Talents Program (Grant No. XLYC1802027), the Talend recruited program of the Chinese Academy of Science (Grant No. Y938091), the Project Supported Discipline Innovation Team of the Liaoning Technical University (Grant No. LNTU20TD-23), the Liaoning Province Doctoral Research Initiation Fund Program (2023-BS-202), and the Basic Research Projects of Liaoning Department of Education (JYTQN2023202).
Data Availability Statement
Publicly available datasets were analyzed in this study. This data can be found here: [https://search.earthdata.nasa.gov/search/free or https://earthengine.google.com/] (accessed on 25 March 2023).
Acknowledgments
Many thanks to NASA and GEE for providing free datasets.
Conflicts of Interest
The authors declare no conflicts of interest.
References
- Lang, N.; Kalischek, N.; Armston, J.; Schindler, K.; Dubayah, R.; Wegner, J.D. Global canopy height regression and uncertainty estimation from GEDI LIDAR waveforms with deep ensembles. Remote Sens. Environ. 2022, 268, 112760. [Google Scholar] [CrossRef]
- Dubayah, R.; Blair, J.B.; Goetz, S.; Fatoyinbo, L.; Hansen, M.; Healey, S.; Hofton, M.; Hurtt, G.; Kellner, J.; Luthcke, S.; et al. The Global Ecosystem Dynamics Investigation: High-resolution laser ranging of the Earth’s forests and topography. Sci. Remote Sens. 2020, 1, 100002. [Google Scholar] [CrossRef]
- He, L.; Pang, Y.; Zhang, Z.; Liang, X.; Chen, B. ICESat-2 data classification and estimation of terrain height and canopy height. Int. J. Appl. Earth Obs. Geoinf. 2023, 118, 103233. [Google Scholar] [CrossRef]
- Liu, Z.; Zhu, J.; Fu, H.; Zhou, C.; Zuo, T. Evaluation of the Vertical Accuracy of Open Global DEMs over Steep Terrain Regions Using ICESat Data: A Case Study over Hunan Province, China. Sensors 2020, 20, 4865. [Google Scholar] [CrossRef]
- Yao, C.; Li, Z.J.; Zhang, K.; Huang, Y.C.; Wang, J.F.; Bastola, S. Evaluating performance dependency of a geomorphologic instantaneous unit hydrograph-based hydrological model on DEM resolution. Water Sci. Eng. 2022, 15, 179–188. [Google Scholar] [CrossRef]
- Li, W.; Li, D.; Fang, Z.N. Intercomparison of Automated Near-Real-Time Flood Mapping Algorithms Using Satellite Data and DEM-Based Methods: A Case Study of 2022 Madagascar Flood. Hydrology 2023, 10, 17. [Google Scholar] [CrossRef]
- Bernatek-Jakiel, A.; Jakiel, M. Identification of soil piping-related depressions using an airborne LiDAR DEM: Role of land use changes. Geomorphology 2021, 378, 107591. [Google Scholar] [CrossRef]
- Ye, Y.; Li, C.; Zeng, Y.; Tang, H. 3D DEM simulations of the variability of rock mechanical behaviour based on random rock microcracks. Int. J. Rock Mech. Min. Sci. 2023, 167, 105395. [Google Scholar] [CrossRef]
- Gunawardhana, N.L.; Al-rawas, A.G.; Baawain, S.M. Spatial regression approach to estimate synthetic unit hydrograph by geomorphic characteristics of watersheds in arid regions. J. Arid. Land 2020, 12, 950–963. [Google Scholar] [CrossRef]
- Waśniewski, A.; Hościło Agata, Z.B.; Moukétou, T.D. Assessment of Sentinel-2 Satellite Images and Random Forest Classifier for Rainforest Mapping in Gabon. Forests 2020, 11, 941. [Google Scholar] [CrossRef]
- Zeraatpisheh, M.; Ayoubi, S.; Sulieman, M.; Rodrigo-Comino, J. Determining the spatial distribution of soil properties using the environmental covariates and multivariate statistical analysis: A case study in semi-arid regions of Iran. J. Arid. Land 2019, 11, 551–566. [Google Scholar] [CrossRef]
- Pandit, A.; Ramsankaran, R.A.A.J.; Rao, Y.S. Generation and Validation of the Interferometric SAR DEMs from TanDEM-X data for Gangotri and Hamtah Glaciers of Indian Himalayas. Procedia Technol. 2014, 16, 793–805. [Google Scholar] [CrossRef][Green Version]
- Hao, X.; Zhang, H.; Wang, Y.; Wang, J. A framework for high-precision DEM reconstruction based on the radargrammetry technique. Remote Sens. Lett. 2019, 10, 1123–1131. [Google Scholar] [CrossRef]
- Liu, Z.; Xu, B.; Cheng, B.; Hu, X. Interpolation Parameters in Inverse Distance-Weighted Interpolation Algorithm on DEM Interpolation Error. J. Sens. 2021, 2021, 1–14. [Google Scholar] [CrossRef]
- Zarco-Tejada, P.J.; Diaz-Varela, R.; Angileri, V.; Loudjani, P. Tree height quantification using very high resolution imagery acquired from an unmanned aerial vehicle (UAV) and automatic 3D photoreconstruction methods. Eur. J. Agron. 2014, 55, 89–99. [Google Scholar] [CrossRef]
- del Rosario González-Moradas, M.; Viveen, W. Evaluation of ASTER GDEM2, SRTMv3.0, ALOS AW3D30and TanDEM-X DEMs for the Peruvian Andes against highly accurate GNSS ground control points and geomorphological-hydrological metrics. Remote Sens. Environ. 2020, 237, 111509. [Google Scholar] [CrossRef]
- Li, Y.; Fu, H.; Zhu, J.; Wu, K.; Yang, P.; Wang, L.; Gao, S. A Method for SRTM DEM Elevation Error Correction in Forested Areas Using ICESat-2 Data and Vegetation Classification Data. Remote Sens. 2022, 14, 3380. [Google Scholar] [CrossRef]
- Hubacek, M.; Brenova, M.; Ceplova, L. Verification of accuracy of the new generation elevation models. Adv. Mil. Technol. 2014, 9, 21–32. [Google Scholar]
- Mahesh, R.; Sarunjith, K.J.; Rajakumari, S.; Muruganandam, R.; Ramesh, R. Quality assessment of open sourced digital elevation models in southeast coast of India. Egypt. J. Remote Sens. Space Sci. 2021, 24, 745–754. [Google Scholar] [CrossRef]
- Bhardwaj, A. Investigating the Terrain Complexity from ATL06 ICESat-2 Data for Terrain Elevation and Its Use for Assessment of Openly Accessible InSAR Based DEMs in Parts of Himalaya’s. Eng. Proc. 2021, 10, 65. [Google Scholar]
- Vassilaki, D.; Stamos, A. Tan DEM-X DEM: Comparative performance review employing LIDAR data and DSMs. ISPRS J. Photogramm. Remote Sens. 2020, 160, 33–50. [Google Scholar] [CrossRef]
- Qiujia, L.; Jing, L.; Xinyun, C. Accuracy evaluation of open DEM products based on airborne LiDAR data. J. Wuhan Univ. (Inf. Sci. Ed.) 2022, 1–16. [Google Scholar] [CrossRef]
- Shan, J.; Tian, X.; Li, S.; Li, R. Progress in high technology of satellite-borne laser measurement. J. Surv. Mapp. 2022, 51, 964–982. [Google Scholar]
- Neuenschwander, A.L.; Magruder, L.A. The Potential Impact of Vertical Sampling Uncertainty on ICESat-2/ATLAS Terrain and Canopy Height Retrievals for Multiple Ecosystems. Remote Sens. 2016, 8, 1039. [Google Scholar] [CrossRef]
- Ranndal, H.; Sigaard Christiansen, P.; Kliving, P.; Baltazar Andersen, O.; Nielsen, K. Evaluation of a Statistical Approach for Extracting Shallow Water Bathymetry Signals from ICESat-2 ATL03 Photon Data. Remote Sens. 2021, 13, 3548. [Google Scholar] [CrossRef]
- Herzfeld, U.C.; Lawson, M.; Trantow, T.; Nylen, T. Airborne Validation of ICESat-2 ATLAS Data over Crevassed Surfaces and Other Complex Glacial Environments: Results from Experiments of Laser Altimeter and Kinematic GPS Data Collection from a Helicopter over a Surging Arctic Glacier (Negribreen, Svalbard). Remote Sens. 2022, 14, 1185. [Google Scholar] [CrossRef]
- Zhu, X.; Sheng, N.; Cheng, W.; Xiaohuan, X.; Dong, L.; Guoyuan, L.; Pu, W.; Di, C.; Xuebo, Y. Estimating Terrain Slope from ICESat-2 Data in Forest Environments. Remote Sens. 2020, 12, 3300. [Google Scholar] [CrossRef]
- Xing, Y.; Huang, J.; Gruen, A.; Qin, L. Assessing the Performance of ICESat-2/ATLAS Multi-Channel Photon Data for Estimating Ground Topography in Forested Terrain. Remote Sens. 2020, 12, 2084. [Google Scholar] [CrossRef]
- Liu, A.; Cheng, X.; Chen, Z. Performance evaluation of GEDI and ICESat-2 laser altimeter data for terrain and canopy height retrievals. Remote Sens. Environ. 2021, 264, 112571. [Google Scholar] [CrossRef]
- Lao, J.; Wang, C.; Zhu, X.; Xi, X.; Nie, S.; Wang, J.; Cheng, F.; Zhou, G. Retrieving building height in urban areas using ICESat-2 photon-counting LiDAR data. Int. J. Appl. Earth Obs. Geoinf. 2021, 104, 102596. [Google Scholar] [CrossRef]
- Markus, T.; Neumann, T.; Martino, A.; Abdalati, W.; Brunt, K.; Csatho, B.; Farrell, S.; Fricker, H.; Gardner, A.; Harding, D.; et al. The Ice, Cloud, and land Elevation Satellite-2 (ICESat-2): Science requirements, concept, and implementation. Remote Sens. Environ. 2017, 190, 260–273. [Google Scholar] [CrossRef]
- Neumann, T.; Brenner, A.; Hancock, D.; Robbins, J.; Saba, J.; Harbeck, K.; Gibbons, A.; Lee, J.; Luthcke, S.; Rebold, T. ICE, CLOUD, and Land Elevation Satellite-2 (ICESat-2) Project Algorithm Theoretical Basis Document (ATBD) for Global Geolocated Photons ATL03 (Version 4). 2021. Available online: https://icesat-2.gsfc.nasa.gov/sites/default/files/page_files/ICESat2_ATL02_ATBD_r003.pdf (accessed on 30 May 2023).
- Lin, X.; Xu, M.; Cao, C.; Dang, Y.; Bashir, B.; Xie, B.; Huang, Z. Estimates of Forest Canopy Height Using a Combination of ICESat-2/ATLAS Data and Stereo-Photogrammetry. Remote Sens. 2020, 12, 3649. [Google Scholar] [CrossRef]
- Chirico, P.G.; Malpeli, K.C.; Trimble, S.M. Accuracy Evaluation of an ASTER-Derived Global Digital Elevation Model (GDEM) Version 1 and Version 2 for Two Sites in Western Africa. GIScience Remote Sens. 2013, 49, 775–801. [Google Scholar] [CrossRef]
- Reuter, H.I.; Nelson, A.; Jarvis, A. An evaluation of void-filling interpolation methods for SRTM data. Int. J.Geogr. Inf. Sci. 2007, 21, 983–1008. [Google Scholar] [CrossRef]
- John, M.B. Caveats Concerning the Use of SRTM DEM Version 4.1 (CGIAR-CSI). Remote Sens. 2016, 8, 793. [Google Scholar]
- Purinton, B.; Bookhagen, B. Beyond Vertical Point Accuracy: Assessing Inter-pixel Consistency in 30 m Global DEMs for the Arid Central Andes. Front. Earth Sci. 2021, 9, 758606. [Google Scholar] [CrossRef]
- Cook, B.D.; Corp, L.A.; Nelson, R.F.; Middleton, E.M.; Morton, D.C.; McCorkel, J.T.; Masek, J.G.; Ranson, K.J.; Ly, V.; Montesano, P.M. NASA Goddard’s LiDAR, Hyperspectral and Thermal (G-LiHT) Airborne Imager. Remote Sens. 2013, 5, 4045–4066. [Google Scholar] [CrossRef]
- Zhang, X.; Liu, L.; Chen, X.; Gao, Y.; Xie, S.; Mi, J. GLC_FCS30: Global landcover product with fine classification system at 30 m using time-series Landsat imagery. Earth Syst. Sci. Data 2021, 13, 2753–2776. [Google Scholar] [CrossRef]
- Madson, A.; Sheng, Y. Automated Water Level Monitoring at the Continental Scale from ICESat-2 Photons. Remote Sens. 2021, 13, 3631. [Google Scholar] [CrossRef]
- Gao, Z.; Xie, Y.; Wang, N.; Jiang, J.; Zhou, P. Response of three global DEM data accuracy to different terrain factors in Qinghai-Tibet Plateau. Bull. Soil Water Conserv. 2019, 39, 184–191. [Google Scholar]
- Neuenschwander, A.L.; Magruder, L.A. Canopy and Terrain Height Retrievals with ICESat-2: A First Look. Remote Sens. 2019, 11, 1721. [Google Scholar] [CrossRef]
- Osama, N.; Shao, Z.; Ma, Y.; Yan, J.; Fan, Y.; Habib, S.M.; Freeshah, M. The ATL08 as a height reference for the global digital elevation models. Geo-Spat. Inf. Sci. 2022, 1–20. [Google Scholar] [CrossRef]


Disclaimer/Publisher’s Note: The statements, opinions and data contained in all publications are solely those of the individual author(s) and contributor(s) and not of MDPI and/or the editor(s). MDPI and/or the editor(s) disclaim responsibility for any injury to people or property resulting from any ideas, methods, instructions or products referred to in the content. |
© 2024 by the authors. Licensee MDPI, Basel, Switzerland. This article is an open access article distributed under the terms and conditions of the Creative Commons Attribution (CC BY) license (https://creativecommons.org/licenses/by/4.0/).