Article

Differences in Response of Tree Species at Different Succession Stages to Neighborhood Competition

1
Jiangxi Province Key Laboratory for Bamboo Germplasm Resources and Utilization, College of Forestry, Jiangxi Agricultural University, Nanchang 330045, China
2
Administration of Jiangxi Guanshan National Nature Reserve, Yichun 336000, China
3
School of Humanities and Public Administration, Jiangxi Agricultural University, Nanchang 330045, China
*
Author to whom correspondence should be addressed.
Forests 2024, 15(3), 435; https://doi.org/10.3390/f15030435
Submission received: 8 January 2024 / Revised: 21 February 2024 / Accepted: 22 February 2024 / Published: 24 February 2024
(This article belongs to the Section Forest Ecology and Management)

Abstract

:
Neighborhood competition influences tree growth, which can affect species composition and community succession. However, there is a lack of understanding regarding how dominant tree species at different successional stages of forest communities respond in terms of crown architecture and functional traits during their growth process to neighborhood competition. In this study, we analyzed the responses of average annual basal area increment (BAI), crown architecture, and leaf functional traits of early-successional species (Cunninghamia lanceolata and Pinus massoniana), transitional species (Alniphyllum fortunei and Choerospondias axillaris), and late-successional species (Elaeocarpus duclouxii and Castanopsis carlesii) to neighbor competition in a secondary evergreen broad-leaved forest. We found that the BAI of all species is negatively correlated with competition intensity. Notably, early-successional and transitional species exhibited a more rapid decline in growth rates compared to late-successional species in response to increased competition. Among these tree species, the response of crown structure to neighbor competition exhibited variation. Early-successional and transitional species displayed a negative correlation between the competition index and crown area (CA)/diameter, while a positive correlation emerged between the lowest branch height (LBH)/height. Conversely, late-successional species followed the opposite trend. In terms of leaf functional traits, specific leaf area (SLA) showed heightened sensitivity to neighborhood competition, with a positive correlation between SLA of all tree species and the competition index. Furthermore, water use efficiency (WUE) demonstrated negative correlations with the competition index in early-successional and transitional trees, while a positive correlation emerged with late-successional trees. These findings suggest that early-successional and transitional trees prioritize vertical canopy growth, whereas late-successional trees tend to favor horizontal canopy expansion in response to neighboring competition. Additionally, early-successional and transitional trees experience more significant suppression of radial growth rate. Our research contributes to a deeper understanding of the underlying mechanisms driving changes in species composition and community succession.

1. Introduction

Evergreen broadleaf forest is a globally important vegetation type that plays a crucial role in contributing to biodiversity conservation [1]. Unfortunately, a substantial portion of these forests has been replaced by timber plantations, including Cunninghamia lanceolata and Pinus massoniana, due to traditional forestry practices aimed at increasing timber production [2]. After the Chinese government launched forestry ecological projects, the damaged evergreen broad-leaved forests have gradually been restored to their natural successional state. Consequently, artificial plantations have transitioned into secondary evergreen broad-leaved forests. This process is influenced by various factors, such as soil nutrient conditions and the competitive abilities of tree species [3]. Among these factors, the differential competitive abilities of various tree species play a crucial role in community succession [4,5]. Competition mainly occurs between adjacent individuals, known as neighbor competition [6], due to the characteristic of fixed position of trees. This competition affects tree survival status (including growth rate, crown structure, and functional traits) mainly through aboveground crown shading and belowground nutrient competition [7,8,9]. Some tree species with stronger competitive abilities gradually outcompete those with similar ecological niches but weaker competitive abilities, thereby promoting community succession. Therefore, studying the responses of tree species at different successional stages in secondary evergreen broadleaf forests to neighbor competition can enhance our understanding of community succession and its underlying drivers. This research can also provide valuable insights for sustainable forest management.
Diameter or basal area increment at breast height (DI or BAI) is a critical indicator for assessing tree growth rate, and its measurement method is simple and accurate, which can reflect the response of trees (target trees) to neighborhood competition [10]. Previous studies have found that DI or BAI decreased with an increase in the intensity of neighborhood competition [9,11,12,13], which focused on single tree species. However, different tree species may respond differently to neighborhood competition [14,15,16] due to competitive response related to species’ ecological habits and biological characteristics [3,17]. For instance, early-successional and transitional species typically exhibit sun-loving characteristics and lower stem densities [18,19,20]. In contrast, later successional species tend to be shade-tolerant. The influence of neighboring trees on the aboveground portion of the target tree is mainly through crowding and shading effects [5]. Consequently, we hypothesize that neighborhood competition inhibits tree BAI, with early-successional and transitional species experiencing more pronounced inhibitory effects.
The tree crown serves as a crucial site for photosynthesis in trees, with the quantity, quality, and configuration of its components, such as branches and leaves, determining a tree’s ability to capture light and, in turn, influencing photosynthesis, growth rate, and survival status [21,22,23]. Neighborhood competition can alter the available growth space and light effectiveness for target tree species. To acquire more light resources, target tree crown often undergoes adjustments in size and architecture [24,25,26,27], such as changing the number of branches, crown area, and crown position [9,28,29]. Under intense competition, early-successional and transitional species with a preference for sunlight may reduce crown area and invest more in vertical growth to occupy the upper canopy space. Due to their higher light saturation point [30,31], these species can maintain higher photosynthetic rates under well-exposed upper canopy conditions. In contrast, late-successional species may expand the crown area to increase light-capturing surface area. Although their lower light saturation point [3,30,31] can maintain photosynthesis under shaded conditions, the shading effect of neighboring trees reduces their available light resources.
Functional traits encompass physiological or morphological characteristics that influence individual growth, survival, and reproduction, reflecting an organism’s adaptability to its environment [32]. Among these traits, leaves are the fundamental energy acquisition organs in trees, serving as the primary site of photosynthesis and being highly responsive to changes in the external environment [33]. The adjustment of leaf functional traits plays a pivotal role in a plant’s growth status during competition. Competition from neighboring trees often leads to reduced available light for the target tree. To capture more light, leaves in shaded areas often have a higher specific leaf area (SLA), thereby enhancing their light-capturing capacity and compensating for the limitation of photosynthesis due to reduced light [34]. Photosynthesis, which fixes carbon, is associated with water loss through transpiration. The ratio of carbon uptake through assimilation per unit of water loss from transpiration, known as water use efficiency (WUE), is an important physiological trait [35,36]. Several researchers have found that, under limited light conditions, a decrease in photosynthesis rate can lead to a reduction in tree water use efficiency [37,38]. Consequently, it is plausible to expect that, as the intensity of neighboring competition increases, the WUE of the target tree tends to decrease.
Thus, we conduct experiments on the responses of tree species at different successional stages in secondary evergreen broad-leaved forests to neighboring tree competition within the Guanshan National Nature Reserve (GNNR), Jiangxi Province, China. Our aim was to answer the following hypotheses: (1) there exists a negative correlation between basal area increment (BAI) and competition intensity, with early-successional and transitional species demonstrating a more sensitive response compared to late-successional species. (2) Crown architecture of species at different stages of succession will exhibit distinct responses to neighboring competition, with early-successional and transitional species increasing vertical investment and late-successional species increasing horizontal investment. (3) Leaf functional traits will be influenced by neighboring competition, wherein specific leaf area (SLA) increases and water use efficiency (WUE) decreases with the increase in competition intensity. Validation of these hypotheses will contribute to a deeper understanding of the fundamental reasons behind community succession.

2. Materials and Methods

2.1. Site Description

The study area is located at the GNNR in Jiangxi Province, China (28°30′~28°40′ N; 114°29′~114°45′ E) with a total area of 11,500.5 hm2. GNNR belongs to the warm and humid climate zone of the central subtropical region, and the characteristic vegetation is subtropical evergreen broad-leaved forest [39]. It has four distinct seasons and full sunshine, with an average annual air temperature of 16.2 °C and an average annual precipitation of approximately 1950 mm to 2100 mm. The soil is clay loam, composed of 16.75%–19.37% clay (<0.002 mm), 31.04%–35.07% silt (0.02–0.002 mm), and 45.49%–48.7% sand (2–0.02 mm) and is classified as a red and yellow soil according to the Chinese soil classification system [40]. Before becoming a nature reserve, Guanshan had a tradition of forest clearing and reforestation, with much of the forest having experienced burning. Between 1954 and 1956, seedlings of timber tree species such as C. lanceolata were planted in areas previously burned. Since the establishment of the provincial-level nature reserve in 1981, the planted forests have entered a natural successional stage, developing into secondary evergreen broadleaf forests. Therefore, the existing evergreen broad-leaved forest in GNNR consists of secondary evergreen broad-leaved forest, pristine typical evergreen broad-leaved forest, and mixed evergreen and deciduous broad-leaved forest. Among them, secondary evergreen broad-leaved forest accounts for 60.28% of the total [41]. This has provided us with an excellent experimental platform for our research.

2.2. Tree Selection

In 2014, we established a 12 hm2 secondary evergreen broad-leaved forest dynamic monitoring plot in the Guanshan Nature Reserve, according to the Centre for Tropical Forest Science (CTFS) sample plot survey method [42]. The southwest corner of the plot serves as the origin (28°33′25″ N; 114°34′40″ E), with the highest elevation at 645.0 m and the lowest at 444.1 m, resulting in a relative elevation difference of 200.9 m. The survey results showed that the secondary evergreen broad-leaved forest comprised a total of 63,690 individuals of 312 species of woody plants. Among them, species with relatively high importance values in the tree layer include C. lanceolata, Alniphyllum fortunei, Quercus myrsinifolia, Castanopsis carlesii, Choerospondias axillaris, Quercus acutissima, P. massoniana, and Elaeocarpus duclouxii.
We selected six tree species—C. lanceolate, P. massoniana, A. fortunei, C. axillaris, E. duclouxii, and C. carlesii—based on their dominance and shade tolerance as the target trees of our research in July to early September 2019. Each species had 12 to 16 samples selected on the south slope of the plot (with a slope of approximately 15°), making a total of 80 target trees (Tables S1 and S2).

2.3. Sample Collection and Data Calculation

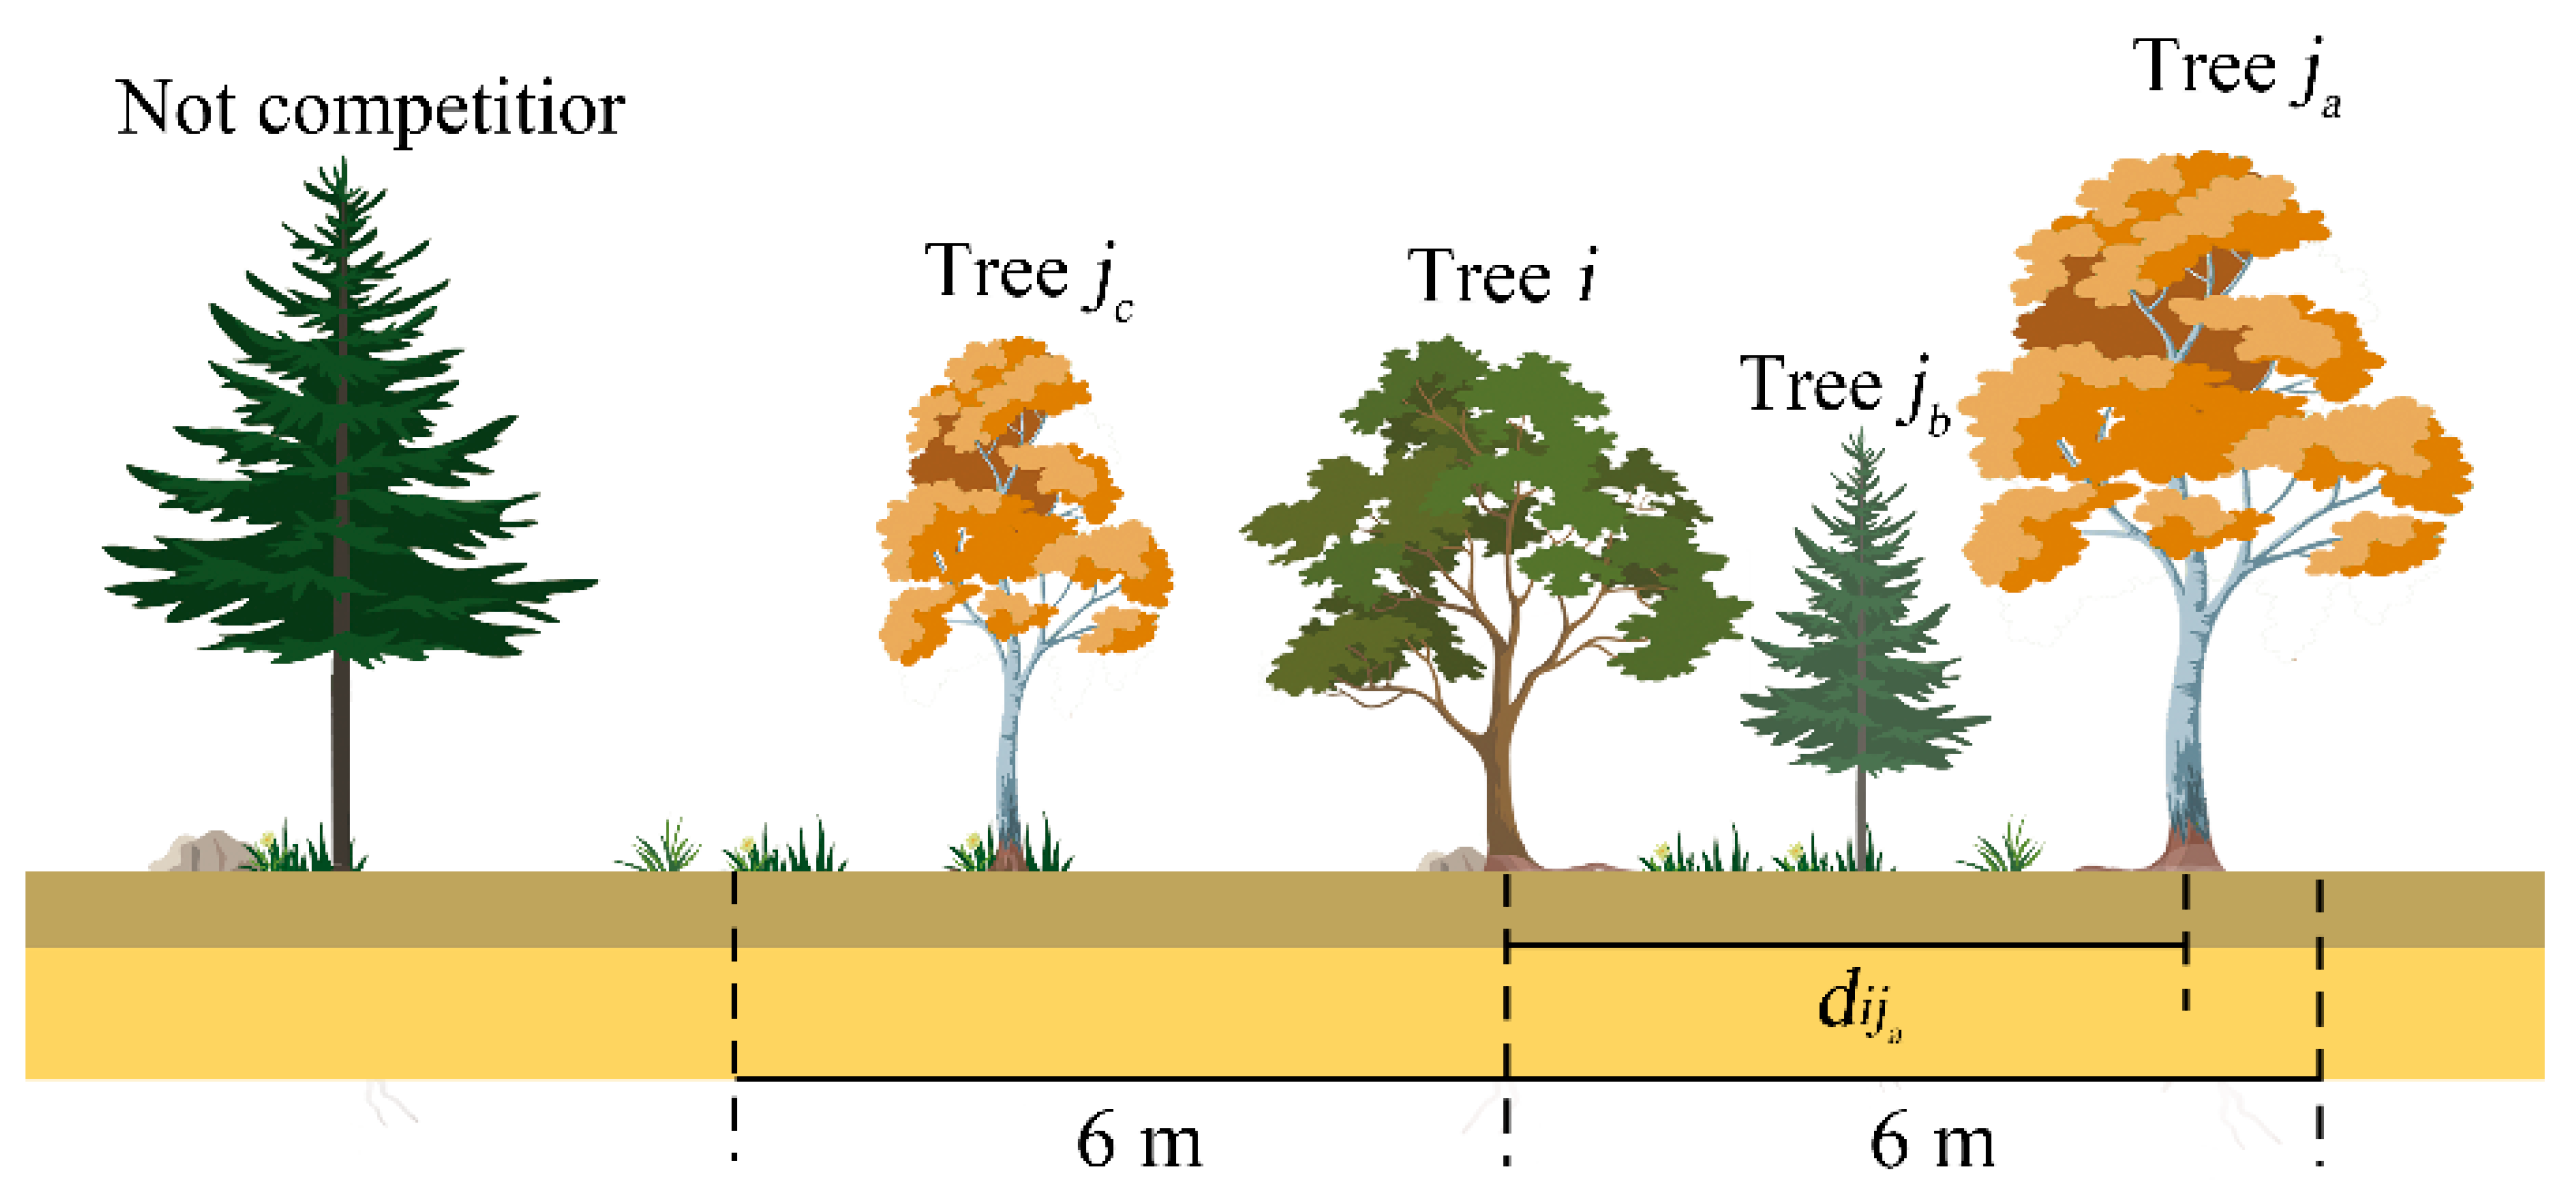
2.3.1. Competition Index

We extended a spatial range of 6 m from each focal tree as the neighborhood, as this has been shown to have wide applicability [10,43]. To quantify the strength of neighboring competition, we used the Hegyi competition index [44]. This index considers not only the diameter at breast height (DBH) of neighboring trees and the target tree but also the distance between them, capturing the influence of neighboring trees on the target tree effectively. The calculation formula is as follows:
C I i j = j = 1 N D i D j - 1 d i j - 1
where CIij is the competition intensity target tree species i faces from neighboring trees; N is the number of individuals in neighboring species; Di is the DBH of target individual i; Dj is the DBH of adjacent individual j; and dij represents the distance between i and j (Figure 1).

2.3.2. Annual Basal Area Increment

We used a minimally destructive method called the vegetative cone to extract tree cores of the target trees at the breast height position (1.3 m above the ground on the tree trunk). Two tree-core samples were taken from each target tree, one in the east–west direction and the other in the south–north direction. We used Win DENDRO V.6.1d software to analyze annual ring widths (r) of the tree core [45] and then to calculate the annual basal area increment at breast height (BAI) by Formula (2), where “π” (pi) is a mathematical constant approximately equal to 3.14159.
B A I = π × r 2

2.3.3. Architecture Indicator

The tree crown serves as a crucial site for photosynthesis in trees. When facing competition from neighboring trees, target trees often undergo adjustments to their crown structure to avoid areas of intense competition [24,25,26,27]. The tree crown architecture is determined by factors such as crown thickness, crown area, and number of branches. Among these, crown area and crown volume are often closely related to diameter at breast height (DBH), while crown thickness is typically associated with height. Therefore, we choose the following parameters to reflect crown architecture: crown thickness (CT)/height (H) ratio, crown area (CA)/DBH ratio, crown volume (CV)/DBH ratio, lowest branch height (LBH)/H ratio, and lateral branch number (LBN).

2.3.4. Leaf Functional Traits Indicator

For each target tree, we collected leaves to measure leaf area (LA), specific leaf area (SLA), nutrient content, etc. Firstly, we measured LA by using a plant image analyzer (Hangzhou WSeen Detection Technology Co., Ltd., Hangzhou, China) and placed the leaves in a drying oven at 65 °C for 3 days until a constant weight was achieved, then measured its dry weight (LDW). SLA is the ratio of the LA to its LDW (for C. axillaris with compound leaves, each small leaf was considered as one leaf unit. For P. massoniana leaves, each needle was considered as one leaf unit). All dried leaf samples were ball milled in preparation for chemical analyses.
Secondly, we used elemental analyzer–isotope ratio mass spectrometry (Vario EL, Elementar Analysen-systeme GmbH, Langenselbold, Germany) to analyze 13C, total carbon (TC), and total nitrogen (TN) of leaf samples. The analytical precision for δ13C was 0.2‰, and all TC and TN measurements were run in duplicate, and the average deviations of replicate analyses from the means were 1.1% for TN and 0.2% for TC concentrations; so, our data are presented as the average of both analytical replicates. To extract P in leaf samples, we digested 150 mg of dried leaf powder from each sample using H2SO4 and H2O2 at 350 °C for half an hour by a microwave digestion system (JKXZ06-8B, Nanchang, China). Then, all digested samples were measured using the molybdenum antimony anti-colorimetric method, employing an ultraviolet–visible spectrophotometer (880 nm, UV-5100, Shanghai, China) [46]. All measurements were performed in duplicate, and the results were reported as the average value, with differences between duplicates being less than 5%.
Finally, we analyzed the water use efficiency (WUE) of the plants by foliar δ13 Cp data [47,48]. Firstly, we used foliar δ13Cp data and air δ13Ca to calculate changes in C isotopic discrimination (∆δ13C) by Formula (3). The δ13Ca was calculated from Formula (7), where t is the sampling year, which is 2019 in this study [49]. Second, we used ∆δ13C to calculate the ratio of the CO2 concentration inside the leaf (Ci) to that of ambient air (Ca) by Formula (4), where a is the fraction from diffusion through stomata with a value of 4.4‰ and b is the fraction from carboxylation by ribulose-1,5-bisphosphate carboxylase/oxygenase with a value of 27‰ [47]. The Ca was calculated from Formula (6) [49]. Finally, we used ci/ca ratio to calculate the WUE of plants by Formula (5), where 1.6 is the ratio of stomatal conductance to water vapor and CO2.
C 13 = δ C 13 a δ C 13 p 1 + δ C 13 p / 1000
C 13 = a + ( b a ) C i C a
W U E = ( C a C i ) 1.6
C a = 277.78 + 1.350 e 0.01572 t 1740
δ C 13 a = 6.429 0.006 e 0.0217 t 1740

2.4. Statistical Analysis

The data were processed using Excel 2016, SPSS 22.0, Origin 2018, and Matlab 2018a software. We utilize linear or exponential regression analysis to investigate the relationship between competition index and annual basal area increment at breast height, as well as tree crown structure (crown thickness, crown area, crown volume, lower branch height, and live lateral branch number). Furthermore, we employed Pearson correlation analysis to analyze the correlation between competition index and leaf functional traits (leaf area, specific leaf area, and water use efficiency). This analysis aimed to understand the impact of neighbor competition intensity on the growth of the target trees.

3. Results

3.1. Tree Radial Growth

The BAI was significantly negatively correlated with competition index (Figure 2). The partial regression coefficients of the competition index for the six tree species show the following pattern from highest to lowest: P. massoniana (−2.65) > A. fortunei (−2.05) > C. lanceolate (−1.76) > C. axillaris (−1.71) > C. carlesii (−1.44) > E. duclouxii (−1.41). It shows that the BAI of late-successional trees (E. duclouxii and C. carlesii) is less affected by neighborhood competition than that of early-successional trees (A. fortunei and C. axillaris) and transitional trees (C. lanceolate and P. massoniana).

3.2. Tree Crown Architecture

The response of tree species’ crown architecture to neighbor competition varies is shown in Figure 3. For C. lanceolate, P. massoniana, A. fortunei, and C. axillaris, competition index showed a negative correlation between crown thickness (CT)/H, crown area (CA)/DBH, crown volume (CV)/DBH, and live lateral branch number (LBN) and positively correlated with the lowest branch height (LBH)/H, but the correlation between some indexes and the competition index is not significant. For C. carlesii, competition index significantly showed a positive correlation with CT/H, CA/DBH, and CV/DBH, while it significantly showed a negative correlation with LBH/H and no significant effect on the LBN. The E. duclouxii’s crown architecture was not significantly correlated with competition index, with a trend of increasing CV/DBH and decreasing LBH/H, with an increase in competition intensity.

3.3. Leaf Functional Traits

The structural traits of leaves (leaf dry weight, LDW; leaf area, LA; and specific leaf area, SLA) showed sensitivity to neighbor competition, whereas nutrient traits (TC, TN, and TP) and the physiological trait (water use efficiency, WUE) were relatively stable (Table 1). LDW of five tree species significantly showed a negative correlation with competition index, and SLA of all tree species significantly showed a positive correlation with competition index. Nutrient traits only showed significant changes in C. lanceolata, where TC was negatively correlated with competition intensity, while leaf TN and TP showed significant positive correlations. For most tree species, WUE was not significantly correlated with neighbor competition intensity. However, the early-successional and transitional trees showed a decreasing trend in WUE, while late-successional trees exhibited an increasing trend (Figure 4).

4. Discussion

4.1. Negative Correlation between Average Annual Growth of Basal Area and Competition Intensity

The research findings indicate that BAI decreases with increasing competition intensity among neighboring trees (Figure 2). Notably, the decline in BAI for early-successional and transitional trees is greater than that for late-successional trees. This phenomenon is closely tied to changes in light conditions and the shade tolerance of the target trees. As competition intensity increases, neighboring trees intercept a significant portion of the light that would have otherwise reached the target trees. This reduction in light availability has a significantly impact on the growth of early-successional and transitional tree species that are fast-growing and light-demanding [50], due to these species typically having thinner canopies, lower leaf area index, and higher light compensation points for their leaves [30,31].
In comparison, late-successional tree species possess deeper canopies and larger leaf area index. Additionally, their leaves generally have lower light compensation points [3,30,31]. This means that late-successional tree species have a relatively stronger ability to intercept light and utilize it more efficiently. Consequently, under competition from neighboring trees, early-successional and transitional trees experience a more pronounced decrease in growth rate, whereas late-successional species exhibit a more gradual decline. These findings align with previous research by Ma et al. conducted in Dinghushan [16], which also demonstrated that neighboring competition impacts tree growth and survival, and sunlight-demanding species are more strongly affected.
These research findings can provide theoretical guidance for the protection of target tree species, such as rare species and timber tree species. For rare tree species, especially those that require ample sunlight, moderate human intervention is advisable. This could involve selectively removing heterospecific woody plants surrounding the target trees to diminish interspecific competition, thereby providing sufficient space and light for the growth of the target trees. In managed forests dominated by coniferous and deciduous broadleaf trees, it is recommended to appropriately increase planting spacing to reduce the impact of neighboring competition on the growth of target managed trees, thereby increasing productivity.

4.2. The Response of Tree Canopy Architecture to Neighboring Competition Varies among Different Succession Stages of Tree Species

The growth rate of trees is closely related to their crown architecture. How do tree species at different successional stages adapt their crown structures to support growth amidst competition from neighboring trees? Our study reveals that species with different successional stage adopted distinct strategies. Early-successional and transitional species exhibit a decrease in CA/DBH, CT/H, and LBN, accompanied by an increase in LBH/H as competition intensity rises. In contrast, late-successional species display the opposite trend (Figure 3). These adaptive changes are related to the biological characteristics of tree species. Conifers and deciduous broadleaf species, with a higher demand for sunlight and lower wood density compared to late-successional trees [18,30,31]. With the increase in neighbor competition intensity, the horizontal extension space and available light resources of the target tree crown decrease. In order to minimize the mechanical compression and shading effects caused by neighboring trees, the coniferous and deciduous target tree species reduce their CA [51] and increase the LBH to raise the canopy’s position above the ground, allowing the tree to access light resources from the upper canopy. Additionally, they reduce LBN pruning to reduce self-shading within the crown [52]. In other words, early-successional and transitional species, aiming to maximize photosynthetic carbon acquisition in limited space and weak light conditions, increase their vertical survival space to enhance light interception efficiency under neighbor competition conditions (Figure 5).
On the other hand, late-successional trees exhibit shade-tolerant and a lower light saturation point [3,30,31]. These species can maintain higher photosynthetic rates in understory light conditions. Thus, they reduce LBH to avoid mechanical compression from neighboring trees while ensuring ample lateral crown extension space (Figure 3 and Figure 5). The expansion of the canopy area can increase the area for trees to access effective light sources in understory, thereby mitigating the impact of reduced effective light resources. Moreover, the reduction in LBH also reduces the cost of water transportation and mitigates the risk of hydraulic blockage during water transport. According to the Transpiration–Cohesion–Tension theory, plant leaf transpiration creates tension that continuously lifts water through the xylem to the crown for gas exchange [53]. The higher the lower branches, the greater the risk of hydraulic blockage during water transport.
In summary, the crown structure of both early-successional and transitional trees, as well as late-successional trees, is influenced by neighboring tree competition. However, early-successional and transitional species tend to have narrower crown structures, occupying the upper canopy space, while late-successional trees tend to have wider and thicker crown structures, occupying the lower canopy space. In a certain time, the differences in crown structure response to neighboring tree competition among different tree species can enhance forest structural diversity, facilitating more effective utilization of resources such as light and space by trees, mitigating interspecific competition, and thereby promoting the optimization of forest ecosystem functions [54].
In the long term, the strategy of late-successional tree species to cope with neighboring competition is more advantageous. As the community develops further, canopy closure within the forest increases. If early-successional and transitional trees attempt to emerge above the canopy, they will have narrower and thinner crowns, taller stems, and increased investment in stem construction and maintenance for tree support [55], water transport [56], and other physiological functions. However, narrow crowns lead to insufficient photosynthesis, reduced carbon reserves within the trees, and, consequently, a decrease in individual growth rates. Therefore, in subtropical forest communities, adjusting the crown structure of late-successional trees is more conducive to their growth and they become the dominant species of the community. During the process of community succession, the exit of early-successional and transitional species leads to a decrease in biodiversity, while enhancing the stability of the community.

4.3. Response of Leaf Functional Traits to Neighboring Competition

The results of this study show that leaf structural traits are sensitive to the influence of neighboring competition. As the intensity of neighboring competition increases, the SLA of various tree species significantly increases (Table 1). This is primarily because neighboring competition often results in insufficient light resources for plant growth. To compensate for the reduced light availability and overcome the limitations on photosynthesis in low-light conditions, plants tend to exhibit higher SLA [57,58]. This adaptation increases light interception for a given amount of biomass investment, enabling them to thrive in low-light environments.
In contrast, the leaf nutrient traits (TC, TN, and TP) of various tree species remain relatively stable and are less influenced by neighboring competition (Table 1). This stability can be attributed to the fact that the variability in chemical stoichiometric traits is primarily driven by species-level differences [59] and, within the same species, mineral content is mainly affected by climate and soil conditions [60]. Furthermore, our study found that different tree species respond differently in terms of WUE to neighboring interference (Table 1, Figure 4). Early-successional and transitional trees show a negative correlation between WUE and the intensity of interference, primarily due to changes in the light environment. As the intensity of neighboring interference increases, the target trees receive reduced light intensity under the shading of neighboring trees, leading to a decrease in photosynthetic rates and subsequently reducing WUE [37,38,61].
It is interesting that, in our study, late-successional trees (such as E. duclouxii and C. carlesii) show a positive correlation between WUE and the intensity of neighboring competition. This relationship is attributed to their lower light saturation points compared to sun-dementing early-successional trees [3,30,31]. While target tree species in low competition environments can receive more available light, their photosynthetic rates tend to stabilize after reaching a certain light intensity, known as the light saturation point [62]. However, the increase in light can lead to a rise in temperature and subsequently increase vapor pressure deficit (VPD), resulting in an increase in transpiration of the target tree [63], without reaching a saturation phenomenon [64]. As a result, the shading effect of neighboring trees does not decrease but rather increases the WUE of late-successional trees. We believe that the improved WUE of late-successional trees can, to some extent, compensate for the impact of neighboring tree interference on their growth, as an increase in WUE has positive effects on tree growth [65,66].

5. Conclusions

Our research indicates that species at different successional stages in the subtropical region respond differently to neighboring tree interference. Early-successional and transitional tree species reduce their investment in horizontal canopy development and occupation of upper canopy space and reduce water use efficiency. However, late-successional broadleaf tree species allocate more resources horizontally and improve water use efficiency. As the community develops, the intensity of neighboring competition increases, resulting in a narrower crown area, reduced photosynthesis, and carbon fixation for early-successional and transitional tree species. Simultaneously, the stem height increases, leading to higher physiological costs for supporting the tree and water transport, resulting in lower individual growth rates. Consequently, late-successional trees gradually replace early-successional and transitional trees. Our results indicate that the differences in canopy structure and leaf functional traits among tree species at various successional stages in response to neighboring competition play crucial roles in driving community succession.

Supplementary Materials

The following supporting information can be downloaded at: https://www.mdpi.com/article/10.3390/f15030435/s1, Table S1: Basic information of objective trees and characterization of crown architecture; Table S2: Characteristics of leaf functional traits in objective trees.

Author Contributions

Conceptualization, Q.Y.; Software, X.Z. and C.G.; Investigation, X.Z., J.L. (Jiejun Li), Q.P., C.G., H.R., T.X., T.L., T.Z. and D.H.; Resources, J.L. (Jiejun Li) and Q.P.; Data curation, X.Z., J.L. (Jiejun Li), Q.P., C.G. and H.R.; Writing—original draft, X.Z.; Writing—review & editing, J.L. (Jun Liu) and Q.Y.; Funding acquisition, T.X., Q.S., J.L. (Jun Liu) and Q.Y. All authors have read and agreed to the published version of the manuscript.

Funding

This research was supported by the National Natural Science Foundation of China (32060319, 41807028, 42067050), JIANGXI “DOUBLE THOUSAND PLAN” (jxsq2020101079), and Graduate Innovation Fund of Jiangxi Province (YC2023-S383).

Data Availability Statement

All data generated or analyzed during this study are included in this published article.

Acknowledgments

We are grateful to the Administration of Jiangxi Guanshan National Nature Reserve for providing a research platform. We also thank other members of our team for their assistance in the field experiments.

Conflicts of Interest

The authors declare no conflict of interest.

References

  1. Wang, X.; Yan, E.; Yan, X.; Wang, L. Analysis of degraded evergreen broad-leaved forest communities in Eastern China and issues in forest restoration. Acta Ecol. Sin. 2005, 25, 1796–1803. [Google Scholar]
  2. Enoki, T. Microtopography and distribution of canopy trees in a subtropical evergreen broad-leaved forest in the northern part of Okinawa Island, Japan. Ecol. Res. 2003, 18, 103–113. [Google Scholar] [CrossRef]
  3. Xue, J.H. Forest Ecology; China Forestry Publishing House: Beijing, China, 2006. [Google Scholar]
  4. Buma, B.; Bisbing, S.M.; Wiles, G.; Bidlack, A.L. 100yr of primary succession highlights stochasticity and competition driving community establishment and stability. Ecology 2019, 100, e02885. [Google Scholar] [CrossRef] [PubMed]
  5. Tilman, D. Community Diversity and Succession: The Roles of Competition, Dispersal, and Habitat Modification. Ecol. Stud. 1993, 99, 327–344. [Google Scholar]
  6. Uriarte, M.; Canham, C.D.; Thompson, J.; Zimmerman, J.K. A neighborhood analysis of tree growth and survival in a hurricane-driven tropical forest. Ecol. Monogr. 2004, 74, 591–614. [Google Scholar] [CrossRef]
  7. Zhang, H.; Xue, J. Spatial pattern and competitive relationships of moso bamboo in a native subtropical rainforest community. Forests 2018, 9, 774. [Google Scholar] [CrossRef]
  8. Song, M.H.; Hu, Q.W.; Tian, Y.Q.; Ouyang, H. Seasonal patterns of root and shoot interactions in an alpine meadow on the Tibetan Plateau. J. Plant Ecol. 2012, 5, 182–190. [Google Scholar] [CrossRef]
  9. Yang, X.Z.; Zhang, W.H.; He, Q.Y. Effects of intraspecific competition on growth, architecture and biomass allocation of Quercus Liaotungensis. J. Plant Interact. 2019, 14, 284–294. [Google Scholar] [CrossRef]
  10. Yang, Q.; Fu, F.; Zhang, L.; Liang, Y.; Tang, P.; Liu, Z.; Guo, X. A study on the neighborhood interrerence index in Toona ciliates var. pubescens community. Acta Agric. Univ. Jiangxiensis 2013, 35, 748–754. [Google Scholar]
  11. Coomes, D.A.; Allen, R.B. Effects of size, competition and altitude on tree growth. J. Ecol. 2007, 95, 1084–1097. [Google Scholar] [CrossRef]
  12. Masaki, T.; Mori, S.; Kajimoto, T.; Hitsuma, G.; Sawata, S.; Osumi, K.; Sakurai, S.; Seki, T. Long-term growth analyses of Japanese cedar trees in a plantation: Neighborhood competition and persistence of initial growth deviations. J. For. Res. 2006, 2006, 217–225. [Google Scholar] [CrossRef]
  13. Ding, Y.; Zang, R.; Huang, J.; Xu, Y.; Lu, X.; Guo, Z.; Ren, W. Intraspecific trait variation and neighborhood competition drive community dynamics in an old-growth spruce forest in northwest China. Sci. Total Environ. 2019, 678, 525–532. [Google Scholar] [CrossRef] [PubMed]
  14. Fortunel, C.; Valencia, R.; Wright, S.J.; Garwood, N.C.; Kraft, N.J. Functional trait differences influence neighbourhood interactions in a hyperdiverse Amazonian forest. Ecol. Lett. 2016, 19, 1062–1070. [Google Scholar] [CrossRef] [PubMed]
  15. Szwagrzyk, J.; Szewczyk, J.; Maciejewski, Z. Shade-tolerant tree species from temperate forests differ in their competitive abilities: A case study from Roztocze, south-eastern Poland. For. Ecol. Manag. 2012, 2012, 28–35. [Google Scholar] [CrossRef]
  16. Ma, Q.; Li, Y.; Lian, J.; Ye, W. Difference in survival response of tree species to neighborhood crowding in a lower subtropical evergreen broad-leaved forest of Dinghushan. Biodivers. Sci. 2018, 26, 535. [Google Scholar] [CrossRef]
  17. Hubbell, S.P.; Ahumada, J.A.; Condit, R.; Foster, R.B. Local neighborhood effects on long-term survival of individual trees in a neotropical forest. Ecol. Res. 2001, 16, 859–875. [Google Scholar] [CrossRef]
  18. Chen, L.X.; Xiang, W.H.; Wu, H.L.; Lei, P.F.; Li, S.; Ouyang, S.; Deng, X.W.; Fang, X. Tree growth traits and social status affect the wood density of pioneer species in secondary subtropical forest. Ecol. Evol. 2017, 2017, 5366–5377. [Google Scholar] [CrossRef] [PubMed]
  19. Woodcock, D.; Shier, A. Wood specific gravity and its radial variations: The many ways to make a tree. Trees 2002, 16, 437–443. [Google Scholar] [CrossRef]
  20. Anten, N.P.R.; Schieving, F. The role of wood mass density and mechanical constraints in the economy of tree architecture. Am. Nat. 2010, 175, 250–260. [Google Scholar] [CrossRef]
  21. Barbeito, I.; Collet, C.; Ningre, F.O. Crown responses to neighbor density and species identity in a young mixed deciduous stand. Trees 2014, 28, 1751–1765. [Google Scholar] [CrossRef]
  22. Brown, J.H.; Gillooly, J.F.; Allen, A.P.; Savage, V.M.; West, G.B. Toward a metabolic theory of ecology. Ecology 2004, 85, 1771–1789. [Google Scholar] [CrossRef]
  23. Linsenmair, K.E.; Davis, A.J.; Fiala, B.; Speight, M.R. Tree architecture in a Bornean lowland rain forest: Intraspecific and interspecific patterns. Springer Neth. 2001, 153, 279–292. [Google Scholar]
  24. Schröter, M.; Härdtle, W.; Oheimb, G.V. Crown plasticity and neighborhood interactions of European beech (Fagus sylvatica L.) in an old-growth forest. Eur. J. For. Res. 2012, 131, 787–798. [Google Scholar] [CrossRef]
  25. Thorpe, H.C.; Astrup, R.; Trowbridge, A.; Coates, K.D. Competition and tree crowns: A neighborhood analysis of three boreal tree species. For. Ecol. Manag. 2010, 259, 1586–1596. [Google Scholar] [CrossRef]
  26. Seidel, D.; Leuschner, C.; Müller, A.; Krause, B. Crown plasticity in mixed forests—Quantifying asymmetry as a measure of competition using terrestrial laser scanning. For. Ecol. Manag. 2011, 261, 2123–2132. [Google Scholar] [CrossRef]
  27. Kunz, M.; Fichtner, A.; Härdtle, W.; Raumonen, P.; Bruelheide, H.; von Oheimb, G. Neighbour species richness and local structural variability modulate aboveground allocation patterns and crown morphology of individual trees. Ecol. Lett. 2019, 22, 2130–2140. [Google Scholar] [CrossRef] [PubMed]
  28. Lintunen, A.; Kaitaniemi, P. Responses of crown architecture in Betula pendula to competition are dependent on the species of neighbouring trees. Trees 2010, 24, 411–424. [Google Scholar] [CrossRef]
  29. Nikinmaa, E.; Ilomki, S.; Mkel, A. Crown rise due to competition drives biomass allocation in silver birch. Can. J. For. Res. 2003, 33, 2395–2404. [Google Scholar]
  30. Poorter, L.; Bongers, F.; Sterck, F.J.; Wöll, H. Architecture of 53 rain forest tree species differing in adult stature and shade tolerance. Ecology 2003, 84, 602–608. [Google Scholar] [CrossRef]
  31. Kitajima, K. Relative importance of photosynthetic traits and allocation patterns as correlates of seedling shade tolerance of 13 tropical trees. Oecologia 1994, 98, 419–428. [Google Scholar] [CrossRef]
  32. Violle, C.; Navas, M.L.; Vile, D.; Kazakou, E.; Fortunel, C.; Hummel, I.; Garnier, E. Let the concept of trait be functional! Oikos 2007, 116, 882–892. [Google Scholar] [CrossRef]
  33. Wright, I.J.; Reich, P.B.; Cornelissen, J.H.; Falster, D.S.; Groom, P.K.; Hikosaka, K.; Lee, W.; Lusk, C.H.; Niinemets, Ü.; Oleksyn, J. Modulation of leaf economic traits and trait relationships by climate. Glob. Ecol. Biogeogr. 2005, 14, 411–421. [Google Scholar] [CrossRef]
  34. Ran, L.X.; Jing, L.Q.; Zhe, C.; Qing, M.Z. Specific leaf area and leaf area index of conifer plantaions in Qianyanzhou station of subtropical China. J. Plant Ecol. 2007, 31, 93. [Google Scholar] [CrossRef]
  35. Yu, G.; Song, X.; Wang, Q.; Liu, Y.; Guan, D.; Yan, J.; Sun, X.; Zhang, L.; Wen, X. Water-use efficiency of forest ecosystems in eastern China and its relations to climatic variables. New Phytol. 2008, 177, 927–937. [Google Scholar] [CrossRef]
  36. Briggs, L.J.; Shantz, H.L. The Water Requirement of Plants; US Government Printing Office: Washington, DC, USA, 1913.
  37. Le Roux, X.; Bariac, T.; Sinoquet, H.; Genty, B.; Piel, C.; Mariotti, A.; Girardin, C.; Richard, P. Spatial distribution of leaf water-use efficiency and carbon isotope discrimination within an isolated tree crown. Plant Cell Environ. 2001, 24, 1021–1032. [Google Scholar] [CrossRef]
  38. Zimmerman, J.K.; Ehleringer, J.R. Carbon isotope ratios are correlated with irradiance levels in the Panamanian orchid Catasetum viridiflavum. Oecologia 1990, 83, 247–249. [Google Scholar] [CrossRef] [PubMed]
  39. Cao, L.L.; Zou, F.; Lai, H. Study on the Diversity of Rare and Endangered Plants in Guanshan Natural Reserve of Jiangxi Province. J. Anhui Agric. Sci. 2012, 40, 4. [Google Scholar]
  40. State Soil Survey Service of China. China Soil; China Agricultural Press: Beijing, China, 1998. [Google Scholar]
  41. Liu, X.; Heping, W. Scientific Survey and Study on the Guanshan Nature Reserve in Jiangxi Province; China Forestry Publishing House: London, UK, 2005. [Google Scholar]
  42. Condit, R. Research in large, long-term tropical forest plots. Trends Ecol. Evol. 1995, 10, 18–22. [Google Scholar] [CrossRef]
  43. Duan, R.Y.; Wang, X.A. Intraspecific and interspecific competition in Larix chinensis. Chin. J. Plant Ecol. 2005, 29, 242. [Google Scholar]
  44. Hegyi, F. A Simulation Model for Managing Jack Pine Stands, in “Growth for Trees and Stand Simulation” IUFRO. Proc. Work. Party. S 1974, 4, 1–4. [Google Scholar]
  45. He, H. Measurement of tree-ring width with Win-DENERO and crossdating methods. J. Chongqing Norm. Univ. 2005, 22, 39–44. [Google Scholar]
  46. Lu, R.K. Methods of Soil and Agrochemical Analysis; China Agricultural Science and Technology Press: Beijing, China, 2000. [Google Scholar]
  47. Farquhar, G.D.; O’Leary, M.H.; Berry, J.A. On the relationship between carbon isotope discrimination and the intercellular carbon dioxide concentration in leaves. Funct. Plant Biol. 1982, 9, 121–137. [Google Scholar] [CrossRef]
  48. Huang, Z.; Ran, S.; Fu, Y.; Wan, X.; Song, X.; Chen, Y.; Yu, Z. Functionally dissimilar neighbours increase tree water use efficiency through enhancement of leaf phosphorus concentration. J. Ecol. 2022, 110, 2179–2189. [Google Scholar] [CrossRef]
  49. Feng, X. Long-term ci/ca response of trees in western North America to atmospheric CO2 concentration derived from carbon isotope chronologies. Oecologia 1998, 117, 19–25. [Google Scholar] [CrossRef]
  50. Qi, C.J.T.; Guo, G. Dendrology; China Forestry Publishing House: Beijing, China, 2005. [Google Scholar]
  51. Chen, J.; Zhao, C.Z.; Wang, J.W.; Zhao, L.C. Canopy structure and radiation interception of Salix matsudana: Stand density dependent relationships. Chin. J. Plant Ecol. 2017, 41, 661–669. [Google Scholar]
  52. Osunkoya, O.O.; Omar-Ali, K.; Amit, N.; Dayan, J.; Daud, D.S.; Sheng, T.K. Comparative height–crown allometry and mechanical design in 22 tree species of Kuala Belalong rainforest, Brunei, Borneo. Am. J. Bot. 2007, 94, 1951–1962. [Google Scholar] [CrossRef] [PubMed]
  53. Koch, G.W.; Sillett, S.C.; Jennings, G.M.; Davis, S.D. The limits to tree height. Nature 2004, 428, 851–854. [Google Scholar] [CrossRef] [PubMed]
  54. Fotis, A.T.; Morin, T.H.; Fahey, R.T.; Hardiman, B.S.; Bohrer, G.; Curtis, P.S. Forest structure in space and time: Biotic and abiotic determinants of canopy complexity and their effects on net primary productivity. Agric. For. Meteorol. 2018, 250, 181–191. [Google Scholar] [CrossRef]
  55. Falster, D.S.; Westoby, M. Plant height and evolutionary games. Trends Ecol. Evol. 2003, 18, 337–343. [Google Scholar] [CrossRef]
  56. De Schepper, V.; Van Dusschoten, D.; Copini, P.; Jahnke, S.; Steppe, K. MRI links stem water content to stem diameter variations in transpiring trees. J. Exp. Bot. 2012, 63, 2645–2653. [Google Scholar] [CrossRef] [PubMed]
  57. Gommers, C.M.; Visser, E.J.; St Onge, K.R.; Voesenek, L.A.; Pierik, R. Shade tolerance: When growing tall is not an option. Trends Plant Sci. 2013, 18, 65–71. [Google Scholar] [CrossRef] [PubMed]
  58. Xu, W.; Tomlinson, K.W.; Li, J. Strong intraspecific trait variation in a tropical dominant tree species along an elevational gradient. Plant Divers. 2020, 42, 1–6. [Google Scholar] [CrossRef] [PubMed]
  59. Wen, G.Z.; Xia, Z.W.; Fu, L.J.; Ming, Z.J. The Variation Characteristics of Plant Functional Traits among 16 Woody Plants in Subtropical Broad-leaved Forest at Dagang Mountain. J. Fujian Norm. Univ. 2019, 12, e8680. [Google Scholar]
  60. Firn, J.; McGree, J.M.; Harvey, E.; Flores-Moreno, H.; Schütz, M.; Buckley, Y.M.; Borer, E.T.; Seabloom, E.W.; La Pierre, K.J.; MacDougall, A.M. Leaf nutrients, not specific leaf area, are consistent indicators of elevated nutrient inputs. Nat. Ecol. Evol. 2019, 3, 400–406. [Google Scholar] [CrossRef]
  61. Gonzalez de Andres, E.; Camarero, J.J.; Blanco, J.A.; Imbert, J.B.; Lo, Y.H.; Sangüesa-Barreda, G.; Castillo, F.J. Tree-to-tree competition in mixed European beech–Scots pine forests has different impacts on growth and water-use efficiency depending on site conditions. J. Ecol. 2018, 106, 59–75. [Google Scholar] [CrossRef]
  62. Farquhar, G.D.; von Caemmerer, S.v.; Berry, J.A. A biochemical model of photosynthetic CO2 assimilation in leaves of C3 species. Planta 1980, 149, 78–90. [Google Scholar] [CrossRef] [PubMed]
  63. Will, R.E.; Wilson, S.M.; Zou, C.B.; Hennessey, T.C. Increased vapor pressure deficit due to higher temperature leads to greater transpiration and faster mortality during drought for tree seedlings common to the forest–grassland ecotone. New Phytol. 2013, 200, 366–374. [Google Scholar] [CrossRef]
  64. Qi, Z.S.; Lun, S. Research progress on water use efficiency of plant. Agric. Res. Arid. Areas 2002, 20, 1–5. [Google Scholar]
  65. Driscoll, A.W.; Bitter, N.Q.; Ehleringer, J.R. Interactions among intrinsic water-use efficiency and climate influence growth and flowering in a common desert shrub. Oecologia 2021, 197, 1027–1038. [Google Scholar] [CrossRef]
  66. Ducrey, M.; Huc, R.; Ladjal, M.; Guehl, J.-M. Variability in growth, carbon isotope composition, leaf gas exchange and hydraulic traits in the eastern Mediterranean cedars Cedrus libani and C. brevifolia. Tree Physiol. 2008, 28, 689–701. [Google Scholar] [CrossRef]
Figure 1. Intention map of relationship between objective tree and neighboring tree. “Tree i” is the target tree species, “Tree ja, Tree jb and Tree jc” is the adjacent individual, and dija represents the distance between target tree i and adjacent individual ja.
Forests 15 00435 g001
Figure 2. Relationships between the average annual basal area increment at breast height (BAI) and competition intensity. (a) C. lanceolate, (b) P. massoniana, (c) A. fortunei, (d) C. axillaris, (e) E. duclouxii, and (f) C. carlesii, same below. “**” and “***” indicate extremely significant (p < 0.01) and very extremely significant (p < 0.001) correlation between BAI and competition index.
Forests 15 00435 g002
Figure 3. Relationships between competition intensity and the canopy architecture parameters. Crown thickness (CT)/height (H) ratio (a), crown area (CA)/diameter at breast height (DBH) ratio (b), crown volume (CV)/DBH ratio (c), lowest branch height (LBH)/H ratio (d), and lateral branch number (LBN) (e). CL: C. lanceolate (yellow), PM: P. massoniana (orange), AF: A. fortunei (light blue), CA: C. axillaris (dark Blue), ED: E. duclouxii (light green), CC: C. carlesii (dark green). Open points and lines indicate the original measurement curves and a linear model fit. “*”, “**” and “***” indicate significant (p < 0.05), extremely significant (p < 0.01) and very extremely significant (p < 0.001) correlation between canopy architecture parameters and competition index. "n.s." represents that the correlation is not significant.
Forests 15 00435 g003
Figure 4. Water use efficiency (WUE) under different competition intensities. (a) C. lanceolate, (b) P. massoniana, (c) A. fortunei, (d) C. axillaris, (e) E. duclouxii, and (f) C. carlesii in strong competition environment (green) and weak competition environment (red). Error bars denote the 95% confidence interval and bars labeled with “*” indicate significant differences (p < 0.05).
Forests 15 00435 g004
Figure 5. Schematic diagram of response of crown structure of different life form tree species to neighbor competition.
Forests 15 00435 g005
Table 1. Correlation between leaf functional traits and competition intensity.
IndexCLPMAFCAEDCC
LDW−0.698 **−0.702 **−0.386 **−0.571 **−0.136−0.318 **
LA−0.204 **0.285 **0.314 **−0.0040.536 **0.186 **
SLA0.292 **0.909 **0.890 **0.785 **0.641 **0.569 **
TC−0.660 **0.054−0.410−0.227−0.247−0.105
TN0.466 *−0.1610.1690.513 *−0.1070.194
TP0.438 *−0.3030.004−0.044−0.409−0.117
C/N−0.576 **0.205−0.245−0.4720.049−0.199
C/P−0.556 **0.408−0.0760.0220.494 *0.041
N/P−0.1440.2860.2080.3600.3830.134
WUE−0.527−0.118−0.845 **−0.4470.2660.645
CL: C. lanceolate, PM: P. massoniana, AF: A. fortunei, CA: C. axillaris, ED: E. duclouxii, CC: C. carlesii, same below. LDW: leaf dry weight, LA: leaf area, SLA: specific leaf area, TC: leaf total carbon content, TN: leaf total nitrogen content, TP: leaf total phosphorus content, C/N: ratio of carbon content to nitrogen content, C/P: ratio of carbon content to phosphorus content, N/P: ratio of nitrogen content to phosphorus content, WUE: water use efficiency. “*” and “**” indicate significant (p < 0.05) and extremely significant (p < 0.01) correlation between leaf functional traits and competition intensity, the same below.
Disclaimer/Publisher’s Note: The statements, opinions and data contained in all publications are solely those of the individual author(s) and contributor(s) and not of MDPI and/or the editor(s). MDPI and/or the editor(s) disclaim responsibility for any injury to people or property resulting from any ideas, methods, instructions or products referred to in the content.

