Article

Can Growth Increase of Small Trees after Drought Compensate for Large Trees’ Growth Loss?

1
Research Center of Forest Management Engineering of State Forestry and Grassland Administration, Beijing Forestry University, No. 35 Qinghua East Road, Beijing 100083, China
2
Department of Environmental Science, Policy and Management, University of California, Berkeley, CA 94704, USA
*
Author to whom correspondence should be addressed.
Forests 2024, 15(3), 448; https://doi.org/10.3390/f15030448
Submission received: 21 December 2023 / Revised: 1 February 2024 / Accepted: 8 February 2024 / Published: 27 February 2024
(This article belongs to the Special Issue Tree Growth in Relation to Climate Change)

Abstract

:
Large trees dominate stand-level biomass but their growth suffers more from droughts, while sheltering small trees during droughts. Under a warmer and drier climate, whether the growth decline of large trees could be compensated by prompted small trees’ growth remains unknown. Based on the Standardized Precipitation Evapotranspiration Index (SPEI) series, drought characteristics were determined, and two drought events were selected. We reconstructed historical diameters at breast height (DBH) and the aboveground biomass of Larix gmelinii through tree ring data allometric equations. To clarify the difference in the responses of tree size to drought, we calculated resistance, recovery, and resilience in each diameter class. We used a growth dominance coefficient (GDC) to exhibit the contributions of different-sized individuals to stand growth and demonstrated the growth dynamics of both the individual and stand level. The results proved that large trees were more vulnerable to local droughts, the resilience of larch had a negative relationship with the DBH (p < 0.05), and small trees could recover to even exceed their pre-drought growth level. Most plots had a negative GDC and small trees contributed more to stand growth compared with their size, but their AGB growth was far less than that of large trees, which made it difficult to compensate for stand growth decline. Our results indicate that tree resilience has a negative relationship with their pre-drought sizes, as large trees in the stand fail to regain their growth level before drought. Even with a larger relative contribution and higher resilience, small trees cannot cover deficits in large trees’ growth. Under more frequent droughts, the total aboveground biomass growth of larches would decline.

1. Introduction

Boreal forests maintain the global terrestrial ecosystem carbon balance and the carbon sink stability varies under natural disturbances and forest management [1]. Climate change and large-scale disturbances, such as warming and drought, reduce forest biomass growth [2,3].
Diameter size also influences individual tree responses to climatic factors and disturbance events. Dominant individuals are more sensitive to drought [4] but can recover better from disturbances [5]. Managements that adjust diameter class differences such as close-to-nature silviculture usually maintain the growth advantage of large trees better [6]. Individuals with smaller initial diameters and faster growth rates before drought show higher resilience, but this effect will change over time [7]. Small trees contribute more steadily to forest growth and have a greater contribution to long-term carbon storage, sequestration, and forest climate resilience [8]. Tree diameter classes may be more heterogeneous as they respond to environmental conditions differently. We now should also focus on how smaller ones would perform under climate change.
Boreal forests in northern regions will face intensifying local drought conditions and accelerated climate warming under permafrost layer degradation [9] and increasing soil moisture evaporation [10]. In the northern part of China, the Greater Khingan Mountains region was considered as the south edge of boreal forests [11] and served as a crucial ecological barrier. Drought events occurred more frequently in the Greater Khingan Mountains from 1961 to 2012 [12]. Under such a background, the forests’ net primary productivity will reduce, and forest decline will occur, leading to ecosystem shrinkage and severe degradation [13,14].
Larix gmelinii is the dominant tree species in northern forests in China [15]. The growth of Larix gmelinii is extremely sensitive to climate conditions [16], influenced by latitude [17], and has shown significant changes in growth trends under warmer and drier climatic conditions [18]. Under higher temperatures, growth patterns even vary within the same area. In high-latitude regions, the growth of larch is promoted, while in middle- and low-latitude regions, it was suppressed by drought events caused by high-temperature summers [17,19]. Larix gmelinii showed a positive correlation with the mean annual temperature [20], while with the increasing temperature leading to water stress, the growth of dominant larch individuals was suppressed [21]. With varied responses in different regions and sizes, it is important to look into whether the growth differences caused by a size difference could balance the slowing growth contribution of large trees to the forest.
To clarify the growth characteristics of Larix gmelinii across different diameter classes and how climate change affects the biomass dynamics, we focused on Larix gmelinii in the Greater Khingan Mountains. We reconstructed historical diameters based on tree rings and field data. Utilizing allometric growth equations, we derived historical biomass dynamics and the quantified growth dynamics of L. gmelinii through resilience in different diameter classes, and aimed to uncover the influence of climate change on the aboveground biomass growth contributions of various sizes. We hypothesized that:
  • In the southern part of the study area, droughts would suppress the growth of larches, while in the northern part, growth will be prompted by droughts.
  • Larger trees will suffer from droughts, but smaller trees could maintain stand growth after a drought event.
  • Multiple droughts will lead to larch aboveground biomass growth reduction in the study area.

2. Materials and Methods

2.1. Study Area

The research area locates in the Greater Khingan Mountains region in northeastern China (120°26′38.38″–126°30′22.12″ E, 47°31′34.67″–53°22′03.16″ N) (Figure 1). The soil type of this area is brown coniferous forest soil [22]. The vegetation community structure in this area is relatively uniform, with associated tree species including Betula platyphylla and Pinus sylvestris. We set twenty-six pure Larix gmelinii forest plots to analyze the impact of drought events. Each sample plot had a radius of 17.85 m and covered an area of 0.1 hectares. The elevation of these sample plots ranged from 300 to 1000 m above sea level, with the coldest monthly average temperature ranging from −29.5 to −22.6 °C and the warmest monthly average temperature ranging from 15.9 to 19.6 °C.

2.2. Field and Laboratory Measurements

Within the established circular sample plots, individuals with a diameter at breast height (DBH) that is greater than or equal to 5 cm were systematically measured clockwise. The following information was recorded for each individual: tree species, DBH, tree height, angle, and distance from the plot center. Additionally, at breast height (1.3 m above ground level), tree core samples were collected. These core samples were naturally air-dried in the laboratory, securely fastened to wooden mounts, and assigned unique identification numbers. The tree ring widths were measured using the LinTab 5 (RINNTECH, Heidelberg, DE, www.rinntech.com (accessed on 24 May 2021)) tree ring width measurement instrument, with a measurement accuracy of up to 0.01 mm. To ensure the accuracy of dating and measurements, the COFECHA software [23] was employed to perform correlation tests on 26 sample sequences within the study sites (Table 1). This process helped ensure precise dating, and only tree core samples with clear and reliable tree rings were selected for further analysis. We then used reconstructed historical DBH data as the initial DBH before the disturbance events for resilience analyses. Please refer to Table 2 for the specific characteristics of the tree core samples.

2.3. Statistical Analysis Methods

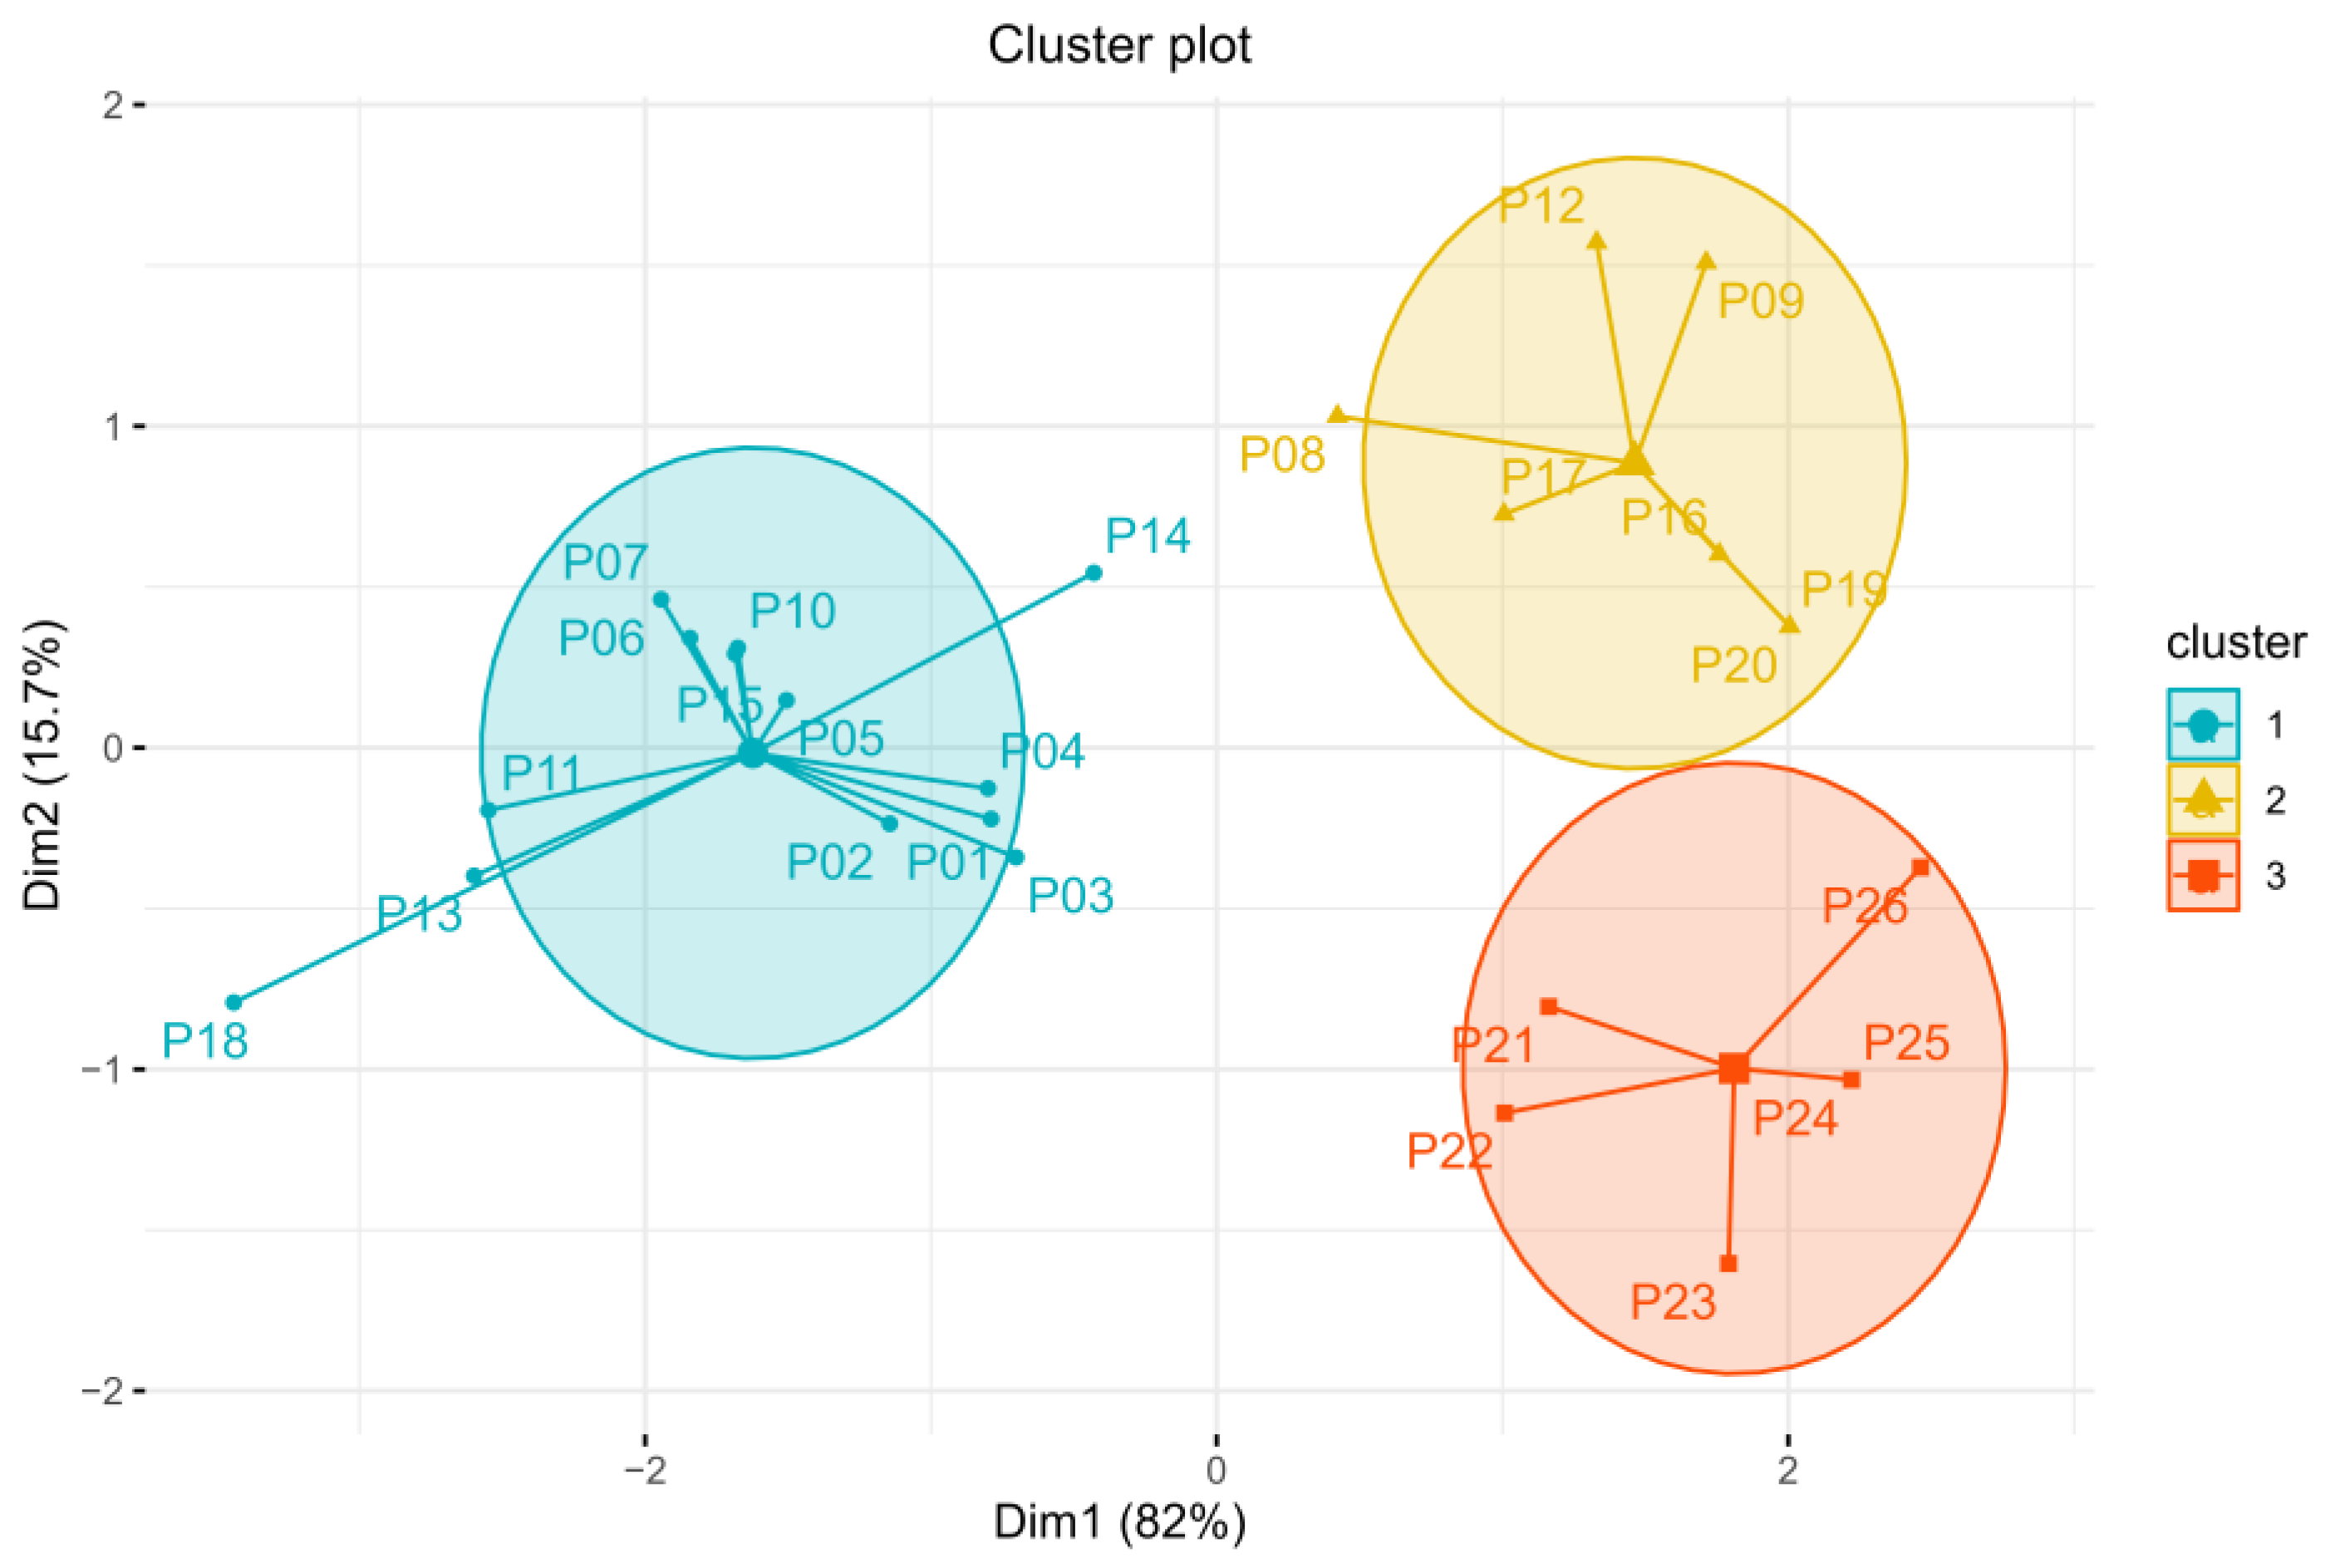
2.3.1. Drought Events Selection and Region Partition

The growing season of L. gmelinii is from May to September [24]. We chose the historical average 3-month Standardized Precipitation Evapotranspiration Index (SPEI-3) [12,24,25] to measure drought intensity and determine the drought events of the study area. Drought data were downloaded from the Royal Netherlands Meteorological Institute (KNMI) website (https://climexp.knmi.nl (accessed on 26 September 2021)) and used Climatic Research Unit (CRU) Time-Series (TS) version 4.03 of high-resolution (0.5 × 0.5 degree) gridded data of month-by-month variation in the climate. Drought events are classified into five levels [25]. The threshold of drought was set to −0.5. We selected a period that started from the year 1984, when the local climate showed an increasing trend [26], to 2017. There are two main drought events that happened in 1999 and 2007, and we will discuss the resilience separately to avoid the first drought disrupting the plant responses during the subsequent drought occurrences. To explore the drought patterns in each plot, we calculated the characteristics based on the theory of runs in R (Version 4.2.3, Vienna, Austria) [17,27]. Scaled drought characteristics (drought number, duration, intensity, and peaks) were chosen to cluster plots in the study area. We chose the year that had a growth season SPEI below −0.5 as the drought year between 1984 and 2017 in each plot, and the time when SPEI dropped below −0.5 and then returned above −0.5 was the drought duration. During the drought duration, the absolute cumulative SPEI was the drought intensity, and the minimum absolute SPEI was the drought peak. We used factoextra package (version 1.07) to perform cluster analysis on the SPEI of each plot to divide the study area into 3 regions with different drought severities by the ward.D method (Table 3).

2.3.2. Reconstruction of Historical AGB

Based on the reconstructed historical diameter at breast height (DBH) data, we performed diameter class separation. This involved calculating the annual DBH of each tree and categorizing it into 2-cm diameter classes. We then integrated these data with the corresponding aboveground biomass increments to determine the specific growth performance of L. gmelinii within each diameter class annually. This approach allowed us to eliminate the influence of changes in growth rates during individual growth processes and investigate the dynamic contributions of different diameter classes to the total growth during the study period.
Using the historical DBH data, we employed the aboveground biomass formulas to calculate the aboveground biomass and growth increment of larches in the study plots [28].
Aboveground biomass calculation for Larix gmelinii:
ML = 0.11270 × D2.39582 (D ≥ 5 cm)
ML = 0.18254 × D2.09620 (D < 5 cm)
ML stands for the aboveground biomass of Larix gmelinii and D stands for the diameter.

2.3.3. Size-Different AGB Response to Drought Events

The response of L. gmelinii growth to disturbance events can be assessed by calculating resistance, recovery, and resilience, which reflect the trends in growth changes under extreme climatic disturbance events. A resistance value greater than 0.75 is considered a strong resistance to disturbance events, while a recovery value greater than 1.25 indicates strong recovery ability. When the resilience is less than 1.0, it is considered that the growth cannot recover to the pre-disturbance state [29].
Resistance Rt = Dr/PreDr
Recovery Rc = PostDr/Dr
Resilience Rs = PostDr/PreDr
Dr stands for the average AGB growth of Larix gmelinii during the disturbance period; PreDr stands for the average growth before the disturbance occurred; and PostDr represents the average growth afterwards. In this study, we chose the before and afterwards stage as the same length as the disturbance period.
To explore how trees in different sizes respond to drought events, we combined the initial DBH pre-drought and their resilience and used Pearson correlation to test the relationship between pre-drought size and resilience to corresponding drought events through the ggpubr package in R language (version 0.6.0) [30].
Large trees are believed to be more vulnerable to droughts and play a crucial role in forest growth; however, there are three common definitions for large trees [31]: the 99th percentile method (selecting the largest 1% of individuals in the population with a diameter at breast height of ≥1 cm), fixed diameter threshold (the specific threshold varies with tree species and forest types, with a common threshold being ≥20 cm in cold regions [32], and large diameter class threshold (individuals reaching this specific diameter class must collectively contribute to more than half of the live aboveground biomass). With resilience showing the growth potential of different diameter classes, the growth dynamics after the droughts of stands constituted by diverse individuals is uncertain. To investigate the contributions of large and small trees to the overall growth of Larix gmelinii, we selected the top 10% of individuals with the largest size from the historical population as the large tree group (Group L), and the bottom 10% of individuals with the smallest size as the small tree group (Group S). In this paper, Group L refers to individuals with a diameter class larger than 30 cm, while Group S refers to individuals with a diameter class smaller than 8 cm. The data analysis was completed in R version 4.2.3 [33]. We also completed ARIMA analysis using the astsa package (version 2.0) to forecast the AGB growth trend in the future and examine whether small trees could compensate for the loss of large trees.
The Growth Dominance Coefficient (GDC) reflects the relative contributions of different-sized individuals to the total growth in a stand [34,35]. It can represent the stage of forest development and can be calculated by the difference between the cumulative biomass increment Gini coefficient (GCis) and the cumulative biomass Gini coefficient (GCs).
GDC = GCis − GCs
GC = i = 1 n j = 1 n | x i x j | 2 n ( n 1 ) x -
xi and xj represent the cumulative aboveground biomass or cumulative aboveground biomass increment of the i-th and j-th trees among the n trees in the stand.

3. Results

3.1. Stand Age of the Study Area

The EPS of 22 plots is above 0.85, which shows that the results are reliable. The larch forests in the study area were mainly young and middle-aged forests, with an average age of 60 years, and the lowest average age of the sample plots was 21 years and the longest average age of the sample plots reached 129 years (Table 2).

3.2. Size-Different Relationship between Aboveground Biomass Growth and Drought Severity

3.2.1. Drought Characteristics of Each Region

With a decreasing latitude, the drought level of the Greater Khingan Mountains increased, and the southern regions experienced even more severe aridity. According to the clustering result (Figure 2), plots located differently show three main drought patterns in the study period. The plots in Cluster 1 (referred to as Region I) went through the mildest drought in all three regions, Cluster 2 (Region II) showed a relatively moderate drought condition, and the plots in Cluster 3 (Region III) suffered the most under severe drought (Figure 2). The plots in the first cluster had the smallest drought number, shortest drought duration, mildest drought intensity, and lowest drought peaks. The plots in the second cluster had the highest drought number while the duration, severity, and peaks showed a moderate level. The plots in the third cluster had the longest duration, highest peaks, and the most severe drought events. The drought severity of Region I was 7.67, while in Region III the severity reached 12.35. The drought peaks in Region I indicated drought events which never reached a severe level, while in Region III, which had an average peak of 1.93, extreme drought happened. There were three clusters generated, sized 13, 7, and 6. The ratio of between the group sum of squares and the total sum of squares within is 80.4%, which shows a good fit.

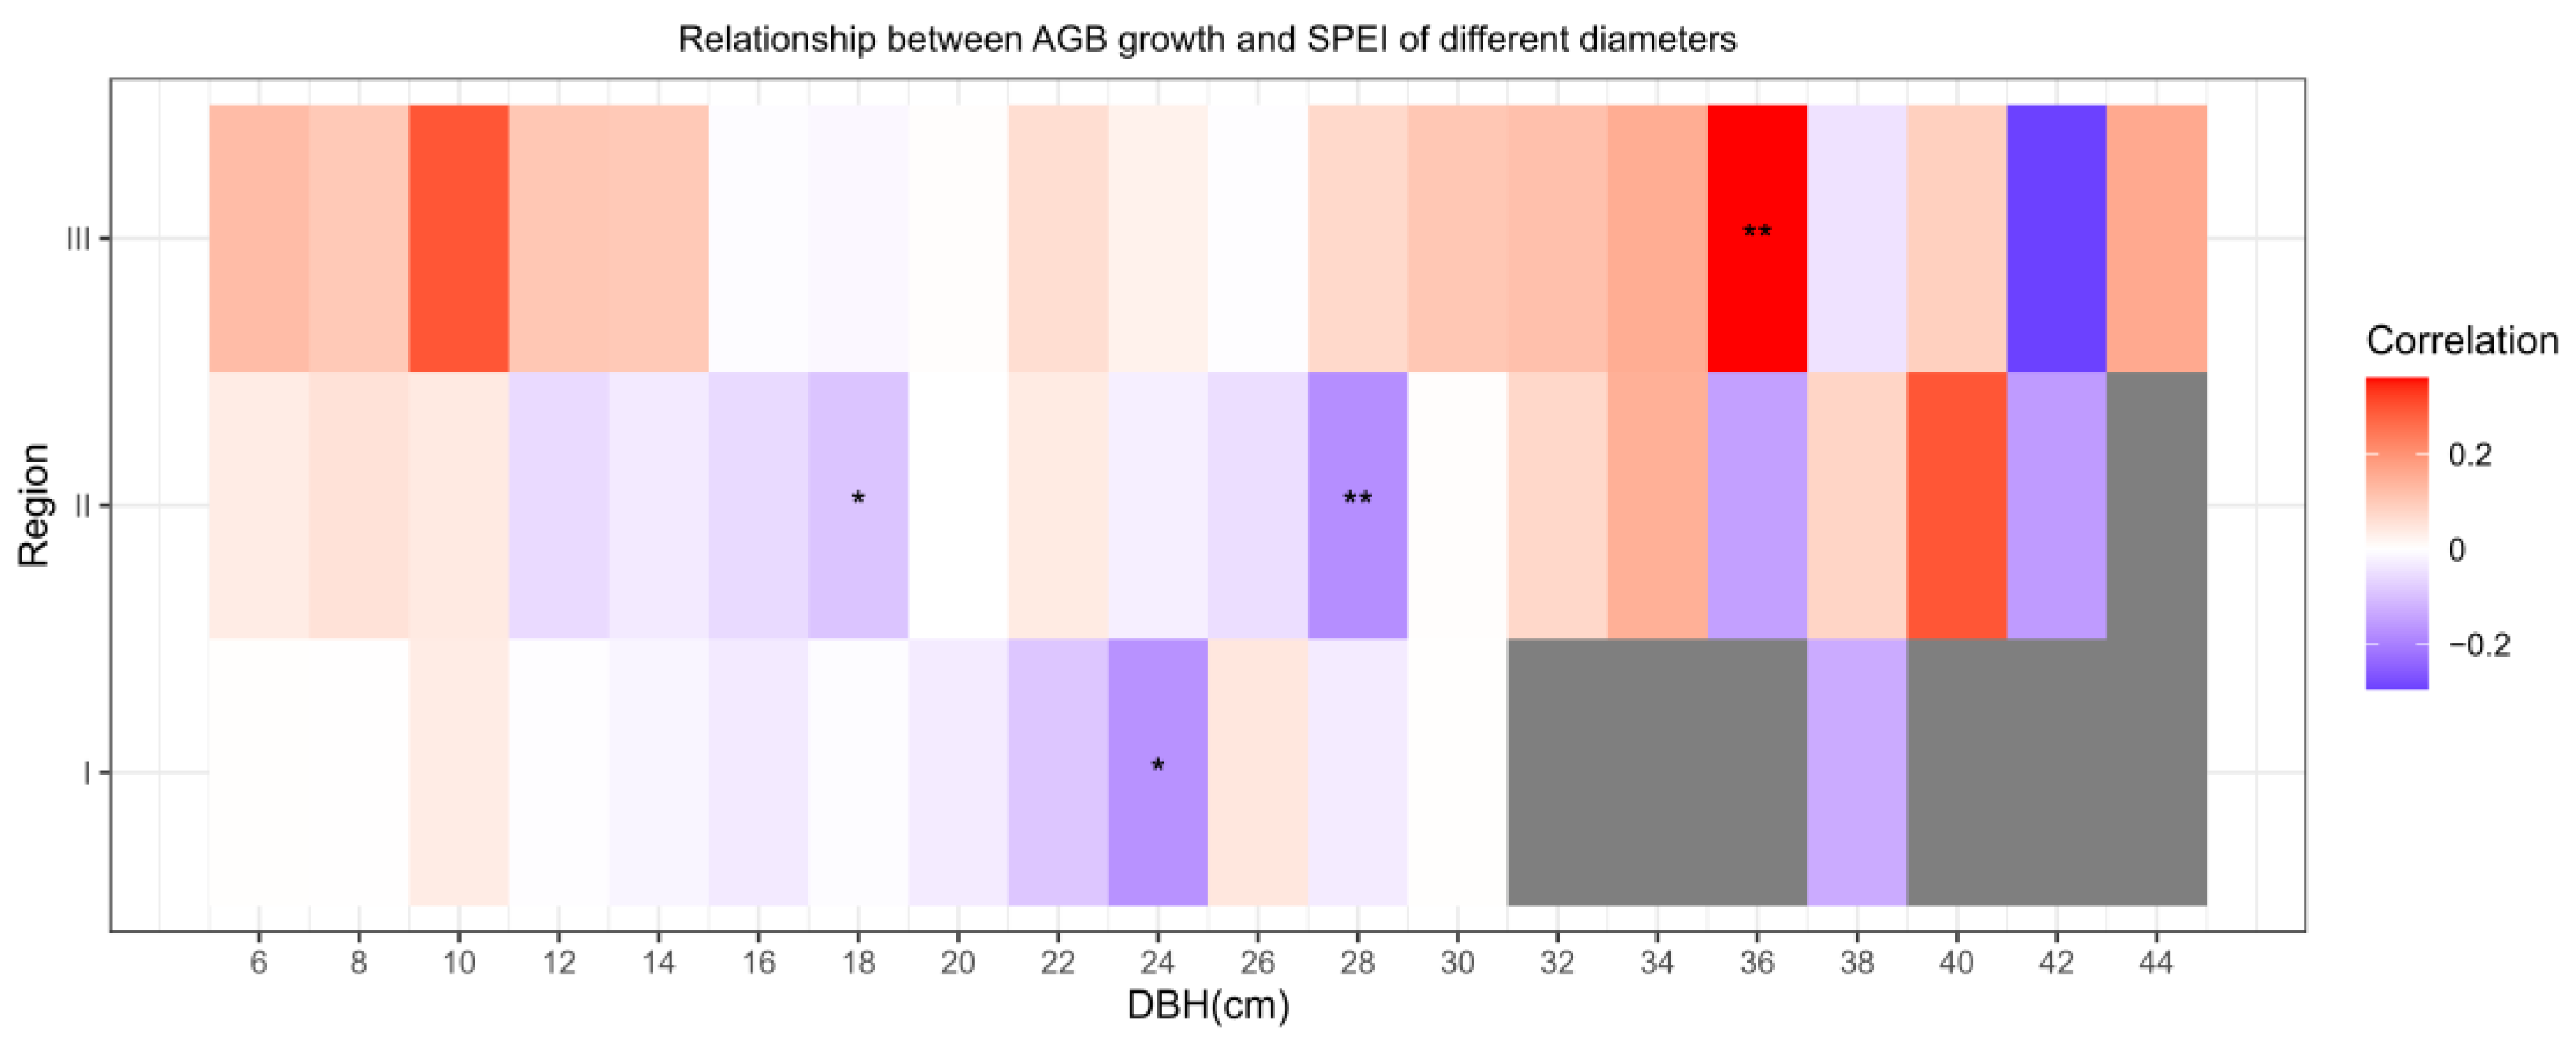
3.2.2. Size Affects Relationships between AGB Growth and Local SPEI

The tree growth response to drought varied along with their size, and the relationship between the growth and drought severity of each size showed different trends in three regions. For trees with a DBH class smaller than 18 cm, there was no significant correlation between the growth and local SPEI. In Region I, trees with a size of 24 cm displayed a negative correlation with the local SPEI (see Figure 3), indicating that the growth of larch of this size is promoted under drier conditions. In Region II, the growth of trees with sizes of 18 cm and 28 cm even increased while the drought conditions turned worse. Conversely, in Region III where the drought duration lasted longer, trees that had a DBH at a 36 cm level grow faster when the drought has gone down, and the water condition helps with large tree growth in drier places. Trees that are relatively large are more sensitive to the local drought condition.

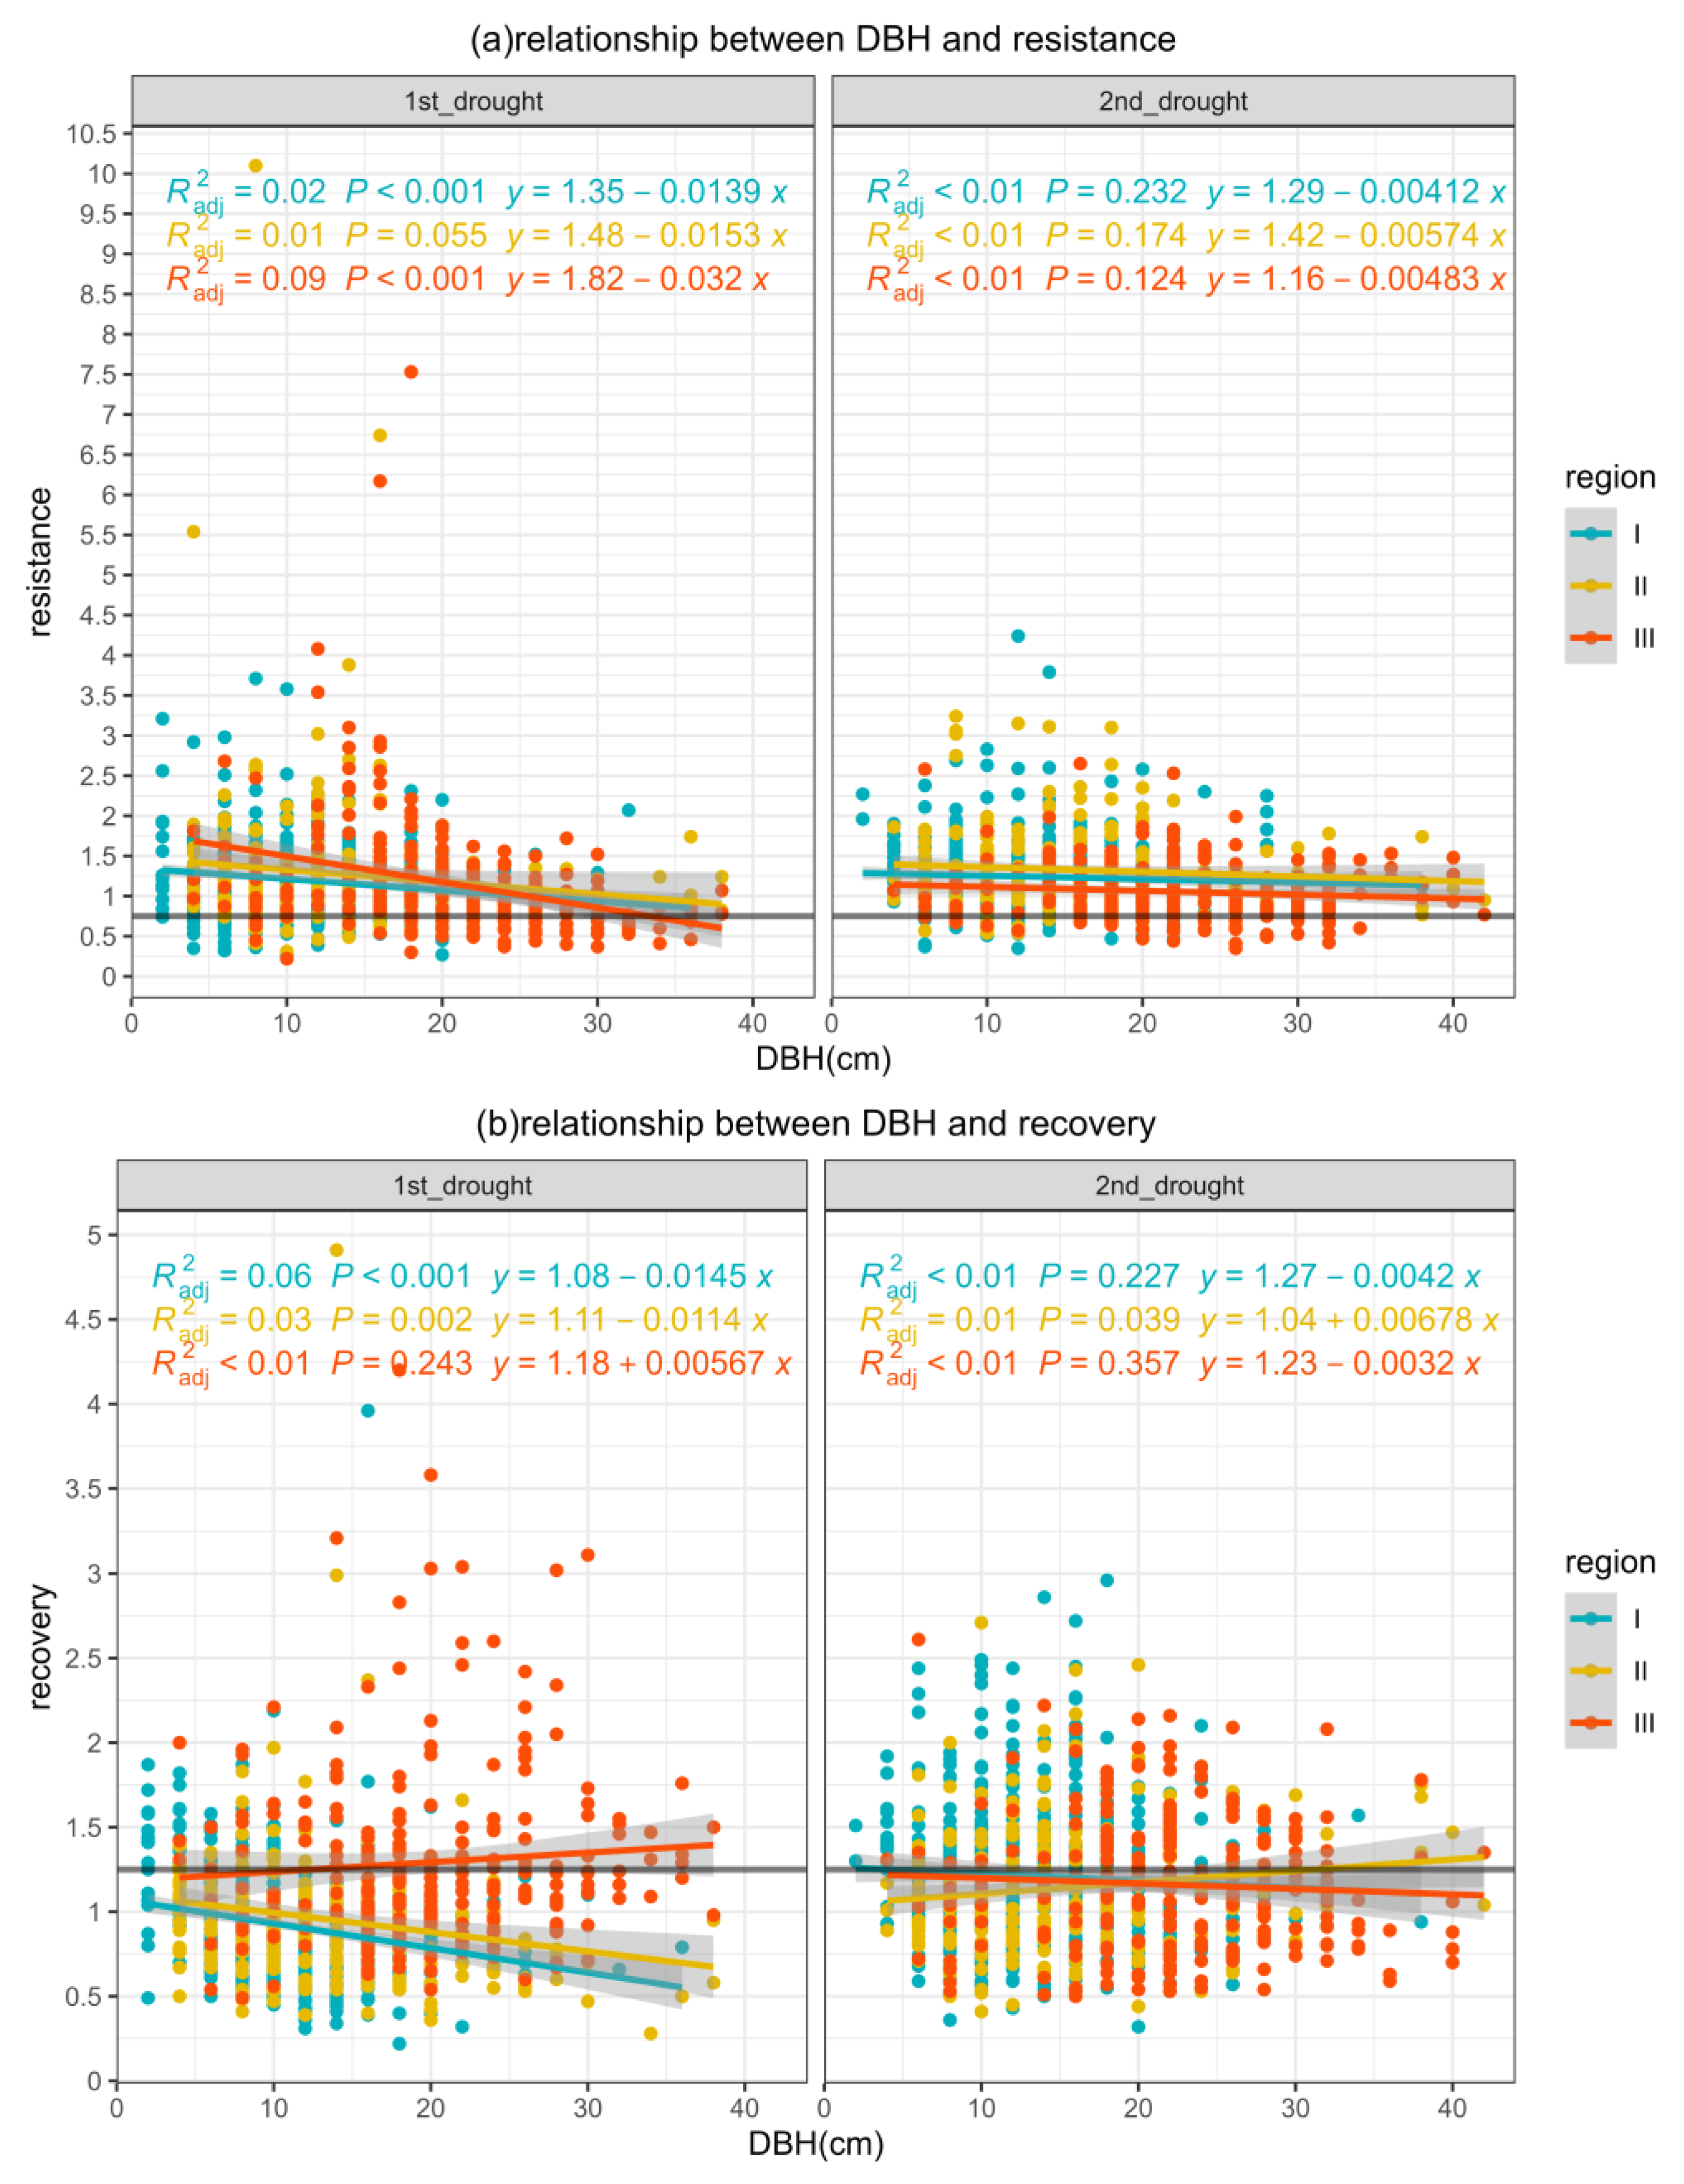
3.3. Size Affects Tree Resilience to Drought Events

With the growth response to drought severity varying in each diameter class, we further analyzed the relationships between the initial diameter class at the beginning of drought, and the resistance, recovery, and resilience under two drought events.

3.3.1. Resistance

The larch resistance was lowered when the size increased after the first drought, and the relationship disappeared after the second drought. During the first drought, both Region I and Region III exhibited a trend of decreasing resistance with the increasing diameter class (p < 0.05). Smaller-diameter individuals showed higher resistance. In Region III, individuals with a DBH above 34 cm displayed lower resistance and could not reach the 0.75 threshold (see Figure 4a(1st_drought)). After the second drought event, the correlation between the initial diameter class and resistance disappeared, but the resistance values remained above 0.75. All diameter classes in the three regions displayed strong resistance to drought, and the growth during the disturbance period was close to the pre-disturbance levels (see Figure 4a(2nd_drought)).

3.3.2. Recovery

Small trees recovered better after the first drought. Following an increase in the diameter class, both Region I and Region II showed a significant decrease in recovery (p < 0.05) after the first drought event. Regarding growth after the first drought, most diameter classes were unable to surpass their growth levels during the first drought. In Region III, recovery was not significantly related to the initial DBH, and most diameter ranges had strong recovery, with values exceeding 1.25 (see Figure 4b(1st_drought)). After the second drought event, only Region II exhibited a significant positive correlation between the initial DBH and recovery (p < 0.05) (see Figure 4b(2nd_drought)). Larger-diameter individuals with an initial DBH greater than 30 cm displayed stronger recovery. In Region I and III, there was no significant correlation between the initial DBH and recovery, but the recovery values remained above 1.0, although not reaching the 1.25 threshold. After the second drought, the post-disturbance growth approached the growth during the disturbance.

3.3.3. Resilience

After the first drought, large trees’ growth decreased while the small tree growth level increased. Resilience fell with enlarged tree size, which exhibited a negative correlation with the initial DBH during the first drought event (p < 0.05). As the severity of the drought increased, smaller trees showed higher resilience. In Region I, only individuals with a DBH below 14 cm could recover their growth to pre-drought levels (see Figure 4c(1st_drought)). In Region III, individuals with a DBH below 30 cm were able to reach their pre-drought growth levels after drought. After the second drought event, most growth levels in all three regions achieved pre-disturbance levels, with resilience values exceeding 1.0. However, the correlation between the initial DBH and resilience weakened (p > 0.05) (see Figure 4c(2nd_drought)). Frequent droughts did not cause further growth decline.

3.4. Growth of Small Trees Cannot Compensate for Large Trees’ Growth Loss

With large trees failing to achieve their pre-drought growth level and small trees showing a resilience above 1.0, it is necessary to find out which group can decide forest growth. The Growth Dominance Coefficient showed the relative growth contributions of individuals compared to their size. The GDC in most plots was close to 0, indicating low competition and demonstrating that individual contributions to aboveground biomass growth were uniform. However, in specific plots like P03 and P14 with higher average ages, the GDC was less than −0.1, indicating that smaller trees contributed more due to a slowdown in large tree growth. The study area was primarily composed of young and middle-aged forests, and only eight plots followed the development pattern of large trees, which had a relatively greater growth contribution (GDC > 0). In contrast, 13 plots exhibited an early manifestation of low growth dominance (GDC < 0), whereas smaller-diameter trees contributed more to their biomass. Additionally, five plots initially showed low growth dominance and then reverted to GDC ≥ 0 (Figure 5). Plot P03, with the highest average age, consistently remained in the stage where smaller trees had a growth advantage. Small trees contributed more size-symmetrically in the study area.
To better connect tree growth actual contribution with their size in stands, instead of their relative contribution, we showed the rebuilt AGB growth dynamics of Group S (DBH class under 8 cm) and Group L (DBH class above 30 cm). Large trees had a more significant impact on the total growth of larch during the study period. Based on the predictions made by the ARIMA model, there was no apparent trend in the growth contribution of Group S and Group L in the next five years, as they remained stable (Figure 6a). The total aboveground biomass growth volume showed a different pattern of initially decreasing and then stabilizing at 3500 kg (Figure 6b). The increment in the aboveground biomass of Group S was considerably lower than that of individuals with a diameter class of above 8 cm, and the total growth during the latter period was less than 80 kg, which accounted for only less than 3% in the total stand AGB growth. The aboveground biomass growth of large-diameter individuals stayed at a relatively high level in the preceding five years, exceeding 1000 kg in the later period and contributing to more than 30% of the total stand AGB growth. Throughout the research period, the total growth of Group S in the study area remained consistently low, while the individuals of other diameter classes tended to maintain relatively high levels of future growth, far surpassing the increments of small trees.

4. Discussion

4.1. Response of Trees’ Growth in Different Sizes to Drought Events

Drought changed the growth pattern of different-sized Larix gmelinii in the Greater Khingan Mountains. The growth of large trees in Region III would increase with better water conditions but decrease in Region I and II (Figure 3). This conclusion is consistent with the previous findings that Larix gmelinii shows a decreasing trend in the southern and central parts of the Greater Khingan Mountains [19], but an increasing trend in the northern parts and permafrost areas [17,18]. Our results also showed that larch resistance is inversely related to diameter size in all three regions. Small Larix gmelinii individuals exhibited higher drought resilience. After the disturbance event, small trees can all recover to their pre-disturbance growth levels, whereas large-diameter individuals have lower resistance and resilience compared to small trees (Figure 4). This finding contradicts the notion proposed by Lloret [5] that larger individuals exhibit greater recovery. The growth of large trees dominates the upper canopy in the vertical structure and differs from that of smaller trees in the understory [31]. During the drought period, large trees experience growth suppression [36] while small trees can recover to their pre-drought growth levels and even be promoted [35]. Dominant trees rapidly occupy the forest canopy, leading to canopy closure [37] and shading effects [38]. This can alter the microclimate within the plot and mitigate the decline and mortality of nearby small trees during drought conditions. However, the water stress induced by rising temperatures is unfavorable for the growth of dominant individuals occupying the main forest canopy [21]. As a result, larches that had larger diameters exhibited lower resistance and resilience to drought events.

4.2. Tree Resilience under Multiple Drought Events

Low-intensity and continuous drought in the study area reduced the forest productivity [39]. Resilience decreased with the increasing diameter classes in all three regions after the first drought, and trees with larger diameters did not recover to the same growth level as before the drought events (Figure 4c(1st_drought)). After the second drought event, trees did not show further decline in resilience (Figure 4b) and displayed a recovery above 1.0 (Figure 4b(2nd_drought)). Continuous drought might not cause a further growth decline, but would still lead to a stand-level low growth increment. Due to drought legacy, trees might take approximately 16 years to recover [40]. In 2017, severe and extreme drought events occurred. Under these extremely dry conditions, large trees would wilt to reduce solar radiation and water evaporation [41]. This will further weaken the growth of large trees.

4.3. Stand-Level AGB Growth Dynamics under Frequent Droughts

After frequent drought events, the total aboveground biomass increment of Larix gmelinii is expected to slow down in the future [42]. Although smaller individuals had a relatively greater contribution during the study period with a GDC of less than 0 in many plots (Figure 5), the growth of large trees still had a greater impact on the total growth of larch, and large trees (Group L) retained a much higher growing level than smaller trees (Group S) (Figure 6). Large trees determine the growth of stands [43], but are more sensitive to droughts. Frequent droughts will result in homogeneous diameter class structures between different regions, with the northern regions exhibiting a lower growth dominance. The extreme drought event in 2018 led to a decrease in tree growth and redistributed the total forest growth to a state that favored small trees [44]. Under climate warming, the mortality rate of large trees has increased [4], and some seedlings might have a greater tendency to distribute to more northern areas [45]. In the future, the study area is likely to have a diameter structure that is dominated by smaller individuals. This, in turn, may lead to a decreased productivity and carbon sequestration capacity. With their more stable contribution to growth instead of canopy-dominating individuals, the roles of smaller trees are relatively greater compared to their proportion of aboveground biomass in forest volume, carbon sequestration, and climate resilience [8]. In the following forest management, we could improve the water availability of large trees in drier stands or maintain a more diverse diameter structure for larch forests to support forests in performing their functions better during drought events.

4.4. Prospects and Outlook

We compared the growth patterns of individuals within different diameter classes, while individuals of the same diameter class but different ages may still exhibit differences in productivity and other aspects. Research on Chinese fir in Guangxi by Huang Xiaorong showed that productivity did not increase with stand age and, in fact, had a negative effect [11]. The total aboveground biomass of larch increased with age [46], but the relationship between growth and age remains uncertain. Larix gmelinii growth tends to stabilize after reaching maturity, typically around 100 years of age [47]. Most of the forests in the Greater Khingan Mountains are in the young and middle-aged stages [48]. Although young forests have faster carbon sequestration efficiency compared to older forests, the average volume over large spatial and temporal scales is more critical for carbon flux [37], which means that forests in the study area still have a great potential in carbon sequestration. The data in this study only include results reconstructed from samples of standing trees in plots. Subsequent research could supplement historical biomass change data through records of L. gmelinii regeneration and mortality. Also, in this study we did not involve tree heights as a perspective, and comparing the productivity performance of individuals from different vertical layers within the same diameter class may better explain forest stand dynamics under climate change, helping us to make more accurate predictions about the overall changes in the stand level.

5. Conclusions

The study area is located in the south border of boreal forests and faces frequent droughts. In our study, we found that under the influence of two major drought events that occurred in 1999 and 2007, moderate droughts have stimulated the aboveground biomass growth of Larix gmelinii. Across all regions, large trees exhibit lower resistance and resilience compared to small trees, resulting in growth suppression. However, with an annual growth of less than 80 kg, small trees cannot fully compensate for the reduced growth of large trees. Large trees still play a dominant role in the growth of pure Larix gmelinii forests in the Greater Khingan Mountains. Under the future climate warming and frequent drying, the total aboveground biomass growth of Larix gmelinii in the Greater Khingan Mountains is expected to decline, which may lead to the larch forest area in China decreasing. These results provide a reference for future forest management practices and ideas to improve sustainable forest management in the context of frequent drought events. Future forest management could focus on improving water availability for large trees and further prompt small trees’ growth.

Author Contributions

Conceptualization, M.L. and L.G.; methodology, M.L.; investigation, M.L. and R.P.; writing—original draft preparation, M.L.; writing—review and editing, Y.Z. and L.G.; supervision, L.G.; funding acquisition, L.G. All authors have read and agreed to the published version of the manuscript.

Funding

This research was funded by the National Natural Science Foundation of China grant number 32371871 and the Key Project of National Key Research and Development Plan, grant number 2022YFD2201001-04.

Data Availability Statement

The data underlying this article cannot be shared publicly for the privacy of lab that participated in this study. The data will be shared on reasonable request to the corresponding author.

Conflicts of Interest

The authors declare no conflicts of interest. The funders had no role in the design of the study; in the collection, analyses, or interpretation of data; in the writing of the manuscript; or in the decision to publish the results.

References

  1. Pan, Y.; Birdsey, R.A.; Fang, J.; Houghton, R.; Kauppi, P.E.; Kurz, W.A.; Phillips, O.L.; Shvidenko, A.; Lewis, S.L.; Canadell, J.G.; et al. A Large and Persistent Carbon Sink in the World’s Forests. Science 2011, 333, 988–993. [Google Scholar] [CrossRef]
  2. Seidl, R.; Schelhaas, M.-J.; Rammer, W.; Verkerk, P.J. Increasing Forest Disturbances in Europe and Their Impact on Carbon Storage. Nat. Clim. Change 2014, 4, 806–810. [Google Scholar] [CrossRef]
  3. Fan, L.; Wigneron, J.-P.; Ciais, P.; Chave, J.; Brandt, M.; Sitch, S.; Yue, C.; Bastos, A.; Li, X.; Qin, Y.; et al. Siberian Carbon Sink Reduced by Forest Disturbances. Nat. Geosci. 2023, 16, 56–62. [Google Scholar] [CrossRef]
  4. Bennett, A.C.; McDowell, N.G.; Allen, C.D.; Anderson-Teixeira, K.J. Larger Trees Suffer Most during Drought in Forests Worldwide. Nat. Plants 2015, 1, 15139. [Google Scholar] [CrossRef] [PubMed]
  5. Lloret, F.; Keeling, E.G.; Sala, A. Components of Tree Resilience: Effects of Successive Low-Growth Episodes in Old Ponderosa Pine Forests. Oikos 2011, 120, 1909–1920. [Google Scholar] [CrossRef]
  6. Wang, Y.-X.; Zhang, S.-G.; Lu, Y.-C.; Meng, J.-H.; Zeng, J.; Bai, S.-B. Instant response of individual size inequality indices to thinning regimes in plantation. Ying Yong Sheng Tai Xue Bao 2014, 25, 1645–1651. [Google Scholar] [PubMed]
  7. Ovenden, T.S.; Perks, M.P.; Clarke, T.-K.; Mencuccini, M.; Jump, A.S. Life after Recovery: Increased Resolution of Forest Resilience Assessment Sheds New Light on Post-Drought Compensatory Growth and Recovery Dynamics. J. Ecol. 2021, 109, 3157–3170. [Google Scholar] [CrossRef]
  8. Hubau, W.; De Mil, T.; Van den Bulcke, J.; Phillips, O.L.; Angoboy Ilondea, B.; Van Acker, J.; Sullivan, M.J.P.; Nsenga, L.; Toirambe, B.; Couralet, C.; et al. The Persistence of Carbon in the African Forest Understory. Nat. Plants 2019, 5, 133–140. [Google Scholar] [CrossRef]
  9. Chen, S.; Zang, S.; Sun, L. Characteristics of Permafrost Degradation in Northeast China and Its Ecological Effects: A Review. Sci. Cold Arid. Reg. 2020, 12, 1–11. [Google Scholar]
  10. Burrell, A.L.; Sun, Q.; Baxter, R.; Kukavskaya, E.A.; Zhila, S.; Shestakova, T.; Rogers, B.M.; Kaduk, J.; Barrett, K. Climate Change, Fire Return Intervals and the Growing Risk of Permanent Forest Loss in Boreal Eurasia. Sci. Total Environ. 2022, 831, 154885. [Google Scholar] [CrossRef] [PubMed]
  11. Huang, X. Relationship between Plant Functional Diversity and Productivity of Pinus Massoniana Plantations in Guangxi. Biodivers. Sci. 2018, 26, 690. [Google Scholar] [CrossRef]
  12. Sun, B.F.; Zhao, H.; Wang, X.K. Spatiotemporal Characteristics of Drought in Northeast China Based on SPEI. Ecol. Environ. Sci. 2015, 24, 22–28. [Google Scholar] [CrossRef]
  13. Choat, B.; Jansen, S.; Brodribb, T.J.; Cochard, H.; Delzon, S.; Bhaskar, R.; Bucci, S.J.; Feild, T.S.; Gleason, S.M.; Hacke, U.G.; et al. Global Convergence in the Vulnerability of Forests to Drought. Nature 2012, 491, 752–755. [Google Scholar] [CrossRef] [PubMed]
  14. Gao, Y.; Zhao, H.; Gao, F.; Zhu, H.; Qu, H.; Zhao, F. Climate Change Trend in Future and Its Influence on Wetlands in the Greater Khingan Mountains. J. Glaciol. Geocryol. 2016, 38, 47–56. [Google Scholar]
  15. Yiliang, Z. Vegetation Geography in Northeast China; Science Press: Beijing, China, 1997. [Google Scholar]
  16. Kajimoto, T.; Matsuura, Y.; Osawa, A.; Prokushkin, A.S.; Sofronov, M.A.; Abaimov, A.P. Root System Development of Larix Gmelinii Trees Affected by Micro-Scale Conditions of Permafrost Soils in Central Siberia. In Roots: The Dynamic Interface between Plants and the Earth: The 6th Symposium of the International Society of Root Research, 11–15 November 2001, Nagoya, Japan; Abe, J., Ed.; Developments in Plant and Soil Sciences; Springer Netherlands: Dordrecht, The Netherlands, 2003; pp. 281–292. ISBN 978-94-017-2923-9. [Google Scholar]
  17. Zhang, P.; Liu, B. Effect of Climate Change on Larix Gmelinii Growth in Different Latitudes. J. Northeast. For. Univ. 2015, 43, 10–13. [Google Scholar]
  18. Chang, Y.; Chen, Z.; Zhang, X.; Bai, X.; Zhao, X.; Li, J.; Lu, X. Responses of Radial Growth to Temperature in Larix Gmelinii of the Da Hinggan Ling under Climate Warming. Chin. J. Plant Ecol. 2017, 41, 279–289. [Google Scholar]
  19. Jiang, Y.; Zhang, J.; Han, S.; Chen, Z.; Setälä, H.; Yu, J.; Zheng, X.; Guo, Y.; Gu, Y. Radial Growth Response of Larix Gmelinii to Climate along a Latitudinal Gradient in the Greater Khingan Mountains, Northeastern China. Forests 2016, 7, 295. [Google Scholar] [CrossRef]
  20. Dapao, Y.; Shunzhong, W. Relationship between tree-ring chronology of Larix olgensis in Changbai Mountains and the climae change. Chin. J. Appl. Ecol. 2005, 16, 14. [Google Scholar]
  21. McDowell, N.G.; Allen, C.D. Darcy’s Law Predicts Widespread Forest Mortality under Climate Warming. Nat. Clim. Change 2015, 5, 669–672. [Google Scholar] [CrossRef]
  22. Yang, L.B.; Sui, X.; Wei, D.; Cui, F.X.; Zhu, D.G.; Ni, H.W. Fungal diversity in the brown coniferous forest soils of Daxing’anling Mountains, Northeast China. Chin. J. Appl. Ecol. 2019, 30, 3411–3418. [Google Scholar] [CrossRef]
  23. Holmes, R.L. Computer-assisted quality control in tree-ring dating and measurement. Tree-Ring Bull. 1983, 43, 51–67. [Google Scholar]
  24. Yindelehei, B.A.; Xiang, B.A.O.; Mei, Z.; Pengwu, Z.; Liang, S.H.I.; Liangjie, H.A. Temporal and Spatial Variation Characteristics of Vegetation Cover on the Northern Slope of Daxing’anling Based on MODIS NDVI. For. Resour. Wanagement 2018, 6, 50. [Google Scholar] [CrossRef]
  25. National Climate Center; China Meteorological Administration Bureau of Forecasting and Network; China Meteorological Bureau Lanzhou Institute of Arid Meteorology Grades of Meteorological Drought 2018. Available online: https://www.nssi.org.cn/nssi/front/107243850.html (accessed on 26 September 2021).
  26. Pang, R.; Liu, M.; Gao, L.; Li, S.; Han, X. Dynamic Study on Probability Distribution Zone of Larix Gmelinii Forest Based on Species Distribution Model. J. Northwest For. Univ. 2023, 38, 1–9. [Google Scholar] [CrossRef]
  27. Guerrero-Salazar, P.L.A.; Yevjevich, V.M. Analysis of Drought Characteristics by the Theory of Runs. Ph.D. Thesis, Colorado State University, Fort Collins, CO, USA, 1975. [Google Scholar]
  28. State Forestry Administration of China. Tree biomass models and related parameters to carbon accounting for Larix 2016. Available online: https://www.nssi.org.cn/nssi/front/106651533.html (accessed on 12 October 2021).
  29. Qibing, Z.; Ouya, F.; Lixin, L. Dendroecological Studies on the Tibetan Plateau; Science Press: Beijing, China, 2019; ISBN 978-7-03-062181-8. [Google Scholar]
  30. Kassambara, A.; Kassambara, M.A. Package ‘Ggpubr’, R package version 0.1.; R Team: Viena, Austria, 2020; Volume 6. [Google Scholar]
  31. Ali, A.; Wang, L.-Q. Big-Sized Trees and Forest Functioning: Current Knowledge and Future Perspectives. Ecol. Indic. 2021, 127, 107760. [Google Scholar] [CrossRef]
  32. Baltzer, J.L.; Veness, T.; Chasmer, L.E.; Sniderhan, A.E.; Quinton, W.L. Forests on Thawing Permafrost: Fragmentation, Edge Effects, and Net Forest Loss. Glob. Change Biol. 2014, 20, 824–834. [Google Scholar] [CrossRef]
  33. R Core Team. R: A Language and Environment for Statistical Computing; R Team: Viena, Austria, 2013. [Google Scholar]
  34. Binkley, D. A Hypothesis about the Interaction of Tree Dominance and Stand Production through Stand Development. For. Ecol. Manag. 2004, 190, 265–271. [Google Scholar] [CrossRef]
  35. Pretzsch, H.; Schütze, G.; Biber, P. Drought Can Favour the Growth of Small in Relation to Tall Trees in Mature Stands of Norway Spruce and European Beech. For. Ecosyst. 2018, 5, 20. [Google Scholar] [CrossRef]
  36. Bréda, N.; Granier, A.; Aussenac, G. Effects of Thinning on Soil and Tree Water Relations, Transpiration and Growth in an Oak Forest (Quercus petraea (Matt.) Liebl.). Tree Physiol. 1995, 15, 295–306. [Google Scholar] [CrossRef] [PubMed]
  37. Hessburg, P.F.; Charnley, S.; Wendel, K.; White, E.M.; Singleton, P.H.; Peterson, D.W.; Halofsky, J.E.; Gray, A.N.; Spies, T.A.; Flitcrof, R.L. The 1994 Eastside Screens Large-Tree Harvest Limit: Review of Science Relevant to Forest Planning 25 Years Later; United States Department of Agriculture, Forest Service Pacific Northwest: Portland, OR, USA, 2020. [Google Scholar]
  38. Pretzsch, H.; Biber, P. Size-Symmetric versus Size-Asymmetric Competition and Growth Partitioning among Trees in Forest Stands along an Ecological Gradient in Central Europe. Can. J. For. Res. 2010, 40, 370–384. [Google Scholar] [CrossRef]
  39. Lucash, M.S.; Scheller, R.M.; Sturtevant, B.R.; Gustafson, E.J.; Kretchun, A.M.; Foster, J.R. More than the Sum of Its Parts: How Disturbance Interactions Shape Forest Dynamics under Climate Change. Ecosphere 2018, 9, e02293. [Google Scholar] [CrossRef]
  40. Li, Y.; Zhang, Q.-B.; Fang, O.; Mu, Y.-M.; Jia, H.; Lyu, L. Recovery Time of Juniper Trees Is Longer in Wet than Dry Conditions on the Tibetan Plateau in the Past Two Centuries. For. Ecol. Manag. 2021, 497, 119514. [Google Scholar] [CrossRef]
  41. An, Y.-Y.; Liang, Z.-S. Staged strategy of plants in response to drought stress. Chin. J. Appl. Ecol. 2012, 23, 2907–2915. [Google Scholar] [CrossRef]
  42. Sánchez-Pinillos, M.; D’Orangeville, L.; Boulanger, Y.; Comeau, P.; Wang, J.; Taylor, A.R.; Kneeshaw, D. Sequential Droughts: A Silent Trigger of Boreal Forest Mortality. Glob. Change Biol. 2022, 28, 542–556. [Google Scholar] [CrossRef] [PubMed]
  43. Yuan, Z.; Ali, A.; Sanaei, A.; Ruiz-Benito, P.; Jucker, T.; Fang, L.; Bai, E.; Ye, J.; Lin, F.; Fang, S.; et al. Few Large Trees, Rather than Plant Diversity and Composition, Drive the above-Ground Biomass Stock and Dynamics of Temperate Forests in Northeast China. For. Ecol. Manag. 2021, 481, 118698. [Google Scholar] [CrossRef]
  44. Bose, A.K.; Rohner, B.; Bottero, A.; Ferretti, M.; Forrester, D.I. Did the 2018 Megadrought Change the Partitioning of Growth between Tree Sizes and Species? A Swiss Case-Study. Plant Biol. 2022, 24, 1146–1156. [Google Scholar] [CrossRef]
  45. Ni, M.; Vellend, M. Space-for-Time Inferences about Range-Edge Dynamics of Tree Species Can Be Influenced by Sampling Biases. Glob. Change Biol. 2021, 27, 2102–2112. [Google Scholar] [CrossRef]
  46. Wang, F.; Ye, D.-M.; Zang, C.-F.; Zhang, Q.-L. Tree Biomass Distribution of Larix Gmelinii in Daxing’anling Mountains of Inner Mongolia. J. Northwest For. Univ. 2017, 32, 23–28. [Google Scholar] [CrossRef]
  47. Jin, Y.; Li, J.; Bai, X.; Zhao, Y.; Cui, D.; Chen, Z. High Temperatures Constrain Latewood Formation in Larix Gmelinii Xylem in Boreal Forests. Glob. Ecol. Conserv. 2021, 30, e01767. [Google Scholar] [CrossRef]
  48. Hu, H.Q.; Luo, B.Z.; Wei, S.J.; Wei, S.W.; Wen, Z.M.; Sun, L.; Luo, S.; Wang, L.M.; Ma, H.B. Estimating Biological Carbon Storage of Five Typical Forest Types in the Daxing’anling Mountains, Heilongjiang, China. Acta Ecol. Sin. 2015, 35, 5745–5760. [Google Scholar]
Figure 1. Locations of 26 pure Larix gmelinii forest sites in the Greater Khingan Range, China, and the area of each plot is 0.1 hectare. The numbering increases with latitude and longitude.
Forests 15 00448 g001
Figure 2. Plots clustering result according to drought characteristics.
Forests 15 00448 g002
Figure 3. Relationships between AGB growth of different diameter classes (cm) (x-axis) and SPEI in each region (I, II, III). Red to blue stand for positive correlation to negative correlation. * stands for p-value less than 0.05, ** stands for p-value less than 0.01.
Forests 15 00448 g003
Figure 4. Relationships between DBH and growth resilience after two drought events: 1st_drought stands for drought events that started at around 1999, 2nd_drought stands for drought events that started at around 2007. (a) Relationships between DBH and resistance; (b) Relationships between DBH and recovery; (c) Relationships between DBH and resilience.
Forests 15 00448 g004aForests 15 00448 g004b
Figure 5. Growth dominance dynamics in each plot.
Forests 15 00448 g005
Figure 6. (a) Growth contribution of Group S and Group L and total aboveground biomass growth over the next 5 years showed plateauing trend; (b) stand AGB growth pattern during study period. The red hollow dots and lines stand for future 5 years changing pattern and the grey area stands for the prediction interval.
Forests 15 00448 g006
Table 1. Plots information.
PlotsLongitude (E)Latitude (N)Elevation/mSlope/°Slope
Direction
Density/n·hm−2Mean DBH/cmMean Height/m
P01122°41′28.88″53°22′3.16″522.63southwest59018.524.7
P02121°45′35.84″53°19′20.97″670.318southwest106015.522.9
P03121°24′2.67″53°1′22.07″436.33northeast47018.121.6
P04122°33′16.06″52°54′0.90″498.58northeast79019.426.6
P05123°20′1.81″52°51′25.90″567.42north54016.326.2
P06125°0′58.02″52°30′19.40″368.37southeast72018.718.6
P07125°51′19.44″52°27′27.90″370.62southeast49013.914.5
P08122°23′32.41″52°18′43.58″741.522south88016.422.3
P09121°27′1.31″52°15′57.03″690.713west95012.821.3
P10124°3′3.28″52°9′8.07″506.82northeast6409.110.1
P11124°56′20.70″52°2′15.05″481.32north71013.513.6
P12121°30′36.51″50°56′22.80″850.212south49022.229
P13126°30′22.12″51°47′4.43″283.33southeast69016.315.9
P14120°50′24.53″51°58′0.16″483.26northeast50023.113.9
P15123°52′56.99″51°36′38.95″7213northeast49015.612.2
P16125°44′4.35″51°21′7.70″405.117southwest5001726.8
P17120°26′38.38″51°27′38.35″589.710southwest53025.417.8
P18124°41′11.50″51°32′28.00″560.53northeast5309.917.4
P19121°53′29.55″50°43′14.47″822.59southeast64021.220.8
P20122°10′8.93″51°21′31.38″855.523east8101324.5
P21122°31′0.17″50°7′11.62″572.61south30025.329.3
P22122°26′54.67″49°31′15.08″590.82southeast26030.533.9
P23121°20′10.55″48°30′52.53″99710west34031.214.8
P24121°14′22.65″47°57′11.19″755.611north54022.417.9
P25121°22′43.57″47°31′53.92″610.818northeast40025.415.6
P26120°38′33.79″47°31′34.67″1087.712northeast67020.517.6
Table 2. Tree ring characteristics.
PlotsSample DepthCommon
Interval
Mean Correlation Coefficient between TreesExpressed
Population
Signal
Signal Noise RatioMean Stand Age at Breast Height
P01591954–20120.530.9732.145
P021061978–20150.440.9843.444
P03471988–20160.310.9518.9383
P04791991–20160.240.9313.0649
P05541995–20160.60.9981.540
P06721985–20160.310.887.0824
P07491969–20120.610.9970.9635
P08881997–20160.110.742.8849
P09951992–20160.30.9727.9350
P10641980–20160.150.845.0821
P11711982–20130.420.9626.8137
P12501991–20130.20.824.631
P13691958–20160.610.9855.0439
P14491968–20160.360.9314.07129
P15531984–20160.60.9845.931
P16531975–20160.370.9727.7537
P17811991–20160.760.9737.4948
P18501937–20160.650.9518.847
P19492000–20160.480.9729.7861
P20641975–20140.680.9847.0649
P21301977–20160.460.9731.7129
P22261984–20150.710.9860.6237
P23341904–20160.290.9211.638
P24541983–20140.190.845.145
P25401976–20160.640.9622.8645
P26671975–20160.720.9855.1448
Table 3. Drought classification according to SPEI.
Drought LevelDrought IntensitySPEI
1Non-drought−0.5 < SPEI
2mild−1.0 < SPEI ≤ −0.5
3moderate−1.5 < SPEI ≤ −1.0
4severe−2.0 < SPEI ≤ −1.5
5extremeSPEI ≤ −2.0
Disclaimer/Publisher’s Note: The statements, opinions and data contained in all publications are solely those of the individual author(s) and contributor(s) and not of MDPI and/or the editor(s). MDPI and/or the editor(s) disclaim responsibility for any injury to people or property resulting from any ideas, methods, instructions or products referred to in the content.

