Article

Determination of the Dynamic Modulus of Elasticity of Pine Based on the PZT Transducer

1
College of Materials Science and Engineering, Nanjing Forestry University, Nanjing 210037, China
2
Hunan Key Laboratory of Advanced Fibers and Composites, Research Institute of Aerospace Technology, Central South University, Changsha 410083, China
*
Author to whom correspondence should be addressed.
Forests 2024, 15(3), 459; https://doi.org/10.3390/f15030459
Submission received: 7 January 2024 / Revised: 23 February 2024 / Accepted: 26 February 2024 / Published: 29 February 2024

Abstract

:
A new method for the determination of the dynamic modulus of elasticity (Ed) of pine wood, based on the transverse vibration excitation and electromechanical impedance (EMI) response of the lead zirconate titanate (PZT) transducer is proposed. The influence of the length to thickness ratio of the pine specimen on the measurement accuracy was studied through modal simulation analysis. Based on the results of the modal simulation, the size of the pine specimen was optimized, and the scanning frequency range of the EMI response was determined. On this basis, the EMI simulation and test of the pine specimen coupled with a PZT patch were carried out to verify the effectiveness of the novel method. The impedance simulation results of three kinds of pine specimens show that a unique and significant formant appears in the real part of each EMI response curve, and the maximum relative errors of the rectangular PZT patch and circular PZT patch are 1.34% and 1.81%, respectively. The impedance test results of three kinds of pine specimens indicate that the maximum relative errors of the rectangular PZT patch and circular PZT patch are 1.41% and 1.68%, respectively, compared with the corresponding results obtained by the traditional transverse vibration method. Simulation and experimental results verify the validity of the proposed method for the elastic modulus determination of pine wood.

1. Introduction

Pine is a widely used building material. The growing environment of pine may influence its mechanical properties [1]. The modulus of elasticity is an important mechanical property of pine. Therefore, the modulus of elasticity of pine needs to be tested before its actual use, and the test can be conducted using the static or dynamic method. Compared with the conventional bending detections of the static method, the dynamic methods are relatively convenient, economical, and efficient. Research on the dynamic modulus of elasticity (Ed) of wood can be traced back to the 1950s, and it mainly includes two methods of longitudinal and transverse vibration excitation. Hearmon et al. [2] determined the elastic modulus of pine through transverse and longitudinal vibration methods, and their research showed that the result of the transverse test was 5%–8% smaller than that of the longitudinal test. Brenndorfer et al. [3] also described the difference between the modulus of elasticity obtained from transverse and longitudinal vibration methods. Haines’ research indicated that the transverse vibration method was more accurate than other dynamic methods for the determination of the elastic modulus of wood [4]. Yin et al. [5] determined the modulus of elasticity of Canadian conifers with the transverse vibration method, and the results showed that the elastic modulus based on the transverse vibration had a strong linear correlation with the static modulus of elasticity. Wang et al. [6] demonstrated that the transverse vibration method was the best dynamic technology to assess sawn timber. The transverse vibration method has been standardized under ASTM D6874-12 for solid wood [7], and many researchers have tested the modulus of elasticity of wood and wood-based materials using this method. The transverse vibration method often adopts only the first-order bending mode frequency based on the Euler–Bernoulli theory. However, this method requires transverse vibration excitation and signal reception to acquire the fundamental mode frequency. The bending modes of the beam specimen are generally excited by the external load, and its vibration response is received by the sensor. The frequency response function (FRF) can be deduced through the signals of vibration excitation and response, with which the first-order bending mode frequency can be obtained. Therefore, a two-channel signal acquisition system is usually needed. That is, the system is relatively complex, occupies a large area, and has a high cost.
Lead zirconate titanate (PZT) is a piezoelectric material that works on the principle of piezoelectricity. A PZT patch can be used as a sensor and an actuator. PZT as an actuator can excite the vibration modes of the beam specimen, and PZT as a sensor can simultaneously acquire the electromechanical impedance (EMI) signal corresponding to the vibration modes of the PZT-coupled specimen. Li et al. [8] performed a mechanism analysis on the EMI responses of a smart corrosion coupon, and the result showed that some vibration modes excited by the PZT were consistent with the peaks of the EMI signals. Ritdumrongkul’s research also showed that some peak frequencies in the real part of the EMI signal corresponded to the vibration modes of the beam coupled with a PZT patch [9]. For the small size, light weight, and high accuracy of the PZT patch, measurement and monitoring based on the EMI have been widely applied by many researchers, such as in damage monitoring [10,11], bolt connection monitoring [12,13], grinding process monitoring [14,15], wear monitoring [16,17], soil monitoring [18,19], and stress monitoring [20,21]. Carbajo and his research team have preliminarily investigated the feasibility of determining the elastic moduli of several kinds of materials based on the EMI response of the PZT patch for the first time [22]. Their research suggests that specimen sizes need to be optimized to improve detection accuracy. This requires a research method combining computer software simulation and experiment, which has been widely used in wood property analysis [23,24].
To the authors’ knowledge, no relevant in-depth research has been conducted on the elastic modulus determination using the electromechanical coupling property. Based on the dual functions of PZT vibration excitation and sensing, a single PZT patch is proposed to replace the external excitation device and sensing element in the traditional transverse vibration method. Firstly, this article analyzed the theoretical feasibility of the proposed method. Then, the size optimization of the specimen was studied based on the modal simulation. On this basis, the EMI simulation and experiment of the pine specimen coupled with a PZT patch were performed for the verification of this novel method of the elastic modulus determination. The simulation and experimental results indicate that the EMI response of the PZT-coupled specimen provides a new way to measure the elastic modulus of pine wood.

2. Materials and Methods

2.1. Materials

Three kinds of pine, namely Korean pine (Pinus koraiensis Siebold and Zucc.), Mongolian Scots pine (Pinus sylvestris var. mongolica Litv.), and Chinese white pine (Pinus armandii Franch.), were selected for experimental research with a moisture content of approximately 12%. Korean pine and Mongolian Scots pine were produced in Northeast China, and Chinese white pine was from the Shanxi region of China. All the test specimens were sawn from logs’ sapwood without any defect, the length direction of each specimen corresponds to the longitudinal direction of the wood, and the arrangement of annual rings is diagonal. The densities of the three kinds of pine specimens were 454 kg/m3, 483 kg/m3, and 432 kg/m3, respectively. The size of the specimens used for impedance measurement is 250 mm × 40 mm × 5 mm (length × width × thickness), and the dimension of the large specimens for verification by the traditional transverse vibration method is 1000 mm × 40 mm × 20 mm. In addition, three kinds of pine, namely Korean pine, Scots pine (Pinus sylvestris L.), and eastern white pine (Pinus strobus), were selected for simulation analysis.

2.2. Ed Calculation of the Transverse Vibration Method

Equation (1) is the transverse vibration equation of a free-supported beam specimen according to the Euler–Bernoulli theory [25].
ρ A 2 v x , t t 2 + E d I 4 v x , t x 4 = 0
where ρ is the density, A is the cross-sectional area of the beam specimen, v (x, t) is the transverse displacement, I is the moment of inertia, x is the longitudinal coordinate of the beam specimen, t is the time, and Ed is the dynamic modulus of elasticity along the x direction.
Based on Equation (1), the first-order bending mode frequency of the beam specimen f1 can be derived as follows.
f 1 = 1 2 π 4.73 L 2 E d I ρ A
where L is the length of the beam specimen. According to Equation (2), the Ed of the specimen can be calculated as Equation (3) for a rectangular beam.
E d = 0.9464 ρ L 4 f 1 2 H 2
where H is the thickness of the beam specimen.
As can be seen from Equation (3), the main task of the transverse vibration method is to excite the first-order bending vibration mode of the specimen and extract the frequency of this mode.

2.3. Theoretical Basis of the EMI Method

A theoretical model for the EMI response of the PZT-coupled beam specimen was proposed by Giurgiutiu and Zagrai [26]. As shown in Figure 1a, the PZT patch with a length of la locates between xa and xa + la. The PZT patch expands and contracts with the excitation of a harmonic voltage signal, which creates a longitudinal force on the surface of the beam specimen. Its effect at the neutral axis of the beam specimen is equivalent to a longitudinal force and a bending moment according to the theorem of force translation, as shown in Figure 1b.
As the PZT patch is excited with a harmonic voltage signal, the longitudinal force and bending moment make the beam specimen vibrate laterally and longitudinally at the excitation frequency. The admittance of the PZT coupled with the beam specimen is expressed as follows:
Y ω = j ω C 1 k 31 2 1 1 φ cot φ + r ω
where C is the electrical capacitance of the PZT patch, K31 is the electromechanical coupling factor, φ is the phase angle, and r(ω) is the stiffness ratio defined as follows:
r ω = K S ω K p ω
where Kp(ω) is the quasi-static stiffness of the PZT patch and Ks(ω) is the dynamic stiffness of the beam specimen, which can be calculated as follows with no consideration of the modal damping:
K S ω = ρ A n = 1 U n x a + l a U n x a 2 ω n 2 ω 2 + h 2 2 m = 1 W m x a + l a W m x a 2 ω m 2 ω 2 1
where ρ, A, and h are the density, cross-sectional area, and thickness of the specimen, respectively. Un(x), ωn, Wm(x), and ωm are the longitudinal mode shape of the beam specimen, longitudinal mode frequency, bending mode shape of the specimen, and bending mode frequency, respectively.
Equation (6) indicates that the resonance peak will appear in the EMI response with the excitation frequency of the PZT patch equal to the bending mode frequency or longitudinal mode frequency of the beam specimen.

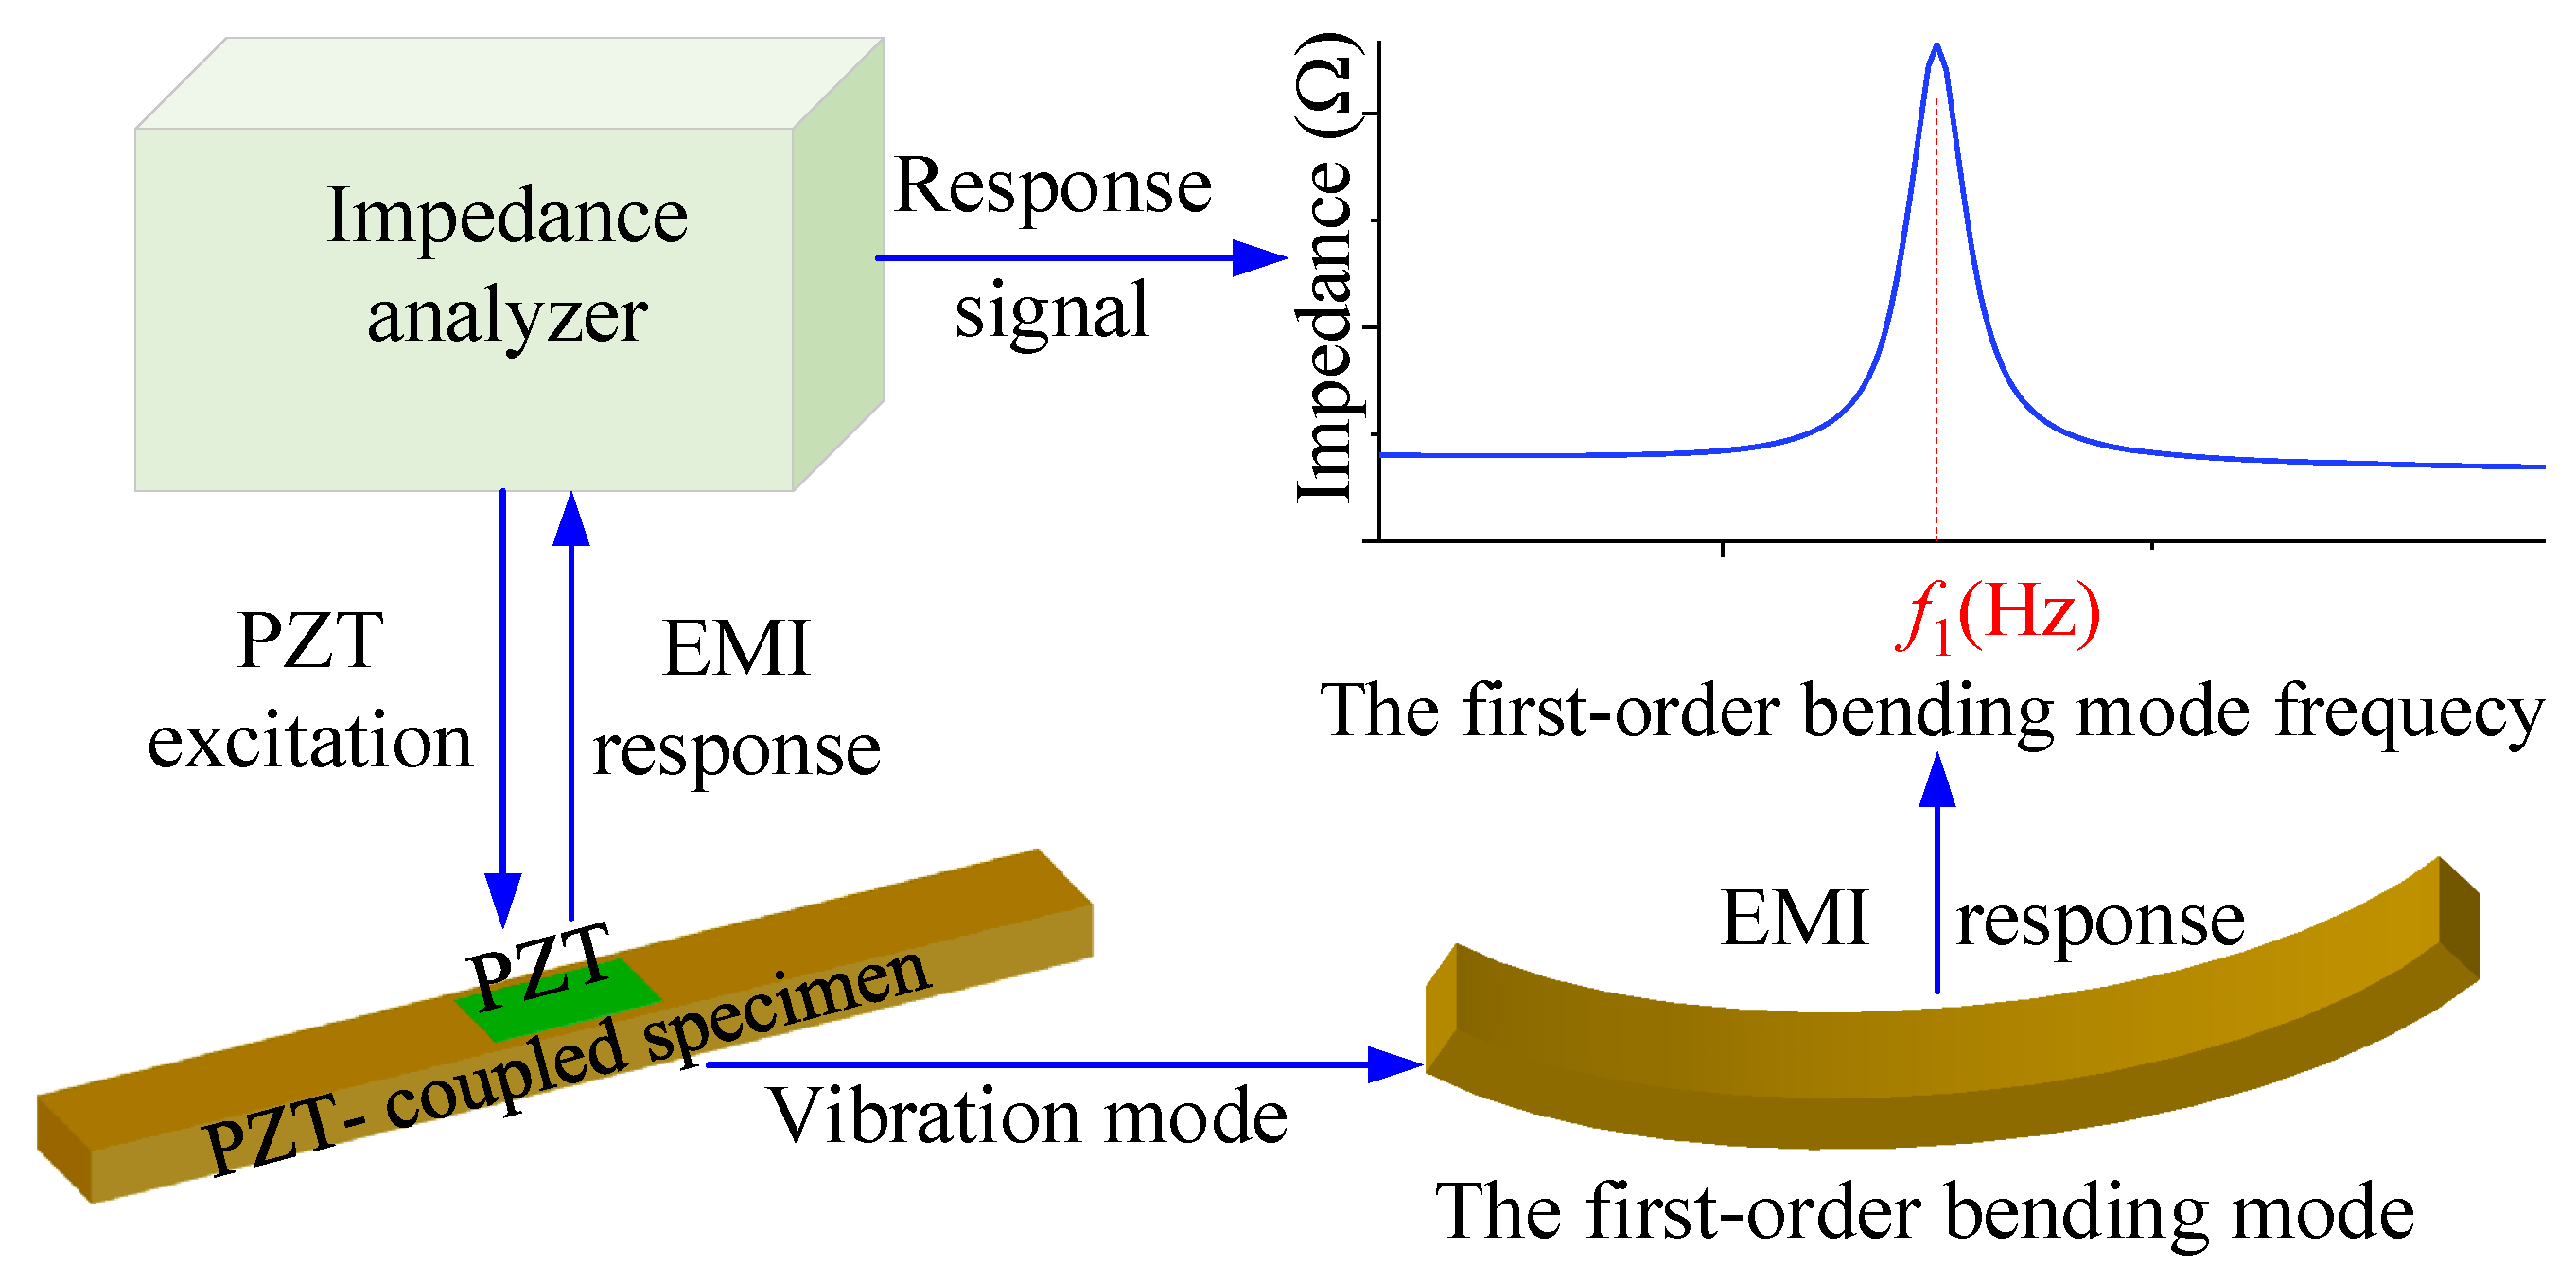
2.4. Ed Detection Principle Based on the EMI Method

For a PZT-coupled beam specimen, its first-order bending mode frequency is much lower than its first-order longitudinal mode frequency. Therefore, only the peak point corresponding to the first-order bending mode frequency will appear in the EMI response by optimizing the scanning frequency range of the PZT patch, as shown in Figure 2. The elastic modulus of the specimen material can be calculated based on Equation (3) by extracting the peak frequency. The above analysis illustrates the feasibility of the proposed method theoretically.

3. Results and Discussion

3.1. Size Optimization of the Specimen

Timber is an anisotropic material, but it is often regarded as an orthotropic material with three orthotropic directions, namely longitudinal (L), radial (R), and tangential (T), in mechanical analysis [27]. Thus, beam specimens may have the same mechanical properties, including the elastic modulus along the three orthogonal directions EL, ER, and ET, shear modulus GLR, GRT, and GLT, Poisson’s ratios νLR, νRT, and νLT, and the density ρ. The longitudinal modulus of elasticity EL reflects the main mechanical property of pine and is much larger than the modulus of two other directions. Therefore, in this study, the length direction of the beam specimen is consistent with the longitudinal direction of the wood, with which the dynamic modulus of EL (ELd) can be further obtained based on Equation (3). However, Equation (3) only considers the bending moment of the specimen. In an actual transverse vibration test, the flexural specimen is also affected by the rotatory inertia and shearing force, and these effects are improved with the decrease in the length to thickness ratio (LTR) of the specimen [28]. That is, the length to thickness ratio of the specimen will affect the measurement accuracy. The appropriate length to thickness ratio must be determined first prior to optimizing the size of the specimen. Therefore, bending modal analyses of the pine specimens were conducted by finite element simulation. The finite element models of free beam specimens were constructed by COMSOL Multiphysics. The parameters of three kinds of pine are from the literature [29,30,31] and are shown in Table 1. Two kinds of pine were selected for modal analysis and the parameters of the specimens are shown in Table 2 and Table 3. The physical field of solid mechanics and eigenfrequency analysis in the modal simulation were applied for the mode frequency extraction. The model was meshed at a size of 2 mm to ensure the accuracy of the modal analysis. Modal analysis results can provide modal frequencies for each vibration mode [32]. Here, only the frequency corresponding to the first-order bending mode is needed, as shown in Figure 3. The first-order bending mode frequency of each specimen was extracted, with which the ELd was calculated based on Equation (3). Then, the relative error can be further obtained using Equation (7). All the analysis results are shown in Table 2 and Table 3.
E = E L E L d E L × 100 %
Table 2 and Table 3 indicate that the detection accuracy increases with the rise of the length to thickness ratio for the transverse vibration method. The modal analysis results also illustrate that the requirement for the length to thickness ratio is higher when the modulus of elasticity of the specimen is larger. The relative error of ELd is less than 1.5% when the length to thickness ratio reaches 50 for Korean pine or Scots pine. Therefore, the size of the pine specimen can be optimized to 250 mm × 40 mm × 5 mm (length × width × thickness) to save test materials and to reduce the specimen size. Based on the above method of modal simulation analysis, the first-order bending mode frequencies of three kinds of optimized pine specimens were obtained, and the detection errors were calculated according to Equation (7) and are shown in Table 4. Table 4 illustrates that the maximum relative error is also less than 1.5% using the optimized specimens, which meets the actual detection requirement.
The second-order bending mode frequencies and the first-order longitudinal mode frequencies of three kinds of optimized pine specimens were also extracted, as shown in Table 5, in the abovementioned modal simulation analysis to determine the scanning frequency range for the subsequent impedance analysis.

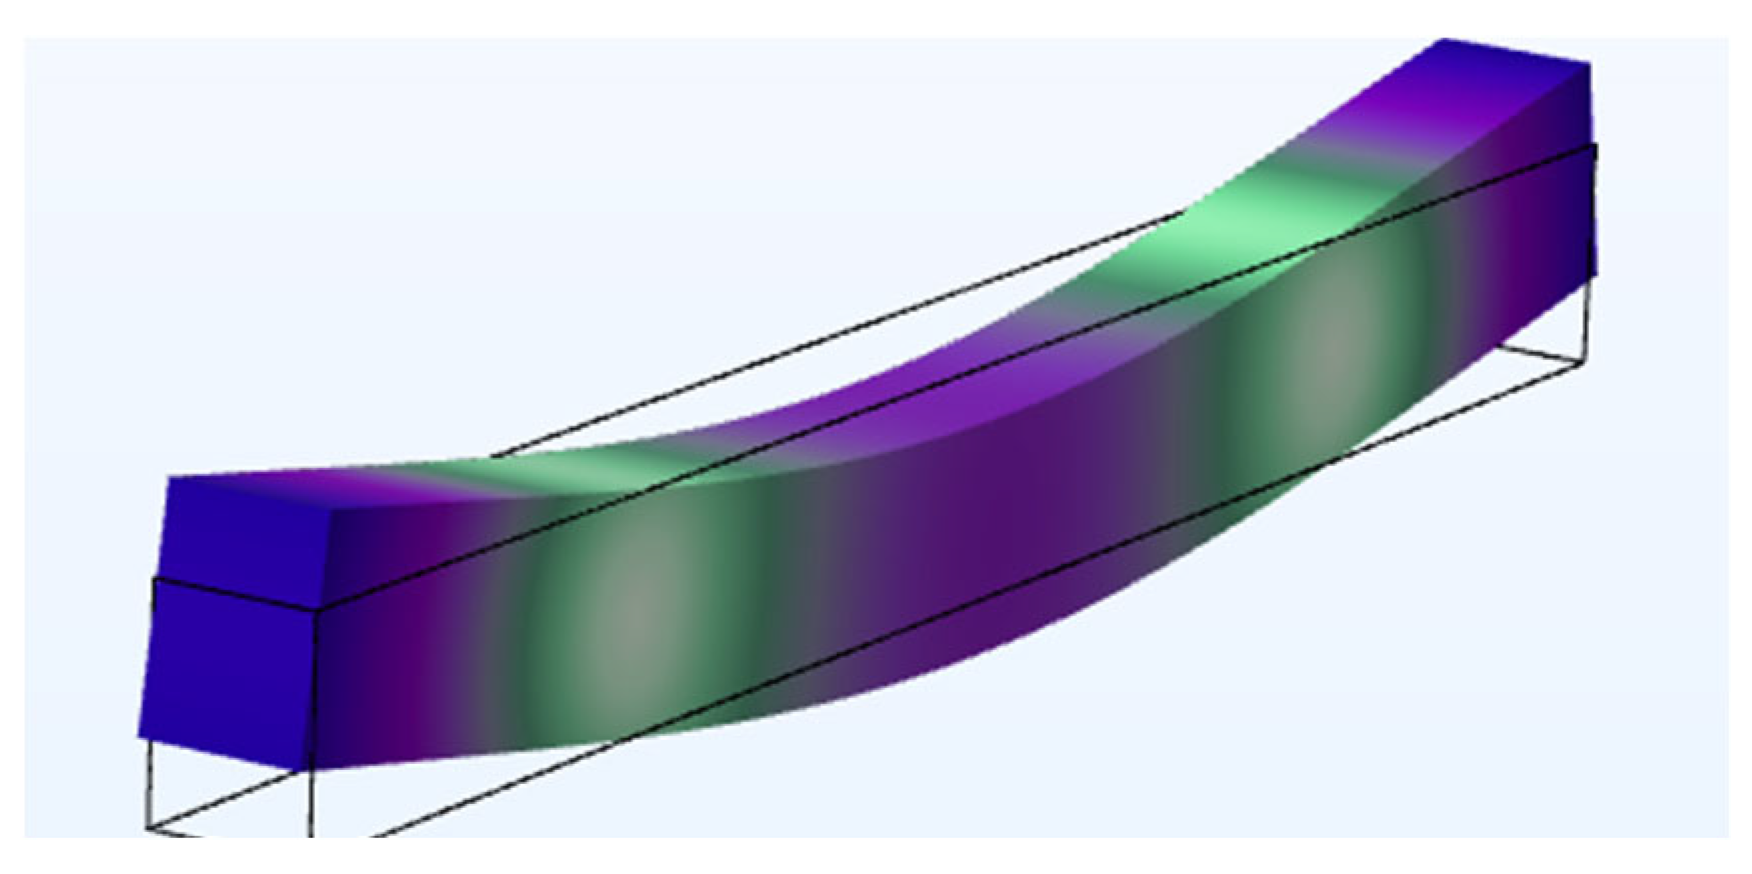
3.2. Verification of the Validity of the Proposed Method Based on the EMI Simulation

EMI simulations were performed using COMSOL Multiphysics software (Version 6.0) to investigate the feasibility of ELd detection based on the EMI response. The thickness of the PZT patch should be as thin as possible to reduce its influence on the mode of the specimen. Two shapes of PZT patches were selected for this study. One is a rectangular PZT patch with dimensions of 20 mm × 10 mm × 0.2 mm (length × width × thickness), and the other is a circular PZT patch with dimensions of Φ15 × 0.2 mm. Based on the optimized dimension of the pine specimen, the impedance response simulation model of the PZT coupled with the specimen was established by the two functional modules of the piezoelectric effect and frequency domain analysis. The PZT patch was located at the center of the top surface of the specimen. The connection layer between the PZT and the specimen was ignored in the simulation model, and the PZT and the specimen were set as a combination. The PZT patch is composed of PZT-5H piezoelectric material, and the parameters are listed in Table 6. The polarization direction of the PZT patch was set perpendicular to its surface. A harmonic excitation voltage with an amplitude of 1 V was applied to the top surface of the PZT patch, and its bottom surface was set as the ground. The maximum size of the meshed finite elements was 2 mm, which could meet the requirement of consisting of five nodes per half wavelength [33]. To ensure simulation accuracy and save time, the beam specimen was divided into three parts through the working face during meshing. The two parts without the PZT patch are mapped and swept meshed, and the maximum element size of the mesh is 2 mm. The part with the PZT patch was meshed by free tetrahedral mesh, and the maximum element size of the mesh is 1 mm. The PZT patch was also mapped and swept meshed, and the maximum element size of the mesh is 0.5 mm. One of the finite element meshes of the PZT coupled with the specimen is shown in Figure 4.
The appropriate scanning frequency range needs to be determined in the impedance simulation analysis and subsequent test. The harmonic excitation voltage applied to the PZT should only excite the first-order bending mode of the specimen, and only one peak frequency corresponding to the first-order bending mode of the specimen will appear in the impedance response curve. Based on the modal analysis results listed in Table 5, the frequency range of 300–600 Hz nearly covers the first-order bending mode frequencies of all the pine specimens and cannot reach other vibration modes of the specimen. Figure 5 is the stress diagram of the eastern white pine specimen generated after impedance analysis, which indicates that the impedance analysis can effectively excite the first-order bending mode of the specimen [8].
The impedance signals of the PZT patch coupled with three kinds of pine specimens in the range between 300 and 600 Hz with a step of 0.5 Hz were extracted and are shown in Figure 6. Figure 6 indicates that only one significant peak point appears in the real part of the impedance curve. The peak frequency corresponds to the first-order bending mode of the PZT-coupled specimen. A slight difference of approximately 1 Hz is observed between the peak frequencies of the same specimen coupled with two shapes of PZT patches in Figure 6. The reason is that the mode of the PZT-coupled specimen is affected by the additional mass of the PZT patch [34], and the mass of the rectangular PZT patch is different from that of the circular PZT patch. For the same specimen, the amplitude of the peak frequency of the rectangular PZT in the impedance curve is larger. The reason for this is that the rectangular PZT patch produces a larger excitation load under the same sinusoidal voltage excitation and the corresponding bending moment is larger.
According to the extracted peak frequencies, the ELd values were computed based on Equation (3) for three kinds of pine specimens, and the relative errors were further calculated based on Equation (7). The results are summarized in Table 7. The maximum relative errors of three kinds of specimens with the rectangular PZT patch and circular PZT patch are 1.34% and 1.81%, respectively. The rectangular PZT and the circular PZT have high detection accuracy, which verifies that the proposed method for the ELd determination of pine based on the EMI response is feasible and effective.

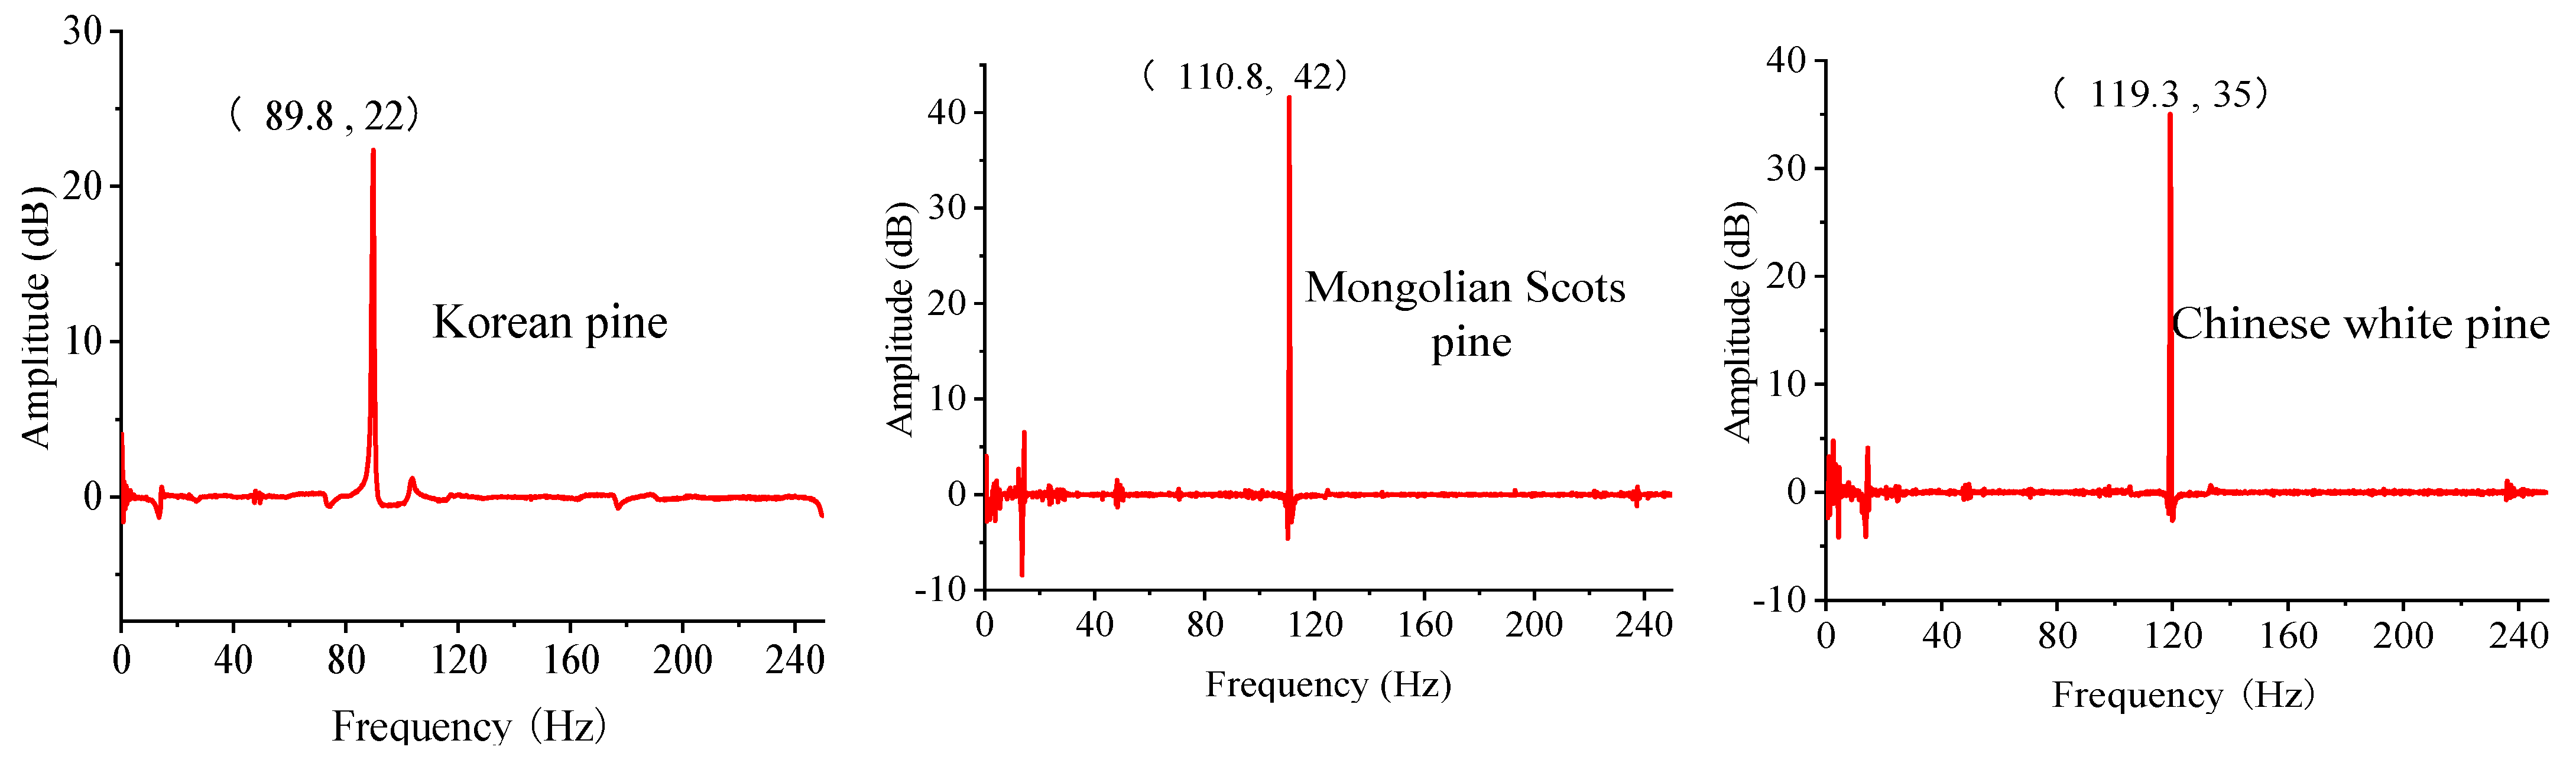
3.3. Validation of the Effectiveness of the Proposed Method Based on the Test

Three commonly used pine species, namely Korean pine, Mongolian Scots pine, and Chinese white pine, were selected for the experimental study, which were almost the same as the pine species selected in the simulation. In addition, it is necessary to use a mature method to verify the detection accuracy of the proposed method. The proposed method is essentially a transverse vibration method. The traditional transverse vibration method is a widely used and standardized method. Therefore, the traditional transverse vibration method was chosen as the validation method. The experimental specimens were cut from the same log to ensure the consistency of the test results.

3.3.1. Elastic Modulus Determination by the EMI Method

The measurement system of the EMI method is shown in Figure 7, and it includes an impedance analyzer and a computer. The type of impedance meter is a ZX80A-2M. Its sweep frequency range is 300–2M Hz. The frequency accuracy is 0.1 Hz. The system is simple, economical, portable, covers a small area, and can be used in the field or at industrial sites. To ensure the accuracy of the test results, three samples were made for each kind of pine detection. The sizes of the test specimens were almost the optimized size, and their thicknesses were slightly deviated due to the machining error. For the finite element simulation of EMI, two shapes of PZT patches were used. One is a rectangular PZT patch with a size of 20 mm × 10 mm × 0.2 mm, which needs to be customized from the enterprise. The other is a circular PZT patch, which is a commercial buzzer. The two kinds of PZT are both PZT-5H piezoelectric materials. To facilitate the adhesion to the specimen, the rectangular PZT patch adopted a flanging structure; that is, the two electrode wires of the PZT patch were drawn from its upper surface. The commercial buzzer was made by pasting a circular PZT patch onto the surface of a thin, round copper sheet, and the two electrodes can be drawn from the upper surfaces of the PZT patch and the thin copper sheet, respectively. The diameters of the circular PZT patch and the copper sheet in the buzzer were 15 mm and 20 mm, respectively, and their thicknesses were all 0.15 mm.
The adhesive has some effect on the PZT impedance [35]. If the amount of glue is too much, the vibration excitation effect may be weakened, and the main peak of the impedance response will not be prominent, or may even disappear, so that the first-order bending mode frequency of the specimen cannot be accurately extracted. To avoid the influence of adhesive mass on the mode of the specimen and the main peak of the EMI response, 502 glue was used for connection, the adhesive layer is very thin, and its mass can be ignored. This glue has a short curing time and can cure completely in about 5 min. The cured pine specimens were placed on a soft foam to satisfy the free boundary condition during the EMI measurement. The pine specimens were then connected to the impedance analyzer. The application software for the impedance analyzer was installed on the computer. After the scanning frequency range of 300–600 Hz was determined using simulation analysis and the step of 0.5 Hz were set, the EMI signals could be acquired using the impedance analyzer and transferred to a computer via a net cable for further analysis. The EMI signal of each sample was acquired with three repeated measurements. Under the same measurement conditions, the three repeated measurement results of the specimen were generally the same, namely the peak frequencies were the same. If the results were inconsistent, there might have been a problem with the glue and it may have needed to be reprocessed.
For three samples of each kind of pine with very close measurement results, if all three results were different, the sample result with the intermediate detection value was retained, and if two or three of the results were the same, the sample result with the same detection value was kept. The EMI signals of three kinds of pine specimens are shown in Figure 8. Figure 8 indicates that a unique and significant formant appears in each EMI curve. As concerns the results of the simulation analysis, the peak frequencies of the rectangular PZT and the commercial buzzer are slightly different for the same pine specimen, which is caused by the difference in size and mass between the two piezoelectric elements. In addition, unlike the simulation results, the impedance peak of the circular PZT is relatively larger, which is caused by the copper sheet in the buzzer. Based on the peak frequencies of the three kinds of specimens, the ELd values of three kinds of pine were computed and are listed in Table 8.
The impedance measurements in this work were performed at room temperature, about 25 °C. The impedance amplitude of the PZT is affected by the temperature [36], but the measurement of the pine elastic modulus only considers the peak frequency of the EMI response, which is excited by the bending vibration mode of the PZT-coupled specimen. Therefore, the measurement accuracy of the proposed method will not be affected by the temperature. During the experiments, it was also found that the peak frequency of the pine specimen was unchanged at different temperatures, which indicates the applicability of the proposed method.

3.3.2. Verification of the Effectiveness of the EMI Method

To verify the effectiveness of the proposed method, the test system of the traditional transverse vibration method was selected to measure the elastic modulus of the above three kinds of pine and is shown in Figure 9. It includes a stress hammer (the measurement range is 0–500 N and the sensitivity is 10 mV/N), a sound pressure sensor (the frequency response range is 20 Hz–20 KHz and the sensitivity is 50 mV/Pa), a data acquisition card (it is a 24-bit card and the sampling frequency can reach 204.8 kS/s), and the software of the signal acquisition system based on LabVIEW (version 2011). The beam specimen was suspended at the nodal point of the first-order bending shape via elastic threads, and the sound pressure sensor was mounted above the upper surface of the specimen, 3–5 mm away from the upper surface, and near the end of the specimen. A rubber hammer head was used for transverse vibration excitation because the first-order bending mode frequency of the beam specimen in this experiment is generally below 150 Hz. The sampling frequency is 500 Hz and the sampling number is 2000. The signal acquisition system collected the signals of the two sensors simultaneously. The first-order mode frequency was further acquired according to the time signals of the two sensors. The test device is shown in Figure 10.
To ensure the accuracy of the test results, three samples were made for each kind of pine detection. Each sample was measured five times, and if the frequency of the main peak was the same three or more times, the measurement was valid, otherwise it needed to be re-tested. The retention rules of sample test results are consistent with those of the above EMI method. The size and density of three kinds of pine specimens are shown in Table 9. The length to thickness ratio of the specimens is approximately 50, which meets the requirement of the detection accuracy. The curves of the imaginary part of FRF of three kinds of pine specimens are shown in Figure 11 and the first-order bending mode frequencies were 110.75 Hz, 119.25 Hz, and 113.25 Hz, respectively. Based on Equation (3), the dynamic modulus of elasticity of three kinds of pine were computed. The results are listed in Table 9.
According to the test results shown in Table 8 and Table 9, the detection results of the proposed method were compared with the corresponding results obtained using the traditional transverse vibration method based on Formula (7). As shown in Table 10, the maximum relative errors of three kinds of pine specimens with the rectangular PZT patch and circular PZT patch are 1.41% and 1.68%, respectively, which further verifies the feasibility and effectiveness of the proposed EMI method for the ELd determination of pine. The commercial buzzer has nearly the same detection accuracy as the rectangular PZT patch, which further demonstrates that the EMI method is effective, practical, and economical, for the commercial buzzer is very cheap and each buzzer costs approximately $0.4.
Although the measurement accuracy of the proposed method is comparable to that of the traditional transverse vibration method, and the relative error is within 2%, the detection accuracy can be further improved. If the size of the specimen is increased appropriately, its mass is increased, and the influence of PZT mass on the mode of the specimen is further reduced when the PZT mass is unchanged [37]. However, compared with the traditional transverse vibration method, the disadvantage of this method is that the PZT patch needs to be bonded, and the amount of glue needs to be controlled.
This work aims to explore a novel method. The detection system of the proposed method is simple, economical, portable, and covers a small area. Currently this method is only used to detect the elastic modulus of several kinds of pine specimens. In the future, the impedance scanning frequency range and specimen size for other wood and wood materials will be further studied and optimized to expand the applicability of the proposed method.

4. Conclusions

In this study, a new method based on the EMI response was verified for the elastic modulus determination of pine, the main conclusions are summarized as follows:
  • The results of the modal simulation on the transverse vibration method indicate that the detection accuracy of the dynamic modulus of elasticity is higher when the length to thickness ratio of the pine specimen is larger. When the length to thickness ratio of the pine specimen reaches about 50, the detection accuracy meets the actual demand, with which the size of the pine specimen was optimized for impedance measurement.
  • The scanning frequency range of the EMI detection is determined to be 300–600 Hz based on the mode frequencies of three kinds of pine specimens, which nearly cover the first-order bending mode frequencies of all the pine specimens and cannot reach other vibration modes of the pine specimen.
  • The EMI simulation results illustrate that a unique and significant formant appears in the real part of each EMI response curve, and the maximum relative errors using the rectangular PZT patch and the circular PZT patch are 1.34% and 1.81%, respectively, which verifies the feasibility and validity of the proposed method.
  • The EMI test results indicate that the maximum relative errors using the rectangular PZT patch and the commercial buzzer are 1.41% and 1.68%, respectively, compared with the corresponding results obtained using the traditional transverse vibration method, which verifies the effectiveness and practicality of the EMI method.

Author Contributions

S.L.: Conceptualization, Methodology, Investigation, Simulation, Test, Writing—original draft. G.X.: Investigation, Simulation, Writing—original draft. C.J.: Test, Writing—review and editing. H.H.: Simulation, Writing—review and editing. All authors have read and agreed to the published version of the manuscript.

Funding

This research was financially supported by the National Major Project of Scientific and Technical Supporting Programs of China during the 14th Five-year Plan Period (Grant No. 2022YFD2200705).

Data Availability Statement

The data that support the findings of this study are available from the corresponding author upon reasonable request.

Conflicts of Interest

The authors declare no conflicts of interest.

References

  1. Kharrat, W.; Koubaa, A.; Khlif, M.; Bradai, C. Intra-ring Wood Density and Dynamic Modulus of Elasticity Profiles for Black Spruce and Jack Pine from X-ray Densitometry and Ultrasonic Wave Velocity Measurement. Forests 2019, 10, 569. [Google Scholar] [CrossRef]
  2. Hearmon, R.F.S. The Elasticity of Wood and Plywood; Forest Products Research, Special Report, No. 7; H.M. Stationery Office: London, UK, 1948. [Google Scholar]
  3. Radu, A.; Brenndörfer, D. Zur zerstörungsfreien Prüfung des Holzes durch Schwingungsversuche. Holz Roh Werkst. 1976, 34, 219–222. [Google Scholar] [CrossRef]
  4. Haines, D.W.; Leban, J.-M.; Herbé, C. Determination of Young’s Modulus for Spruce, Fir and Isotropic Materials by the Resonance Flexure Method with Comparisons to Static Fexure and Other Dynamic Methods. Wood Sci. Technol. 1996, 30, 253–263. [Google Scholar] [CrossRef]
  5. Yin, Y.; Lu, J.; Ni, C.; Ren, H. Evaluation of Bending, Tensile and Compressive Strength of Structural Lumber with Transverse Vibration Technique. J. Build. Mater. 2007, 10, 543–547. [Google Scholar]
  6. Wang, S.Y.; Chen, J.H.; Tsai, M.J.; Lin, C.J.; Yang, T.H. Grading of Softwood Lumber Using Non-destructive Techniques. J. Mater. Process. Technol. 2008, 208, 149–158. [Google Scholar] [CrossRef]
  7. ASTM D6874; Standard Test Methods for Nondestructive Evaluation of Wood-Based Flexural Members Using Transverse Vibration. American Society for Testing and Materials: West Conshohocken, PA, USA, 2012. [CrossRef]
  8. Li, W.; Liu, T.; Zou, D.; Wang, J.; Yi, T.H. PZT Based Smart Corrosion Coupon Using Electromechanical Impedance. Mech. Syst. Sig. Process. 2019, 129, 455–469. [Google Scholar] [CrossRef]
  9. Ritdumrongkul, S.; Fujino, Y. Identification of the Location and Size of Cracks in Beams by a Piezoceramic Actuator–sensor. Struct. Control Health Monit. 2007, 14, 931–943. [Google Scholar] [CrossRef]
  10. Ai, D.; Zhu, H.; Luo, H.; Wang, C. Mechanical Impedance Based Embedded Piezoelectric Transducer for Reinforced Concrete Structural Impact Damage Detection: A Comparative Study. Constr. Build. Mater. 2018, 165, 472–483. [Google Scholar] [CrossRef]
  11. Fan, X.; Li, J. Damage Identification in Plate Structures Using Sparse Regularization Based Electromechanical Impedance Technique. Sensors 2020, 20, 7069. [Google Scholar] [CrossRef] [PubMed]
  12. Huo, L.; Chen, D.; Liang, Y.; Li, H.; Feng, X.; Song, G. Impedance Based Bolt Pre-Load Monitoring Using Piezoceramic Smart Washer. Smart Mater. Struct. 2017, 26, 057004. [Google Scholar] [CrossRef]
  13. Du, F.; Wu, S.; Xu, C.; Yang, Z.; Su, Z. Electromechanical Impedance Temperature Compensation and Bolt Loosening Monitoring Based on Modified Unet and Multitask Learning. IEEE Sens. J. 2023, 23, 4556–4567. [Google Scholar] [CrossRef]
  14. Ferreira, F.I.; de Aguiar, P.R.; da Silva, R.B.; Jackson, M.J.; Baptista, F.G.; Bianchi, E.C. Monitoring of Cylindrical Plunge Grinding Process by Electromechanical Impedance. IEEE Sens. J. 2022, 22, 12314–12322. [Google Scholar] [CrossRef]
  15. Marchi, M.; Baptista, F.G.; de Aguiar, P.R.; Bianchi, E.C. Grinding Process Monitoring Based on Electromechanical Impedance Measurements. Meas. Sci. Technol. 2015, 26, 045601. [Google Scholar] [CrossRef]
  16. Çakir, F.H.; Er, Ü.; Tekkalmaz, M. Monitoring the Wear of Turning Tools with the Electromechanical Impedance Technique. J. Intell. Mater. Syst. Struct. 2023, 34, 1341–1352. [Google Scholar] [CrossRef]
  17. Wang, J.; Li, W.; Lan, C.; Wei, P.; Luo, W. Electromechanical Impedance Instrumented Piezoelectric Ring for Pipe Corrosion and Bearing Wear Monitoring: A Proof-of-concept Study. Sens. Actuators A Phys. 2020, 315, 112276. [Google Scholar] [CrossRef]
  18. Wu, J.; Yang, G.; Wang, X.; Li, W. PZT-Based Soil Compactness Measuring Sheet Using Electromechanical Impedance. IEEE Sens. J. 2020, 20, 10240–10250. [Google Scholar] [CrossRef]
  19. Zhang, J.; Zhang, C.; Xiao, J.; Jiang, J. A PZT-Based Electromechanical Impedance Method for Monitoring the Soil Freeze-Thaw Process. Sensors 2019, 19, 1107. [Google Scholar] [CrossRef]
  20. Zhu, X.; di Scalea, F.L. Sensitivity to Axial Stress of Electro-Mechanical Impedance Measurements. Exp. Mech. 2016, 56, 1599–1610. [Google Scholar] [CrossRef]
  21. Ong, C.-W.; Yang, Y.; Naidu, A.; Lu, Y.; Soh, C. Application of the Electromechanical Impedance Method for the Identification of In-situ Stress in Structures. Proc. SPIE 2002, 4935, 503–514. [Google Scholar]
  22. Carbajo, J.; Poveda, P.; Segovia, E.; Rincon, E.; Ramis, J. Determination of Dynamic Elastic Modulus of Materials Under a State of Simple Stresses by Using Electrodynamic Actuators in Beam-Type Mechanical Elements. Mater. Lett. 2022, 320, 132383. [Google Scholar] [CrossRef]
  23. Ferreira, D.; Fonseca, E.; Pinto, C.; Borges, P. Tensile Strength of pine and Ash Woods–Experimental and Numerical Study. In Proceedings of the 6th International Conference on Mechanics and Materials in Design (M2D), Ponta Delgada, Portugal, 26–30 July 2015. [Google Scholar]
  24. Fajdiga, G.; Rajh, D.; Necemer, B.; Glodez, S.; Sraml, M. Experimental and Numerical Determination of the Mechanical Properties of Spruce Wood. Forests 2019, 10, 1140. [Google Scholar] [CrossRef]
  25. Carreira, M.R.; Dias, A.A.; Segundinho, P.G.D. Nondestructive Evaluation of Corymbia Citriodora Logs by Means of the Free Transverse Vibration Test. J. Nondestruct. Eval. 2017, 36, 26. [Google Scholar] [CrossRef]
  26. Giurgiutiu, V.; Zagrai, A.N. Embedded Self-sensing Piezoelectric Active Sensors for On-line Structural Identification. J. Vib. Acoust. 2002, 124, 116–125. [Google Scholar] [CrossRef]
  27. Kouroussis, G.; Ben Fekih, L.; Descamps, T. Assessment of Timber Element Mechanical Properties Using Experimental Modal Analysis. Constr. Build. Mater. 2017, 134, 254–261. [Google Scholar] [CrossRef]
  28. Chui, Y.H.; Smith, I. Influence of Rotatory Inertia, Shear Deformation and Support Condition on Natural Frequencies of Wooden Beams. Wood Sci. Technol. 1990, 24, 233–245. [Google Scholar] [CrossRef]
  29. Yang, N.; Zhang, L. Investigation of Elastic Constants and Ultimate Strengths of Korean Pine from Compression and Tension Tests. J. Wood Sci. 2018, 64, 85–96. [Google Scholar] [CrossRef]
  30. Pencik, J. Modelling of Experimental Tests of Wooden Specimens from Scots Pine (Pinus sylvestris) with the Help of Anisotropic Plasticity Material Model. Drvna Ind. 2015, 66, 27–33. [Google Scholar] [CrossRef]
  31. Shahhosseini, S.; Crovella, P.; Smith, W.B. Comparing The Effect of Presence of the Knot and the Size of the Knot on the Rolling Shear Properties in Cross Laminated Timber (CLT) by Modified Planar Shear Test and FEM Analysis. In Proceedings of the 16th World Conference on Timber Engineering (WCTE), Santiago, Chile, 9–12 August 2021. [Google Scholar]
  32. Merhar, M. Determination of Elastic Properties of Beech Plywood by Analytical, Experimental and Numerical Methods. Forests 2020, 11, 1221. [Google Scholar] [CrossRef]
  33. Wang, L.; Yuan, B.; Xu, Z.; Sun, Q. Synchronous Detection of Bolts Looseness Position and Degree Based on Fusing Electro-mechanical Impedance. Mech. Syst. Sig. Process. 2022, 174, 109068. [Google Scholar] [CrossRef]
  34. Kubojima, Y.; Tonosaki, M.; Yoshihara, H. Effect of Additional Mass on the Young’s Modulus of a Wooden Beam. J. Test Eval. 2005, 33, 278–282. [Google Scholar] [CrossRef]
  35. Islam, M.; Huang, H. Understanding the effects of adhesive layer on the Electromechanical Impedance (EMI) of Bonded Piezoelectric Wafer Transducer. Smart Mater. Struct. 2014, 23, 125037. [Google Scholar] [CrossRef]
  36. Abbas, S.; Li, F.; Abbas, Z.; Abbasi, T.U.R.; Tu, X.; Pasha, R.A. Experimental study of effect of temperature variations on the impedance signature of PZT sensors for fatigue crack detection. Sound Vib. 2021, 55, 1–18. [Google Scholar] [CrossRef]
  37. Wang, J.; Li, W.; Lan, C.; Wei, P. Effective Determination of Young’s Modulus and Poisson’s Ratio of Metal Using Piezoelectric Ring and Electromechanical Impedance Technique: A Proof-of-concept Study. Sens. Actuators A Phys. 2021, 319, 112561. [Google Scholar] [CrossRef]
Figure 1. A beam specimen coupled with a PZT patch: (a) geometry; (b) force analysis.
Forests 15 00459 g001
Figure 2. Ed detection principle based on the EMI method.
Forests 15 00459 g002
Figure 3. The first-order bending mode, generated during modal simulation.
Forests 15 00459 g003
Figure 4. Grid diagram of the rectangular PZT coupled with the specimen.
Forests 15 00459 g004
Figure 5. Stress diagram of the eastern white pine specimen generated after impedance analysis.
Forests 15 00459 g005
Figure 6. The EMI simulation results of three kinds of pine specimens. (a) The EMI response curve of the rectangular PZT coupled with the specimen. (b) The EMI response curve of the circular PZT coupled with the specimen.
Forests 15 00459 g006aForests 15 00459 g006b
Figure 7. The test device of the EMI method.
Forests 15 00459 g007
Figure 8. The test results of three kinds of pine specimens. (a) The EMI response curve of the rectangular PZT coupled with the specimen. (b) The EMI response curve of the circular PZT coupled with the specimen.
Forests 15 00459 g008
Figure 9. Schematic diagram of the test system of traditional transverse vibration method.
Forests 15 00459 g009
Figure 10. The test device of traditional transverse vibration method.
Forests 15 00459 g010
Figure 11. The amplitude–frequency curve of the imaginary part of the FRF.
Forests 15 00459 g011
Table 1. The material parameters of three kinds of pine.
PropertyKorean PineScots PineEastern White Pine
ρ (Kg/m3)430505349
EL (MPa)885614,3009404
ER (MPa)986700734
ET (MPa)429545357
GLR (MPa)4991230490
GRT (MPa)4250047
GLT (MPa)450800451
νLR0.430.300.30
νRT0.650.380.40
νLT0.510.400.30
Table 2. The influence of LTR on the ELd determination of Korean pine.
NoSize (mm)LTRf1 (Hz)ELd (MPa)Relative Error
1800 × 40 × 8010516.7695321.49%
2800 × 40 × 4020281.982796.52%
3800 × 40 × 2532179.886222.64%
4800 × 40 × 2040144.587011.75%
5800 × 40 × 1650116.087621.06%
Table 3. The influence of LTR on the ELd determination of Scots pine.
NoSize (mm)LTRf1 (Hz)ELd (MPa)Relative Error
1800 × 40 × 8010610.911,41520.17%
2800 × 40 × 4020331.413,4376.03%
3800 × 40 × 2532211.013,9452.48%
4800 × 40 × 2040169.614,0771.56%
5800 × 40 × 1650136.114,1650.94%
Table 4. The measurement accuracy of the optimized specimens.
Species of PineKorean PineScots PineEastern White Pine
The first-order bending mode frequency f1 (Hz)371.3435.4424.4
ELd (MPa)876614,1579296
Relative error1.02%1.00%1.15%
Table 5. Three mode frequencies of the optimized specimens.
Species of PineKorean PineScots PineEastern White Pine
The first-order bending mode frequency (Hz)371.3435.4424.4
The second-order bending mode frequency (Hz)1010.21185.71153.5
The first-order longitudinal mode frequency (Hz)9053.410,622.010,367.0
Table 6. Material properties of PZT-5H.
ParametersValues
Electric   permittivity   ε 11 T / ε 22 T /   ε 33 T 3130/3130/3400
Piezoelectric strain coefficients (10−10 m/V)−2.74/−2.74/5.93/7.41/7.41
Compliance S11/S12/S13/S22/S23/S33/S44/S55/S66 (10−12 m2/N)16.50/−4.78/−8.45/16.50/−8.45/20.70/43.50/43.50/42.60
Density ρ (kg/m3)7500
Dielectric loss factor tanδ0.02
Table 7. The measurement results of ELd, based on the EMI simulation.
Species of PinePZT Shapef1 (Hz)ELd (MPa)EL (MPa)Relative Error
Korean pineRectangular372.0879988560.64%
Circular371.087521.17%
Scots pineRectangular436.014,19614,3000.73%
Circular435.014,1311.18%
Eastern white pineRectangular424.0927894041.34%
Circular423.092341.81%
Table 8. The measurement results of ELd, based on the EMI test.
Species of PineSize (mm)Density (kg/m3)PZT Shapef1 (Hz)ELd (MPa)
Korean pine250 × 40 × 5.30454Rectangular379.08583
Circular378.58560
Mongolian Scots pine250 × 40 × 5.58483Rectangular481.513,296
Circular480.513,240
Chinese white pine250 × 40 × 5.40432Rectangular502.513,829
Circular500.013,692
Table 9. The detection results of EL using the traditional transverse vibration method.
Species of PineSize (mm)Density (kg/m3)f1 (Hz)EL (MPa)
Korean pine1000 × 40 × 19.9545489.88706
Mongolian Scots pine1000 × 40 × 20.42483110.813,458
Chinese white pine1000 × 40 × 20.50432119.313,846
Table 10. Measurement accuracy of the proposed method.
Species of PineResults Using the Proposed MethodResults Using the Traditional
Transverse Vibration Method
Relative Error
PZT ShapeELd (MPa)EL (MPa)
Korean pineRectangular858387061.41%
Circular85601.68%
Mongolian Scots pineRectangular13,29613,4581.20%
Circular13,2401.62%
Chinese white pineRectangular13,82913,8460.12%
Circular13,6921.11%
Disclaimer/Publisher’s Note: The statements, opinions and data contained in all publications are solely those of the individual author(s) and contributor(s) and not of MDPI and/or the editor(s). MDPI and/or the editor(s) disclaim responsibility for any injury to people or property resulting from any ideas, methods, instructions or products referred to in the content.

