Article

Seasonal Variation in Foliar Mite Diversity and Abundance in Leaf Domatia of Three Native South African Forest Species

by
Sivuyisiwe Situngu
1,* and
Nigel P. Barker
2
1
School of Animal, Plant and Environmental Sciences, University of the Witwatersrand, Johannesburg 2000, South Africa
2
Department of Plant and Soil Sciences, University of Pretoria, Private Bag X20, Hatfield 0028, South Africa
*
Author to whom correspondence should be addressed.
Forests 2024, 15(3), 467; https://doi.org/10.3390/f15030467
Submission received: 6 January 2024 / Revised: 22 February 2024 / Accepted: 28 February 2024 / Published: 1 March 2024
(This article belongs to the Special Issue Advanced Research in Mites Associated with Trees)

Abstract

:
Mite communities inhabiting plants are known to be affected by several environmental factors, including temperature and humidity. This pilot study aimed to assess seasonal variation in mite abundance and species richness in three Southern African woody species: Gardenia thunbergia, Rothmannia globosa (both Rubiaceae), and Tecomaria capensis (Bignoniaceae). Furthermore, we investigated the influence of rainfall, maximum and minimum temperature, and relative humidity on mite abundance and species richness. The study was conducted in 2014–2015 in Makhanda, formerly known as Grahamstown, in the Eastern Cape, South Africa. Twenty mature leaves were collected from all aspects of the plant fortnightly over 34 weeks. Following sampling, the leaves were viewed under a dissecting microscope, and mites were collected from inside the domatia and surrounding leaf surface area. Species diversity and abundance were calculated for each season and compared. A multiple linear regression analysis was performed in R Studio to test relationships between species richness and abundance, minimum and maximum daily temperatures, relative humidity, rainfall the day before, and accumulative rainfall over the preceding two-week period. We found that mites were present in the leaves of the sampled plants across all seasons, but that mite abundance and species richness changed with each season. None of the environmental variables were correlated with mite abundance, and only relative humidity influenced species richness. These results were not consistent across the three plant species studied, and we point to weaknesses in our sampling approach for the observed results. This pilot study, one of the first from southern Africa, provides a window into the complex interactions between plants and mites. We advocate for more studies on mite seasonality to better understand if it is specific to a region, vegetation type, or host species.

1. Introduction

Mites are distinct species of minute arthropods with an average body length ranging from 100 μm to 5 mm [1]. They are widely distributed [2,3] in all environments and are the second most abundant and diverse group after insects [2]. Unlike insects, however, mites have received less attention, and studies documenting seasonal changes in mite abundance and diversity are few and far between. Mites are believed to be mainly affected by temperature and relative humidity [4,5], and changes in seasons play an important role in structuring mite assemblages [5,6]. In the tropics, the survival of predatory mites during the dry seasons is negatively influenced by low relative humidity, and at extremely low levels of humidity, about 50% of the predatory mites’ eggs die [6]. In addition, temperature plays a role in mite life histories; elevated temperatures shortened the developmental time of phytoseiid mites while low temperatures lengthened it, resulting in high mite abundance during the hot periods [7,8,9]. In temperate zones, mites appear on deciduous trees annually in spring, and the diversity of these communities changes every season. Seasonal changes are sometimes driven by vegetation, the overall greenness of the plant [5,10], the availability of food and fungal flora, and leaf architecture [7]. A study on four varieties of grapes with different leaf architecture documented high densities of phytoseiid mites from late April to late June during spring and low densities in September and October in the autumn months in vineyards [11,12]. Nishida [8] reported a higher number of mites in leaves with domatia in summer than in plant leaves without domatia, suggesting that this leaf structure influences mite abundance. The shrub Viburnum erosum Thumb. had fungivorous mite species from the Winterchmidtidae and Tydeoidae families continuously throughout the sampling season from March to November. Phytoseiid mites were found within the domatia of this plant from May to November, and Eriophyioid mites were found in the domatia only in spring and autumn [13].
Only a handful of studies have investigated how seasonality affects mite abundance and diversity in African ecosystems. In a study carried out in Kenya investigating the effectiveness of the predatory mite Typhlofromalus aripo DeLeon (Phytoseiidae) in managing the cassava green mite Mononychellus tanajoa (Bondar) (Tetranychidae), it was found that T. aripo suppressed the population of the cassava green mite by 45% in dry, hot areas and by 64% in warm, humid zones [7]. A study of the diversity and ecology of mites in South Africa’s Western Cape vineyards found that only two mites, Euseius addoensis McMurtry and Typhlodromus praeacutus Van der Merwe, were consistently present in commercial vineyards from November to May. The phytophagous mite, Brevipalpus lewisi McGregor (Tenuipalppidae), was found to be abundant throughout the seasons [11]. Furthermore, samples from an organic vineyard block were observed to have a high diversity of predatory mites and no herbivorous mites.
None of the above-mentioned studies correlated mite abundance with rainfall, and none were conducted on South African indigenous tree species. We attempt to fill this knowledge gap by undertaking a pilot study documenting seasonal changes in mite communities found on three woody Southern African species.

2. Materials and Methods

2.1. Study Site

The study was conducted in Makhanda (33° 19′ 05″ S; 26° 32′ 47″ E), formally known as Grahamstown, in the Eastern Cape, South Africa. The three plants sampled are located at the Makhanda Botanical Gardens. The climate in Makhanda is classified as Mediterranean, and the town is located on the eastern periphery of the Mediterranean rainfall zone. As a result, the area receives rain throughout the year, with August being the wettest month and December the driest. The average rainfall is 466 mm, with most of it falling in the winter. The town is located on the fringes of the arid Karoo, and thus the area can be extremely hot in the summer, with average daily maximum temperatures of 28.8 °C. The winter average daily temperature is 5.6 °C. The warmest month is January, and the coolest month is July. March has the highest humidity, and June is the driest [14].

2.2. Study Species

Three plant species, Gardenia thunbergia Thunb., Rhothmannia globosa Thunb. (both in the family Rubiaceae), and Tecomaria capensis (Thunb.) (Bignoniaceae), were selected for the study. These species were selected because they are evergreen and widespread across wooded and forested areas of southern Africa. As they were growing within the Makhanda Botanical Gardens, the individual plants of each of these species were easily accessible throughout the sampling period. Gardenia thunbergia is a small tree that grows up to 7 m in height. The tree is found in both the afromontane and coastal forests of the Eastern Cape and Kwa-Zulu-Natal regions of South Africa. It has a smooth, whitish stem and short, rigid branchlets [15]. The leaves are dark green and glossy, hairless, and feel thinly leathery. Their veins are conspicuous, and the margins are wavy. Hairy pit-type domatia are present in vein axils [14]. Rothmannia globosa is found in forests and forest margins of South Africa, along forest margins in the Eastern Cape and north to Limpopo Province and Eswatini (formerly Swaziland). This tree can grow up to 15 m in height and has dark grayish-brown stems with rectangular markings. Leaves are glossy and dark green, often with yellowish to maroon veins on the underside. Hairy tuft-type domatia are present in the vein axils. [13,15]. Tecomaria capensis is a multi-stemmed shrub found in forest margins, valley bushveld, and coastal dunes of the Eastern Cape and the tropics of Africa. The shrub has pale brown bark and grows up to 5 m in height. It has shiny, dark green compound leaves that have oval leaflets with blunt teeth. The leaves have hairy tuft-type domatia on vein axils [16].

2.3. Sampling Protocol

Sampling was conducted on a single individual for each of the three plant species mentioned above. The sampling period commenced on 17 March 2014 and ended on 24 August 2015. Twenty mature leaves were collected from all aspects of each plant every two weeks to ensure the influence of aspect on diversity and abundance was controlled [17]. The leaves were stored in a cooler box with ice while in the field and then viewed under a dissecting microscope on the same day of collection. The total number of mites found inside the domatia and the nearby leaf surface was counted, and different mite species were noted. A representative sample of the collected mites was put in 2 mL vials containing 75% ethanol and sent to Professor Edward A. Ueckermann, an acarologist at the Biosystematics Division, Plant Health and Protection Research Unit, Agricultural Research Council (ARC) of South Africa, for identification. These specimens were then deposited in the National Collection of Arachnida, ARC-Plant Health, and Protection Research (NCA-PPRI), Pretoria, South Africa.

2.4. Data Analysis

Mite counts and identity were used to calculate the average mite abundance per leaf as well as species richness in Excel. Since the data was not normally distributed, a Kruskal-Wallis rank sum test was performed using R Studio version 2023.12.1 Boston, MA, USA [18] to find statistical differences in mite abundance and Shannon diversity index between seasons. The South African seasons are defined as follows: spring is from the beginning of September to the end of November; summer is from December to the end of February; autumn is from March to May; and winter is from the beginning of June to August. A p-value < 0.05 was considered statistically significant. In cases where significance was found in the Kruskal-Wallis rank sum test, a Dunn-Bonferroni post-hoc test with p-values adjusted with the Holm method was used to perform multiple pairwise comparisons between seasons using the R Studio software using the FSA package [18].
Climate datasets for Makhanda were obtained from the national weather station located at the 6th South African Infantry Military Base. From this data, we extracted values for daily minimum as well as maximum temperatures, relative humidity recorded at 8:00 and 14:00, rainfall the day before sampling, and calculated accumulative rainfall over the preceding two-week period. This data was used to perform generalized linear regressions with Gaussian error variance using the dplyr package in R Studio to see if there were relationships between the environmental variables and mite abundance and diversity.

3. Results

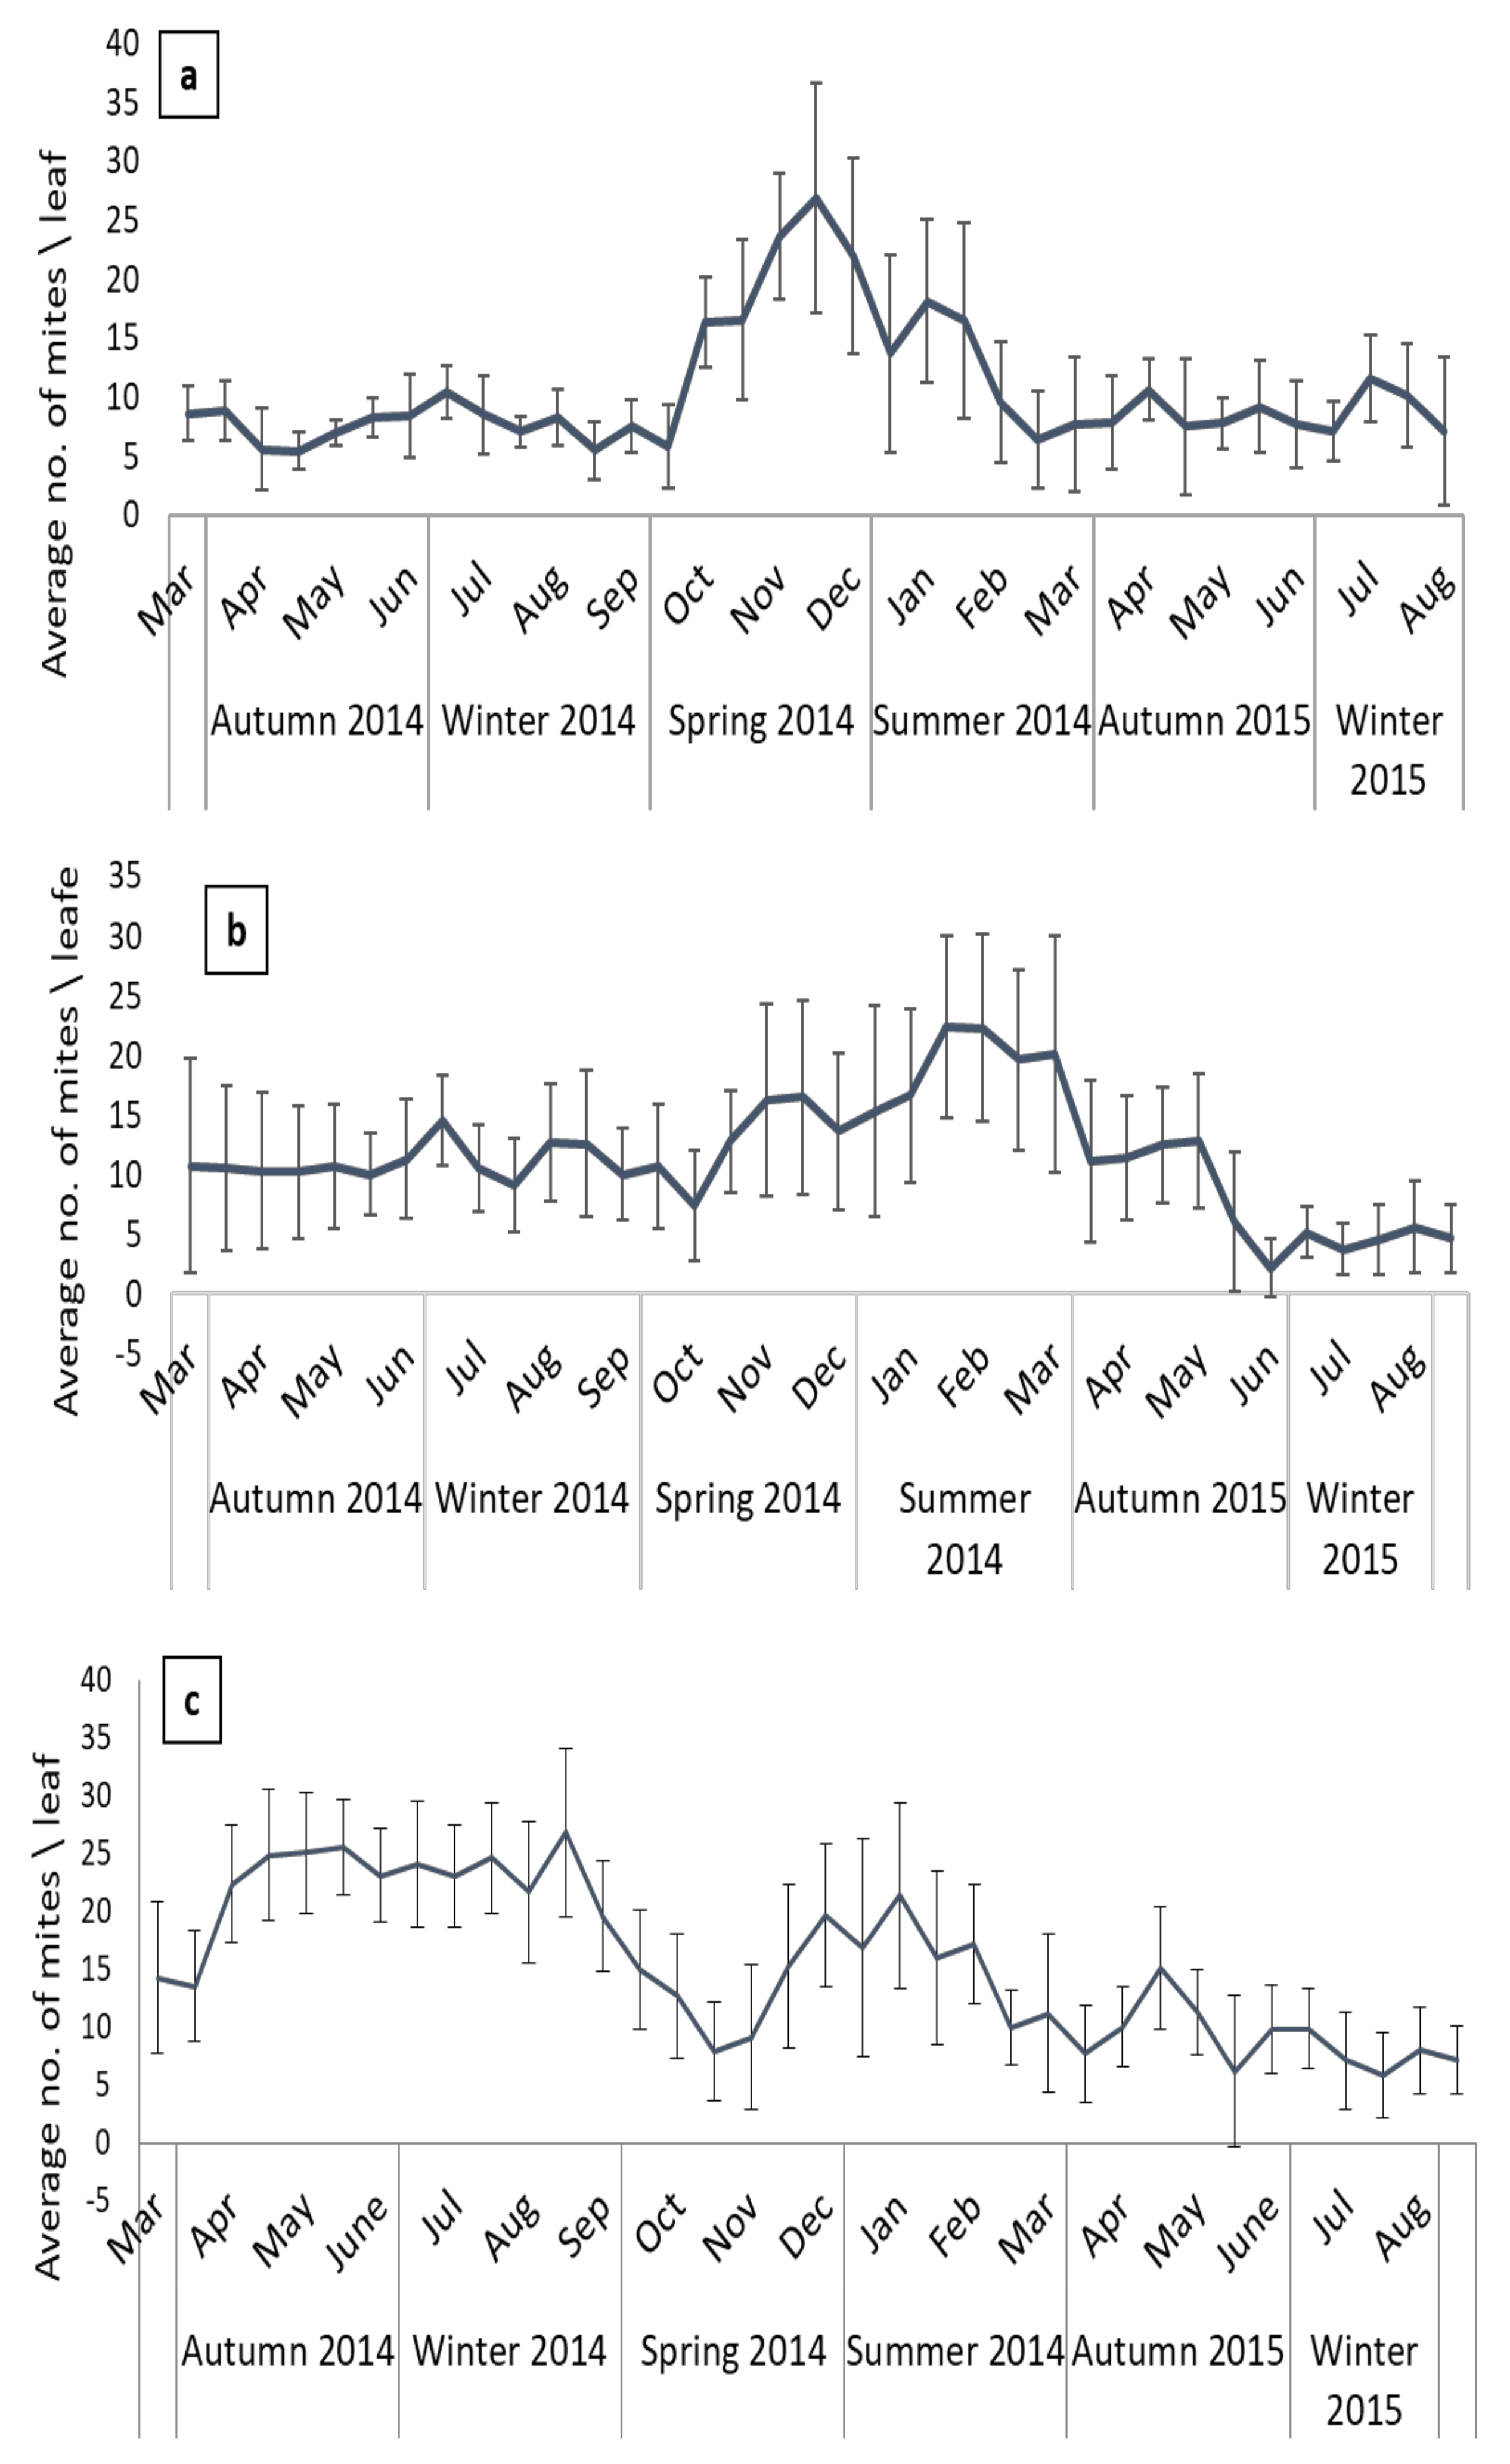
3.1. Seasonal Patterns in Mite Abundance and Species Richness

The average mite abundance varied between the three species sampled as well as with seasons (Figure 1). Gardenia thunbergia had the highest mite abundance in the spring and summer of 2014 (Figure 1a). Mite abundance was statistically different between the autumn and the summer of 2014 (p = 0.04). This was also the case for the autumn and winter of 2015 (p = 0.04) as well as the summer of 2014 and winter of 2015. A similar pattern was observed in R. globosa, and the mite population peaked and was higher during the first six months of the sampling period during the spring and summer months; however, there was only a difference between the autumn and summer of 2014 (p = 0.03). Overall, mite abundance was highest in the summer of 2014 on G. thunbergia and R. globosa (p = 0.03). T. capensis had high mite abundance in the winter months of 2014, from March until October 2014 during autumn and all through to mid-spring. The lowest abundance was in the winter of 2015 (Figure 1c). There were significant differences in the abundance of mites found in the autumn of 2014 and winter of 2015 (p = 0.005), the autumn of 2015 and winter of 2014 (p = 0.01), as well as between the winter of 2014 and 2015.

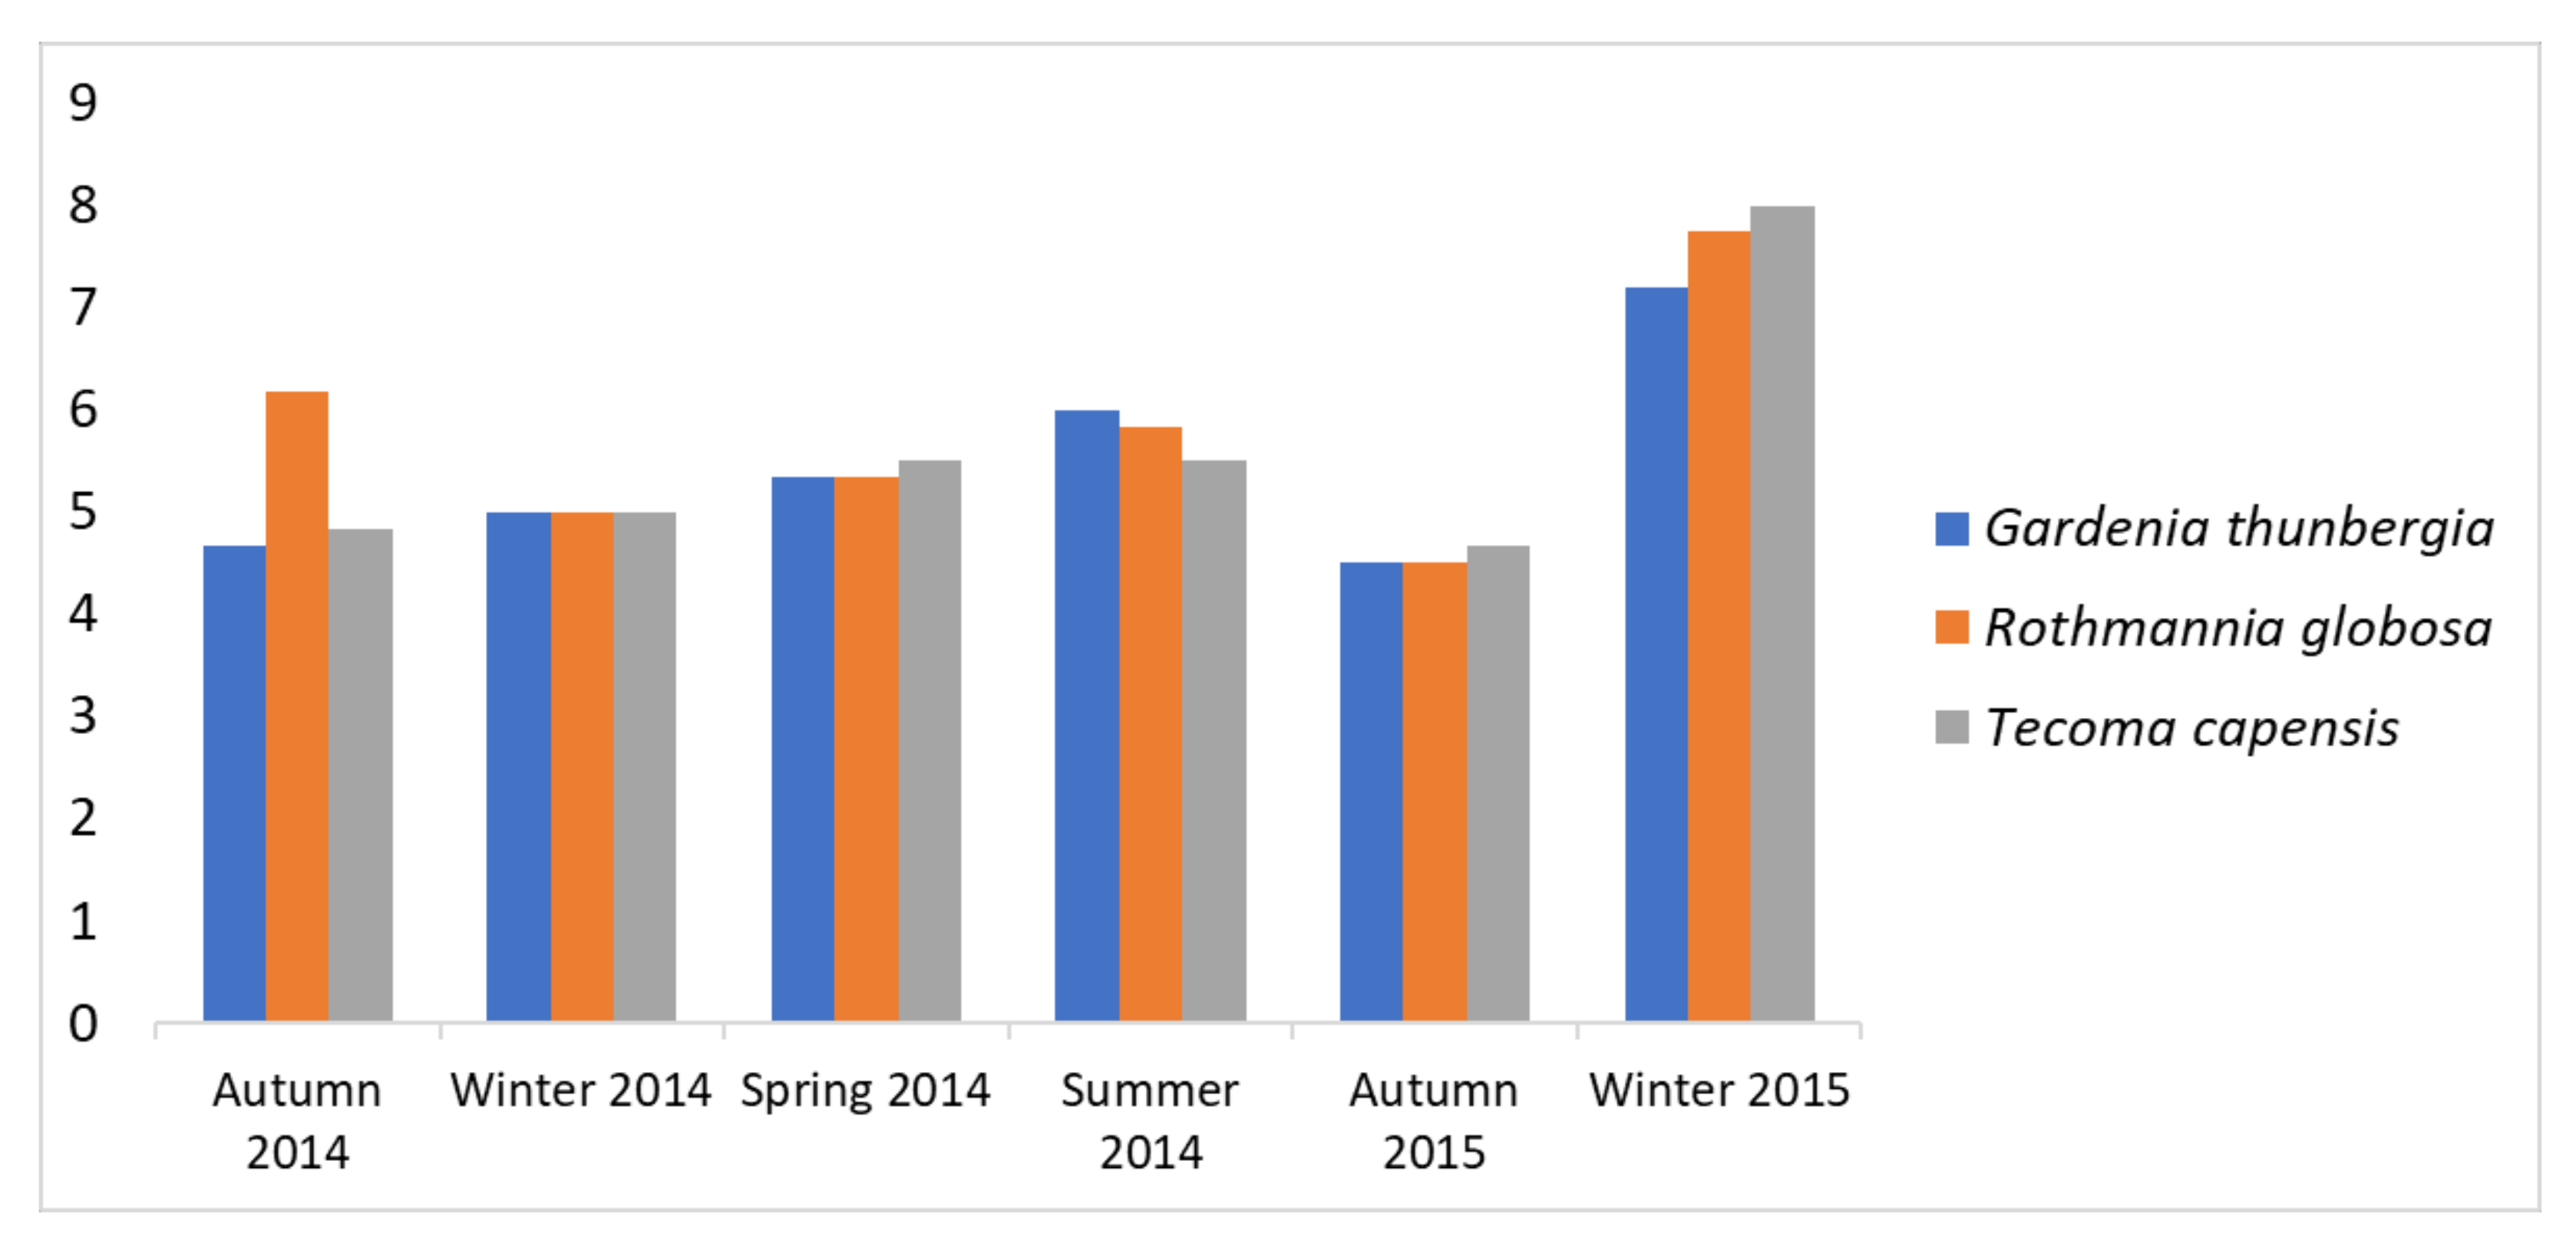
3.2. Seasonal Patterns in Mite Species Richness

Mite species richness also varied slightly throughout the sampling period (Figure 2). In the autumn season of 2014, R. globosa had the highest number of mite species compared to the other two trees. All plants sampled had the same number of mite species in the winter of 2014. Species richness was lowest in the autumn of 2015 and highest in the winter of 2015 in the three plants.
There were no significant differences in species richness across the seasons in G. thunbergia. In R. globosa, seasonal differences were observed between the spring and summer winter of 2014 as well as the spring of 2014 and the winter of 2015 (p = 0.005). species richness differed was generally higher and only declined during the summer and autumn months of 2015 (p = 0.01; Figure 2). There was also a significant difference in the number of mites found in T. capensis during the summer of 2014 and autumn of 2015 (p = 0.03), spring and summer (p = 0.02), and between the winter and summer seasons of 2014 (p = 0.008).
Table 1 lists the species of mites collected from the trees during the sampling period. The species of mites that were commonly found in the trees were Neoseiulus californicus McGregor (Phytoseiidae), Tydeus munsteri Meyer and Ryke (Tydeidae), Eriophyiodea (unknown) Bravipalpus sp. (Tenupalpidae), Typhlodromus microbullatus van der Merwe (Phytoseiidae), and Tetratriophydeus myacanthus (Ueckermann) (Triophtydeidae). Other mite species were present in the leaves of the trees, but in low numbers (Table 1). The top five abundant mite species on the leaves of G. thunbergia throughout the sampling period were T. munsteri, T. myacanthus, N. californicus, Bravipalpus sp., and Oribatid sp. (Figure 3a). Bravipalpus sp. was missing in the winter and spring of 2014, while Oribatid sp. was absent in the summer of 2014. R. globosa, T. munsteri. T. microbullatus, E. Addoensis Eriophyiodea (unknown), and Saproglyphus sp. were the most common across all the seasons (Figure 3b). T. microbullatus was absent on the leaves of R. globosa in the autumn of 2014, while Saproglyphus sp. was absent on this plant in the spring and summer of the same year. T. munsteri was the most common mite in T. capensis across all seasons. P. ulmi was missing from the autumn to the spring of 2014, and N. californicus was missing in the spring and summer of the same year (Figure 3c). Additionally, Saproglyphus sp. was not found in the leaves of this plant in the winter of 2014.

3.3. Relationships between Environmental Variables and Mite Abundance and Diversity

Multiple linear regressions were performed to test whether there was a relationship between mite abundance as well as mite species richness and climate variable data (minimum and maximum temperature, morning (8:00) and afternoon (14:00) relative humidity, rain the day before, and accumulative weekly rainfall). There was no relationship between mite abundance and the climatic variables in all the plants sampled (Table 2 and Table 3). In contrast, mite species richness was only correlated with relative humidity at 08:00 for G. thunbergia.

4. Discussion

Understanding seasonal variation in mite abundance and diversity is important in determining how and when mites utilize leaf domatia. This knowledge is also vital for managing beneficial and harmful mites in agricultural settings [7,15]. Our results show that there are seasonal changes in the abundance and diversity of mites associated with Gardenia thunbergia, Rothmannia globosa, and Tecomaria capensis. Comparable results were reported in similar studies [8,12,19]. There was also a difference in the richness of mite species in the plant species sampled. These results are consistent with others [9,17,20], which reported that certain mites may colonize leaves at specific times throughout the seasons. It is unclear why some mite species are found at certain times of the year.
We propose that leaf architecture and age may also influence these results [8,11,20]. Tecomaria capensis and R. globosa have a hair-tuft leaf domatium, while G. thunbergia has pit-type domatia with trichomes [8], and these structures might have influenced mite species richness. It has been shown that the presence of leaf hairs affects mite abundance and diversity on leaves [21]. Trichomes aid in retaining moisture and high levels of humidity within domatia, thus creating favourable conditions for mites and their eggs [8,19]. Additionally, Kopačka [10] found that leaf age and percentage greenness affected seasonal mite abundance. Other factors, such as the density of mite prey and the availability of alternative food sources, may also influence mite diversity and abundance, and studies have found that seasonal fluctuations in abundance are related to the availability of pollen and fungi [19,22]. Host preference and predator-prey oscillations may be other factors that can explain these results [23]. Tydeus monsteri and Neoseiulus californicus were the only species that were found in abundance in all three plants, and the other species showed some level of host preference.
We investigated the influence of seasonal weather conditions and found no clear correlation pattern between the mite species abundance and different environmental variables, while species richness was only found to be correlated with relative humidity in one of the plants sampled. These results are in contrast with the results of others, which have shown that mites react differently to environmental conditions, and some species are more sensitive to temperature while others are affected by moisture [24,25]. Another study demonstrated that temperature and rainfall affected the population dynamics of mites, and a trade-off existed between reproduction and adult mite survival [6]. Rainfall is known to wash mites from leaves or physically dislodge them from their host plant, leading to low mite abundance and diversity [5,26]. The results of these studies provide some insight into how climatic conditions may affect mite communities.

5. Conclusions

This study demonstrated that mite diversity and abundance on three different South African tree species from a single location varied across seasons. It was noted that climatic variables were not correlated with seasonal patterns in mite abundance and species richness, but rather factors such as leaf and branch architecture, food availability, and the overall greenness of the plant may contribute to the observed seasonal patterns. We note that they were weaknesses in our sampling, and this might have affected the observed result. Nonetheless, we believe that this study provides insight into the complex interactions between plants and mites across seasons and reveals opportunities for future studies on mite seasonality. The initiation of similar studies at other South African sites to assess whether the patterns observed here are common across different habitats and landscapes is needed to determine if the seasonality of mites is specific to a region, vegetation type, or host species.

Author Contributions

Conceptualization, S.S. and N.P.B.; methodology, S.S.; data curation, S.S.; formal analysis, S.S.; writing—original draft preparation, S.S.; review and editing, N.P.B.; funding acquisition, N.P.B. All authors have read and agreed to the published version of the manuscript.

Funding

This research received financial support from the National Research Foundation (NRF) of South Africa and the Department of Science and Technology Centre of Excellence in Tree Health Biotechnology (CTHB).

Data Availability Statement

The data presented in this study are available on request from the corresponding author.

Acknowledgments

We would like to thank Edward Ueckermann (Agricultural Research Council of South Africa, Biosystematics Division) for his help with mite identification.

Conflicts of Interest

The authors declare no conflict of interest.

References

  1. Krantz, G.W. A Manual of Acarology; Texas Tech University: Lubbock, TX, USA, 1978. [Google Scholar]
  2. Nazar, M.Z.; Freed, S.; Hussain, S.; Sumra, M.W.; Shah, M.S.; Naeem, A. Characteristics of biochemical resistance mechanism of novel insecticides in Phenacoccus solenopsis Tinsley (Hemiptera: Pseudococcidae). Crop Prot. 2020, 138, 105320. [Google Scholar] [CrossRef]
  3. Salmane, I.; Brumelis, G. Species list and habitat preference of Mesostigmata mites (Acari, Parasitiformes) in Latvia. Acarologia 2010, 50, 373–394. [Google Scholar] [CrossRef]
  4. Huhta, V.; Hanninen, S.M. Effects of temperature and moisture fluctuations on an experimental soil microarthropods community. Pedobiologia 2001, 45, 279–286. [Google Scholar] [CrossRef]
  5. Devi, M.; Challa, N. Impact of weather parameters on seasonality of phytophagous mites. J. Entomol. Zool. 2019, 7, 1095–1100. [Google Scholar]
  6. Uvarov, A.V. Effects of diurnal temperature fluctuations on population response of forest floor mites. Pedobiologia 2003, 47, 331–339. [Google Scholar] [CrossRef]
  7. Zundel, C.; Nagel, P.; Hanna, R.; Korner, F.; Scheidegger, U. Environment and host-plant genotype effects on the seasonal dynamics of a predatory mite on cassava in sub-humid tropical Africa. Agric. For. Entomol. 2009, 11, 321–331. [Google Scholar] [CrossRef]
  8. Nishida, S. Seasonal and Regional Changes in Mite Fauna of Domatia in Viburnum odoratissimum var. awabuki (Viburnaceae). Acta Phytotaxon. Geobot. 2023, 74, 141–155. [Google Scholar]
  9. Toyoshima, S.; Amano, H. Diversity and abundance of phytoseiid mites on Magnolia hypoleuca Siebold et Zuccarini, a candidate source of natural enemies in natural vegetation. Appl. Entomol. Zool. 2006, 41, 349–355. [Google Scholar] [CrossRef]
  10. Kopačka, M.; Zemek, R. Species Composition and Seasonal Abundance of Predatory Mites (Acari: Phytoseiidae) Inhabiting Aesculus hippocastanum (Sapindaceae). Forests 2023, 14, 942. [Google Scholar] [CrossRef]
  11. Kolokytha, P.D.; Fantinou, A.A.; Papadoulis, G.T. Temperature and diet effects on immature development of predatory mite Typhlodromus athenas Swirski and Ragusa (Acari: Phyotseiidae). Environ. Entomol. 2011, 40, 1577–1584. [Google Scholar] [CrossRef] [PubMed]
  12. Vermaak, M. The Diversity and Ecology of Mites (Acari) in Vineyards. Ph.D. Thesis, Stellenbosch University, Stellenbosch, South Africa, 2019. [Google Scholar]
  13. Duso, C.; Fontana, P.; Malagnini, V. Diversity and abundance of phytoseiid mites (Acari: Phytoseiidae) in vineyards and the surrounding vegetation in northeastern Italy. Acarologia 2004, 44, 31–47. [Google Scholar]
  14. Mucina, L.; Rutherford, M.C. The Vegetation of South Africa, Lesotho and Swaziland; Strelitzia: South African National Biodiversity Institute: Pretoria, South Africa, 2006. [Google Scholar]
  15. Boon, R. Pooley’s Trees of Eastern South Africa: A Complete Guide; Flora and Fauna Publications Trust: Durban, South Africa, 2010. [Google Scholar]
  16. Dharani, N. Field Guide to Common Trees and Shrubs of East Africa; Struik Publishers: Cape Town, South Africa, 2002. [Google Scholar]
  17. Situngu, S.; Barker, N.P. Position, position, position: Mites occupying leaf domatia are not uniformly distributed in the tree canopy. S. Afr. J. Bot. 2017, 108, 23–28. [Google Scholar] [CrossRef]
  18. RStudio Team. RStudio: Integrated Development for R; RStudio, PBC: Boston, MA, USA, 2020; Available online: http://www.rstudio.com/ (accessed on 5 January 2024).
  19. Kishimoto, H. Species composition and seasonal occurrence of spider mites (Acari: Tetranychidae) and their predators in Japanese pear orchards with different agrochemical spraying programs. Appl. Entomol. Zool. 2002, 37, 603–615. [Google Scholar] [CrossRef]
  20. Walter, D.E.; O’Dowd, D.J. Beneath biodiversity: Factors influencing the diversity and abundance of canopy mites. Selbyana 1995, 1, 12–20. [Google Scholar]
  21. Onzo, A.; Hanna, R.; Zannou, I.; Sabelis, M.W.; Yaninek, J.S. Dynamics of refuge use: Diurnal, vertical migration by predatory and herbivorous mites within cassava plants. Oikos 2003, 101, 59–69. [Google Scholar] [CrossRef]
  22. Prado, J.; Witte, A.R.; Frank, S.; Sadof, C.S. Do leaf domatia mediate intraguild predation and host resistance to Oligonychus acaris (Shimer) on red sunset maple (Acer rubrum)? Biological Control 2015, 90, 187–192. [Google Scholar] [CrossRef]
  23. Ferreira, J.A.; Cunha, D.F.; Pallini, A.; Sabelis, M.W.; Janssen, A. Leaf domatia reduce intraguild predation among predatory mites. Ecol. Entomol. 2011, 36, 435–441. [Google Scholar] [CrossRef]
  24. Irmler, U. Climatic and litter fall effects on Collembolan and oribatid mites species and communities in a beech wood based on a 7-yearyear investigation. Eur. J. Soil Biol. 2006, 42, 51–62. [Google Scholar] [CrossRef]
  25. Schmidt, A.R.; Jancke, S.; Lindquist, E.E.; Ragazzi, E.; Roghi, G.; Nascimbene, P.C.; Schmidt, K.; Wappler, T.; Grimaldi, D.A. Arthropods in amber from the Triassic period. Proc. Natl. Acad. Sci. USA 2012, 109, 14796–14801. [Google Scholar] [CrossRef] [PubMed]
  26. Suzuki, T.; Watanabe, M.; Takeda, M. UV tolerance in the two-spotted spider mite, Tetranychus urticae. J. Insect Physiol. 2009, 55, 649–654. [Google Scholar] [CrossRef]
Figure 1. The average number of mites (irrespective of species) with a standard deviation based on the 20 leaves sampled from each tree: (a) Gardenia thunbergia, (b) Rothmannia globosa, and (c) Tecomaria capensis during the sampling period of September 2013 to August 2015.
Forests 15 00467 g001
Figure 2. Species richness based on the 20 leaves sampled during the sampling period of September 2013 to August 2015.
Forests 15 00467 g002
Figure 3. Total abundance for the five commonly found mite species associated with (a) Gardenia thunbergia, (b) Rothmannia globosa, and (c) Tecomaria capensis.
Forests 15 00467 g003
Table 1. The species and feeding guild of mites present on leaves of the sampled tree species from March 2014 to August 2015. The two numbers in parentheses indicate how many sampling periods this species was observed during and the total number of individuals recorded, respectively.
Mite SpeciesFeeding GuildGardenia thunbergiaRothmannia globosaTecomaria capensis
Agistemus tranatalensis MeyerPredacious(6; 8)(3; 9)(6; 10)
Neoseiulus californicus (McGregor)Predacious(24; 128) (19; 28)
Brevipalpus sp.Phytophagous(12; 56) (1; 2)
Bunaxella zebedielensisPredacious (12; 17)
Eriophyiodea (unknown)Phytophagous(3; 23)(16; 177)(6; 49)
Euseius addoensis (McMurtry)Predacious(11; 20)(26; 51)(32; 62)
Oribatid sp.Mycophagous(12; 25)(17; 23)
Panonychus ulmi KochPhytophagous (14; 21)
Saproglyphus sp.Mycophagous(24; 46)(34.211)(19; 71)
Siculobata sicula (BERLESE 1892)mycophagous/Saprophytic(1; 5)
Tetranychus sp.Phytophagous (18; 56)(5; 26)
Tetranychus sp. (new)Phytophagous (2; 3)
Tetratriophtydeus myacanthus (Ueckermann)Predacious(18; 97)(2; 6)(5; 11)
Tydeus munsteri Meyer and RykePredacious(25; 158)(25; 174)(34; 462)
Typhlodromus microbullatus Van der MerwePredacious(6; 14)(10; 19)(1; 1)
Table 2. Multiple linear regression showing relationships between mite abundance and climatic variables.
Gardenia thunbergiaRothmannia globosaTecomeria capensis
Min. TempStd. error0.330.370.46
T value2.570.17−1.17
p value0.560.850.24
Max. TempStd. error0.200.220.27
T value1.990.780.23
p value0.050.430.81
Rel. Humidity @ 08:00Std. error0.100.190.14
T value−0.16−1.74−0.53
p value0.870.0920.59
Rel. Humidity @ 14:00Std. error0.050.050.06
T value1.031.561.06
p value0.300.120.29
Rain the day beforeStd. error0.270.300.38
T value−0.98−1.37−0.24
p value0.330.170.80
Accumulative rainfallStd. error0.040.040.05
T value0.171.86−1.50
p value0.860.070.14
Table 3. Multiple linear regression showing relationships between mite species richness and climatic variables (* indicates significant results).
Gardenai thunbergiaRothmannia globosaTecomeria capensis
Min. TempStd. error0.100.090.08
T value−0.37−1.59−1.11
p value0.700.120.27
Max. TempStd. error0.060.050.05
T value−0.4090.520.36
p value0.680.600.71
Rel. Humidity @ 08:00Std. error0.030.030.02
T value−2.080.36−0.07
p value0.04 *0.710.93
Rel. Humidity @ 14:00Std. error0.010.010.01
T value−0.950.980.12
p value0.340.330.89
Rain the day beforeStd. error0.080.080.07
T value0.28−0.84−0.11
p value0.780.400.91
Accumulative rainfallStd. error0.010.010.01
T value0.67−0.080.29
p value0.570.930.77
Disclaimer/Publisher’s Note: The statements, opinions and data contained in all publications are solely those of the individual author(s) and contributor(s) and not of MDPI and/or the editor(s). MDPI and/or the editor(s) disclaim responsibility for any injury to people or property resulting from any ideas, methods, instructions or products referred to in the content.

