Article

Variation and Correlation among Fine Root Traits of Desert Plants in Arid Areas of Northwest China

1
College of Forestry, Gansu Agricultural University, Lanzhou 730070, China
2
Wuwei Academy of Forestry, Wuwei 733000, China
*
Author to whom correspondence should be addressed.
These authors contributed equally to this work.
Forests 2024, 15(3), 476; https://doi.org/10.3390/f15030476
Submission received: 21 January 2024 / Revised: 1 March 2024 / Accepted: 1 March 2024 / Published: 3 March 2024
(This article belongs to the Section Forest Ecophysiology and Biology)

Abstract

:
The variation and correlation among desert plant traits are helpful to understanding the adaptation strategies of plants to the environment and the mechanism of community assembly. However, the diversity and covariation among fine root traits of desert plants and their phylogenetic relationships remain unclear. Principal component analysis, Pearson’s correlations, phylogenetic independent comparison, mixed linear model, and variance decomposition were used to investigate the variation and correlation among 10 fine root traits of 25 common desert plants in arid areas. The results are as follows: (1) We found that all fine root traits varied more among interspecific variation, with the coefficient of variation ranging from 21.83% to 105.79%. Most traits were predominantly shaped by interspecific variation, whereas root phosphorus content (RPC) and intraspecific variation in root carbon/nitrogen ratio (RCN) were more important. (2) Root traits were correlated with four axes of variation. Root nitrogen content (RNC) correlated positively with root diameter (AD) and tissue density (RTD) but negatively with specific root length (SRL), which was inconsistent with the inference of the root economics spectrum (RES). (3) Covariance and trade-off strategies of fine root traits in different life forms of plants were different. Herb RNC was negatively correlated with SRL and positively correlated with AD, while this relationship did not exist in shrubs. Moreover, shrub AD was negatively correlated with RTD, but herbs showed no significant correlation. (4) Influenced by phylogenetic factors, fine root traits exhibited a covariant or trade-off pattern. Taken together, fine root traits were predominantly shaped by interspecific variation, but intraspecific variation also played a significant role. Concurrently, distinct patterns in fine root covariation and trade-off strategies among different life forms of plants were also observed. Future studies should explore the variation and correlation among traits at different scales within and between species from the perspective of life form.

1. Introduction

A plant trait is a physiological, biochemical, or morphological characteristic that reflects the long-term adaptation of the plant to the environmental condition (such as soil and precipitation). Plant traits play a crucial role in resource acquisition and nutrient cycling [1,2]. The common variability and correlation between different traits of plant organs provide a guarantee for plant survival and development. Meanwhile, a series of different variations and combinations among plant traits are survival strategies formed by their long-term interaction with the environment [3,4]. Fine roots are the main organs of plants for acquiring water and nutrients [5], and their traits are highly sensitive to habitat changes. Fine root traits affect the acquisition and utilization of resources for plants, and thus influence their adaptation and survival under different environmental conditions [6]. Consequently, analyzing the variation and association among fine root traits can elucidate the adaptation strategies of plants to soil conditions and integrate the individual plant, the environment, and the ecosystem to uncover the interactions and functions of biological and ecosystem processes. This provides a valuable approach for studying various ecological issues, such as plant community assembly and biodiversity maintenance mechanisms [7,8,9].
Fine root traits are an important aspect of understanding plant strategies for acquisition of resources in the subsurface and play a pivotal role in understanding plant responses to environmental change from a local to a global scale. Recently, a large number of studies have been performed on the intraspecific and interspecific variations among fine root traits [10,11,12]. These studies have promoted our insight into the limitations of fine root trait variation, such as life form and phylogenetic relationship. According to reports, the morphological, chemical, and physiological traits of fine roots in different individuals of the same species adjust adaptively with environmental changes (intraspecific variation) [13]. In addition, there are significant differences in the fine root traits of different species (interspecific variation), which indicates differences in resource acquisition and survival and growth strategies [14], and this difference may be limited by phylogeny [15,16]. In addition, the differences in external morphology, internal tissue structure, and physiological characteristics of plants are closely related to their life form. Specifically, plants with the same life form have different fine root characteristics due to the influence of habitat heterogeneity. The effects of evolution and the environment on plants of different life forms are more prominent [3,17,18].
The variation among fine root traits of plants reflect a universal trade-off between the acquisition and conservation of underground resources [19]. The variation in root traits along root order [20], environmental gradient [21], and interspecific differences [22] form the root economic spectrum (RES) at different scales. The published studies on key fine root traits in RES, such as root diameter (AD), specific root length (SRL), root tissue density (RTD), and root nitrogen content (RNC), are an important aspect of validating the RES hypothesis [22,23]. For the root system, SRL and RNC characterize the plant’s ability to capture and assimilate underground resources, while root diameter (RD), RTD, and RNC characterize the plant’s ability to transport substances and colonization of mycorrhizal fungi, defend against external stress, and metabolize and decompose substances, respectively [24,25]. Therefore, the multidimensional differentiation of root function and its collaboration with mycorrhizal fungi often result in root traits varying along multiple dimensions [26,27].
Desert plants play a crucial role in maintaining the stability of the desert ecosystem. Through long-term evolutionary selection, these plants have developed special morphological and physiological traits that are well suited to arid environments [28,29]. Plants alleviate the water limitations on root growth and development in arid environments by increasing root surface area and volume [30]. In addition, under drought and barren environment, plants usually balance the efficiency of root resource acquisition and resource preservation by increasing SRL and SRA, while reducing RD and RTD [31]. The arid and semi-arid regions of northwest China are rich in light and thermal resources, which gives rise to a gradual temperature–humidity climate gradient from southeast to northwest [32]. This diverse habitat supports a wide distribution of shrubs and herbs. These distribution patterns serve as suitable research sites and experimental objects for studying the variation and correlation among fine root traits. Additionally, they offer valuable experimental material for verifying the RES. We hypothesize that (1) the variation among fine root traits in desert plants is mainly derived from interspecies variation, but intraspecies variation cannot be ignored either. (2) The variation among fine root traits in desert plants is multidimensional, and the relationship between fine root traits and root function in different life forms of plants is consistent with the RES hypothesis. (3) The fine roots of desert plants can adapt to arid and barren habitats through internal coordination and trade-off of characteristics, such as increasing SRL and SRA, while reducing RD and RTD, and this association is affected by phylogeny.

2. Materials and Methods

2.1. Study Area

The desert plant communities in four sites along a precipitation gradient in northwest China were investigated: Jiuquan (JQ), Zhangye (ZY), Wuwei (WW), and Baiyin (BY) (Figure 1). These sites spanned a range of desert environments, from extreme desert to desert steppe. Table S1 summarizes the characteristics of each site.

2.2. Experimental Design

A transect approximately 900 km from southeast to northwest was established in the northwest region of China in July 2020. Four experimental sites in the transect were selected to investigate desert plant species and communities. Firstly, shrub/herb vegetation areas with flat terrain and unaffected by grazing were selected at each sampling point. Then, the communities in five 10 m × 10 m quadrats at the ends and midpoints of the diagonals of each of the three 50 m × 50 m plots were surveyed (Table S2). A total of 12 plots were established in four experimental sites.
According to Cheng et al. [33], 25 common species (relative abundance > 1%) including 11 shrubs and 14 herbs were identified. Then, 5 plants of each common species were randomly selected in each large quadrat, totaling 15 plants per site. Considering the horizontal and vertical distribution range of the plant root system, we selected plants (shrubs and herbs) as the central point and excavated soil cores with a length, width, and depth of 1 m, 1 m, and 0.4 m for herbs, and with a length, width and depth of 1 m, 1 m, and 0.8 m for shrubs, respectively (more than 75% of the roots are concentrated in this range) [34]. The root system of each plant was collected by finding the major root and selecting the visible root, excavating downward along root extension until the set depth, and carefully removing sediment around the root tips to avoid damaging roots. This was continued until all of the fine roots on the main root were either visible or numerous. Then, we used scissors to cut a sufficient amount of primary and secondary roots (<2 mm) from each plant. The soil and impurities of the root surface were cleaned. Afterwards, the collected roots were stored in plastic bags, transported back to the laboratory at −4 °C, and analyzed (Table 1).

2.3. Measurement of Root Traits

The root systems were cleaned with deionized water, placed on an Epson scanner (Epson, Los Alamitos, CA, USA) for scanning, and the images were processed and analyzed with WINRHIZO V750 (Regent Instruments, Quebec, QC, Canada) to measure root diameter, length, surface area, and other traits (Table 1). Then, the scanned roots were dried in an envelope at 75 °C until constant weight and their dry weight was determined with electronic balance (0.0001 g).
The measured plant samples were ground using a grinding groove to determine the chemical properties of the root system. Organic carbon, total nitrogen, and total phosphorus concentration of the roots were determined using potassium dichromate oxidation heating, Kjeldahl, and vanadium molybdenum yellow colorimetric methods, respectively [35], and then their stoichiometric ratios (carbon–nitrogen, carbon–phosphorus, and nitrogen–phosphorus) were calculated. Finally, the coefficient of variation (CV) of 10 root traits was calculated.

2.4. Construction of Phylogeny

The phylogenetic tree was constructed using the online software Phylomatic v3.0 [36]. The software integrates the phylogenetic tree framework of Zanne et al. [37]. The software can generate a phylogenetic tree and obtain branch lengths based on the species checklist according to the Angiosperm Phylogeny Group supertree (APG III; http://www.mobot.org/MOBOT/research/APweb, accessed on 22 March 2023) [37,38]. Firstly, the “plantlist” package in R-4.0.3 was used to convert the species list into a format compatible with Phylomatic [39]. Based on the adjusted family and genus names, the phylogenetic tree of each species was constructed with Phylomatic. Lastly, the evolutionary tree was drawn with the V.PhyloMaker package in R4.0.3 [40].

2.5. Measurement of Soil Water Content and Chemical Properties

Soil water content was determined by the oven-drying method [41]. Organic carbon content was determined by the potassium dichromate external heating method, and total nitrogen and total phosphorus content were determined by the Kjeldahl method and vanadium molybdenum yellow colorimetric method after H2SO4-H2O2 digestion, respectively [35].

2.6. Data Analysis

Morphological traits of root were calculated as follow: specific root length = root length/root biomass; specific root area = root surface area/root biomass; root tissue density = root biomass/root volume. To assess the contribution of intraspecific and interspecific variations among root traits to the total variation, the lme4 package AIC and coefficient of determination (r2) were used to select the optimal linear mixed model in R-4.0.3. The glmm.hp function in the “glmm.hp” package was used to decompose the variance [42,43]. The ratio of variance components indicated the relative effect of each scale change. The relationships between individual traits and resource economy were also examined using principal component analysis and Pearson’s correlation analysis. Lastly, Pearson’s correlation was used to analyze the relationships between root traits, and phylogenetic independent comparison (PIC) was used to analyze the relationships between root traits after the effects of phylogeny were removed. The ‘pic’ function of the ‘ape’ package was used to calculate the PIC values of each trait. The K and p values were calculated using “picante” and “ape” packets. All of the above statistical analyses and graphing were performed in R-4.0.3, Origin 2022 [44], and Canoco 5 [45].

3. Results

3.1. Total Variation of Fine Root Traits

Wide variation was observed among 10 fine root traits and the total degree of variation was 23.27%–119.02%. The highest variation was observed for SRL (119.02%), followed by SRA (88.79%) and LCP (80.75%), and the lowest was observed for LCC (23.27%) (Table 2). Based on the mixed linear model and variance decomposition results, we found that the interspecific variation among seven fine root traits (AD, SRL, SRA, RTD, RCC, RNC, RNP, RCP) contributed more to the total variation (Figure 2). However, the intraspecific variation among two fine root traits (RPC and RCN) contributed more to the total variation (Figure 2). Interestingly, the interspecific contribution of four fine root traits (AD, SRL, RCC, and RCP) was much greater than that within species, as the intraspecific contribution was only 0.55%–10.12% (Figure 2). The contribution of interspecific variation of six fine root traits (SRA, RTD, RNC, RPC, RCN, and RNP) was 23.50%–76.21%, and the intraspecific variation was 24.51%–76.50% (Figure 2).

3.2. Intraspecific and Interspecific Variations among Fine Root Traits within Life Forms

The fine root traits of 25 common desert plants varied across intraspecific and interspecific levels (Table 3). The intraspecific variation of each trait was relatively small, with the coefficient of variation ranging from 12.36% to 65.46% (Table 3). AD showed the lowest intraspecific variation, whereas RNP showed the highest, in both shrubs and herbs. Intraspecific variation differed greatly among life forms: shrubs had higher variation than herbs in AD, SRL, RTD, RCC, RNC, RPC, RCN, RNP, and RCP, whereas herbs had higher variation than shrubs in SRA. Significant differences in intraspecies variation were observed in different life forms of plants. The intraspecies variation in AD, SRL, RTD, RCC, RNC, RPC, RCN, RNP, and RCP was greater in shrubs than in herbs, except for SRA.
Each fine root trait had the highest variation at the interspecific level, with the coefficient of variation ranging from 21.83% to 105.79% (Table 3). For both shrubs and herbs, SRL had the highest interspecific variation, while AD in shrubs and RCC in herbs had the lowest interspecific variation. Interspecific variation differed greatly among life forms. Shrubs had higher variation than herbs in RTD, RCC, RNC, RCN, RNP, and RCP. However, herbs had higher variation than shrubs in AD, SRL, SRA, and RPC. The relative magnitudes of the intraspecific and interspecific variations indicated that the coefficient of variation for shrubs, herbs, and communities was greater for interspecific variation than for intraspecific variation (Table 3).

3.3. Relationship between Fine Root Trait Variation and Root Economic Spectrum

To test the fine root traits of different life forms of plants, the main axis of root trait variation was evaluated by PCA. The PCA revealed four major axes of variation among fine root traits (Figure 3, Table S3), explaining 34.6%, 30.6%, 16.4%, and 34.6% of the total variance, respectively. Morphological traits (SRL and SRA) scored higher on the first axis, chemical traits (RCP, RPC, and RNP) on the second axis, RTD, RNC, and RCN on the third axis, and AD and RCC on the fourth axis.
To further analyze whether the fine root traits of different life forms supported RES, three key fine root traits (AD, SRL, and RNC) related to nutrient transport and conservation were selected from the four main axes of PCA. The relationships between 10 fine root traits of 25 desert plants were examined by Pearson’s correlation analysis. The results revealed that SRL of shrubs and herbs was highly significantly and negatively correlated with AD and RTD (Figure 4a,b, p < 0.01). There was a significantly negative correlation between AD and RTD in shrubs (Figure 4d, p < 0.05), and RNC was not significantly correlated with SRL and AD (Figure 4c,e, p > 0.05). The RNC of herbs was strongly and negatively correlated with SRL (Figure 4c, p < 0.01), positively correlated with AD (Figure 4e, p < 0.01), and RTD was not significantly correlated with AD and RNC (Figure 4d,f, p > 0.05). Overall, SRL was highly significantly and positively correlated with AD and RTD (Figure 4a,b, p < 0.01), RNC was negatively correlated with AD and SRL (Figure 4c,e, p < 0.01), and RNC was weakly correlated with RTD (Figure 4f). These results suggested that there may be synergy and trade-offs among fine root traits in desert plants. This covariation was influenced by life form. Nevertheless, root function and the correlation among most fine root traits, excluding SRL, AD, and RTD, did not conform to the hypothesis of RES (Figure 4).

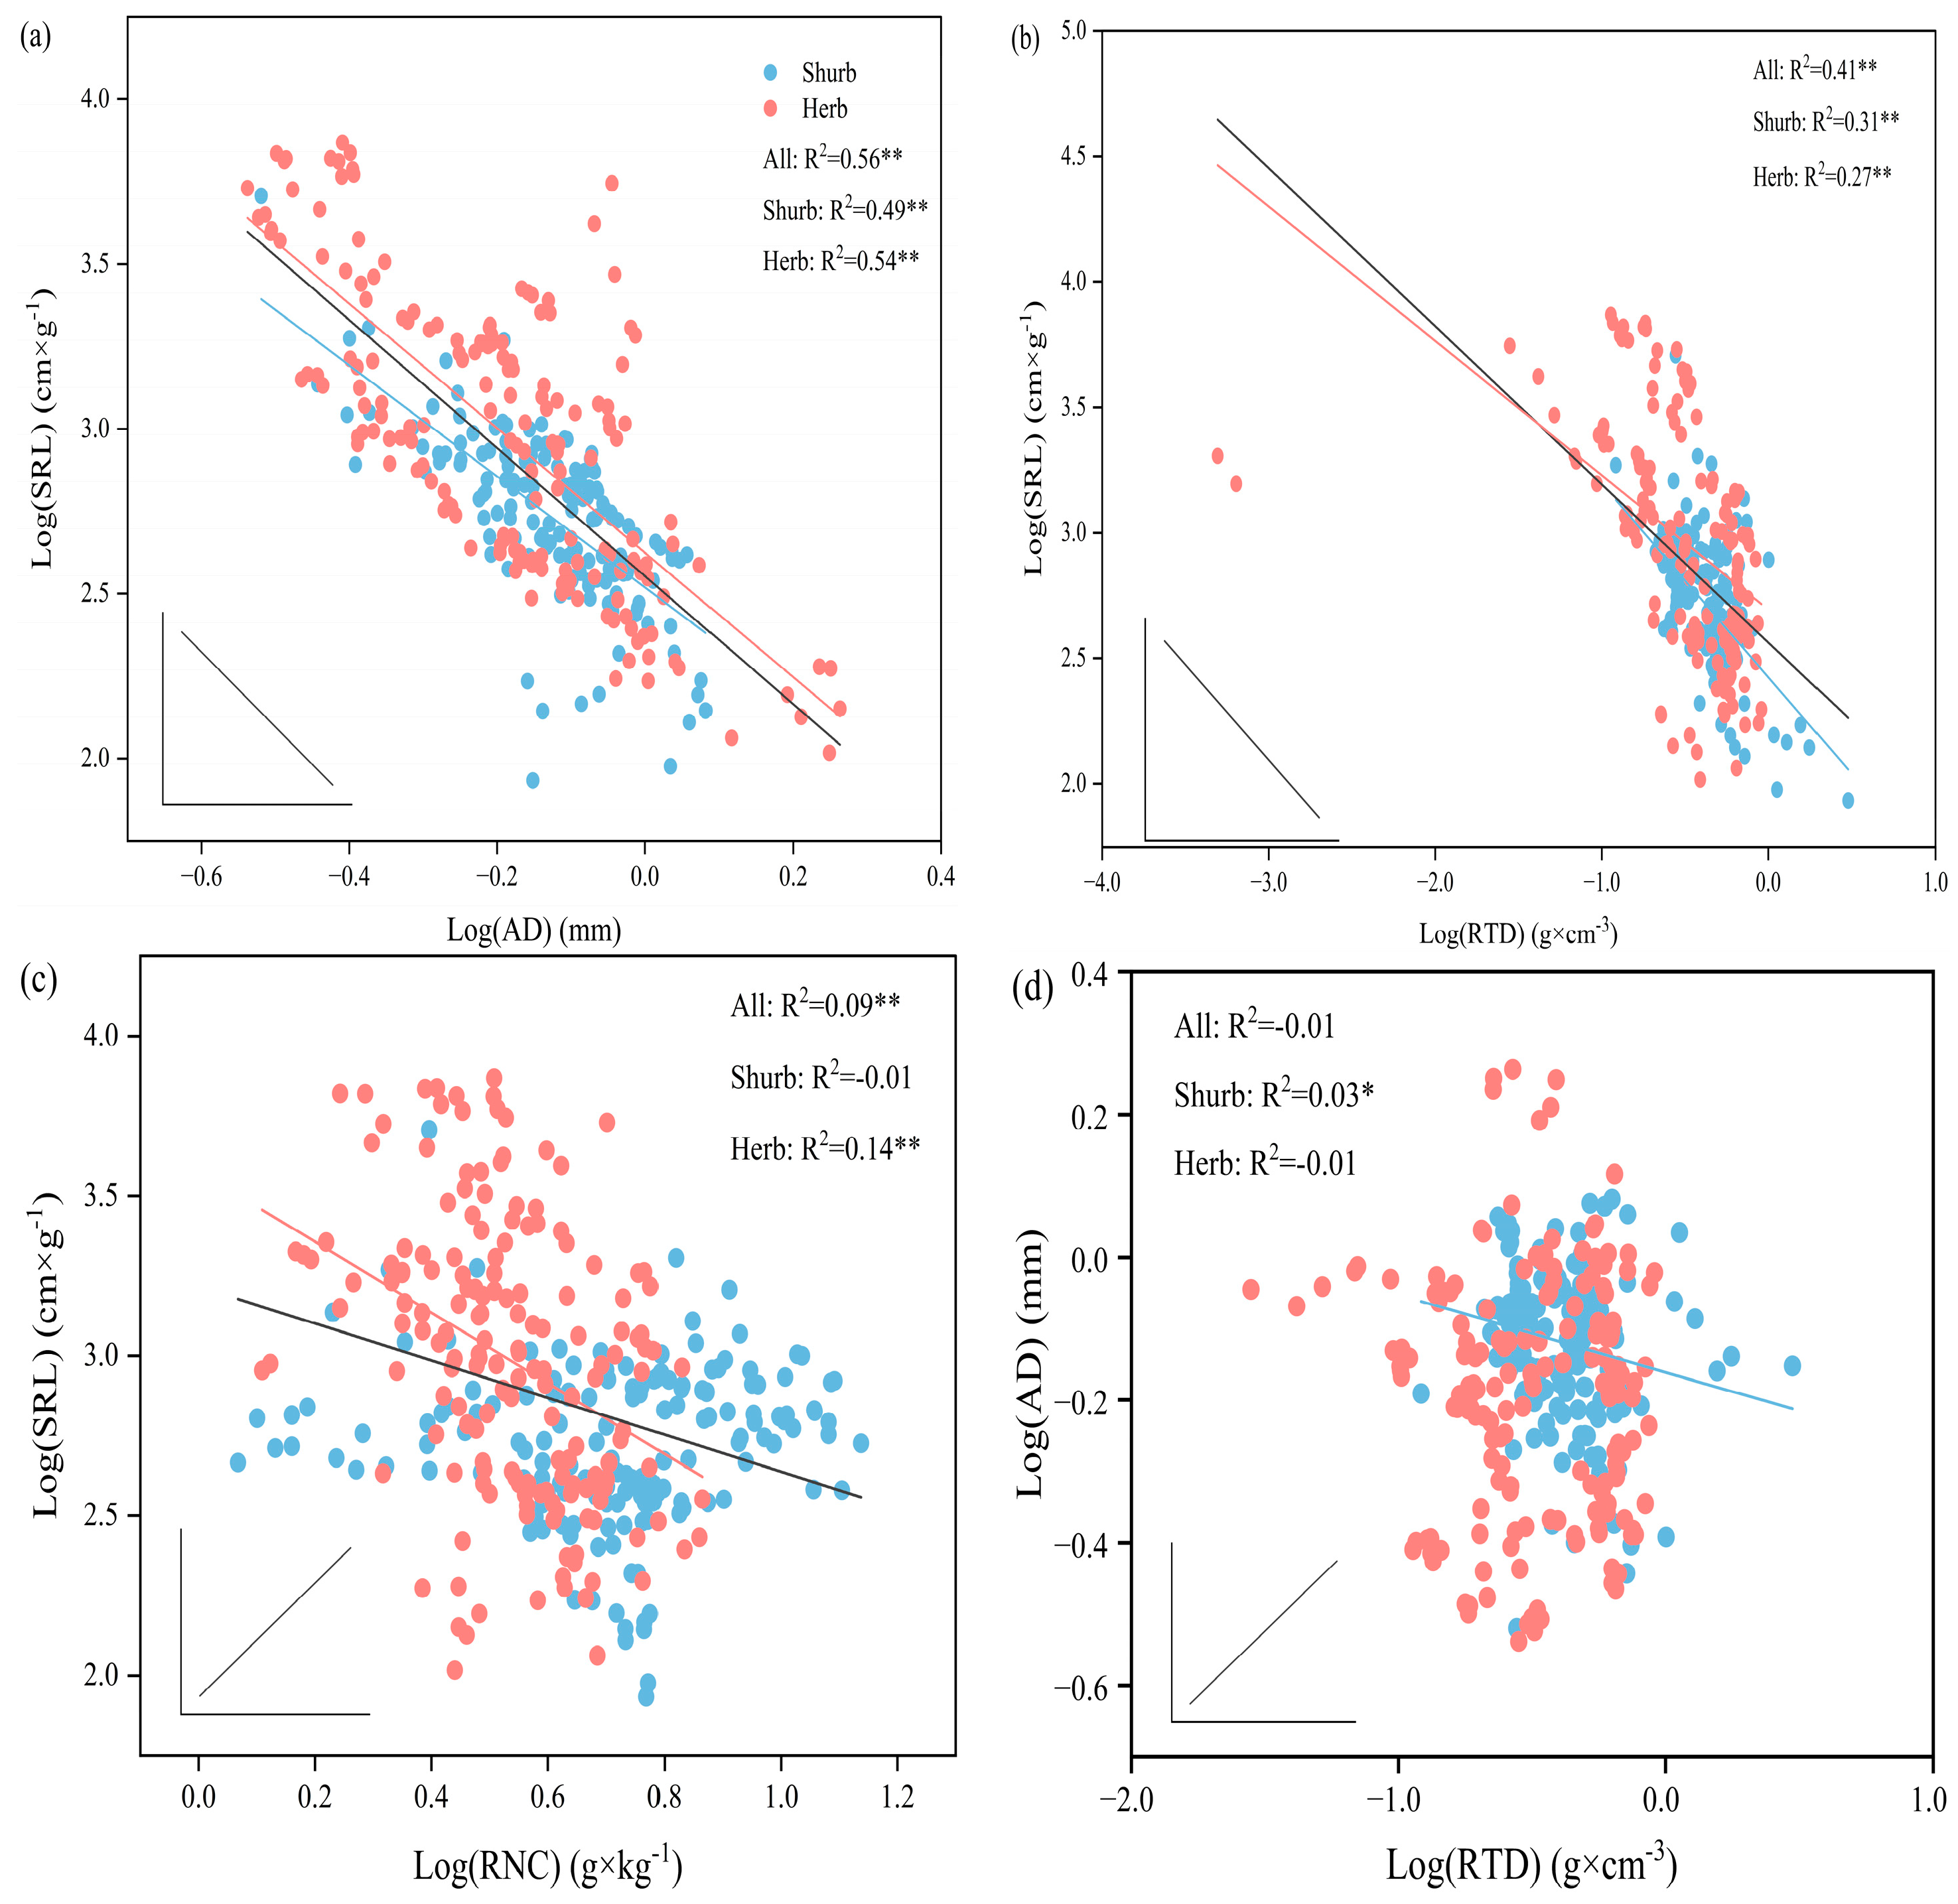
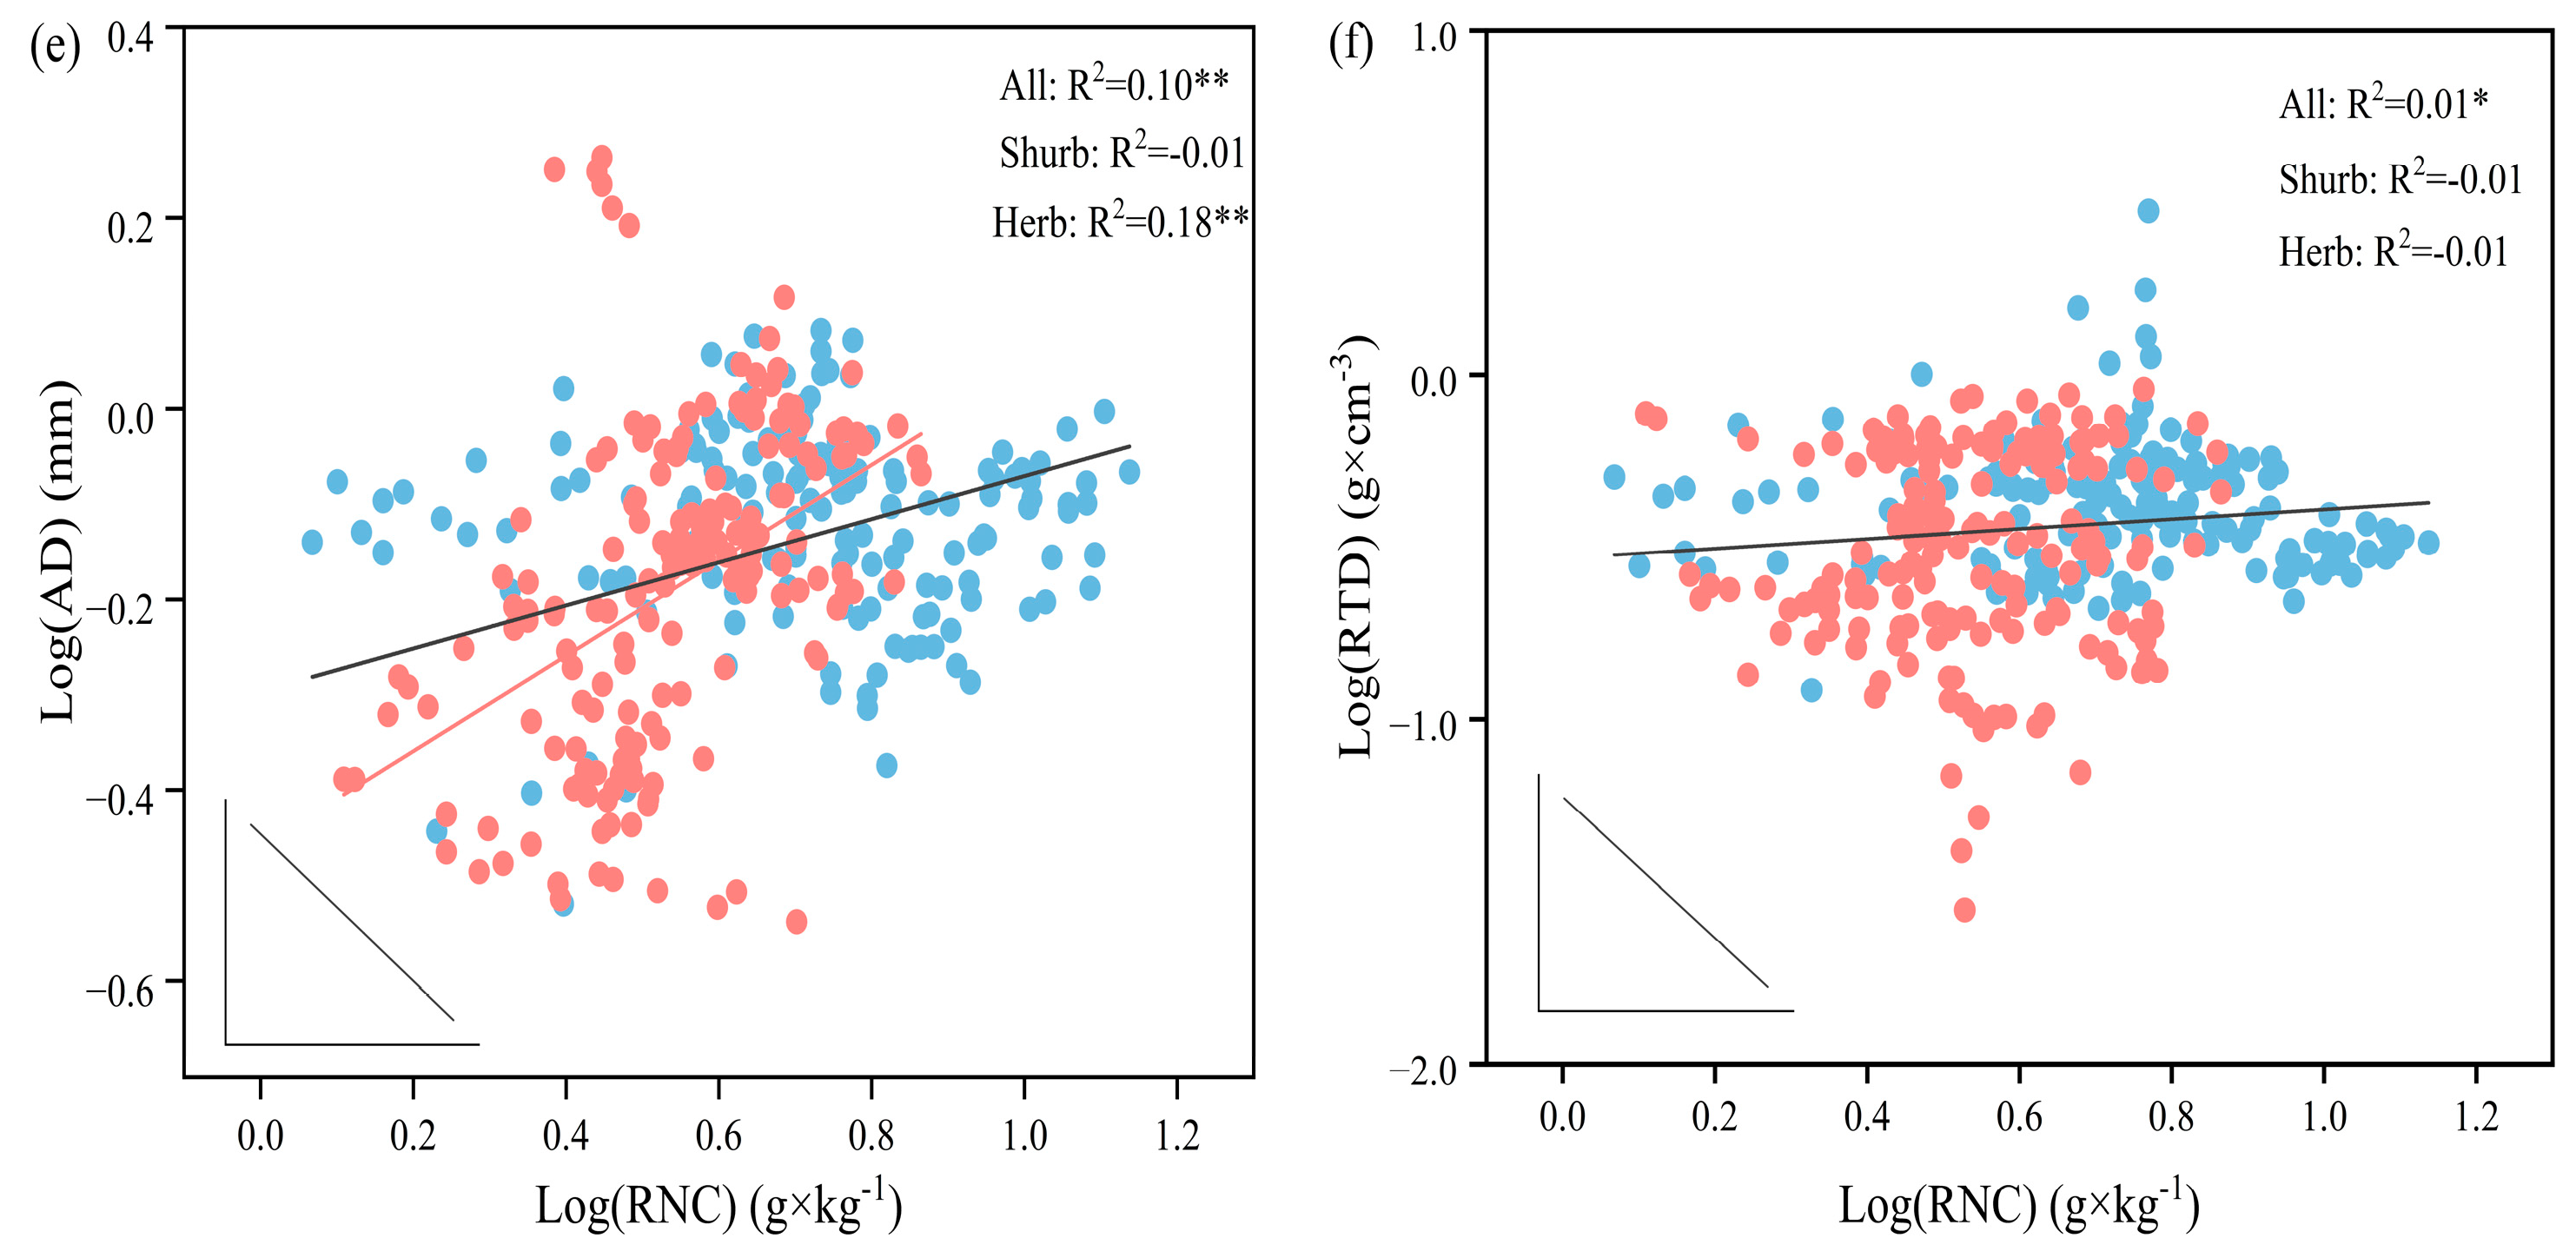
3.4. Correlation among Fine Root Traits

Pearson’s correlation tests revealed strong internal correlation among the 10 fine root traits (Table 4). As for morphological traits, significant correlations were observed between AD, SRL, and SRA; between SRL, SRA, and RTD; and between SRA and RTD (Table 4, lower left diagonal, p < 0.05). In terms of chemical traits, significant correlations were observed between RCC and RNC, RPC, RCN, RNP, and RCP; between RNC and RPC, RCN, RNP and RCP; between RPC, RNP, and RCP; between RCN and RNP; and between RNP and RCP (Table 4, lower left diagonal, p < 0.05). There were also significant correlations between morphological and chemical traits. For instance, there were significant correlations between AD and RNC, RPC and RCN, SRL and RNC, RCN and RNP, SRA and RCN and RNP, and RTD and RCN (Table 4, lower left diagonal, p < 0.05). The results of the phylogenetic analysis indicated that no significant phylogenetic signals were detected for each trait (Table S4, p > 0.05). After removing the influence of phylogenetic relationships, the relationships among fine root traits changed (Table 4, p < 0.05).

3.5. Correlation between Fine Root Traits and Environmental Factors

To examine the impact of environmental factors (climate and soil) on fine root traits, the redundancy analysis (RDA) method was used to evaluate the interaction between fine root traits and environmental factors. The RDA ranking chart (Figure 5) showed that Axis 1 and 2 explained 80.38% and 15.89% of the relationship between fine root traits and environmental factors, respectively. The first sorting axis, SW, was positively correlated with RCP and RTD, and negatively correlated with SRL, SRA, and RCC. AP, SP, and SN were negatively correlated with RCP and RTD, and positively correlated with SRL, SRA, and RCC. The second sorting axis, SC, was negatively correlated with RNC and RNP, and positively correlated with RCN, RPC, and AD.

4. Discussion

4.1. Variation among Fine Root Traits Explains the Adaptation of Desert Plants to Heterogeneous Environments and Interspecific Competition

Based on interspecific and intraspecific variations among plant functional traits, different species can coexist and assemble stable plant communities [46]. The published empirical results on variations among plant functional traits at different ecological scales have found that interspecific and intraspecific variations are crucial indicators of plant response, adaptation to environmental changes, as well as resource competition strategies [12,47]. The results showed that interspecific variation was greater than intraspecific variation for all fine root traits in the present investigation (Table 3). The linear mixed model and variance decomposition showed that for most of the fine root traits, except for RPC and RCN, the contribution of interspecific variation to the total variation was greater than that of intraspecific variation (Figure 2). Consistent with our first hypothesis, the variation among fine root traits of desert plants in northwest China was mainly derived from interspecies variation, but intraspecific variation could not be ignored either. The research results showed that the coefficient of interspecific variation (CV) of the plant fine root traits ranged from 21.83% to 105.79%, the intraspecific CV ranged from 12.36% to 65.46%, and the magnitude of interspecific variation was greater than that of intraspecific variation. This was consistent with most previous studies [14,48,49,50], which indicated that when interspecific competition and environmental filtering simultaneously affect fine root traits, desert plant roots can adapt to highly heterogeneous desert soil environments through convergence or divergence of different traits. And the above results also revealed that plants long to adapt to environmental conditions and can form unique resource acquisition and survival strategies as a result of the mutual choices of the plant and the environment [51,52].
Intraspecific variation is an important characterization of plant response to environmental changes and phenotypic plasticity [53,54]. The research on intraspecific variation is conducive to understanding the interactions between different individuals from the same taxonomic species and between individuals and the environment in community assembly. Mate analysis of global plants demonstrates that intraspecific variation substantially contributes to the trait diversity within and among plant communities, although it is typically lower than interspecific variation [11]. If prolonged and extreme drought conditions [54] cause regional species richness to be reduced [55,56], plants can induce a functional community response mainly through intraspecific variation [57,58]. In the present study, the results showed that the intraspecific variation among some chemical traits (RPC and RCN) was greater than the interspecific variation, which indicated that intraspecific variation is a imperial source of fine root trait variation and should not be overlooked. For the desert plants investigated in this study, the harsh natural environment in desert areas promoted intraspecific variation to some extent [57] to achieve the purpose of plant evolution [59] and to adapt to the current stress. Thus, studying intraspecific variation is useful in revealing the overlooked community model in published research [54].
By neglecting intraspecific variation and focusing only on interspecific traits, the degree of niche and trait overlap among species will be severely underestimated, as well as the relative importance of species in competition [53,60]. In contrast, accounting for intraspecific variation can reveal phenotypic plasticity arising from factors such as genotypic variation among individuals and habitat heterogeneity within species [61,62]. Consequently, trait-based ecological research in the future should not simply substitute individual-level data with species-level mean traits and disregard intraspecific variation. Plant adaptation strategies to the environment should be investigated based on individual-level sampling and integrate both intraspecific and interspecific trait variations to better unravel the mechanism of plant community assembly and biodiversity maintenance [63,64].

4.2. The Multidimensional Variation among Fine Root Traits Mitigates Potential Desert Environmental Stress

In this study, our results did not support the existence of a one-dimensional RES for fine root traits among plant species. Instead, variation among fine root traits is multidimensional (Table S3, Figure 3). The multidimensional variation among fine root traits in desert plants may endow their roots with different strategies (such as adjusting root morphology and/or root chemistry) to alleviate various potential environmental stresses in highly heterogeneous desert habitats. The published research on the variation among plant root traits is consistent with our research, that is, the variation among fine root traits is multidimensional [26,65,66]. This may be because fine roots undertake multiple ecological functions, such as anchoring, mycorrhizal colonization, and resource absorption, while also dealing with more complex soil environments [67]. The one-dimensional RES theory suggests that RNC and SRL are related to root fast acquisition [27,68,69], and thus they should be positively coordinated. However, this study showed a negative correlation between RNC and SRL (Table 4, lower left diagonal), indicating that there were differences in root metabolism, turnover, and resource acquisition among desert plant species. This further suggested that species with low RNC can be allowed to have high SRL, which is in line with the theoretical framework of two-dimensional RES [70].
Furthermore, although correlation between some of the fine root traits of shrubs and/or herbs suggested a trade-off between rapid acquisition and conservatism, the typical fast acquisition and conservative trait performance were inconsistent with the hypothesis of RES. This was contrary to our assumption of fine root RES for desert plants, including shrubs and herbs. Our results showed that herbaceous RNC was negatively correlated with SRL and positively correlated with AD (Figure 4c,e). Because the resources available to plants in desert areas are usually limited, the increase in root length, decrease in root diameter, and decrease in root nitrogen concentration per unit of carbon investment can help to alleviate the limitations of soil, water, and other environmental factors on root development [71,72,73]. In addition, the experimental results of this study on root traits in shrubs and other published empirical results indicated a significantly negative correlation [26,74,75], or even no correlation, between RD and RTD [76]. This trade-off further indicated that the variation among fine root traits in the plants investigated in this study was multidimensional. AD, which is closely related to mycorrhizal colonization, represents resource acquisition, while RTD is closely related to resistance to environmental stress and resource preservation [70,77]. This trade-off between resource acquisition and preservation is beneficial for the root system to adopt the optimal resource acquisition strategy in environments with limited resources [78,79].
Although traits are constantly and dynamically changing, covariation and trade-off among different traits are relatively stable in the evolutionary process of the ecosystem [80,81]. Phylogenetic evolution is a process in which the species is represented from origination to the evolution of the process as a whole (Figure S1). The results of this study revealed that no significant phylogenetic signals were detected for each fine root trait (Table S4). This result suggested that the fine root traits of 25 desert plants investigated in this study were mainly affected by environmental conditions, but the phylogenetic relationships imposed very weak restrictions [82,83]. After the influence of phylogenetic relationship was removed, it was found that the correlation between various fine root traits changed. Some significantly correlated traits disappeared after PIC treatment, which indicated that the covariation between these traits was influenced by the phylogenetic relationship. Others remained significantly correlated after PIC treatment, indicating that this correlation may be independent of phylogenetic development. In other words, consistent with our third hypothesis, there was a trade-off between the fine root traits of desert plants in northwest China, and this relationship was affected by phylogeny.

4.3. Influence of Soil and Climatic Conditions on Fine Root Traits in Desert Plants

Soil and climate conditions are widely considered as the main factors affecting the variation among plant root functional traits [19,84]. Root functional traits exhibit a series of morphological and physiological plasticity for adapting to the environment [85]. This study showed that soil water content (SW) was positively correlated with RTD, and negatively correlated with SRL, SRA, and RCC (Figure 5). Plants usually develop roots with high SRL and SRA to alleviate the limitations of water scarcity on root growth and development [30] and acquisition ability [31] during soil water content decline. In addition, this study showed that SRA and SRL were positively correlated with soil phosphorus content (SP) and the correlation was stronger than with SNC (Figure 5). This may be due to SP having a greater impact on plant underground properties [19]. Moreover, fine roots can improve nutrient acquisition in soil by increasing SRL and SRA, thus a positive correlation between them and soil nutrients is often observed [19]. This study also found that annual average precipitation (AP) was positively correlated with SRL, SRA, and RCC, while negatively correlated with RTD, RNC, and RNP (Figure 5). Specifically, changes in precipitation alter the availability of soil moisture and nutrients [31]. In other words, the availability of water and nutrients in the soil increases as precipitation increases, and nutrient distribution simultaneously becomes more dispersed. Therefore, the root system increases the fine root carbon content (RCC) to develop finer and longer root performance to improve its exploration and foraging ability for soil nutrients [86]. Conversely, when precipitation decreases, the root system will adopt a relatively conservative resource strategy, developing a high tissue density root system [87], while the decrease in nutrient availability leads to an increase in RTD [15]. In addition, soil carbon content (SC) and soil nitrogen content (SN) were negatively correlated with RNC and RNP (Figure 5). In low soil fertility conditions, the root system enhances metabolic activity and root respiration to enhance nutrient turnover. Overall, the complexity of the soil environment makes the ways for roots to obtain resources more multidimensional, which makes their relationships more complex and diverse.

5. Conclusions

The fine root traits of desert plants in northwest China vary more among than within species, but intraspecific variation is still considerable. Furthermore, the variation among fine root traits of desert plants is a multi-dimensional variation model, and there is a certain covariant or trade-off relationship between fine root growth and resource acquisition strategies, which depends on life form and phylogeny. When interspecific competition and environmental filtering simultaneously affect fine root traits, desert plant roots can adapt to highly heterogeneous desert soil environments through convergence or divergence of different traits. However, we have not found a general trade-off among fine root RES traits in desert plants, so desert fine roots may not support the RES hypothesis.

Supplementary Materials

The following supporting information can be downloaded at: https://www.mdpi.com/article/10.3390/f15030476/s1, Figure S1. Phylogenetic tree of 25 desert plants. The same color indicates that the species come from the same family; Table S1. General characteristics of the study site; Table S2. Species survey of experimental sites. The table shows the total number of species in each test site, as well as the total number of shrubs and herbs in each test site; Table S3. List of principle components, percentage of variance, the cumulative percentage; Table S4. Blomberg’s K value and p-value of phylogenetic signals of fine roots functional traits of 25 desert plants. See Table 3 for abbreviations of the fine root traits.

Author Contributions

J.M.: Investigation (lead); methodology (equal); data curation (lead); data analysis (lead); writing—original draft (lead); writing—review and editing (supporting). T.W.: Conceptualization (supporting); supervision (equal); methodology (equal); writing—review and editing (lead). H.W.: Investigation (lead); Resources (equal); Supervision (equal). J.Y.: Data acquisition and curation (lead). T.X.: Funding acquisition (lead); Resources (lead). Z.Z.: Funding acquisition (lead); Resources (lead). C.H.: Resources (equal); L.S.: Conceptualization (equal); Methodology (lead); Funding acquisition (lead); Writing—review and editing (lead). All authors have read and agreed to the published version of the manuscript.

Funding

This work was funded by the National Natural Science Foundation of China (32160253 U23A2061); Gansu Provincial Key R&D Program Projects (22YF7FA117); Gansu Provincial Major Project (22ZD6FA052); Excellent Doctoral Program of Gansu Province (23JRRA1452); and 2023 Graduate Student “Innovation Star” Project (2023CXZX-641).

Data Availability Statement

Data are contained within the article.

Conflicts of Interest

The authors declare no conflicts of interest.

References

  1. Zemunik, G.; Turner, B.L.; Lambers, H.; Laliberté, E. Diversity of plant nutrient-acquisition strategies increases during long-term ecosystem development. Nat. Plants 2015, 1, 15050. [Google Scholar] [CrossRef]
  2. Laliberte, E. Below-ground frontiers in trait-based plant ecology. New Phytol. 2017, 213, 1597–1603. [Google Scholar] [CrossRef] [PubMed]
  3. Reich, A.; Ewel, J.J.; Nadkarni, N.M.; Dawson, T.; Evans, R.D. Nitrogen isotope ratios shift with plant size in tropical bromeliads. Oecologia 2003, 137, 587–590. [Google Scholar] [CrossRef] [PubMed]
  4. Bruelheide, H.; Dengler, J.; Purschke, O.; Lenoir, J.; Jimenez-Alfaro, B.; Hennekens, S.M.; Botta-Dukat, Z.; Chytry, M.; Field, R.; Jansen, F.; et al. Global trait-environment relationships of plant communities. Nat. Ecol. Evol. 2018, 2, 1906–1917. [Google Scholar] [CrossRef] [PubMed]
  5. Yuan, Z.Y.; Chen, H.Y.; Reich, P.B. Global-scale latitudinal patterns of plant fine-root nitrogen and phosphorus. Nat. Commun. 2011, 2, 344. [Google Scholar] [CrossRef]
  6. Pregitzer, K.S.; DeForest, J.L.; Burton, A.J.; Allen, M.F.; Ruess, R.W.; Hendrick, R.L. Fine root architecture of nine north american trees. Ecol. Monogr. 2002, 72, 293–309. [Google Scholar] [CrossRef]
  7. Spasojevic, M.J.; Suding, K.N. Inferring community assembly mechanisms from functional diversity patterns: The importance of multiple assembly processes. J. Ecol. 2012, 100, 652–661. [Google Scholar] [CrossRef]
  8. Adler, P.B.; Fajardo, A.; Kleinhesselink, A.R.; Kraft, N.J. Trait-based tests of coexistence mechanisms. Ecol. Lett. 2013, 16, 1294–1306. [Google Scholar] [CrossRef]
  9. Zhang, H.; Chen, H.Y.H.; Lian, J.; John, R.; Ronghua, L.; Liu, H.; Ye, W.; Berninger, F.; Ye, Q.; Timothy Paine, C.E. Using functional trait diversity patterns to disentangle the scale-dependent ecological processes in a subtropical forest. Funct. Ecol. 2018, 32, 1379–1389. [Google Scholar] [CrossRef]
  10. Tobner, C.M.; Paquette, A.; Messier, C. Interspecific coordination and intraspecific plasticity of fine root traits in North American temperate tree species. Front. Plant Sci. 2013, 4, 242. [Google Scholar] [CrossRef]
  11. Siefert, A.; Violle, C.; Chalmandrier, L.; Albert, C.H.; Taudiere, A.; Fajardo, A.; Aarssen, L.W.; Baraloto, C.; Carlucci, M.B.; Cianciaruso, M.V.; et al. A global meta-analysis of the relative extent of intraspecific trait variation in plant communities. Ecol. Lett. 2015, 18, 1406–1419. [Google Scholar] [CrossRef]
  12. Bu, W.; Schmid, B.; Liu, X.; Li, Y.; Härdtle, W.; von Oheimb, G.; Liang, Y.; Sun, Z.; Huang, Y.; Bruelheide, H.; et al. Interspecific and intraspecific variation in specific root length drives aboveground biodiversity effects in young experimental forest stands. J. Plant Ecol. 2017, 10, 158–169. [Google Scholar] [CrossRef]
  13. Doi, R.; Tanikawa, T.; Miyatani, K.; Hirano, Y. Intraspecific variation in morphological traits of root branch orders in Chamaecyparis obtusa. Plant Soil 2017, 416, 503–513. [Google Scholar] [CrossRef]
  14. Poorter, H.; Niklas, K.J.; Reich, P.B.; Oleksyn, J.; Poot, P.; Mommer, L. Biomass allocation to leaves, stems and roots: Meta-analyses of interspecific variation and environmental control. New Phytol. 2012, 193, 30–50. [Google Scholar] [CrossRef] [PubMed]
  15. Kramer-Walter, K.R.; Bellingham, P.J.; Millar, T.R.; Smissen, R.D.; Richardson, S.J.; Laughlin, D.C. Root traits are multidimensional: Specific root length is independent from root tissue density and the plant economic spectrum. J. Ecol. 2016, 104, 1299–1310. [Google Scholar] [CrossRef]
  16. Valverde-Barrantes, O.J.; Freschet, G.T.; Roumet, C.; Blackwood, C.B. A worldview of root traits: The influence of ancestry, growth form, climate and mycorrhizal association on the functional trait variation of fine-root tissues in seed plants. New Phytol. 2017, 215, 1562–1573. [Google Scholar] [CrossRef]
  17. Pinno, B.D.; Wilson, S.D. Fine root response to soil resource heterogeneity differs between grassland and forest. Plant Ecol. 2013, 214, 821–829. [Google Scholar] [CrossRef]
  18. Stearns, S.C. Trade-Offs in Life-History Evolution. Funct. Ecol. 1989, 3, 259–268. [Google Scholar] [CrossRef]
  19. Zhou, Y.; Ma, H.; Lu, Q.; Ma, J.; Shen, Y.; Wang, G. Different responses of leaf and root economics spectrum to grazing time at the community level in desert steppe, China. Sci. Total Environ. 2024, 909, 168547. [Google Scholar] [CrossRef] [PubMed]
  20. Yu, W.; Wang, C.; Huang, Z.; Wang, D.; Liu, G. Variations in the traits of fine roots of different orders and their associations with leaf traits in 12 co-occuring plant species in a semiarid inland dune. Plant Soil 2022, 472, 193–206. [Google Scholar] [CrossRef]
  21. Zhang, G.; Mao, Z.; Maillard, P.; Brancheriau, L.; Gérard, B.; Engel, J.; Fortunel, C.; Heuret, P.; Maeght, J.L.; Martínez-Vilalta, J. Not all sweetness and light: Non-structural carbohydrate storage capacity in tree stems is decoupled from leaf but not from root economics. Funct. Ecol. 2023. Online Version of Record. [Google Scholar] [CrossRef]
  22. Kong, D.; Wang, J.; Wu, H.; Valverde-Barrantes, O.J.; Wang, R.; Zeng, H.; Kardol, P.; Zhang, H.; Feng, Y. Nonlinearity of root trait relationships and the root economics spectrum. Nat. Commun. 2019, 10, 2203. [Google Scholar] [CrossRef]
  23. Gillison, A.N. Plant functional types and traits at the community, ecosystem and world level. Veg. Ecol. 2013, 00, 347–386. [Google Scholar] [CrossRef]
  24. Warren, J.M.; Hanson, P.J.; Iversen, C.M.; Kumar, J.; Walker, A.P.; Wullschleger, S.D. Root structural and functional dynamics in terrestrial biosphere models—Evaluation and recommendations. New Phytol. 2015, 205, 59–78. [Google Scholar] [CrossRef] [PubMed]
  25. Fort, F.; Freschet, G.T.; Kroon, H. Plant ecological indicator values as predictors of fine-root trait variations. J. Ecol. 2020, 108, 1565–1577. [Google Scholar] [CrossRef]
  26. Weemstra, M.; Mommer, L.; Visser, E.J.; van Ruijven, J.; Kuyper, T.W.; Mohren, G.M.; Sterck, F.J. Towards a multidimensional root trait framework: A tree root review. New Phytol. 2016, 211, 1159–1169. [Google Scholar] [CrossRef] [PubMed]
  27. Zhou, M.; Bai, W.; Zhang, Y.; Zhang, W.H. Multi-dimensional patterns of variation in root traits among coexisting herbaceous species in temperate steppes. J. Ecol. 2018, 106, 2320–2331. [Google Scholar] [CrossRef]
  28. Xu, H.; Li, Y.; Xu, G.; Zou, T. Ecophysiological response and morphological adjustment of two Central Asian desert shrubs towards variation in summer precipitation. Plant Cell Environ. 2007, 30, 399–409. [Google Scholar] [CrossRef] [PubMed]
  29. Fischer, R.A.; Turner, N.C. Plant Productivity in the Arid and Semiarid Zones. Annu. Rev. Plant Physiol. 1978, 29, 277–317. [Google Scholar] [CrossRef]
  30. Montagnoli, A.; Terzaghi, M.; Di Iorio, A.; Scippa, G.; Chiatante, D. Fine-root seasonal pattern, production and turnover rate of European beech (Fagus sylvatica L.) stands in Italy Prealps: Possible implications of coppice conversion to high forest. Plant Biosyst.-Int. J. Deal. All Asp. Plant Biol. 2012, 146, 1012–1022. [Google Scholar]
  31. Freschet, G.T.; Valverde-Barrantes, O.J.; Tucker, C.M.; Craine, J.M.; McCormack, M.L.; Violle, C.; Fort, F.; Blackwood, C.B.; Urban-Mead, K.R.; Iversen, C.M. Climate, soil and plant functional types as drivers of global fine-root trait variation. J. Ecol. 2017, 105, 1182–1196. [Google Scholar] [CrossRef]
  32. Hou, H.-Y. Vegetation of China With Reference to Its Geographical Distribution. Ann. Mo. Bot. Gard. 1983, 70, 509–549. [Google Scholar] [CrossRef]
  33. Cheng, J.H.; Chu, P.F.; Chen, D.M.; Bai, Y.F. Functional correlations between specific leaf area and specific root length along a regional environmental gradient in Inner Mongolia grasslands. Funct. Ecol. 2016, 30, 985–997. [Google Scholar] [CrossRef]
  34. Jackson, R.B.; Canadell, J.; Ehleringer, J.R.; Mooney, H.; Sala, O.; Schulze, E.-D. A global analysis of root distributions for terrestrial biomes. Oecologia 1996, 108, 389–411. [Google Scholar] [CrossRef] [PubMed]
  35. Bao, S. Soil and Agricultural Chemistry Analysis, 3rd ed.; China Agriculture Press: Beijing, China, 2000. [Google Scholar]
  36. Jin, Y.; Qian, H.V. PhyloMaker2: An updated and enlarged R package that can generate very large phylogenies for vascular plants. Plant Divers. 2022, 44, 335–339. [Google Scholar] [CrossRef] [PubMed]
  37. Zanne, A.E.; Tank, D.C.; Cornwell, W.K.; Eastman, J.M.; Smith, S.A.; FitzJohn, R.G.; McGlinn, D.J.; O’Meara, B.C.; Moles, A.T.; Reich, P.B.; et al. Three keys to the radiation of angiosperms into freezing environments. Nature 2014, 506, 89–92. [Google Scholar] [CrossRef] [PubMed]
  38. Webb, C.O.; Donoghue, M.J. Phylomatic: Tree assembly for applied phylogenetics. Mol. Ecol. Notes 2005, 5, 181–183. [Google Scholar] [CrossRef]
  39. Zhang, J. Plantlist: Looking Up the Status of Plant Scientific Names Based on the Plant List Database. R Package Version 0.5.5. 2018. Available online: https://github.com/helixcn/plantlist/ (accessed on 20 January 2024).
  40. Liu, Y.; Wang, X.; Fan, D.; Lai, J.; Zavafer, A. The use of R in photosynthesis research. Funct. Plant Biol. 2021, 49, 565–572. [Google Scholar] [CrossRef]
  41. Gardner, W.H. Water content. In Methods of Soil Analysis: Part 1 Physical and Mineralogical Methods; Soil Science Society of America, Inc.: Madison, WI, USA, 1986; Volume 5, pp. 493–544. [Google Scholar]
  42. Lai, J.; Zou, Y.; Zhang, S.; Zhang, X.; Mao, L. glmm. hp: An R package for computing individual effect of predictors in generalized linear mixed models. J. Plant Ecol. 2022, 15, 1302–1307. [Google Scholar] [CrossRef]
  43. Lai, J.; Zhu, W.; Cui, D.; Mao, L. Extension of the glmm. hp package to zero-inflated generalized linear mixed models and multiple regression. J. Plant Ecol. 2023, 16, rtad038. [Google Scholar] [CrossRef]
  44. Zuo, E.; Sun, L.; Yan, J.; Chen, C.; Chen, C.; Lv, X. Rapidly detecting fennel origin of the near-infrared spectroscopy based on extreme learning machine. Sci. Rep. 2022, 12, 13593. [Google Scholar] [CrossRef] [PubMed]
  45. Šmilauer, P.; Lepš, J. Multivariate Analysis of Ecological Data Using CANOCO 5; Cambridge University Press: Cambridge, UK, 2014. [Google Scholar]
  46. Violle, C.; Enquist, B.J.; McGill, B.J.; Jiang, L.; Albert, C.H.; Hulshof, C.; Jung, V.; Messier, J. The return of the variance: Intraspecific variability in community ecology. Trends Ecol. Evol. 2012, 27, 244–252. [Google Scholar] [CrossRef]
  47. Wright, I.J.; Reich, P.B.; Westoby, M.; Ackerly, D.D.; Baruch, Z.; Bongers, F.; Cavender-Bares, J.; Chapin, T.; Cornelissen, J.H.; Diemer, M. The worldwide leaf economics spectrum. Nature 2004, 428, 821–827. [Google Scholar] [CrossRef] [PubMed]
  48. Kichenin, E.; Wardle, D.A.; Peltzer, D.A.; Morse, C.W.; Freschet, G.T.; Kitajima, K. Contrasting effects of plant inter- and intraspecific variation on community-level trait measures along an environmental gradient. Funct. Ecol. 2013, 27, 1254–1261. [Google Scholar] [CrossRef]
  49. Tang, Q.; Huang, Y.; Ding, Y.; Zang, R. Interspecific and intraspecific variation in functional traits of subtropical evergreen and deciduous broad-leaved mixed forests. Biodivers. Sci. 2016, 24, 262–270. [Google Scholar] [CrossRef]
  50. Jung, V.; Violle, C.; Mondy, C.; Hoffmann, L.; Muller, S. Intraspecific variability and trait-based community assembly. J. Ecol. 2010, 98, 1134–1140. [Google Scholar] [CrossRef]
  51. Xu, Y. Envirotyping for deciphering environmental impacts on crop plants. Theor. Appl. Genet. 2016, 129, 653–673. [Google Scholar] [CrossRef]
  52. Lambers, H.; Mougel, C.; Jaillard, B.; Hinsinger, P. Plant-microbe-soil interactions in the rhizosphere: An evolutionary perspective. Plant Soil 2009, 321, 83–115. [Google Scholar] [CrossRef]
  53. Albert, C.H.; Thuiller, W.; Yoccoz, N.G.; Douzet, R.; Aubert, S.; Lavorel, S. A multi-trait approach reveals the structure and the relative importance of intra- vs. interspecific variability in plant traits. Funct. Ecol. 2010, 24, 1192–1201. [Google Scholar] [CrossRef]
  54. Jung, V.; Albert, C.H.; Violle, C.; Kunstler, G.; Loucougaray, G.; Spiegelberger, T.; Cornwell, W. Intraspecific trait variability mediates the response of subalpine grassland communities to extreme drought events. J. Ecol. 2014, 102, 45–53. [Google Scholar] [CrossRef]
  55. van Rooijen, N.M.; de Keersmaecker, W.; Ozinga, W.A.; Coppin, P.; Hennekens, S.M.; Schaminée, J.H.J.; Somers, B.; Honnay, O. Plant Species Diversity Mediates Ecosystem Stability of Natural Dune Grasslands in Response to Drought. Ecosystems 2015, 18, 1383–1394. [Google Scholar] [CrossRef]
  56. Albert, C.H.; Grassein, F.; Schurr, F.M.; Vieilledent, G.; Violle, C. When and how should intraspecific variability be considered in trait-based plant ecology? Perspect. Plant Ecol. Evol. Syst. 2011, 13, 217–225. [Google Scholar] [CrossRef]
  57. Niu, K.; Zhang, S.; Lechowicz, M.J.; Perez Carmona, C. Harsh environmental regimes increase the functional significance of intraspecific variation in plant communities. Funct. Ecol. 2020, 34, 1666–1677. [Google Scholar] [CrossRef]
  58. Cavin, L.; Mountford, E.P.; Peterken, G.F.; Jump, A.S.; Whitehead, D. Extreme drought alters competitive dominance within and between tree species in a mixed forest stand. Funct. Ecol. 2013, 27, 1424–1435. [Google Scholar] [CrossRef]
  59. O’Dell, R.E.; Rajakaruna, N. Intraspecific Variation, Adaptation, and Evolution. In Serpentine The Evolution and Ecology of a Model System; University of California Press: Berkeley, CA, USA, 2011; pp. 96–137. [Google Scholar]
  60. Albert, C.H. Intraspecific trait variability matters. J. Veg. Sci. 2015, 26, 7–8. [Google Scholar] [CrossRef]
  61. Auger, S.; Shipley, B.; de Bello, F. Inter-specific and intra-specific trait variation along short environmental gradients in an old-growth temperate forest. J. Veg. Sci. 2013, 24, 419–428. [Google Scholar] [CrossRef]
  62. Fajardo, A.; Siefert, A. Phenological variation of leaf functional traits within species. Oecologia 2016, 180, 951–959. [Google Scholar] [CrossRef]
  63. Jiang, F.; Xun, Y.; Cai, H.; Jin, G. Functional traits can improve our understanding of niche- and dispersal-based processes. Oecologia 2018, 186, 783–792. [Google Scholar] [CrossRef]
  64. Jiang, F.; Cadotte, M.W.; Jin, G. Individual-level leaf trait variation and correlation across biological and spatial scales. Ecol. Evol. 2021, 11, 5344–5354. [Google Scholar] [CrossRef]
  65. Ding, J.; Kong, D.; Zhang, Z.; Cai, Q.; Xiao, J.; Liu, Q.; Yin, H.; Wardle, D. Climate and soil nutrients differentially drive multidimensional fine root traits in ectomycorrhizal-dominated alpine coniferous forests. J. Ecol. 2020, 108, 2544–2556. [Google Scholar] [CrossRef]
  66. Wang, R.; Wang, Q.; Zhao, N.; Xu, Z.; Zhu, X.; Jiao, C.; Yu, G.; He, N.; Niu, S. Different phylogenetic and environmental controls of first-order root morphological and nutrient traits: Evidence of multidimensional root traits. Funct. Ecol. 2017, 32, 29–39. [Google Scholar] [CrossRef]
  67. Sun, L.; Ataka, M.; Han, M.; Han, Y.; Gan, D.; Xu, T.; Guo, Y.; Zhu, B. Root exudation as a major competitive fine-root functional trait of 18 coexisting species in a subtropical forest. New Phytol. 2020, 229, 259–271. [Google Scholar] [CrossRef]
  68. Reich, P.B.; Cornelissen, H. The world-wide ‘fast-slow’ plant economics spectrum: A traits manifesto. J. Ecol. 2014, 102, 275–301. [Google Scholar] [CrossRef]
  69. Prieto, I.; Roumet, C.; Cardinael, R.; Dupraz, C.; Jourdan, C.; Kim, J.H.; Maeght, J.L.; Mao, Z.; Pierret, A.; Portillo, N. Root functional parameters along a land-use gradient: Evidence of a community-level economics spectrum. J. Ecol. 2015, 103, 361–373. [Google Scholar] [CrossRef]
  70. Carmona, C.P.; Bueno, C.G.; Toussaint, A.; Träger, S.; Díaz, S.; Moora, M.; Munson, A.D.; Pärtel, M.; Zobel, M.; Tamme, R. Fine-root traits in the global spectrum of plant form and function. Nature 2021, 597, 683–687. [Google Scholar] [CrossRef] [PubMed]
  71. Schenk, H.J.; Jackson, R.B. Rooting depths, lateral root spreads and below-ground/ above-ground allometries of plants in water-limited ecosystems. J. Ecol. 2002, 90, 480–494. [Google Scholar] [CrossRef]
  72. Song, C.J.; Ma, K.M.; Qu, L.Y.; Liu, Y.; Xu, X.L.; Fu, B.J.; Zhong, J.F. Interactive effects of water, nitrogen and phosphorus on the growth, biomass partitioning and water-use efficiency of Bauhinia faberi seedlings. J. Arid. Environ. 2010, 74, 1003–1012. [Google Scholar] [CrossRef]
  73. James, J.J.; Tiller, R.L.; Richards, J.H. Multiple resources limit plant growth and function in a saline-alkaline desert community. J. Ecol. 2005, 93, 113–126. [Google Scholar] [CrossRef]
  74. Holdaway, R.J.; Richardson, S.J.; Dickie, I.A.; Peltzer, D.A.; Coomes, D.A. Species-and community-level patterns in fine root traits along a 120 000-year soil chronosequence in temperate rain forest. J. Ecol. 2011, 99, 954–963. [Google Scholar] [CrossRef]
  75. Withington, J.M.; Reich, P.B.; Oleksyn, J.; Eissenstat, D.M. Comparisons of structure and life span in roots and leaves among temperate trees. Ecol. Monogr. 2006, 76, 381–397. [Google Scholar] [CrossRef]
  76. Comas, L.; Eissenstat, D. Patterns in root trait variation among 25 co-existing North American forest species. New Phytol. 2009, 182, 919–928. [Google Scholar] [CrossRef]
  77. Bergmann, J.; Weigelt, A.; van Der Plas, F.; Laughlin, D.C.; Kuyper, T.W.; Guerrero-Ramirez, N.; Valverde-Barrantes, O.J.; Bruelheide, H.; Freschet, G.T.; Iversen, C.M. The fungal collaboration gradient dominates the root economics space in plants. Sci. Adv. 2020, 6, eaba3756. [Google Scholar] [CrossRef]
  78. Stahl, U.; Kattge, J.; Reu, B.; Voigt, W.; Ogle, K.; Dickie, J.; Wirth, C. Whole-plant trait spectra of North American woody plant species reflect fundamental ecological strategies. Ecosphere 2013, 4, 2013. [Google Scholar] [CrossRef]
  79. Tjoelker, M.; Craine, J.M.; Wedin, D.; Reich, P.B.; Tilman, D. Linking leaf and root trait syndromes among 39 grassland and savannah species. New Phytol. 2005, 167, 493–508. [Google Scholar] [CrossRef]
  80. Eviner, V.T.; Chapin III, F.S. Functional Matrix: A Conceptual Framework for Predicting Multiple Plant Effects on Ecosystem Processes. Annu. Rev. Ecol. Evol. Syst. 2003, 34, 455–485. [Google Scholar] [CrossRef]
  81. Krishna, M.; Winternitz, J.; Garkoti, S.C.; Penuelas, J. Functional leaf traits indicate phylogenetic signals in forests across an elevational gradient in the central Himalaya. J. Plant Res. 2021, 134, 753–764. [Google Scholar] [CrossRef]
  82. Ding, Y.; Zang, R.; Letcher, S.G.; Liu, S.; He, F. Disturbance regime changes the trait distribution, phylogenetic structure and community assembly of tropical rain forests. Oikos 2012, 121, 1263–1270. [Google Scholar] [CrossRef]
  83. Swenson, N.G. The assembly of tropical tree communities—The advances and shortcomings of phylogenetic and functional trait analyses. Ecography 2013, 36, 264–276. [Google Scholar] [CrossRef]
  84. Zhou, M.; Wang, J.; Bai, W.; Zhang, Y.; Zhang, W.H. The response of root traits to precipitation change of herbaceous species in temperate steppes. Funct. Ecol. 2019, 33, 2030–2041. [Google Scholar] [CrossRef]
  85. Hodge, A.; Berta, G.; Doussan, C.; Merchan, F.; Crespi, M. Plant root growth, architecture and function. Plant Soil 2009, 321, 153–187. [Google Scholar] [CrossRef]
  86. Markesteijn, L.; Poorter, L. Seedling root morphology and biomass allocation of 62 tropical tree species in relation to drought-and shade-tolerance. J. Ecol. 2009, 97, 311–325. [Google Scholar] [CrossRef]
  87. Rojas-Botero, S.; Teixeira, L.H.; Prucker, P.; Kloska, V.; Kollmann, J.; Le Stradic, S. Root traits of grasslands rapidly respond to climate change, while community biomass mainly depends on functional composition. Funct. Ecol. 2023, 37, 1841–1855. [Google Scholar] [CrossRef]
Figure 1. Distribution of sampling sites of investigated plants in the desert of Gansu, China.
Forests 15 00476 g001
Figure 2. Variance partitioning of different fine root traits at interspecific and intraspecific scales. Abbreviations of fine root traits are given in Table 1. AD: Average root diameter; SRL: Specific root length; SRA: Specific root area; RTD: Root tissue density; RCC: Root carbon content; RNC: Root nitrogen content; RPC: Root phosphorus content; RCN: Root carbon and nitrogen ratio; RNP: Root nitrogen and phosphorus ratio; RCP: Root carbon and phosphorus ratio.
Forests 15 00476 g002
Figure 3. Principal component analysis of 10 fine root functional traits. Abbreviations of traits are given in Table 1. AD: Average root diameter; SRL: Specific root length; SRA: Specific root area; RTD: Root tissue density; RCC: Root carbon content; RNC: Root nitrogen content; RPC: Root phosphorus content; RCN: Root carbon and nitrogen ratio; RNP: Root nitrogen and phosphorus ratio; RCP: Root carbon and phosphorus ratio.
Forests 15 00476 g003
Figure 4. Relationships among key traits of fine roots of 25 desert plants. The insets indicate the expected relationships based on the RES hypothesis. In the figure, scatterplot points of different colors indicate shrubs and herbs. Abbreviations of traits are given in Table 1. Significant correlations are denoted with asterisks: ‘*’ for p < 0.05, ‘**’ for p < 0.01. The blue, red and black lines represent shrubs, herbs and all species, respectively. AD: Average root diameter; SRL: Specific root length; SRA: Specific root area; RTD: Root tissue density; RNC: Root nitrogen content;. The subfigures represent the predicted trend between two traits in the root economic spectrum.
Forests 15 00476 g004aForests 15 00476 g004b
Figure 5. Redundance analysis (RDA) sequencing of 10 fine root traits and environmental factors (soil and meteorology). AD: Average root diameter; SRL: Specific root length; SRA: Specific root area; RTD: Root tissue density; RCC: Root carbon content; RNC: Root nitrogen content; RPC: Root phosphorus content; RCN: Root carbon and nitrogen ratio; RNP: Root nitrogen and phosphorus ratio; RCP: Root carbon and phosphorus ratio; AT: Annual average temperature; AP: Annual average precipitation; SW: Soil water content; SC: Soil carbon content; SN: Soil nitrogen content; SP: Soil phosphorus content. Black and red represent the response and explanatory variables, respectively.
Forests 15 00476 g005
Table 1. Measured root trait indicators and abbreviations.
TraitAcronymFunctionsUnit
Root tissue densityRTDTransport, conservation, and
defense
g/cm3
Specific root lengthSRLResource acquisition cm/g
Specific root areaSRAResource acquisitioncm2/g
Average root diameterADTransport, conservation, and
defense
mm
Root carbon contentRCCTransport, conservation, and
defense
g/kg
Root nitrogen contentRNCResource acquisitiong/kg
Root phosphorus contentRPCResource acquisitiong/kg
Root carbon and nitrogen ratioRCN//
Root carbon and phosphorus ratioRCP//
Root nitrogen and phosphorus ratioRNP//
Table 2. Descriptive statistics of fine root functional traits of 25 desert plants. Abbreviations of traits are given in Table 1.
TraitsUnitMeanStandard DeviationMinimumMaximumCoefficient of Variation (%)
ADmm0.740.250.291.8333.41
SRLcm/g1116.121328.3885.737393.57119.02
SRAcm2/g203.18180.4018.991579.6588.79
RTDg/cm30.420.260.032.9962.46
RCCg/kg399.6092.99152.69849.7223.27
RNCg/kg4.682.311.1713.7249.35
RPCg/kg1.010.580.144.4457.77
RCN/104.8156.6927.90345.1254.09
RNP/6.265.060.5533.3080.75
RCP/538.16373.0442.623181.8769.32
Table 3. Fine roots traits (mean ± SD) and their coefficient of variation (intraspecific/interspecific) of desert plants with different life forms (shrub vs. herb). Numbers before “/” in parentheses indicate intraspecific coefficient of variation, and numbers after indicate interspecific coefficients of variation. Different lowercase letters indicate significant differences between shrubs and herbs (p < 0.05). Abbreviations of fine root traits are given in Table 1.
TraitsUnitShrubHerbCommunity
ADmm0.78 ± 0.18 a0.70 ± 0.29 b0.74 ± 0.25
(13.51%/22.47%)(12.36%/41.94%)(12.86%/33.41%)
SRLcm/g625.93 ± 480.89 a1572.52 ± 1663.51 b1116.12 ± 1326.86
(40.35%/76.83%)(35.58%/105.79%)(37.68%/119.02%)
SRAcm2/g137.91 ± 60.31 a263.94 ± 227.88 b203.18 ± 180.30
(28.81%/43.73%)(30.47%/86.34%)(29.74%/88.79%)
RTDg/cm30.46 ± 0.30 a0.38 ± 0.22 b0.42 ± 0.26
(24.14%/64.54%)(23.34%/57.44%)(23.69%/62.46%)
RCCg/kg423.08 ± 98.06 a377.74 ± 82.45 b399.60 ± 94.29
(17.11%/23.18%)(15.18%/21.83%)(16.03%/23.27%)
RNCg/kg5.79 ± 2.66 a3.65 ± 1.22 b4.68 ± 2.31
(28.65%/46.00%)(19.39%/33.54%)(23.46%/49.35%)
RPCg/kg0.96 ± 0.43 a1.05 ± 0.69 a1.01 ± 0.58
(40.92%/44.53%)(40.90%/66.05%)(40.91%/57.77%)
RCN/93.17 ± 60.83 a115.64 ± 50.35 b104.81 ± 56.66
(40.13%/65.28%)(27.59%/43.54%)(33.11%/54.09%)
RNP/7.79 ± 5.96 a4.84 ± 3.50 b6.26 ± 5.05
(65.46%/76.47%)(49.65%/72.37%)(56.60%/80.75%)
RCP/579.21 ± 438.98 a499.94 ± 295.12 b538.16 ± 372.53
(59.33%/75.79%)(45.24%/59.03%)(51.44%/69.32%)
Table 4. Coefficients of Pearson’s correlation for pairwise traits with original data (lower left diagonal) and phylogenetically independent contrasts (upper right diagonal). Abbreviations of traits are given in Table 1. Significant correlations are denoted with asterisks: ‘*’ for p < 0.05, ‘**’ for p < 0.01.
ADSRLSRARTDRCCRNCRPCRCNRNPRCP
AD −0.55 *−0.17−0.240.090.470.32−0.58 *0.32−0.01
SRL−0.54 ** 0.84 **−0.38−0.17−0.460.100.46−0.39−0.09
SRA−0.34 **0.88 ** −0.64 **−0.17−0.340.360.24−0.38−0.19
RTD−0.05−0.40 **−0.54 ** −0.230.04−0.19−0.070.01−0.14
RCC−0.08−0.030.01−0.09 0.46−0.47−0.040.61 *0.73 **
RNC0.18 **−0.28 **−0.23 **0.030.31 ** −0.04−0.78 **0.77 **0.22
RPC0.39 **−0.080.030.02−0.29 **−0.11 * −0.25−0.52 *−0.74 **
RCN−0.30 **0.28 **0.22 **−0.11 *0.23 **−0.70 **−0.07 −0.53 *0.04
RNP0.08−0.15 **−0.15 **−0.040.27 **0.61 **−0.56 **−0.41 ** 0.74 **
RCP−0.060.04−0.01−0.090.43 **0.13 *−0.66 **0.060.79 **
Disclaimer/Publisher’s Note: The statements, opinions and data contained in all publications are solely those of the individual author(s) and contributor(s) and not of MDPI and/or the editor(s). MDPI and/or the editor(s) disclaim responsibility for any injury to people or property resulting from any ideas, methods, instructions or products referred to in the content.

