Abstract
The objective of the present work was to determine the physico-mechanical and energy properties of pine (Pinus sylvestris) and beech (Fagus sylvatica) wood from railroad ties. The ties were divided into internal and external parts as well as into parts impregnated and unimpregnated with creosote oil. The effects of creosote impregnation on wood hardness, compressive strength parallel to the grain, static bending strength, and calorific value were studied. The obtained results show that the parameters of the analyzed samples meet the standard requirements (EN 338) for construction wood (compressive and bending strength class: C50—pine; D70—beech). Depending on the particular property being studied, both pine and beech samples belong to the highest or one of the highest wood quality classes. Creosote oil considerably increased wood density (by 9% for beech and 19% for pine) but did not affect its hardness. Creosote impregnation significantly improved the compressive strength parallel to the grain of both wood species (beech: (IN); (OUT); pine: (IN); (OUT)); in the case of static bending strength, its value was increased for beech wood ( (IN); (OUT)) and reduced for pine wood ( (IN); (OUT)). The oil contained in wood from ties significantly elevated its calorific value (by 25% for beech and 10% for pine). Unfortunately, the presence of creosote oil currently prevents wood from railroad ties from being reused as the oil is deemed hazardous and carcinogenic. However, if it were possible to isolate the unimpregnated parts of railroad ties, they could be reapplied for construction or other uses.
1. Introduction
Wood is a raw material obtained from felled trees which is processed for use in the construction, extraction, and energy industries as well as in other sectors. It is also used in railroad infrastructure, amongst other uses, to construct ties (sleepers) supporting tracks.
Railroad ties are made from pine, beech, and oak wood characterized by good physical [1,2,3] and mechanical [4,5,6] properties which make the ties durable and long-lasting. Of the three aforementioned tree species, pine is a softwood tree, while oak and beech are hardwood trees; consequently, pine is softer and more elastic than oak and beech.
Wood used for railroad ties must meet appropriate quality standards and exhibit high biological resilience. The quality and durability of wooden ties can be improved by impregnation with creosote oil. However, due to the fact that creosote contains some carcinogenic compounds, it is considered a hazardous substance. By the same token, impregnated ties are deemed hazardous, which prevents their reuse at the end of their service life [7]. On the other hand, the concentration of harmful chemicals decreases over time, due to which there might be some potential for tie reapplication.
The disposal of railroad ties at the end of their useful life presents a major problem as due to the presence of hazardous substances, they must be incinerated at high temperatures in special facilities. Current environmental regulations [8,9,10] prohibit the reuse of railroad ties or their disposal in standard, widely available incinerators.
A methodologically sound evaluation of the technical quality of wood should be based on strength testing and visual assessment [11]. Materials that are valued in the wood industry and other sectors are those that are highly versatile, widely available, and of high technical quality. These prerequisites are met by beech and pine wood, which have been extensively tested for their structural characteristics [12,13], physical properties [1,2,14,15,16,17,18,19] (and especially density [3,13,20,21,22,23,24,25]), and mechanical parameters [4,5,6,26,27].
However, there are no research reports on the physical, mechanical, or energy properties of wood from railroad ties aimed at finding new applications for that product. This gap in the international literature highlights the necessity of the present study, which pioneers a new research area. In addition, the wide availability of reports on the properties of wood from different tree species, including those examined in this paper, makes it possible to compare them with the obtained results and assess the functional value of wood from railroad ties.
The objective of this research study was to evaluate the physico-mechanical and physico-chemical properties of the external and internal parts of railroad ties made from two species of wood: pine and beech. This study involved the determination of the moisture content, density, hardness, static three-point bending and compression parallel to the grain, elemental composition, and calorific value of wood from railroad ties.
2. Materials and Methods
2.1. Description of Study Material and Strength-Testing Methods
The study material consisted of wooden railroad ties obtained from the Railway Research Institute in Warsaw and from a manufacturer based in Zaklików (Poland). This study involved new beech (Fagus sylvatica) ties as well as pine (Pinus sylvestris) ties at the end of their service life (salvaged from railroad tracks).
Several beech and pine ties were selected at random. However, it was difficult to obtain pine samples that could be used for testing for compliance with strength standards due to the technical condition of the salvaged ties, i.e., the large number and size of longitudinal cracks in horizontal and vertical planes, as well as fissures running from the surface into the material.
Ties with a length of 2600 mm and cross-sectional dimensions of 150 × 240 mm were divided into shorter numbered segments with lengths varying from 350 to 500 mm, depending on the technical condition of wood. Internal and external parts of the samples were marked on the cross-sections: the external parts encompassed wood lying within 50 mm of any of the edges of the tie, while the remaining core was designated the internal part. Test specimens were taken from both internal and external parts (Figure 1). The number of specimens for individual tests depended on the condition and availability of material.
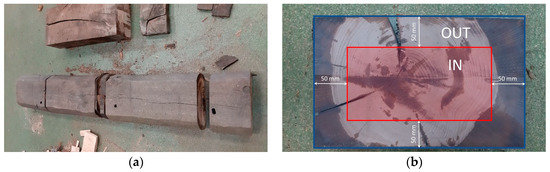
Figure 1.
Wooden railroad ties with cracks on external surfaces and in cross-sectional areas: (a) tie cut for specimen preparation; (b) cross-section revealing areas impregnated with creosote with internal (IN) and external (OUT) parts marked out.
Specimens taken for tests from the external (OUT) part and the internal (IN) parts of the railroad ties were coded as explained in Table 1.

Table 1.
Coding of samples used for testing.
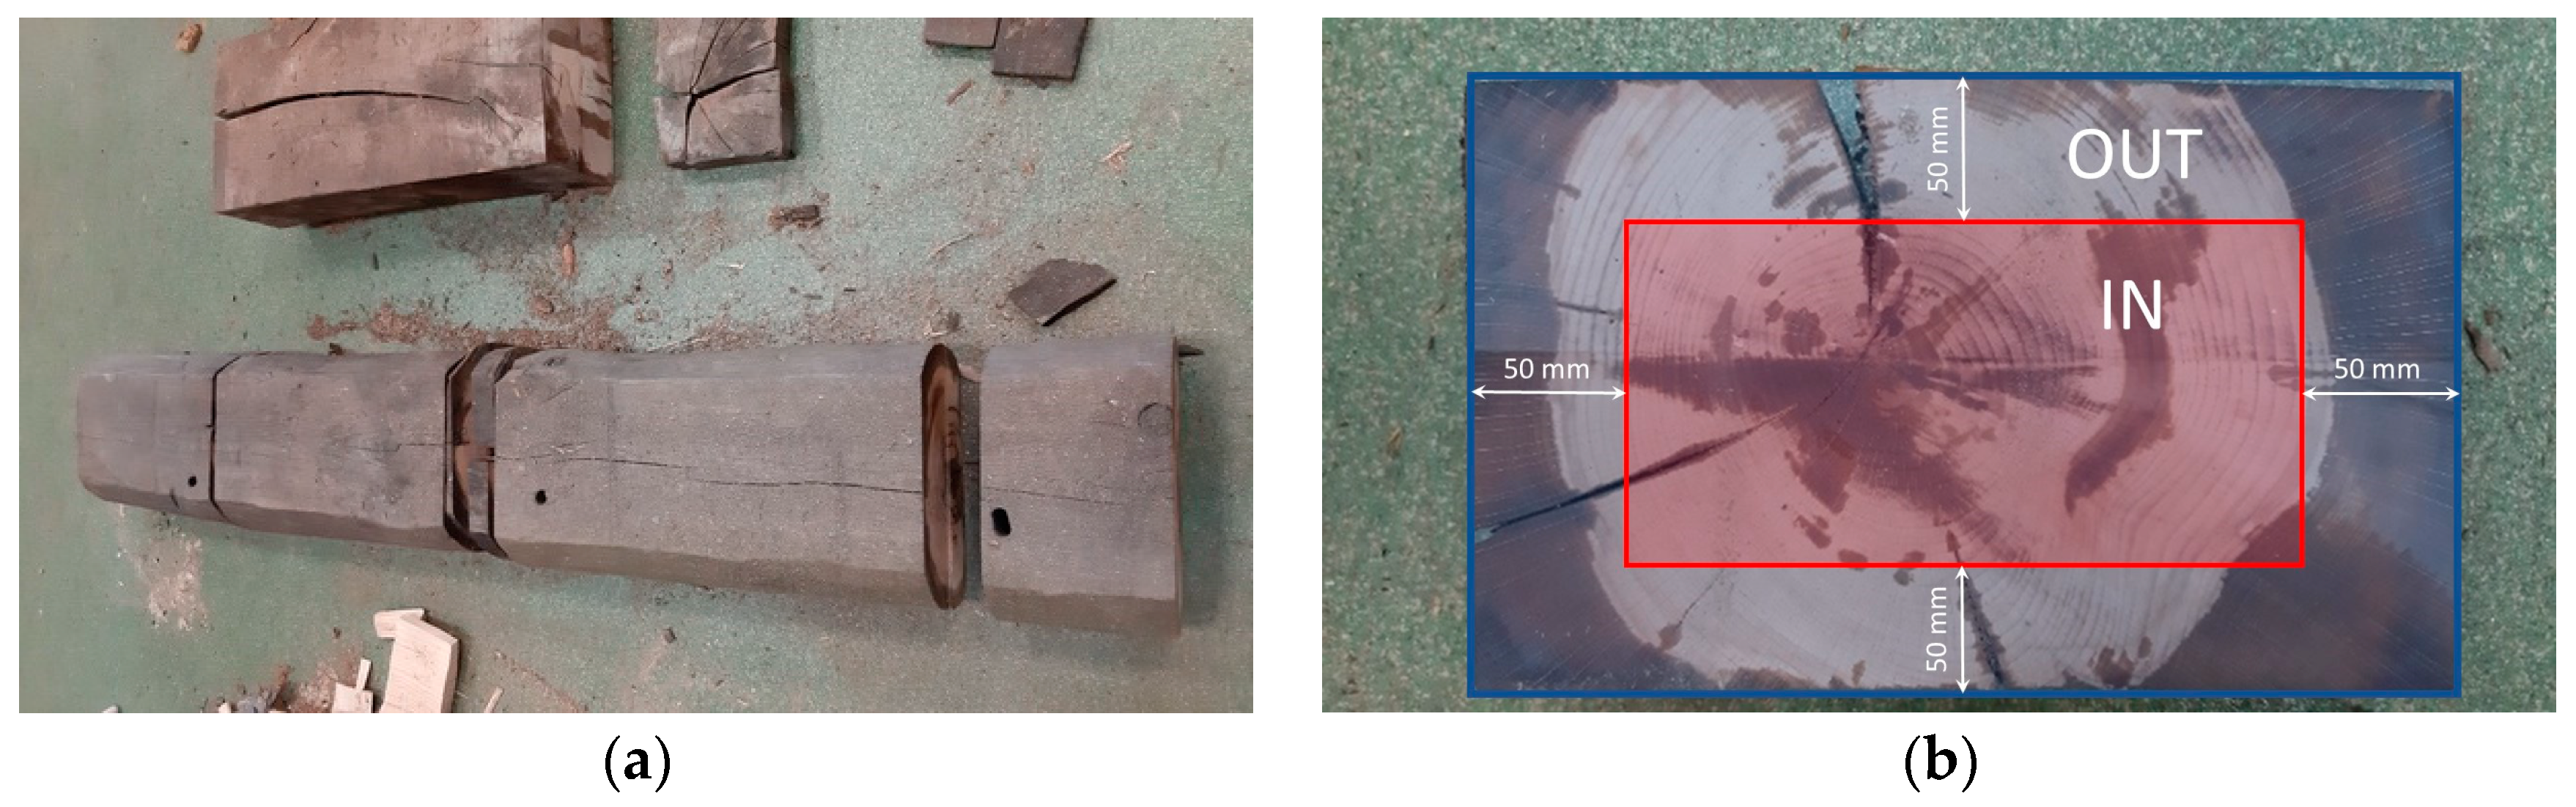
Hardness, compressive strength parallel to the grain, and static bending strength tests were conducted using an Inspekt Table 100 universal tester (Hegewald & Peschke, Nossen, Germany) with the necessary accessories (Figure 2). The applied force sensor had a measurement range of up to 100 kN and an accuracy of 0.1 N. Crosshead advancement was recorded with an accuracy of 0.001 mm, with the advance rate being individually selected for each test based on relevant standards. The test procedures were programmed using LabMaster v. 4.0.3.0 software (Hegewald & Peschke, Nossen, Germany), which was used for controlling the machine and recording data.

Figure 2.
Universal tester measurements of (a)wood hardness, (b) compressive strength parallel to the grain, and (c) static three-point bending strength.
2.2. Moisture and Density Measurements
The moisture content of the wood was determined using the oven-drying method pursuant to the standard ISO 18134 [28]. The specimens were cuboidal, with cross-sectional dimensions of 20 × 20 mm and a length parallel to the grain of 30 mm. The specimens were weighed before and after drying using a WPS 600/C laboratory balance (Radwag, Radom, Poland) with an accuracy of 0.01 g. A Heraeus UT 6120 circulating air oven (Kendro Laboratory Products GmbH, Hanau, Germany) was used to dry the specimens to a constant weight at 103 ± 2 °C for at least 24 h. The moisture content of the wood (W) was calculated from the initial (mw) and dry (ms) weights of the specimens. The external dimensions of the specimens were measured using an AOS Absolute Digimatic Standard 150 mm caliper (MITUTOYO Corp., Kawasaki, Japan) with an accuracy of ±0.1 mm. Tests were conducted in 65 replicates for beech wood and 59 replicates for pine.
Specimen volume and density on a dry basis were calculated using Formulas (1) and (2), respectively:
where ρs—wood density on a dry basis, kg m−3; V—specimen volume, mm3; a—specimen length, mm; b—specimen width, mm; h—specimen height, mm.
2.3. Hardness Measurement
The hardness of the wood from railroad ties was measured using the Janka method pursuant to the standard ISO 13061 [29], using the Inspekt Table 100 machine. During the test, a ball with a diameter of 11.28 mm was pressed into the wood up to the depth of its radius, i.e., 5.64 mm. An indentation was made in the cross-sectional surface of the specimen in the axial direction (Figure 2a). An advance rate of 5 mm min−1 was selected according to the standard to make sure the indentation occurred within 60–120 s. A total of 175 replicates were performed for beech wood and 204 for pine.
The obtained results for the force necessary to make an indentation in wood with an analytical moisture content (W) value were converted to account for a 12% wood moisture content. Given the ball projection area, A = 100 mm2, the hardness of wood with 12% moisture content was calculated according to the following formulas:
where P—indentation force, N; K—coefficient equal to 1 (for an indentation of 5.64 mm3 resulting in a ball projection area of A = 100 mm2); αst—conversion factor (αst = 0.03); W—the analytical moisture content of the specimen at the time of testing, %.
2.4. Determination of Compressive Strength Parallel to Grain
The compressive strength parallel to the grain was determined on the basis of the standard ISO 13061 [30], using 427 beech specimens and 323 pine specimens measuring 20 × 20 × 30 mm. Each specimen was placed in the tester so that the compressive force acted in the direction parallel to its longitudinal axis (Figure 2b). To ensure specimen destruction within 90 ± 30 s, the advance rate was set to 10 mm min−1. During the tests, the control software recorded compressive strength (Fc) with an accuracy of ±0.1 N and crosshead advancement with an accuracy of ±0.001 mm. Based on the recorded data, the software calculated the maximum compressive stress using Formulas (5)–(7) for the analytical moisture content (), which was then converted to a 12% moisture content (), as well as the compressive modulus ():
where Fcmax—maximum compressive force, N; ac—specimen dimension in the radial direction (20 mm); bc—specimen dimension in the tangential direction (20 mm); αc—coefficient of change in compressive strength parallel to the grain for a 1% change in the wood moisture content (in the range of 12 ± 3%); αc = 0.04; —compressive strain.
The unit work necessary to destroy the specimen (Wjc) was calculated as the quotient of the total energy and area A = 400 mm2:
where A—area subjected to loading; Fc—compressive force in the elastic range.
2.5. Determination of Static Bending Strength
The static bending strength of the wood from railroad ties was determined pursuant to the standard ISO 13061-3 [31], using 207 beech specimens and 154 pine specimens. The specimens had cross-sectional dimensions of 20 × 20 mm and a length of 300 mm. The dimensions were measured using a digital caliper with an accuracy of ±0.1 mm prior to the experiment.
During the tests, specimens were placed symmetrically on two supports (Figure 2c). The specimens were loaded in the middle at a constant rate of 10 mm min−1 to make sure they were destroyed within 90 ± 30 s. The control software LabMaster recorded the bending force (Fg) with an accuracy of ±0.1 N and crosshead advancement with an accuracy of ±0.001 mm throughout the experiments. Based on the recorded data, the software calculated the maximum bending stress using Formulas (9)–(11) for the analytical moisture content (), which was then converted to a 12% moisture content (), as well as the bending modulus (Eg):
where Fgmax—maximum bending force, N; l—distance between supports, 240 mm; b—sample width, mm; h—sample height, mm; αg—conversion factor (αg = 0.04); —bending strain.
The unit work during static bending () was calculated as the quotient of total energy and area A = 400 mm2:
where A—area subjected to loading; Fg—bending force in the elastic range.
2.6. Ash Content, Elemental Analysis, and Gross and Net Calorific Value
The material was ground in an LNM 100 mill (Testchem, Radlin, Poland) to obtain particles with a size of <1.0 mm. The ash content, elemental contents (C, H, N, and S), oxygen content (O), gross calorific value (GCV), and net calorific value (NCV) were measured and calculated pursuant to the standards ISO 18134 [28], ISO 18122 [32], ISO 18125 [33], ISO 16993 [34], and ISO 1928 [35]. Measurements were obtained using equipment from LECO Corporation (Benton Harbor, MI, USA): the ash content was determined using a TGA701 analyzer; C, H, N, and S contents were determined using a CHN628+S analyzer; and the calorific value was determined using an AC600 calorimeter. Specimens taken for combustion weighed 1 g each. All results were converted to consider an absolute dry weight.
Specimens were weighed using a WPA 40/160-C/1 laboratory balance (Radwag, Radom, Poland) with an accuracy of 0.001 g.
The net calorific value (NCVd) of the dry material was calculated using Formula (13):
where Hd—hydrogen content, Od—oxygen content, and Nd—nitrogen content on a dry basis in %.
The oxygen content (Od) on a dry basis was calculated using Formula (14):
where Ashd—ash, %; Cd—carbon, %; Hd—hydrogen, %; Nd—nitrogen, %; Sd—sulfur, %; Cld—chlorine, %.
The sulfur content was not included in Formula (14) due to its very low level (<0.02%), which was less than the measurement error of the apparatus. The chlorine content was also not included as it was not determined.
All measurements were obtained with at least 5 replicates. The measurement procedures and accuracy are described in papers by Piętka et al. [36].
2.7. Statistical Analysis
The statistical analysis of the results was carried out using the program Statistica v13.3 [37]. Mean, minimum, and maximum values, the standard deviation, the coefficient of variation, and standard error were calculated for the selected parameters. Differences between mean values were evaluated using an analysis of variance (ANOVA) test at a confidence interval of α = 0.05. Differences were considered significant at p < 0.05.
3. Results
Comparisons were not made between wood derived from different tree species, a coniferous species (pine) and a broadleaved species (beech), because the two naturally possess different hardness levels, with pine being classified as softwood and beech as hardwood. Instead, the analysis focused on the effects of creosote impregnation and a comparison of external and internal railroad tie parts for each wood species separately.
3.1. Wood Moisture Content and Density
The mean moisture content of the studied wood species and their impregnated and unimpregnated variants ranged between 11.1 and 12.8% (Table 2), with higher levels (over 12%) recorded for beech wood. A greater dispersion of results (SD and CV) was found for beech wood as compared to pine wood. Analyses did not reveal significant differences in moisture content between the two studied beech wood variants, which means that the parameter was not affected by the creosote content. In turn, creosote-impregnated pine specimens were found to have a statistically significantly lower moisture content than unimpregnated pine specimens at p < 0.05 (Table 2).
Table 2.
Mean relative moisture content of wood (W) used to determine hardness, compressive strength, and static bending strength without division into inner and outer layers of wood from railroad ties.
The density of beech wood reported in the literature ranges from 730 to 1000 kg m−3 [38], and that of pine wood ranges from 435 to 800 kg m−3 [15,18,38].
In the current study, the density of unimpregnated wood from beech ties was from 462.7 to 684.7 kg m−3, and that from pine ties was from 286.7 to 545.6 kg m−3 (Table 3). These values are lower than in most reports in the literature. On the other hand, the creosote-impregnated wood had greater density, in the range of 617.5–800.0 kg m−3 for beech ties and 318.0–654.0 kg m−3 for pine ties. The lower density of pine wood may be attributable to the long period of use of the tested pine ties.
Table 3.
Mean density (ρs) of timber samples of wood from railroad ties.
Taking into consideration the external and internal parts of the railroad ties, a mean density of 618.0 kg m−3 was found for unimpregnated beech wood vs. 674.0 kg m−3 for creosote-impregnated wood, which means an increase of 9%. The corresponding values for pine wood were 438.5 kg m−3 and 521.7 kg m−3, with an increase of 19%. The presence of creosote led to a considerably higher wood density, especially for pine (p < 0.05), while the densities of specimens taken from the external and internal parts of the railroad ties were similar. This was also true for pine wood, with the density of the external parts of the railroad ties being greater by 4%.
3.2. Hardness
The mean hardness (Hst12) of the impregnated and unimpregnated wood from the internal and external parts of railroad ties was slightly more than 70 MPa for beech and 29 MPa for pine (Table 4). The results were characterized by a high coefficient of variation (CV), amounting to 13.8–22.8% for beech and 7.5–13.7% for pine, with the lowest CV found for creosote-impregnated pine wood at approx. 7%. The relatively high values of this parameter, especially for beech, may indicate considerable heterogeneity of the wood samples. A statistical analysis (Table 5) revealed the absence of significant differences between means within each wood species (p > 0.05). This means that wood hardness was not affected by either creosote impregnation or the tie part from which the specimens were taken.
Table 4.
Descriptive statistics for wood hardness (Hs12) from railroad ties in relation to 12% moisture content.
Table 5.
Analysis of variance for wood hardness (Hs12) of species studied. Effects of oil impregnation and outer/inner layer on wood hardness.
3.3. Compressive Strength Parallel to Grain
Compressive strength is a parameter reflecting the resistance of wood to compressive forces that may destroy or permanently deform it. Compressive strength depends on the direction of compression as well as on many anatomical features of wood, such as the structure of annual rings or the proportion of earlywood to latewood.
Depending on the tie part and creosote impregnation, mean values for beech and pine wood were in the range of 45.54–57.78 MPa (Table 6) and 35.22–42.45 MPa (Table 7). The compressive strength was the lowest for beech and pine specimens taken from the unimpregnated internal parts of ties and the highest for the impregnated external parts. Statistically significant differences between means were found based on an analysis of variance, multiple comparisons (Table 8), and post hoc tests, which means that creosote impregnation and tie part significantly affected the compressive strength of wood parallel to the grain. In Table 6 and Table 7, homogeneous groups of mean values are designated with letters. Three homogeneous groups were identified for beech wood, and two were identified for pine wood.
Table 6.
Descriptive statistics for the static compressive strength of beech wood from railroad ties together with the modulus of elasticity, strain, and unit work.
Table 7.
Descriptive statistics for the static compressive strength of pine wood from railroad ties together with the modulus of elasticity, strain, and unit work.
Table 8.
Analysis of variance for the static compressive strength of wood species. Influence of oil impregnation of wood and the outer/inner layer on its compressive strength.
The mean Ec12 values for the tested beech and pine wood specimens were in the ranges of 2.90–3.36 GPa (Table 6) and 2.16–2.76 GPa (Table 7) depending on the tie part and creosote impregnation. The elastic modulus was the highest for beech and pine wood specimens taken from the external parts of creosote-impregnated ties. An analysis of variance (Table 8) revealed statistically significant differences between the mean values of the elastic modulus for both wood species. The homogeneous groups identified for beech wood (Table 6 and Table 7) showed that while the values of Ec12 were not affected by creosote impregnation, they were influenced by tie part (IN/OUT). In the case of pine wood, both creosote impregnation and tie part had a significant effect on Ec12.
An additional parameter characterizing the studied wood samples was the strain at maximum compressive stress (), with greater strain recorded for pine wood (3.69–5.37%) than for beech wood (2.94–3.34%). An analysis of variance for beech wood showed no significant differences (p > 0.05) in mean values between creosote-impregnated and unimpregnated wood or between different tie parts, which means that those factors did not affect (Table 8). In contrast, in the case of pine wood specimens, both creosote impregnation and tie part had a significant effect on (p < 0.05).
Another parameter determined during the study was the unit work necessary to destroy a specimen upon compression parallel to the grain. The unit work needed to destroy the beech wood specimens (Table 6) was lower by approx. 0.01 J mm−2 compared to the pine wood specimens (Table 7). These values were correlated with elasticity and strain coefficients. The pine wood underwent greater deformation, extending the time of the experiment and thus increasing the energy needed for specimen destruction. However, the ANOVA performed for different variants of pine wood did not reveal a statistically significant difference in mean Wjc values (Table 8), which implies that creosote impregnation and tie part did not affect Wjc. In turn, two groups of homogeneous means were identified for beech wood (Table 6), indicating that those factors did affect Wjc for that wood species.
3.4. Static Bending Strength
Similar to the cases of hardness and compressive strength parallel to the grain, for static bending strength, the effects of creosote impregnation were also studied separately for each wood species.
The obtained mean values ranged from 95.75 MPa to 113.18 MPa (Table 9) for beech and from 66.34 to 85.63 MPa for pine (Table 10). An ANOVA revealed significant differences in means (p < 0.05) both for beech and pine wood from railroad ties depending on creosote impregnation and tie part (Table 11). Two homogeneous groups of mean values were identified in post hoc tests for both wood species (Table 10 and Table 11).
Table 9.
Descriptive statistics for the static bending strength of beech wood from railroad ties together with the modulus of elasticity, strain, and unit work.
Table 10.
Descriptive statistics for the static bending strength of pine wood from railroad ties together with the modulus of elasticity, strain, and unit work.
Table 11.
Analysis of variance for bending stress of wood species. Influence of oil impregnation of wood and outer/inner layer on bending stress.
The obtained mean values of Eg12 for beech and pine wood were in the ranges of 11.11–12.86 GPa (Table 9) and 9.13–11.35 GPa (Table 10), depending on impregnation and tie part. An analysis of variance (Table 11) showed statistically significant differences in the mean values of the elastic modulus for both studied wood species. However, the homogeneous groups identified for beech (Table 9) revealed no effect of creosote impregnation or tie part on Eg12. On the other hand, in the case of pine, the mean Eg12 value obtained for impregnated wood from internal tie parts was significantly different from the other means.
The mean strain () at maximum bending stress was in the range of 1.39–1.69% for beech wood (Table 9) and 1.17–1.26% for pine wood. ANOVA (Table 11) showed significant differences between means (p < 0.05) for beech wood and an absence thereof for pine wood (p > 0.05). Thus, it was found that the value of in creosote-impregnated beech wood was significantly affected by the tie part (IN/OUT) from which the specimen was taken.
3.5. Energy Properties
An analysis of the energy properties of the wood from beech and pine railroad ties took into account impregnation with creosote oil. The obtained results for the ash content, elemental analysis, as well as gross and net calorific values on a dry basis are given in Table 12 for the selected variants of wood samples.
Table 12.
Elemental composition, ash and oxygen contents, net and gross calorific values for wood samples of the tested species in relation to oil impregnation, converted on a dry basis.
The main factor reflecting the energy potential of wood is its net calorific value, which largely depends on its exact elemental composition. The NCVd obtained for unimpregnated beech wood was the lowest out of all the studied variants, mostly due to the fact that it contained the least carbon despite having the highest oxygen content. The NCVd of pine wood was higher than that of beech wood by 1.83 MJ kg−1.
For both studied species, significant differences (p < 0.05) were found in the mean NCVd value for creosote-impregnated and unimpregnated wood. Thus, the net calorific value increased significantly as a result of creosote impregnation (by 25.2% and 10.5% for beech and pine, respectively).
4. Discussion
Poland is a country with an extensive railroad network, with approx. 19.5 thousand route kilometers according to data as of the end of 2019. Every year, a fraction of railroad tracks need to be replaced. Modernization conducted in recent years has substantially improved the quality of railroad infrastructure and the comfort of rail travel. In 2020, 63.1% of railroad tracks were deemed in good condition [39].
The laboratory testing of wooden railroad ties is a new and quite special area of research as their mechanical properties have previously remained outside the interest of the scientific community [40]. Existing research has mostly focused on the impregnation of wooden ties with creosote oil, its effects on the natural environment, and the disposal of impregnated ties.
Antolik [40] studied the mechanical properties of entire new pine and beech ties as well as those that had been used for two or three years. Bending strength was tested by applying loading to the central part of the tie as well as to the tie parts that normally support rails. Antolik’s research did not reveal significant differences in strength parameters between new and salvaged beech ties, but a slight increase in bending strength was noted for salvaged (vs. new) pine ties. It was also noted that new pine ties were not as strong as beech ties due to differences between the two wood species. In the available literature, there are no reports on the mechanical properties wood from railroads for the purposes of reapplication. The results presented in this publication address the question of whether such wood can be reused for construction purposes in terms of its physical and mechanical properties.
In the Polish literature, wood can be classified into several moisture content classes, including wet (>25%), loading-dry (20–25%), air-dry (12–18%), and seasoned wood (under 12%). The measured moisture contents of samples from railroad ties, which was approx. 12% for both pine and beech wood, fall within the lower range of the air-dry wood class.
In addition to moisture content, an important parameter characterizing wood and affecting its mechanical properties is density, which depends on, amongst other factors, tree species, age, and provenance, as well as wood structure. The density of the studied species differs due to structural differences. That of beech wood ranges between 650 and 1000 kg m−3 [38,41,42,43,44], with Korzeniowski and Swaczyna [45] reporting approx. 690 kg∙m−3 on a dry basis and Fabijański et al. [46] reporting between 710 and 800 kg∙m−3 on a dry basis The density of pine wood described in the literature ranges from 410 to 800 kg∙m−3 [38,46,47]. Tomczak and Jelonek [47] obtained a density of 435 kg∙m−3 for pine stands growing on post-agricultural land and 479 kg∙m−3 for those growing on forest sites. Jaworska et al. [48], who measured the mean absorption of oil by railroad ties depending on wood species and oil type, reported 107.5–118.0 kg∙m−3 for pine ties and 147.4–157.7 kg∙m−3 for beech ones. The absorption of oil by wood necessarily increases its density.
The mean density values obtained in this study for unimpregnated beech wood were 604.7 kg∙m−3 for internal tie parts and 631.4 kg∙m−3 for external ones. These results fall somewhat below the lower limit given in the literature, and by the same token, the wood can be categorized as moderately heavy according to Krzysik’s classification [49]. The density of internal and external samples impregnated with oil increased to 689.6 and 658.5 kg∙m−3, or by 84.9 and 27.2 kg∙m−3, respectively. This means that the wood was impregnated with a smaller amount of oil than that specified by Jaworska et al. [48]. In the case of unimpregnated pine wood, the density of the internal tie parts was 421.4 kg∙m−3, and that of external parts was 455.5 kg∙m−3. These values are within the density range given in the literature and fall in the moderately light category in Krzysik’s classification [49]. The density of oil-impregnated samples increased by 98.2 and 86.3 kg∙m−3, respectively, which was below the threshold given by Jaworska et al. [48]. Nevertheless, the increased density levels may imply higher wood strength and resilience.
Depending on the applied classification by Krzysik [49], beech wood is considered a tree species with hard (60–65 MPa) or very hard wood (66–146 MPa). According to the literature, the hardness of beech wood ranges from 72 to 78 MPa [50,51], although values as low as 42 MPa have also been reported [52]. In turn, Krzysik [49] considers pine wood to be soft (36–49 MPa). The average hardness of pine wood is in the range of 28–30 MPa [51].
The obtained mean hardness for samples from beech railroad ties was 70.5–73.2 MPa, with the values for the creosote-impregnated samples being higher by approx. 2.2 MPa, which indicates that the oil made the wood slightly harder. These results are consistent with the findings of other authors, which means that the tested samples belong in the group of very hard wood. All variants of samples from pine railroad ties were found to have a similar hardness level (29.0–29.5 MPa). According to Warzecha and Siwek [53], wood hardness may be improved by impregnation (they increased pine hardness by 146%). However, those authors did not confirm that property specifically for creosote oil.
Research on wood compression focuses on two types of this parameter: compression parallel to the grain and perpendicular to the grain. Compressive stress parallel to the grain is higher, with typical values in the range of 16–53 MPa [38] and maximum values of up to approx. 190 MPa. Compressive stress perpendicular to the grain is approx. 6–10 times smaller. According to the literature, the compressive strength of beech wood parallel to the grain is 53–60 MPa, while that of pine wood is much lower and equals 41–46 MPa [54].
The obtained mean compressive stress values were 45.54–57.78 MPa for beech samples and 35.22–42.45 MPa for pine samples. In the case of both species, higher results were recorded for impregnated samples from the external part of railroad ties. At the same time, it should be noted that three sample variants, both for beech and pine wood, fell below the lower limit given by Tarasiuk and Jednoralski [54], while samples of impregnated wood taken from external tie parts were within the stress range reported in the literature. At the same time, it can be noted that creosote impregnation increased compressive strength, especially for samples from external tie parts. The obtained results may be compared to the standard EN 338 [55], which specifies strength classes. According to the standard, the compression strength of construction softwood should be in the range of 16–29 MPa, while that of hardwood should be in the range of 18–34 MPa. In the case of the studied pine and beech wood, the results exceed the top limits, which means that they fall in the highest strength class (pine—class C50; beech—class D70).
Similarly, as in the case of compressive stress, the range of wood elasticity parallel to the grain depends on wood species and other characteristics, such as annual ring width [56] and the relative proportions of earlywood and latewood. The values reported in the literature are usually provided for tree species. The construction wood standard EN 338 [55] specifies the elastic modulus range for softwood at 7–16 GPa and for hardwood at 9.5–20 GPa.
The elastic moduli reported in the literature for pine and beech wood are 10.3–13.8 GPa and 12.3–16.3 GPa, respectively. The elastic modulus values obtained in the current study are approx. five times lower (2.16–2.76 GPa for pine wood and 2.9–3.36 GPa for beech wood). However, it should be noted that the examined pine wood samples were taken from ties which had supported railroad tracks for many years, which may have affected their elasticity. In light of the standard EN 338 [55], samples from the tested railroad ties do not meet the requirements defined for the lowest strength class (class C14, 7 GPa, for softwood and class D18, 9.5 GPa, for hardwood), meaning that the wood cannot be used for construction purposes.
The value of the static bending strength of wood falls between its tensile and compressive strength values. A crucial parameter affecting static bending is density, as the former increases with the latter. Depending on wood species, typical static bending strength is in the range of 55–120 MPa [38]; approx. 102–108 MPa for beech [38] and approx. 78–87 MPa for pine [38,57,58]. According to Żelazny and Bednarz [59] the static bending strength for beech wood may be as high as 129.6 MPa.
In the present study, wood from the external parts of railroad ties was found to have higher static bending strength. Moreover, impregnation further increased that parameter in beech samples, but decreased it in pine samples. In beech wood, the sample variant B-IN-NO revealed bending stress lower by approx. 8 MPa than the average in the literature, while pine wood samples from internal tie parts were below the average. According to the standard EN 338 [55], the bending strength of softwood should be 14–50 MPa, and that of hardwood 18–70 MPa. The current study revealed a higher mean static bending strength for both softwood and hardwood. This means that the tested wood samples meet the requirements for the highest strength class (pine—class C50; beech—class D70).
According to Fessel [60], wood that is more easily bendable has a lower elastic modulus. In our tests, the elastic moduli obtained for the beech and pine samples were similar, with a difference of approx. 1.5 GPa in favor of beech. The modulus was correlated with bending stress.
Irrespective of tree species, wood consists of almost 50% carbon, 43% oxygen, 6.1% hydrogen, and 0.04 to 0.26% nitrogen, with mineral elements accounting for the remaining part [49,61,62,63,64,65,66,67,68,69]. Gross and net calorific values are considered crucial measures of energy properties [70] and depend on elemental composition and ash content. The average net calorific values provided in the literature are 18 MJ·kg−1 for beech [49,71,72] and 19 MJ·kg−1 for pine [49,73,74]. In turn, Skawińska et al. [75], who studied the energy properties of waste containing wood from railroad ties, reported NCVs in the range of 11–21 MJ·kg−1. In the current study, the NCV of unimpregnated samples was 18.46 MJ·kg−1 for beech ties and 20.29 MJ·kg−1 for pine ties, which is consistent with the literature data for wood not impregnated with oil. In turn, the NCV of samples impregnated with creosote was statistically significantly higher (p < 0.05) than that of unimpregnated wood, with the differences amounting to 4.65 MJ·kg−1 (25%) for beech and 2.12 MJ·kg−1 (10%) for pine. Creosote exhibits high energy properties, and the oil present in the wood increased the proportion of carbon in the elemental analysis by as much as 18.5% for beech and 11% for pine while reducing the proportion of oxygen by 28% for beech and 17% for pine.
Over time, the concentration of hazardous substances present in railroad ties decreases, due to which it might be possible to reuse ties following safety testing. According to Article 7 in the Waste Act of 14 December 2012 [10], hazardous waste may be reclassified as non-hazardous as long as it is demonstrated that it no longer possesses harmful properties under EU regulations 1357/2014 [9] and 2017/997 [8]. The concentration of chemical compounds in railroad ties can be determined by laboratory testing, with the results being reported to the relevant authorities [76].
After the reclassification of railroad ties as non-hazardous waste, individuals and non-commercial entities will be allowed to reuse them for their own purposes, for instance, for repairs, maintenance work, or construction. Railroad ties not contaminated with protective coatings could also be used as a fuel. Given the above, salvaged railroad ties are an interesting product for many households.
Wood from railroad ties is of good quality in terms of its strength parameters, but due to the presence of impregnating agents, it should not be directly used for construction or combustion. The topic of railroad ties is becoming increasingly popular as the removal of such agents from railroad ties could become possible in the future as a result of technological advancement, which would enable a wider use of ties as construction elements in lean-tos, fences, boardwalks, etc.
The topic of using wood from railroad ties is so interesting that we undertook further research related to the impact of harmful substances (creosote oil) on the natural environment and the possible use of railroad ties for energy purposes.
5. Conclusions
This study’s results indicate that the samples from the tested railroad ties meet the requirements for construction wood. Both the pine and beech samples fell within the highest or very high strength classes in terms of most properties except for the compressive modulus of elasticity, which was lower than the values specified in the standard EN 338 and those reported in the literature.
Creosote oil significantly increased the density, but not hardness, of the wood from the examined railroad ties. Impregnation also improved the strength of the wood parallel to the grain for both species, with bending strength being increased for beech and decreased for pine. The oil present in the wood from railroad ties significantly elevated its calorific value.
Currently, wood from railroad ties cannot be used as due to its impregnation with creosote oil, which is carcinogenic and hazardous. Also, environmental regulations prohibit the use of such wood due to its harmful properties. However, if it were possible to isolate unimpregnated parts from railroad ties, they could be applied for construction purposes as the tested wood samples meet the strength requirements of the relevant standard (compressive and bending strength class: C50—pine; D70—beech). Over time, technological development may enable the use of railroad ties for construction purposes, as material for boardwalks, and even as a fuel. However, for that to happen, specialized machines are needed to remove the impregnating agent.
Author Contributions
Conceptualization, M.A., A.G. and I.M.; methodology, M.A., A.G., B.T., I.Č. and M.D.; validation, M.A., J.M., J.K., I.Č. and I.M.; formal analysis, M.A., A.G., J.M., B.T., J.V., J.K., I.Č. and I.M.; investigation, M.A., A.G., B.T., I.Č. and I.M.; resources, M.A., A.G., J.M., B.T., J.V., J.K., I.Č., I.M., M.D. and A.M.; data curation, M.A., A.G., J.M., J.K., I.M. and M.D.; writing—original draft preparation, M.A., A.G., J.V., J.K., M.D. and I.M.; writing—review and editing, M.A., W.Z. and A.G.; visualization, M.A. and A.G.; supervision, M.A., W.Z. and A.G.; project administration, M.A. and A.G. All authors have read and agreed to the published version of the manuscript.
Funding
This research received no external funding.
Data Availability Statement
The data not directly presented in the article will be made available on request.
Conflicts of Interest
The authors declare no conflicts of interest. The funders had no role in the design of the study; in the collection, analyses, or interpretation of data; in the writing of the manuscript; or in the decision to publish the results.
Abbreviations
| A | area subjected to a loading, mm2 |
| Ashd | dry ash content, % |
| a | specimen length, mm |
| ac | specimen dimension in the radial direction, mm |
| α | confidence interval, α = 0.05 |
| αc, αg, and αst | conversion factors for wood compression, bending, and strength, respectively |
| b | specimen width, mm |
| bc | specimen dimension in tangential direction, mm |
| Cd, Hd, Nd, Sd, Cld, and Od | elemental composition values on a dry basis for carbon, hydrogen, nitrogen, sulfur, chlorine, and oxygen, % |
| CV | coefficient of variation, % |
| df | number of degrees of freedom, |
| and | strain values at maximum compressive and bending stress, % |
| and | compressive and bending moduli, GPa |
| F | F-test value |
| Fc and Fg | compressive/bending force values within the elastic range, N |
| Fcmax and Fgmax | maximum compressive and bending forces, N |
| GCVd | gross calorific value on a dry basis, MJ kg−1 |
| HstW | static hardness of wood with moisture content W, N |
| Hst12 | static hardness of wood with 12% moisture content, MPa |
| h | specimen height, mm |
| l | distance between supports, mm |
| MS | mean square |
| ms and mw | weights of wet and dry specimens, g |
| p and p-value | significance level, |
| ρs | wood density on a dry basis, ; |
| NCVd | net calorific value on a dry basis, MJ kg−1 |
| SD | standard deviation, |
| SE | standard error, % |
| SS | sum of squares |
| and | maximum compressive and three-point bending stress values at moisture content W, MPa |
| and | maximum compressive and three-point bending stress values at a moisture content of 12%, MPa |
| V | sample volume, mm3 |
| W | wood moisture content, % |
| Wjc and Wjg | unit work values upon compression and bending, J mm−2 |
| mean |
References
- Rikala, J. Spruce and Pine on Drained Peatlands—Wood Quality and Suitability for the Sawmill Industry; Publications 35; University of Helsinki, Department of Forest Resource Management: Helsinki, Finland, 2003; ISBN 951-45-9092-9. [Google Scholar]
- Schönfelder, O.; Zeidler, A.; Borůvka, V.; Bílek, L.; Lexa, M. Shrinkage of Scots Pine Wood as an Effect of Different Tree Growth Rates, a Comparison of Regeneration Methods. J. For. Sci. 2018, 64, 271–278. [Google Scholar] [CrossRef]
- Schönfelder, O.; Zeidler, A.; Borůvka, V.; Bílek, L. Impact of Silvicultural Measures on the Quality of Scots Pine Wood: Part II. Effect of Site. Wood Res. 2019, 64, 789–798. [Google Scholar]
- Pikk, J.; Kask, R. Mechanical Properties of Juvenile Wood of Scots Pine (Pinus sylvestris L.) on Myrtillus Forest Site Type. Balt. For. 2004, 10, 72–78. [Google Scholar]
- Kask, R.; Pikk, J.; Kangur, A. Effect of Growth Conditions on Wood Properties of Scots Pine (Pinus sylvestris L.). For. Stud. 2021, 75, 176–187. [Google Scholar] [CrossRef]
- Konofalska, E.; Kozakiewicz, P.; Buraczyk, W.; Szeligowski, H.; Lachowicz, H. The Technical Quality of the Wood of Scots Pine (Pinus sylvestris L.) of Diverse Genetic Origin. Forests 2021, 12, 619. [Google Scholar] [CrossRef]
- Wojciechowski, A.; Doliński, A.; Radziszewska-Wolińska, J.; Wołosiak, M. Przyjazny Dla Środowiska Recykling Podkładów Kolejowych. Probl. Kolejnictwa Railw. Rep. 2018, 181, 63–70. [Google Scholar] [CrossRef]
- Council Regulation (EU) 2017/997 of 8 June 2017 amending Annex III to Directive 2008/98/EC of the European Parliament and of the Council as Regards the Hazardous Property HP 14 ‘Ecotoxic’. 2017. Available online: https://eur-lex.europa.eu/legal-content/EN/TXT/PDF/?uri=CELEX:32017R0997 (accessed on 14 October 2023).
- Commission Regulation (EU) No 1357/2014 of 18 December 2014 replacing Annex III to Directive 2008/98/EC of the European Parliament and of the Council on Waste and Repealing Certain Directives. 2015. Available online: https://eur-lex.europa.eu/legal-content/EN/TXT/PDF/?uri=CELEX:32014R1357&qid=1709633778418 (accessed on 19 September 2023).
- Sejm RP Obwieszczenie Marszałka Sejmu Rzeczypospolitej Polskiej z Dnia 15 Marca 2019 r. w Sprawie Ogłoszenia Jednolitego Tekstu Ustawy z Dnia 14 Grudnia 2012 r. o Odpadach (Dz. U. z 2018 r. Poz. 992)—Dz. U. 2019 r. Poz. 701 z Dn. 16.04.2019r.; Sejm RP. 2019; p. 111. Available online: https://isap.sejm.gov.pl/isap.nsf/DocDetails.xsp?id=WDU20190000701 (accessed on 29 September 2023).
- Mirski, R.; Wieruszewski, M.; Malinowski, Z. Zmienność rozkładu wad drewna okrągłego w dojrzałych drzewostanach sosnowych. Sylwan 2019, 163, 913–923. [Google Scholar] [CrossRef]
- Karlman, L.; Mörling, T.; Martinsson, O. Wood Density, Annual Ring Width and Latewood Content in Larch and Scots Pine. Eurasian J. For. Res. 2005, 8, 91–96. [Google Scholar]
- Mańkowski, P.; Krzosek, S.; Burawska-Kupniewska, I.; Grześkiewicz, M.; Mirski, R. Correlation between the Share of Latewood and the Density of Sawn Timber from the Silesian Forestry Region. Ann. Wars. Univ. Life Sci. SGGW For. Wood Technol. 2020, 109, 70–75. [Google Scholar] [CrossRef]
- Bektas, I.; Alma, H.; As, N. The Effect of 120 Years of Service on Various Physical and Mechanical Properties of Scots Pine Wood Used as Roof Beam. Wood Res. 2005, 50, 27–32. [Google Scholar]
- Tomczak, A.; Jelonek, T. Comparison of selected physical properties of the juvenile and mature wood of Scots pine (Pinus sylvestris L.) from mature stands. Sylwan 2010, 154, 809–817. [Google Scholar] [CrossRef]
- Gryc, V.; Vavrčík, H.; Horn, K. Density of Juvenile and Mature Wood of Selected Coniferous Species. J. For. Sci. 2011, 57, 123–130. [Google Scholar] [CrossRef]
- Farsi, M.; Kiaei, M.; Miar, S.; Mohammadnezhad Kiasari, S. Effect of Seed Source on Physical Properties of Scots Pine (a Case Study in Neka, Iran). Drv. Ind. 2013, 64, 183–191. [Google Scholar] [CrossRef]
- Tomczak, A.; Jelonek, T.; Pazdrowski, W. Basic Density of Scots Pine Wood-Relationships between Values Calculated at Different Heights of the Trun. Ann. Wars. Univ. Life Sci. SGGW For. Wood Technol. 2013, 84, 241–246. [Google Scholar]
- Kask, R. The Influence of Growth Conditions on Physico-Mechanical Properties of Scots Pine (Pinus sylvestris L.) Wood in Estonia. Ph.D. Thesis, Philosophy in Forestry, Estonian University of Life Sciences, Tartu, Estonia, 2015. [Google Scholar]
- Witkowska, J.; Lachowicz, H. Analysis of variation in pure density of Scots pine wood (Pinus sylvestris L.) along a trunk height depending on selected factors. Przegląd Pap. 2012, 68, 573–578. [Google Scholar]
- Witkowska, J.; Lachowicz, H. Variability of conventional wood density of Scots pine (Pinus sylvestris L.) depending on the selected factors. Sylwan 2013, 157, 336–347. [Google Scholar] [CrossRef]
- Mäkinen, H.; Hynynen, J. Wood Density and Tracheid Properties of Scots Pine: Responses to Repeated Fertilization and Timing of the First Commercial Thinning. For. Int. J. For. Res. 2014, 87, 437–447. [Google Scholar] [CrossRef]
- Janusz, S.; Danilov, D. Density of Wood of Pine and Spruce in the Postagrogenic Soil of the Boreal Zone. In Proceedings of the 24th International Scientific Conference Research for Rural Development, Jelgava, Latvia, 16–18 May 2018; Latvia University of Life Sciences and Technologies: Jeglava, Latvia, 2018; pp. 92–96. [Google Scholar]
- Kantieva, E.; Snegireva, S.; Platonov, A. Formation of Density and Porosity of Pine Wood in a Tree Trunk. IOP Conf. Ser. Earth Environ. Sci. 2021, 875, 012016. [Google Scholar] [CrossRef]
- Pikiński, P.M.; Szaban, J.; Šilingienė, G.; Korzeniewicz, R.; Pazdrowski, W. Selected Physical and Mechanical Properties of Scots Pine (Pinus sylvestris L.) Wood from Stands of Younger Age Classes as Criteria for Rational Utilization of Timber. Balt. For. 2021, 27, 363. [Google Scholar] [CrossRef]
- Roszyk, E.; Mania, P.; Iwańska, E.; Kusiak, W.; Broda, M. Mechanical Performance of Scots Pine Wood from Northwestern Poland—A Case Study. BioRes 2020, 15, 6781–6794. [Google Scholar] [CrossRef]
- Wąsik, R.; Michalec, K.; Barszcz, A.; Mudryk, K. Variability of Selected Macrostructure Features, Density and Compression Strength along the Grain of “Tabórz” Scots Pine Wood (Pinus sylvestris L.). Wood 2020, 63, 171–182. [Google Scholar] [CrossRef]
- ISO 18134-3:2014; Physical and Mechanical Properties of Wood—Test Methods for Small Clear Wood Specimens—Part 3: Determination of Ultimate Strength in Static Bending; Solid Biofuels; 1st ed. International Organization for Standardization: Geneva, Switzerland, 2015.
- ISO 13061-12:2017; Physical and Mechanical Properties of Wood—Test Methods for Small Clear Wood Specimens—Part 12: Determination of Static Hardness; 1st ed. International Organization for Standardization: Geneva, Switzerland, 2017.
- ISO 13061-17:2017; Physical and Mechanical Properties of Wood—Test Methods for Small Clear Wood Specimens—Part 17: Determination of Ultimate Stress in Compression Parallel to Grain; 1st ed. International Organization for Standardization: Geneva, Switzerland, 2017.
- ISO 13061-3:2014; Physical and Mechanical Properties of Wood—Test Methods for Small Clear Wood Specimens—Part 2: Determination of Density for Physical and Mechanical Tests; 1st ed. International Organization for Standardization: Geneva, Switzerland, 2014.
- ISO 18122:2022; Solid Biofuels—Determination of Ash Content; Solid Biofuels; 2nd ed. International Organization for Standardization: Geneva, Switzerland, 2022.
- ISO 18125:2017; Solid Biofuels—Determination of Calorific Value; Solid Biofuels; 1st ed. International Organization for Standardization: Geneva, Switzerland, 2017.
- ISO 16993:2016; Solid Biofuels—Conversion of Analytical Results from One Basis to Another; Solid Biofuels; 2nd ed. International Organization for Standardization: Geneva, Switzerland, 2016.
- ISO 1928:2020; Coal and Coke—Determination of Gross Calorific Value; 4th ed. International Organization for Standardization: Geneva, Switzerland, 2020.
- Piętka, J.; Gendek, A.; Malaťák, J.; Velebil, J.; Moskalik, T. Effects of Selected White-Rot Fungi on the Calorific Value of Beech Wood (Fagus sylvatica L.). Biomass Bioenergy 2019, 127, 105290. [Google Scholar] [CrossRef]
- TIBCO Statistica, Version 13.3 2017; An Advanced Analytics Software Package; TIBCO Software Inc.: Palo Alto, CA, USA, 2017.
- Lis, A.; Lis, P. Characteristics of wood strength as its basic mechanical properties. Zesz. Nauk. Politech. Częstochowskiej. Bud. 2013, 19, 77–86. [Google Scholar]
- Kukulski, J. Certain Aspects of Modelling Railway Superstructure, Its Components as Well as the Substructure. Probl. Kolejnictwa 2009, 148, 207–228. [Google Scholar]
- Antolik, Ł. Badania Laboratoryjne Kolejowych Podkładów Drewnianych. Pract. Inst. Kolejnictwa 2017, 156, 40–43. [Google Scholar]
- Yilgor, N.; Unsal, O.; Kartal, S.N. Physical, Mechanical, and Chemical Properties of Steamed Beech Wood. For. Prod. J. Madison 2001, 51, 89–93. [Google Scholar]
- Bouriaud, O.; Bréda, N.; Le Moguédec, G.; Nepveu, G. Modelling Variability of Wood Density in Beech as Affected by Ring Age, Radial Growth and Climate. Trees 2004, 18, 264–276. [Google Scholar] [CrossRef]
- Chaouch, M.; Pétrissans, M.; Pétrissans, A.; Gérardin, P. Use of Wood Elemental Composition to Predict Heat Treatment Intensity and Decay Resistance of Different Softwood and Hardwood Species. Polym. Degrad. Stab. 2010, 95, 2255–2259. [Google Scholar] [CrossRef]
- Hering, S.; Keunecke, D.; Niemz, P. Moisture-Dependent Orthotropic Elasticity of Beech Wood. Wood Sci. Technol. 2012, 46, 927–938. [Google Scholar] [CrossRef]
- Korzeniowski, A.; Swaczyna, I. Moduli of elasticity and density of beech wood and its usability for bending. Sylwan 1984, 128, 15–26. [Google Scholar]
- Fabijański, M.; Kowalik, P.; Naduk, E. Requirements for Wood Products Used in Railway Transport. WJTE 2020, 129, 27–48. [Google Scholar] [CrossRef]
- Tomczak, A.; Jelonek, T. Radial Variation in the Wood Properties of Scots Pine (Pinus sylvestris L.) Grown on Former Agricultural Soil. For. Res. Pap. 2013, 74, 171–177. [Google Scholar] [CrossRef]
- Jaworska, A.; Milczarek, D.; Naduk, E. Impregnation Wooden Railway Sleepers Including Physical and Chemical Properties Used Wood Protection Agent. Probl. Kolejnictwa 2013, 161, 43–58. [Google Scholar]
- Krzysik, F. Nauka o Drewnie; Państwowe Wydawnictwo Naukowe: Warszawa, Poland, 1974. [Google Scholar]
- DH Drewno Hermanowska. Instrukcje Użytkowania Oraz Tabele. 2023. Available online: https://parkiety.org.pl/instrukcje-uzytkowania-oraz-tabele/ (accessed on 3 October 2023).
- Anonimus Drewno/Obłóg, Fornir—Twardość Drewna. Available online: http://santisimatrinidad.jun.pl/printview.php?t=762&start=0&sid=d69f7ef582df875fafacc0db6544e890 (accessed on 14 October 2023).
- Laskowska, A. Density Profile and Hardness of Thermo-Mechanically Modified Beech, Oak and Pine Wood. Drewno Pract. Nauk. Doniesienia Komun. 2020, 63, 25–41. [Google Scholar] [CrossRef]
- Warzecha, J.; Siwek, K. Modyfikacja Drewna Sosny i Jodły Żywicami Moczninikowymi Utoksycznionymi. Zesz. Probl. Postępów Nauk Rol. 1983, 260, 45–54. [Google Scholar]
- Tarasiuk, S.; Jednoralski, G. Variability, Silvicultural Quality and Physico−mechanical Wood Properties of Three Beech Provenances. Sylwan 2005, 149, 42–49. [Google Scholar]
- EN 338:2016; Structural Timber—Strength Classes. European Committee for Standardization: Brussels, Belgium, 2016.
- Paschalis, P. Variation in technical quality of Scots pine wood in the estern part of Poland. Sylwan 1980, 124, 29–44. [Google Scholar]
- Wanin, S. Nauka o Drewnie; Państwowe Wydawnictwo Rolnicze i Leśne: Warszawa, Poland, 1953. [Google Scholar]
- Kubiak, M.; Laurow, Z. Surowiec Drzewny; Fundacja Rozwój SGGW: Warszawa, Poland, 1994; ISBN 83-86241-33-0. [Google Scholar]
- Żelazny, H.; Bednarz, B. Evaluation of the possibility of using wood from selected species of deciduous trees to the structural elements subjected to bending. Zesz. Nauk. Politech. Częstochowskiej. Bud. 2017, 23, 357–368. [Google Scholar]
- Fessel, F. Probleme beim Holzbiegen. Holz Als Roh-Und Werkst. 1951, 9, 56–62. [Google Scholar] [CrossRef]
- Demirbas, A. Calculation of Higher Heating Values of Biomass Fuels. Fuel 1997, 76, 431–434. [Google Scholar] [CrossRef]
- Demirbas, A. Carbonization Ranking of Selected Biomass for Charcoal, Liquid and Gaseous Products. Energy Convers. Manag. 2001, 42, 1229–1238. [Google Scholar] [CrossRef]
- Demirbas, A. Combustion Characteristics of Different Biomass Fuels. Prog. Energy Combust. Sci. 2004, 30, 219–230. [Google Scholar] [CrossRef]
- Sharypov, V.I.; Marin, N.; Beregovtsova, N.G.; Baryshnikov, S.V.; Kuznetsov, B.N.; Cebolla, V.L.; Weber, J.V. Co-Pyrolysis of Wood Biomass and Synthetic Polymer Mixtures. Part I: Influence of Experimental Conditions on the Evolution of Solids, Liquids and Gases. J. Anal. Appl. Pyrolysis 2002, 64, 15–28. [Google Scholar] [CrossRef]
- Parikh, J.; Channiwala, S.A.; Ghosal, G.K. A Correlation for Calculating Elemental Composition from Proximate Analysis of Biomass Materials. Fuel 2007, 86, 1710–1719. [Google Scholar] [CrossRef]
- Inari, G.N.; Pétrissans, M.; Pétrissans, A.; Gérardin, P. Elemental Composition of Wood as a Potential Marker to Evaluate Heat Treatment Intensity. Polym. Degrad. Stab. 2009, 94, 365–368. [Google Scholar] [CrossRef]
- Shen, J.; Zhu, S.; Liu, X.; Zhang, H.; Tan, J. The Prediction of Elemental Composition of Biomass Based on Proximate Analysis. Energy Convers. Manag. 2010, 51, 983–987. [Google Scholar] [CrossRef]
- Haarlemmer, G.; Guizani, C.; Anouti, S.; Déniel, M.; Roubaud, A.; Valin, S. Analysis and Comparison of Bio-Oils Obtained by Hydrothermal Liquefaction and Fast Pyrolysis of Beech Wood. Fuel 2016, 174, 180–188. [Google Scholar] [CrossRef]
- Zeng, K.; Gauthier, D.; Li, R.; Flamant, G. Combined Effects of Initial Water Content and Heating Parameters on Solar Pyrolysis of Beech Wood. Energy 2017, 125, 552–561. [Google Scholar] [CrossRef]
- Kowalczyk-Juśko, A.; Cybulski, J. Woody biomass as a feedstock for power. Autobusy Tech. Eksploat. Syst. Transp. 2012, 13, 155–158. [Google Scholar]
- Mółka, J.; Łapczyńska-Kordon, B. Energy properities of the selected biomass types. Inżynieria Rol. 2011, 6, 141–147. [Google Scholar]
- Bodziarczyk, J. (Ed.) Pieniny Przyroda i Człowiek; Wydawnictwo Uniwersytetu Rolniczego w Krakowie: Kraków, Poland, 2021; ISBN 978-83-66602-26-7. [Google Scholar]
- Sporek, M. Energy potential of the biomass of the Scots pine (Pinus sylvestris L.). Proc. ECOpole 2013, 7, 721–725. [Google Scholar] [CrossRef]
- Aniszewska, M.; Gendek, A.; Drożdżek, M.; Bożym, M.; Wojdalski, J. Physicochemical Properties of Seed Extraction Residues and Their Potential Uses in Energy Production. Rocz. Ochr. Srod. 2017, 19, 302–334. [Google Scholar]
- Skawińska, A.; Micek, B.; Hrabak, J. Evaluation of net calorific value and chlorine and sulfur content of selected waste in terms of its energetic utilization. Ochr. Sr. 2017, 39, 39–43. [Google Scholar]
- Inspektorat Ochrony Środowiska Czy Możliwe Jest Stosowanie Zużytych Podkładów Kolejowych? Available online: https://www.gov.pl/web/wios-gdansk/czy-mozliwe-jest-stosowanie-zuzytych-podkladow-kolejowych-czwartek-09012020 (accessed on 25 September 2023).
Disclaimer/Publisher’s Note: The statements, opinions and data contained in all publications are solely those of the individual author(s) and contributor(s) and not of MDPI and/or the editor(s). MDPI and/or the editor(s) disclaim responsibility for any injury to people or property resulting from any ideas, methods, instructions or products referred to in the content. |
© 2024 by the authors. Licensee MDPI, Basel, Switzerland. This article is an open access article distributed under the terms and conditions of the Creative Commons Attribution (CC BY) license (https://creativecommons.org/licenses/by/4.0/).