Abstract
Given the importance of net primary productivity (NPP) as an indicator of ecosystem productivity and its role in the global carbon cycle, understanding the factors that influence its stability can greatly improve our understanding of shrubland ecosystems and their response to global change. Between 2015 and 2022, we visited most of the primary shrubland in China and surveyed 751 shrubland patches. We collected data on community structure (canopy cover), shrub and herb species diversity, and soil physicochemical properties (soil nitrogen content and soil phosphorus content). We also used remote sensing data to obtain NPP from 2001 to 2022. We quantified temporal trends in shrubland stability in China and used structural equation modeling to disentangle the direct and indirect effects of climate, soil, and shrub community structural properties. We found that 85.3% of China’s shrublands remained stable in terms of productivity from 2001 to 2022, 10.6% of the shrublands increased in stability, and 4.1% of the shrublands need to be alerted to a significant decrease in stability. These changes in stability were mainly related to precipitation changes. We found that changes in precipitation directly affected the stability of net productivity and also indirectly through changes in shrub cover and species richness. Some aspects of community structure moderated these effects. We further found that the portion of shrubland with an upward trend in stability did not have a significant correlation between the stability of net primary productivity and community structure and soil N. Instead, soil phosphorus was the largest direct influence.
1. Introduction
As the global climate is rapidly changing [1], a number of features of ecosystems are at risk of undergoing their own dramatic changes, which can in turn alter ecosystem services and human well-being [2]. Key climate variables (e.g., temperature and precipitation) are changing over time, which can affect key ecosystem and vegetation processes [3]. Net primary productivity (NPP), a fundamental ecosystem function that reflects its ability to convert inorganic matter into organic matter through photosynthesis over time, serves as a pivotal indicator for assessing global climate change and human activities [4,5,6]. The inter-annual variability of NPP, which reflects its stability, offers valuable insights into the adaptive resilience and disturbance resistance of ecosystems in the face of climate change and anthropogenic disturbances [7,8]. The productivity of ecosystems is indeed often influenced by climate change, including the increased occurrence of extreme weather events that may pose a threat to the overall stability of the entire ecosystem [9,10,11]. Therefore, quantifying inter-annual variation in NPP can serve as a valuable indicator of ecosystem stability and provide insights into the response of ecosystems to climate change [12,13,14,15].
While temperature and precipitation exert significant influences on ecosystem productivity and stability [16,17,18], compensatory mechanisms play a pivotal role in maintaining the stability of NPP within ecosystems [19,20,21]. Soil resources can serve as a compensatory mechanism for mitigating the impact of climate on ecosystem NPP and contribute to the maintenance of ecological stability [22]. Nutrient-rich soil plays a crucial role in providing essential elements for plant growth and facilitating normal physiological activities in plants [23,24]. The incorporation of organic matter and minerals in the soil can enhance soil structure and augment its water retention capacity, thereby facilitating plants to maintain adequate water supply during drought conditions [25]. Additionally, nutrient-rich soil promotes plant growth by fostering stronger biomass and root systems, leading to improved water and nutrient uptake efficiency [26]. Furthermore, the availability of soil nutrients exerts an influence on plant gene expression, leading to enhanced expression of resistance genes in nutrient-rich environments [27].
Similar to soil characteristics, the community attributes of vegetation also contribute to the stability of ecosystem NPP [28,29,30]. For instance, tree canopies play a crucial role in regulating solar radiation availability, above- and below-ground respiration, as well as evapotranspiration processes, thereby mitigating the impacts of climate warming and drought on productivity changes [28]. Similarly, vegetation and its diversity within an ecosystem can influence the magnitude of NPP stability alterations in response to climate change [31,32]. For instance, during periods of drought or other disturbances, species diversity plays a crucial role in stabilizing ecosystem productivity by enabling more tolerant species to compensate for declines in production caused by less tolerant species [33,34]. Despite widespread support for the diversity–stability hypothesis [33,35], controversies and challenges have emerged [36]. For instance, certain studies suggest that the influence of species diversity on ecosystem stability may be contingent upon specific environmental conditions and ecosystem types, indicating that not all ecosystems exhibit enhanced stability due to species diversity [24,37].
In this study, we selected Chinese shrublands as our research focus due to their significant ecological contributions. China encompasses approximately 743,000 km2 of shrubland, which accounts for 13.7% of the total terrestrial ecosystem area [38]. Shrubland ecosystems in China exhibit remarkable water-holding capacity (165.289 km3), soil conservation capacity (26.733 Pg), windbreak and sand-fixing capacity (2.21 Pg), and carbon sequestration capacity (128.996 Pg) [39]. These data demonstrate the pivotal role of shrubland ecosystems in upholding the natural environment and preserving ecological equilibrium. We assessed the stability of NPP in shrublands and examined its temporal patterns across diverse climatic conditions, ranging from cold to warm and dry to wet. Specifically, we quantified NPP stability and its correlation with climate variables, as well as examined the compensatory effects of soil nutrients, community structure, and species richness on NPP stability using satellite-derived NPP data and climate records encompassing China’s extensive and heterogeneous shrublands from 2001 to 2022.
To assess the role of local-scale processes, including soil nutrient availability, vegetation structure, and diversity, we selected 751 primary sample plots from diverse administrative regions in China. We specifically focused on shrubland types found in primary shrubland sites (excluding those formed after disturbances such as deforestation and fire). Our data collection encompassed measurements of the vegetation structure (canopy cover), species diversity (shrubs and herbs), and soil nutrient content (soil N, soil P) to evaluate their contribution towards maintaining NPP stability in shrubland ecosystems. Specifically, we asked the following questions: (1) How does the temporal variation of NPP stabilization manifest in Chinese shrubland ecosystems? (2) Which characteristics of climate, local soil conditions, and local vegetation conditions are associated with NPP stabilization, and are they directly or indirectly related?
2. Materials and Methods
2.1. Shrubland Sample Plots and Vegetation Sampling
To quantify the structural characteristics and diversity of shrubland vegetation from across China’s shrublands, we collected data from 751 sites as part of the China Science and Technology Basic Work Program (2015FY110300) supported by the Ministry of Science and Technology of the People’s Republic of China. Our criteria for selecting sample sites were as follows: firstly, to exclude disturbed or damaged shrublands, particularly those in the recovery stage; secondly, to avoid selecting shrubland in ecological transition zones adjacent to forests or grasslands; and finally, in mountainous environments, shrubland occurring at higher elevations was chosen as sample sites. In these areas, factors such as altitude and climate prevent the growth of forests, making shrubland the dominant vegetation type. The shrubland sample sites ranged from 75.5° to 132.8° E longitude and 18.6° to 52.4° N latitude, with altitudes ranging from 0 to 5300 m a.s.l (Figure 1). The shrubland data included four shrubland types that are the most widely distributed in China: bamboo shrubland; evergreen broad-leaved shrubland; deciduous broad-leaved shrubland; and evergreen coniferous shrubland. We sampled these plots during June to September, 2015–2020.
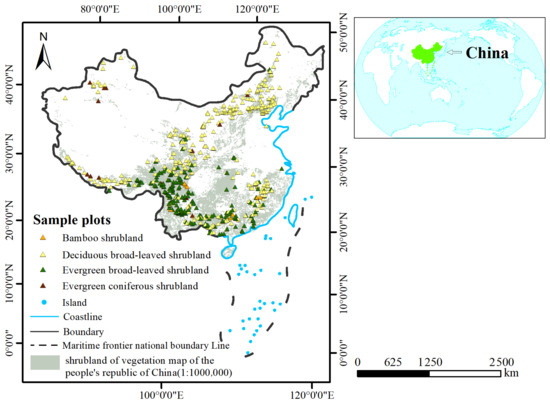
Figure 1.
Location of the study area and map of sampling sites.
To sample vegetation, three sample plots of 25 m2 (5 m × 5 m) were set up in each of the 751 shrubland communities, and the latitude, longitude, and elevation of the center point of each plot were recorded. Field surveys were conducted from July to October 2015–2020 to record the number of shrub species and the canopy cover in the sample plots. At the same time, three 1 m × 1 m subplots were set up diagonally in each sample plot for herbaceous plant surveys, and the number of herbaceous plant species were recorded in the subplots. In summary, shrub species richness data came from 2253 shrub samples and herb species richness data came from 6759 herb samples (Table 1).

Table 1.
Shrubland sampled in this study.
2.2. Soil Sampling and Nutrient Estimation
To measure soil characteristics, in each sample plot, after removing the surface apoptosis, three sample points were randomly selected to collect 0–20 cm of surface soil, which was mixed homogeneously to remove debris such as gravel and roots, and then returned to the laboratory in self-sealing bags, numbered, and brought back to the laboratory for the determination of total soil nitrogen and total soil phosphorus. Total nitrogen was determined by Kjeldahl method and total phosphorus was determined by molybdenum-antimony colorimetric method [40,41].
2.3. Climate Data
We obtained monthly data on temperature and precipitation from worldclim’s historical monthly climate data from 2001 to 2022 with a spatial resolution of 2.5′ (https://www.worldclim.org/data/monthlywth.html, accessed on 9 October 2023) [42]. The mean annual temperature in the shrubland sampling area was 8.56 ± 6.12 °C, and the limit range of the mean annual temperature was −5.25 °C (minimum value) to 25.19 °C (maximum value). The mean annual precipitation in the shrubland sampling area was 668.5 ± 461.6 mm and the limit range of annual precipitation was 32 mm (minimum value) to 2166 mm (maximum value).
2.4. NPP Data and Calculation of Productivity Dynamics
We collected NPP data from NASA’s MOD17A3HGF product (https://lpdaac.usgs.gov, accessed on 9 October 2023), which has a spatial resolution of 500 m MODIS/Terra imagery. Specifically, we calculated net photosynthesis every 8 days as the difference between total primary productivity and respiration maintenance [43]. We calculated NPP at a one-year temporal resolution from 2001 to 2022.We used mean annual NPP from 2001 to 2022 to characterize the productivity level. We further used the coefficient of variation of the NPP time series from 2001 to 2022 to characterize the stability. Hereafter, we refer to variation coefficient as CV with smaller CV of NPP values indicating more stable productivity.
2.5. Terrain Data
To investigate elevation gradient patterns in shrubland NPP stability, we used elevation data from the SRTM (Shuttle Radar Topography Mission), an international project conducted jointly by NASA and the National Geospatial-Intelligence Agency (NGA) since 11–22 February 2000 on the Space Shuttle Endeavour. The SRTM mission lasted 11 days and collected data via radar interferometry, an onboard/outboard antenna system, and a single data acquisition, which was used to generate a near-global land elevation data product. We used SRTM1 with an accuracy of 1arc-second, and the SRTM1 file contains height data from 3600 × 3600 sampling points inside, with an accuracy of about 30 m.
2.6. Data Analysis
We obtained the geographic location and area of shrubland from a vegetation map of the People’s Republic of China (1:1,000,000) [44] and divided the statistical units into counties in China, so we obtained 1434 county-scale shrubland patches (Figure 2). These shrubland patches were matched with the NPP data from 2001 to 2022 in ArcMap10.2 software according to geographic coordinates, and spatial statistics were performed on each shrubland patch to obtain the mean value of NPP for each year. The CV of NPP for 2001–2022 for each shrubland patch was calculated as the temporal stability index of shrubland in the county.
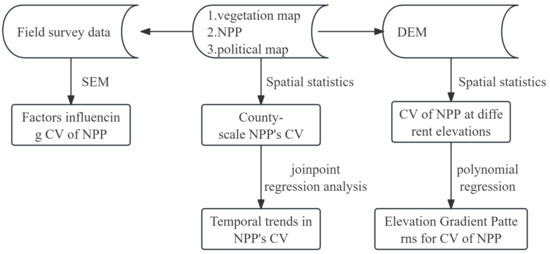
Figure 2.
Methodology flowchart. CV is coefficient of variation. NPP is net primary productivity. DEM is a digital elevation model.
We partitioned the elevation range of 0–6100 m into 61 statistical units at intervals of 100 m. Utilizing the SRTM data, we generated a digital elevation model (DEM) and integrated it with the distribution data of shrubland coefficient of variation (CV) based on the spatial coordinate system in ArcGIS 10.2 software. This enabled us to derive the mean value and area of shrubland CV for each statistical unit, facilitating an analysis of the elevation gradient pattern in shrubland NPP stability. The evaluation of CVs for shrubland NPP along elevational gradients was conducted using R version 4.2.2 with assistance from the stats package.
In order to analyze the trend of shrubland stability, we divided the years 2001–2022 into five time segments: 2001–2005, 2006–2010, 2011–2015, and 2016–2022. Then, we compared the difference in the CV of NPP for each time segment with that of the last, respectively. A larger CV value represents a decrease in stability for this time period relative to the previous time period, and vice versa for an increase in stability.
In order to detect the significance of the CV trend, we used joinpoint regression to avoid the error caused by the unequal length of the four time periods. We evaluated the average annual percentage change (AAPC) and corresponding 95% confidence intervals (CI) for the CV data. The weights are equivalent to the length of time interval. All AAPCs with 95% CI above and below zero, respectively, were considered as upward and downward trends. A value of 95% CI coinciding with zero was considered as a stable trend [45]. In all statistical analyses, we set α = 0.05 as the significance criterion. The joinpoint regression analysis was conducted using the Joinpoint software (Version 5.0.2.; Statistical Research and Applications Branch, National Cancer Institute, Calverton, MD, USA), which was developed by the National Cancer Institute.
By matching geographic coordinates, we obtained monthly precipitation data and monthly maximum and minimum air temperatures for each shrubland vegetation survey sample site from 2001 to 2022. We labeled the monthly precipitation as annual precipitation, and the average temperature of each month as annual average temperature, and calculated the CV of annual precipitation and the CV of annual average temperature for each shrubland vegetation survey sample site. They were analyzed together with soil nutrient content, shrubland cover, and species richness as factors influencing the CV values of NPP.
Structural equation modeling (SEM) was used to determine the structural relationships between climate, soil, and community characteristics and CV of NPP. We first developed a hypothetical model based on the existing knowledge and previous findings [46,47,48,49], which contained CV of annual precipitation, CV of annual mean temperature, soil nitrogen content, soil phosphorus content, canopy cover, shrub species richness, and herbaceous species richness All plausible interaction paths between shrub species richness and CV of NPP were further refined based on SEM techniques [50]. The data on species richness of shrub/herb were log-transformed to normalize the error term [51]. Model fit was assessed using a set of criteria, with maximum likelihood χ2/df, less than 5, being considered goodness of fit [52]. And, goodness of fit index (GFI) values closer to 1 indicated higher model fit, and vice versa for lower model fit [53]. Traditionally, a comparative fit index (CFI) of 0.9 or above is considered a good fit [54,55]. Furthermore, the smaller the standardized root mean square residual (SRMR), the better the model fit; SRMR = 0 indicates perfect fit and less than 0.05 is generally referred to as good fit [56]. In addition, root mean square error of approximation (RMSEA) less than 0.08 indicates an acceptable model [57,58]. The analysis of SEM is conducted in the in R version 4.2.2 by applying the lavaan package.
3. Results
3.1. Dynamics of Shrubland Productivity
The stability of shrubland ecosystems in China is characterized by large spatial heterogeneity. At the spatial scale, shrubland stability is relatively high in the south and northwest, while shrubland on the northeast–southwest continuum is less stable (Figure 3a). This may be due to environmental factors, such as climate, or the characteristics of the shrubs themselves. Within the same region, shrubland stability changes over time (Figure 3b). For example, shrubland stability generally declined between 2011 and 2015 (Figure 3c) but began to increase in most regions between 2016 and 2022 (Figure 3d). This phenomenon may be related to changes in environmental factors, especially climate, across the region. In addition, the stability of shrubland ecosystems is closely linked to spatial heterogeneity. Heterogeneous diversity can lead to more complex landscapes and ecosystem functions, and at the same time provide suitable survival environments and opportunities for different species, thus increasing ecosystem stability and stress resistance. Overall, the spatial heterogeneity of the stability of shrubland ecosystems in China is a complex issue involving various factors such as geographic location, climate, environmental factors, and the characteristics of the shrublands themselves.
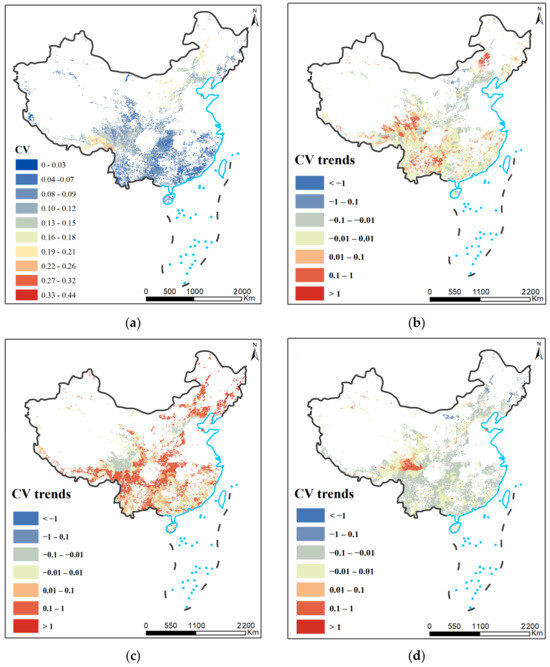
Figure 3.
(a) CV of shrubland NPP during 2001–2022; (b) difference in CV between 2006 and 2010 compared to 2001–2005. (c) Difference in CV between 2011 and 2015 compared to 2006–2010; (d) difference in CV between 2016 and 2022 compared to 2011–2015.
According to the Chinese vegetation map records, the shrubland was mainly distributed between 0 and 6100 m above sea level, with a bimodal distribution (R2 = 0.901, p < 0.005), with the first peak value at 5100 m, and the second peak at 1000 m (Figure 3). The lowest elevation for NPP stability was 5100 m, and the highest elevation range for NPP stability was below 1000 m. The CVs of the elevation intervals between 0 and 1000 m and between 2000 and 5100 m gradually increased with elevation, both NPP stability decreased with elevation. The 2000 to 5100 m elevation ranges have CVs that gradually increase with elevation, both NPP stability decreases with elevation. On the contrary, CV decreases with elevation for the elevation intervals from 1000 to 2000 m and above 5100 m, both NPP stability increases with elevation. Overall, the stability of NPP is higher at altitude than at lower altitudes (Figure 4).
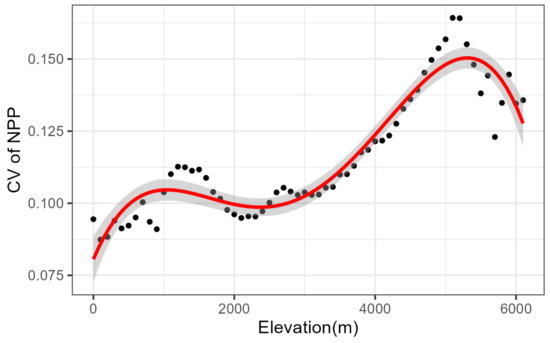
Figure 4.
Elevational pattern of cv of NPP in China. The red line indicates the best fit model of polynomial. The gray areas represent 95% confidence intervals and the black dots are the mean values of the CVs.
Dividing 2001 to 2022 into four phases, through Joinpoint regression analysis, we found that 85.3% of the 1434 counties in China with shrubland data have fluctuating NPP stability, and no significant upward or downward trend was found. It is noteworthy that the stability of NPP in 152 counties is increasing (with decreasing CV), mainly in the Loess Plateau in northern China, the Qaidam Basin in western China, and the Liangguang Hills in southern China, which account for 10.6% of China’s shrubland (Figure 5). However, a more alarming phenomenon is the decreasing stability (increasing CV) of NPP in 59 counties, widely distributed in southern and southwestern China, accounting for 4.1% of China’s shrubland (Figure 5), which is a relatively small proportion but indicates the risk of changes in ecosystem structure and function, and threats to ecosystem health.
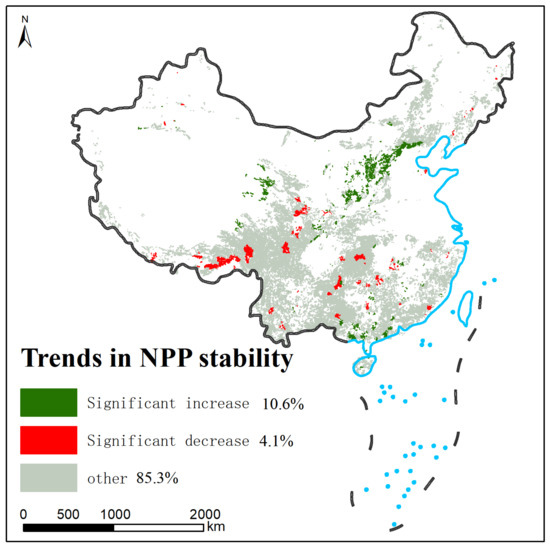
Figure 5.
Distribution of shrubland NPP trends.
3.2. Environmental Factors Affecting Productivity
To verify whether fluctuations in shrubland net productivity are caused by fluctuations in annual precipitation and mean annual temperature, and the contribution of soil nutrients and community characteristics to stabilizing shrubland net productivity, we used structural equation modeling (SEM). Referring to the model evaluation criteria, our SEM had a relatively good model fit. From the SEM, we found that the climatic factor that contributes the most to the fluctuation of NPP is the fluctuation of annual precipitation, while the fluctuation of annual mean temperature has a very relatively weak effect on NPP (Figure 6a). Moreover, we found that soil nitrogen content was a facilitating factor to reduce the fluctuation and increase the stability of shrubland NPP, but soil phosphorus content was not found to play a significant role in the stability of NPP (Figure 6a). Finally, we found that canopy cover and shrub species richness also had positive effects on maintaining productivity stability, but herbaceous species richness promoted fluctuations in NPP (Figure 6a).
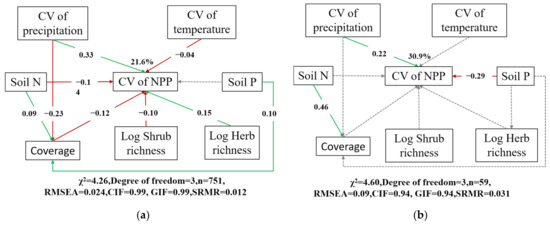
Figure 6.
Cascading relationships of annual NPP coefficients of variation with environmental variables and community characteristics. (a) Sample sites with significant increases in NPP stability on the time series; (b) all sample sites. Gray dotted lines indicate insignificant pathways from a priori models. Green and red arrows indicate positive and negative flows of causality (p < 0.05), respectively. Numbers on the arrow indicate significant standardized path coefficients. CV: coefficient of variation; Soil N: soil nitrogen; Soil P: soil phosphorous; Coverage: total shrubland canopy cover; Log Shrub richness: Log-transformed number of shrub species; Log Herb richness: Log-transformed number of herb species.
The NPP stability of 59 shrubland sample plots in China has continued to increase over the past years, from 2001 to 2022. This increasing trend may be due to the combined effects of several environmental factors. First, the NPP stability of these samples was decreased by precipitation variability, and the standardized path coefficient decreased from 0.33 to 0.22, but precipitation variability still negatively affected the NPP stability of these samples. Second, the effects of temperature variability, soil nitrogen content, cover, and species richness on NPP stability were no longer significant (Figure 6b). This may indicate that the stabilized growing shrublands have adapted to the variations in these factors, or that the effects of these factors on the NPP of the stabilized growing shrublands have diminished. On the contrary, soil phosphorus content became the variable that contributed the most to NPP stability, with higher soil phosphorus content being associated with higher NPP stability. This may imply that soil phosphorus content has a critical influence on NPP stability in samples with sustained stability growth.
4. Discussion
4.1. Stability Patterns and Trends
By analyzing the temporal variation of NPP in shrubland ecosystems, which is an important component of ecosystem stability [59], we concluded that there is spatial heterogeneity in the ecological stability of shrubland in China. The spatial heterogeneity exhibited in ecosystem stability is not only a result of geographic and environmental differences but is also closely related to the structure and function of ecosystems [60], which is consistent with our findings. Due to the enhanced temporal variability of precipitation in the tropics in recent years, precipitation-driven ecosystem stability in the tropics showed less stability than in the mid-northern latitudes [61], further supporting our view that temporal variability of precipitation drives productivity stability. Another study conducted in the Chinese region can also provide support for our view that precipitation in China has increased in fluctuations over the last 20 years and has increased more in the northern region than in the southern region [62], which can be used to explain our finding that southern shrubland is more stable than northern shrubland.
Our results show that most of the shrubland in China can maintain stability, which is related to the stability of China’s climate in the last 20 years, where the frequency of extreme climate events and extreme conditions are relatively mild [63]. Overall, 10.6% of China’s shrubland has increased in stability since 2001, which is mainly concentrated in the Inner Mongolia Plateau and the Loess Plateau region, and the possible reasons for this are twofold. One is that the implementation of ecological restoration projects and measures such as returning farmland to forests in the region in the past 20 years has improved the stability of local shrubland [64,65]. The second is the influence of changes in climate; in recent years, the climate of the Inner Mongolia Plateau and Loess Plateau has undergone certain changes, such as rising temperatures and increased precipitation, which has had a positive impact on the growth and stability of vegetation [66,67].
Globally, most terrestrial ecosystems are in a stable state, with degraded vegetation accounting for only 5.9% of the global vegetation area [68]. However, what is more alarming is that 9.2% of the shrubland has declined in stability, and the percentage of shrubland stability decline is higher than the global average. Declining vegetation stability may lead to affected ecological functions and deterioration of the ecological environment. For example, when vegetation stability declines, it may lead to the following: a reduction in vegetation cover, where the soil is easily washed away by wind and water, resulting in infertile soils and increased soil erosion [69]; declining vegetation stability, leading to the loss of suitable conditions for the survival of many plants and animals, triggering a biodiversity reduction [70]; a decrease in vegetation stability, weakening carbon sequestration and exacerbating the rate of climate change [71]. There are many possible reasons for the decline of shrubland stability. First, natural factors; for example, extreme climatic events (e.g., drought, floods, etc.) or natural disasters (e.g., fires, earthquakes, etc.), which can destabilize vegetation [72,73]. Second, anthropogenic factors; human activities, such as excessive felling, overgrazing, and overcultivation, which disrupt ecological balance and vegetation stability [74]. Third, the urbanization process; during urbanization, activities such as city construction, road expansion, and industrial pollution destroy surrounding vegetation and reduce vegetation stability [73]. However, shrubland stability is not determined by a single factor, but is usually driven by a combination of factors [22,75,76].
4.2. Correlates of Stability
We found that the stability of NPP is mainly ensured by the stability of annual precipitation. Indeed, precipitation is commonly associated with ecosystem stability [77], especially in arid and semi-arid regions where precipitation is a driver of productivity and NPP increases with annual precipitation, and vice versa [78]. Globally, the interannual variability of precipitation is increasing as climate warming intensifies and the frequency of extreme events increases [79], which we expect to lead to a decrease in the stability of many ecosystems. NPP responds positively or negatively to increases in precipitation variability in different regions due to differences in hydrological conditions [80]. Globally, precipitation variability has a negative impact on NPP, which may affect future terrestrial carbon sinks [81].
We found that increased soil N content increased NPP stability (lower CV). Globally, soil nutrient limitation usually leads to lower NPP, and higher soil nutrient content usually leads to higher NPP [82]. Soil conditions increase NPP stability by increasing average NPP [83]. Therefore, low N soils not only lead to low NPP but also decrease NPP stability. Although China’s N reserves are slightly higher than the global average, low-N soils cover a large area [84], which may pose a risk to NPP stability. There is a need to be alert to the possible combined effect of low soil N content and high variability of precipitation on NPP stability.
4.3. NPP Stability and Community Characterization
As we observed in SEM, community characteristics had a significant effect on NPP stability. Specifically, the greater the canopy cover and the higher the shrub species richness, the higher the NPP stability, while the higher the herbaceous species richness, the lower the NPP stability. The possible reason is that productivity and community characteristics (canopy cover and species richness) work together to respond to climate change, and the temporal stability of NPP is usually ensured by altering the ratio of above-ground and below-ground NPP allocation by changing canopy cover, species richness, etc. [85]. For example, the occurrence of prolonged drought events reduces species richness and decreases the ratio of ANPP (above ground net primary productivity) to BNPP (below ground net primary productivity) [86].
The relationship we observed between shrub species richness and NPP stability is consistent with the diversity–stability hypothesis. There is a close relationship between diversity and stability, and according to the assemblage theory, communities with such high biodiversity should exhibit high stability in terms of ecosystem functions, including NPP [87]. In addition, the species competition model proves that the higher the species diversity, the higher the NPP and the higher the temporal stability of the community [88]. On the other hand, according to our results, high shrub species richness leads to low herbaceous species richness, and low herbaceous species richness instead promotes NPP stability. Warming experiments in alpine grassland ecosystems yielded results consistent with ours, and experimental warming and drought treatments, which increased herbaceous species richness, decreased NPP maintained stability [88].
4.4. Future Research Directions
Our study represents a pioneering investigation into the temporal patterns and trends of NPP stability in shrubland ecosystems across China during the period 2001–2022. Additionally, we comprehensively analyzed the influential factors impacting shrubland stability while exploring how soil nutrients, community structure, and species richness can potentially compensate for climatic fluctuations affecting shrubland NPP. Notably, our research bridges a critical knowledge gap by providing a comprehensive understanding of compensatory effects from soil nutrients, community structure, and species richness that were previously lacking in local-scale studies on shrubland stability in China.
According to our findings, in order to enhance the stability of NPP in shrubland ecosystems in China, it is crucial to primarily focus on mitigating the impact of precipitation variability on shrubland dynamics. The effects of precipitation variation can be counterbalanced by adjusting soil moisture through irrigation or other appropriate measures. Furthermore, ameliorating climatic fluctuations in shrubland NPP can be achieved by augmenting soil nutrient availability, increasing cover, and enhancing shrub species richness within the shrub community. However, regulating the phosphorus content in soil is regarded as the primary approach to enhance the stability of shrublands with consistent NPP stability growth.
The future research direction entails investigating the constraints on NPP stability in China’s shrubland and devising strategies to uphold stability across diverse regions based on climatic and topographic conditions. Furthermore, it is crucial to explore the potential interplay or counteractive impacts of soil properties, community structure, and species diversity on NPP stability, along with elucidating the specific underlying mechanisms driving these influences.
5. Conclusions
Given the significance of NPP as an indicator of ecosystem function and its role in the global carbon cycle, comprehending its stability and the factors influencing it can significantly enhance our understanding of shrubland ecosystems and their response to global change. At the spatial scale, we observed heterogeneous stability among shrubland ecosystems in China, with southern shrublands exhibiting notably higher stability compared to northern and southwest shrublands. Along the elevation gradient, NPP stability was found to be lowest at 5000 m. Over time, approximately 85.3% of shrublands displayed no significant increase or decrease in NPP stability during 2001–2022, while 10.6% exhibited a continued increase and 4.1% showed a continued decrease in NPP stability. The variation in shrub NPP stability is primarily attributed to climate change, particularly fluctuations in annual rainfall patterns. Additionally, we discovered that soil nitrogen content, shrub cover, and species richness exert compensatory effects on shrub NPP stability. Based on our research findings, it has been observed that over the past two decades there has been a continuous decline in shrub NPP stability across 59 counties in China. The impact of rainfall variability can be mitigated by adjusting soil moisture levels while increasing soil nitrogen content and enhancing shrub cover density, and promoting greater species richness can contribute to increased stability of shrubland NPP. Investigating the interaction between these factors and elucidating the mechanisms underlying their influence on shrubland NPP stability will be addressed as part of our future research.
Author Contributions
Conceptualization, Q.L. and T.L.; methodology, T.L. investigation, J.H., L.L., J.L. and D.L.; writing—original draft preparation, T.L.; writing—review and editing, T.L.; funding acquisition, Q.L. All authors have read and agreed to the published version of the manuscript.
Funding
This research was supported by The Second Tibetan Plateau Scientific Expedition and Research Program (STEP) [2019QZKK0301] and National Key R&D Program of China [2023YFC3007104].
Data Availability Statement
Climate data were obtained from [worldclim’s historical monthly climate data] and are available [https://www.worldclim.org/data/monthlywth.html, accessed on 9 October 2023]. Shrubland vegetation survey data and soil data were obtained from [https://www.geodata.cn/index.html, accessed on 9 October 2023] and are available [https://www.geodata.cn/index.html, accessed on 9 October 2023] with the permission of [National Earth System Science Data Center]. NPP data were obtained from [NASA’s MOD17A3HGF product] and are available [https://lpdaac.usgs.gov, accessed on 9 October 2023]. Terrain data were obtained from USGS Earth Explorer and are available [https://earthexplorer.usgs.gov, accessed on 9 October 2023].
Acknowledgments
Support for the vegetation surveys for this study is gratefully acknowledged by all the organizations and individuals who provided support.
Conflicts of Interest
The authors declare no conflicts of interest.
References
- Pörtner, H.O.; Roberts, D.C.; Tignor, M.; Poloczanska, E.S.; Mintenbeck, K.; Alegría, A.; Craig, M.; Langsdorf, S.; Löschke, S.; Möller, V.; et al. (Eds.) IPCC 2022: Climate Change 2022: Impacts, Adaptation, and Vulnerability. In Contribution of Working Group II to the Sixth Assessment Report of the Intergovernmental Panel on Climate Change; Cambridge University Press: Cambridge, UK; New York, NY, USA, 2022; p. 3056. [Google Scholar]
- Díaz, S.; Settele, J.; Brondízio, E.S.; Ngo, H.T.; Agard, J.; Arneth, A.; Balvanera, P.; Brauman, K.A.; Butchart, S.H.M.; Chan, K.M.A.; et al. Pervasive human-driven decline of life on Earth points to the need for transformative change. Science 2019, 366, 6471. [Google Scholar] [CrossRef] [PubMed]
- Foley, J.A.; Levis, S.; Prentice, I.C.; Pollard, D.; Thompson, S.L. Coupling dynamic models of climate and vegetation. Glob. Change Biol. 1998, 4, 561–579. [Google Scholar] [CrossRef]
- Schlesinger, W.H.; Cole, J.J.; Finzi, A.C.; Holland, E.A. Introduction to coupled biogeochemical cycles. Front. Ecol. Environ. 2011, 9, 5–8. [Google Scholar] [CrossRef]
- Forzieri, G.; Alkama, R.; Miralles, D.G.; Cescatti, A. Satellites reveal contrasting responses of regional climate to the widespread greening of Earth. Science 2017, 356, 1140–1144. [Google Scholar] [CrossRef] [PubMed]
- Piao, S.L.; Wang, X.H.; Park, T.; Chen, C.; Lian, X.; He, Y.; Bjerke, J.W.; Chen, A.P.; Ciais, P.; Tommervik, H.; et al. Characteristics, drivers and feedbacks of global greening. Nat. Rev. Earth Environ. 2020, 1, 14–27. [Google Scholar] [CrossRef]
- Fridley, J.D.; Lynn, J.S.; Grime, J.P.; Askew, A.P. Longer growing seasons shift grassland vegetation towards more-productive species. Nat. Clim. Change 2016, 6, 865–868. [Google Scholar] [CrossRef]
- Cheng, W.X.; Sims, D.A.; Luo, Y.Q.; Coleman, J.S.; Johnson, D.W. Photosynthesis, respiration, and net primary production of sunflower stands in ambient and elevated atmospheric CO concentrations: An invariant NPP:GPP ratio? Glob. Change Biol. 2000, 6, 931–941. [Google Scholar] [CrossRef]
- Dusenge, M.E.; Duarte, A.G.; Way, D.A. Plant carbon metabolism and climate change: Elevated CO and temperature impacts on photosynthesis, photorespiration and respiration. New Phytol. 2019, 221, 32–49. [Google Scholar] [CrossRef]
- Zhang, G.G.; Kang, Y.M.; Han, G.D.; Sakurai, K. Effect of climate change over the past half century on the distribution, extent and NPP of ecosystems of Inner Mongolia. Glob. Change Biol. 2011, 17, 377–389. [Google Scholar] [CrossRef]
- Felton, A.J.; Knapp, A.K.; Smith, M.D. Precipitation-productivity relationships and the duration of precipitation anomalies: An underappreciated dimension of climate change. Glob. Change Biol. 2021, 27, 1127–1140. [Google Scholar] [CrossRef]
- Isbell, F.I.; Polley, H.W.; Wilsey, B.J. Biodiversity, productivity and the temporal stability of productivity: Patterns and processes. Ecol. Lett. 2009, 12, 443–451. [Google Scholar] [CrossRef] [PubMed]
- Seddon, A.W.R.; Macias-Fauria, M.; Long, P.R.; Benz, D.; Willis, K.J. Sensitivity of global terrestrial ecosystems to climate variability. Nature 2016, 531, 229–232. [Google Scholar] [CrossRef] [PubMed]
- Smith, M.D.; Wilcox, K.R.; Power, S.A.; Tissue, D.T.; Knapp, A.K. Assessing community and ecosystem sensitivity to climate change—Toward a more comparative approach. J. Veg. Sci. 2017, 28, 235–237. [Google Scholar] [CrossRef]
- Zhang, Y.L.; Song, C.H.; Zhang, K.R.; Cheng, X.L.; Band, L.E.; Zhang, Q.F. Effects of land use/land cover and climate changes on terrestrial net primary productivity in the Yangtze River Basin, China, from 2001 to 2010. J. Geophys. Res. Biogeosci. 2014, 119, 1092–1109. [Google Scholar] [CrossRef]
- Hisano, M.; Searle, E.B.; Chen, H.Y.H. Biodiversity as a solution to mitigate climate change impacts on the functioning of forest ecosystems. Biol. Rev. 2018, 93, 439–456. [Google Scholar] [CrossRef] [PubMed]
- Kardol, P.; Cregger, M.A.; Campany, C.E.; Classen, A.T. Soil ecosystem functioning under climate change: Plant species and community effects. Ecology 2010, 91, 767–781. [Google Scholar] [CrossRef] [PubMed]
- White, H.J.; Caplat, P.; Emmerson, M.C.; Yearsley, J.M. Predicting future stability of ecosystem functioning under climate change. Agr. Ecosyst. Environ. 2021, 320, 107600. [Google Scholar] [CrossRef]
- Lamarque, P.; Tappeiner, U.; Turner, C.; Steinbacher, M.; Bardgett, R.D.; Szukics, U.; Schermer, M.; Lavorel, S. Stakeholder perceptions of grassland ecosystem services in relation to knowledge on soil fertility and biodiversity. Reg. Environ. Change 2011, 11, 791–804. [Google Scholar] [CrossRef]
- Song, M.H.; Zong, N.; Jiang, J.; Shi, P.L.; Zhang, X.Z.; Gao, J.Q.; Zhou, H.K.; Li, Y.K.; Loreau, M. Nutrient-induced shifts of dominant species reduce ecosystem stability via increases in species synchrony and population variability. Sci. Total Environ. 2019, 692, 441–449. [Google Scholar] [CrossRef]
- Zhang, H.J.; Dong, L.Z.; Yao, X.D.; Wang, W. Soil fertility shifts the relative importance of saprotrophic and mycorrhizal fungi for maintaining ecosystem stability. Glob. Change Biol. 2022, 29, 1206–1216. [Google Scholar] [CrossRef]
- Huston, M.A. Precipitation, soils, NPP, and biodiversity: Resurrection of Albrecht’s curve. Ecol. Monogr. 2012, 82, 277–296. [Google Scholar] [CrossRef]
- García-Palacios, P.; Gross, N.; Gaitán, J.; Maestre, F.T. Climate mediates the biodiversity-ecosystem stability relationship globally. Proc. Natl. Acad. Sci. USA 2018, 115, 8400–8405. [Google Scholar] [CrossRef]
- Tilman, D.; Reich, P.B.; Knops, J.M.H. Biodiversity and ecosystem stability in a decade-long grassland experiment. Nature 2006, 441, 629–632. [Google Scholar] [CrossRef] [PubMed]
- Ulyett, J.; Sakrabani, R.; Kibblewhite, M.; Hann, M. Impact of biochar addition on water retention, nitrification and carbon dioxide evolution from two sandy loam soils. Eur. J. Soil Sci. 2014, 65, 96–104. [Google Scholar] [CrossRef]
- Das, S.K.; Ghosh, G.K.; Avasthe, R. Valorizing biomass to engineered biochar and its impact on soil, plant, water, and microbial dynamics: A review. Biomass Convers. Biorefinery 2022, 12, 4183–4199. [Google Scholar] [CrossRef]
- Luo, G.; Xue, C.; Jiang, Q.; Xiao, Y.; Zhang, F.; Guo, S.; Shen, Q.; Ling, N. Soil carbon, nitrogen, and phosphorus cycling microbial populations and their resistance to global change depend on soil C: N: P stoichiometry. mSystems 2020, 5, 10–1128. [Google Scholar] [CrossRef]
- Aliche, E.B.; Oortwijn, M.; Theeuwen, T.P.J.M.; Bachem, C.W.B.; Visser, R.G.F.; van der Linden, C.G. Drought response in field grown potatoes and the interactions between canopy growth and yield. Agr. Water Manag. 2018, 206, 20–30. [Google Scholar] [CrossRef]
- Liu, L.Y.; Gong, F.X.; Chen, X.Z.; Su, Y.X.; Fan, L.; Wu, S.B.; Yang, X.Q.; Zhang, J.; Yuan, W.P.; Ciais, P.; et al. Bidirectional drought-related canopy dynamics across pantropical forests: A satellite-based statistical analysis. Remote. Sens. Ecol. Conserv. 2022, 8, 72–91. [Google Scholar] [CrossRef]
- Matías, L.; Hidalgo-Galvez, M.D.; Cambrollé, J.; Domínguez, M.T.; Pérez-Ramos, I.M. How will forecasted warming and drought affect soil respiration in savannah ecosystems? The role of tree canopy and grazing legacy. Agr. Forest Meteorol. 2021, 304, 108425. [Google Scholar] [CrossRef]
- Wales, S.B.; Kreider, M.R.; Atkins, J.; Hulshof, C.M.; Fahey, R.T.; Nave, L.E.; Nadelhoffer, K.J.; Gough, C.M. Stand age, disturbance history and the temporal stability of forest production. Forest Ecol. Manag. 2020, 460, 117865. [Google Scholar] [CrossRef]
- Yang, G.J.; Hautier, Y.; Zhang, Z.J.; Lu, X.T.; Han, X.G. Decoupled responses of above- and below-ground stability of productivity to nitrogen addition at the local and larger spatial scale. Glob. Change Biol. 2022, 28, 2711–2720. [Google Scholar] [CrossRef] [PubMed]
- Loreau, M.; de Mazancourt, C. Biodiversity and ecosystem stability: A synthesis of underlying mechanisms. Ecol. Lett. 2013, 16, 106–115. [Google Scholar] [CrossRef] [PubMed]
- Pennekamp, F.; Pontarp, M.; Tabi, A.; Altermatt, F.; Alther, R.; Choffat, Y.; Fronhofer, E.A.; Ganesanandamoorthy, P.; Garnier, A.; Griffiths, J.I.; et al. Biodiversity increases and decreases ecosystem stability. Nature 2018, 563, 109–112. [Google Scholar] [CrossRef] [PubMed]
- Smith, M.D. The ecological role of climate extremes: Current understanding and future prospects. J. Ecol. 2011, 99, 651–655. [Google Scholar] [CrossRef]
- McCann, K. The diversity-stability debate. Nature 2000, 405, 228–233. [Google Scholar] [CrossRef]
- Bauhus, J.; Forrester, D.I.; Gardiner, B.; Jactel, H.; Vallejo, R.; Pretzsch, H. Ecological Stability of Mixed-Species Forests. In Mixed-Species Forests; Pretzsch, H., Forrester, D., Bauhus, J., Eds.; Springer: Berlin/Heidelberg, Germany, 2017; pp. 169–196. [Google Scholar] [CrossRef]
- Xie, Z.; Tang, Z.; Liu, Q.; Xu, W. Carbon Balance Study of Chinese Scrub Ecosystems; Science Press: Beijing, China, 2019. [Google Scholar]
- Hu, X.; Song, C.; Fan, X.; Xiao, Y.; Xu, W.; Ou, Y.Z. Major regulating services and valuation of scrub ecosystems in China. J. Beijing For. Univ. (Soc. Sci. Ed.) 2021, 20, 58–64. [Google Scholar] [CrossRef]
- Sáez-Plaza, P.; Navas, M.J.; Wybraniec, S.; Michalowski, T.; Asuero, A.G. An Overview of the Kjeldahl Method of Nitrogen Determination. Part II. Sample Preparation, Working Scale, Instrumental Finish, and Quality Control. Crit. Rev. Anal. Chem. 2013, 43, 224–272. [Google Scholar] [CrossRef]
- Viswanathan, P.; Sriram, V.; Yogeeswaran, G. Sensitive spectrophotometric assay for 3-hydroxy-substituted flavonoids, based on their binding with molybdenum, antimony, or bismuth. J. Agric. Food Chem. 2000, 48, 2802–2806. [Google Scholar] [CrossRef]
- Fick, S.E.; Hijmans, R.J. WorldClim 2: New 1-km spatial resolution climate surfaces for global land areas. Int. J. Climatol. 2017, 37, 4302–4315. [Google Scholar] [CrossRef]
- Running, S.W.; Zhao, M. User’s Guide Daily GPP and Annual NPP (MOD17A2H/A3H) and Year-End Gap-Filled (MOD17A2HGF/A3HGF) Products NASA Earth Observing System MODIS Land Algorithm (For Collection 6), Version 4.2. 2019. Available online: https://landweb.modaps.eosdis.nasa.gov/data/userguide/MOD17UsersGuideV4.2June2019.pdf (accessed on 1 March 2023).
- Zhang, X.S. Vegetation Map of the People’s Republic of China (1:1,000,000); Geology Press: Beijing, China, 2007. [Google Scholar]
- Fay, M.P.; Tiwari, R.C.; Feuer, E.J.; Zou, Z. Estimating average annual percent change for disease rates without assuming constant change. Biometrics 2006, 62, 847–854. [Google Scholar] [CrossRef]
- Chu, C.J.; Bartlett, M.; Wang, Y.S.; He, F.L.; Weiner, J.; Chave, J.; Sack, L. Does climate directly influence NPP globally? Glob. Chang. Biol. 2016, 22, 12–24. [Google Scholar] [CrossRef] [PubMed]
- Li, X.; Zhang, Y.; Guo, F.; Gao, X.; Wang, Y.Q. Predicting the effect of land use and climate change on stream macroinvertebrates based on the linkage between structural equation modeling and bayesian network. Ecol. Indic. 2018, 85, 820–831. [Google Scholar] [CrossRef]
- Liu, C.Y.; Dong, X.F.; Liu, Y.Y. Changes of NPP and their relationship to climate factors based on the transformation of different scales in Gansu, China. Catena 2015, 125, 190–199. [Google Scholar] [CrossRef]
- Schuur, E.A.G. Productivity and global climate revisited: The sensitivity of tropical forest growth to precipitation. Ecology 2003, 84, 1165–1170. [Google Scholar] [CrossRef]
- Kline, R.B. Principles and Practice of Structural Equation Modeling; Guilford Publications: New York, NY, USA, 2023. [Google Scholar]
- Newman, M.C. Regression-Analysis of Log-Transformed Data—Statistical Bias and Its Correction. Environ. Toxicol. Chem. 1993, 12, 1129–1133. [Google Scholar] [CrossRef]
- Hussey, D.M.; Eagan, P.D. Using structural equation modeling to test environmental performance in small and medium-sized manufacturers: Can SEM help SMEs? J. Clean. Prod. 2007, 15, 303–312. [Google Scholar] [CrossRef]
- Henseler, J.; Sarstedt, M. Goodness-of-fit indices for partial least squares path modeling. Comput. Stat. 2013, 28, 565–580. [Google Scholar] [CrossRef]
- Bentler, P.M. Comparative Fit Indexes in Structural Models. Psychol. Bull. 1990, 107, 238–246. [Google Scholar] [CrossRef]
- Rigdon, E.E. The Equal Correlation Baseline Model for Comparative Fit Assessment in Structural Equation Modeling. Struct. Equ. Model. 1998, 5, 63–77. [Google Scholar] [CrossRef]
- DiStefano, C.; Liu, J.; Jiang, N.; Shi, D.X. Examination of the Weighted Root Mean Square Residual: Evidence for Trustworthiness? Struct. Equ. Model. 2018, 25, 453–466. [Google Scholar] [CrossRef]
- Li, L.B.; Bentler, P.M. Quantified Choice of Root-Mean-Square Errors of Approximation for Evaluation and Power Analysis of Small Differences Between Structural Equation Models. Psychol. Methods 2011, 16, 116–126. [Google Scholar] [CrossRef] [PubMed]
- Nevitt, J.; Hancock, G.R. Improving the root mean square error of approximation for nonnormal conditions in structural equation modeling. J. Exp. Educ. 2000, 68, 251–268. [Google Scholar] [CrossRef]
- Pendergrass, A.G.; Knutti, R.; Lehner, F.; Deser, C.; Sanderson, B.M. Precipitation variability increases in a warmer climate. Sci. Rep. 2017, 7, 17966. [Google Scholar] [CrossRef] [PubMed]
- Schlenger, A.J.; Libralato, S.; Ballance, L.T. Temporal Variability of Primary Production Explains Marine Ecosystem Structure and Function. Ecosystems 2019, 22, 331–345. [Google Scholar] [CrossRef]
- Mohamed, M.A.A.; Babiker, I.S.; Chen, Z.M.; Ikeda, K.; Ohta, K.; Kato, K. The role of climate variability in the inter-annual variation of terrestrial net primary production (NPP). Sci. Total Environ. 2004, 332, 123–137. [Google Scholar] [CrossRef] [PubMed]
- Tian, J.X.; Zhang, Z.X.; Ahmed, Z.; Zhang, L.Y.; Su, B.D.; Tao, H.; Jiang, T. Projections of precipitation over China based on CMIP6 models. Stoch. Environ. Res. Risk Assess. 2021, 35, 831–848. [Google Scholar] [CrossRef]
- Wen, X.; Fang, G.H.; Qi, H.S.; Zhou, L.; Gao, Y.Q. Changes of temperature and precipitation extremes in China: Past and future. Theor. Appl. Climatol. 2016, 126, 369–383. [Google Scholar] [CrossRef]
- Tong, X.W.; Brandt, M.; Yue, Y.M.; Horion, S.; Wang, K.L.; De Keersmaecker, W.; Tian, F.; Schurgers, G.; Xiao, X.M.; Luo, Y.Q.; et al. Increased vegetation growth and carbon stock in China karst via ecological engineering. Nat. Sustain. 2018, 1, 44–50. [Google Scholar] [CrossRef]
- Zhu, L.Y.; Shi, M.M.; Fan, D.Q.; Tu, K.; Sun, W.B. Analysis of Changes in Vegetation Carbon Storage and Net Primary Productivity as Influenced by Land-Cover Change in Inner Mongolia, China. Sustainability 2023, 15, 4735. [Google Scholar] [CrossRef]
- Ji, Y.H.; Zhou, G.S.; Luo, T.X.; Dan, Y.; Zhou, L.; Lv, X.M. Variation of net primary productivity and its drivers in China’s forests during 2000–2018. For. Ecosyst. 2020, 7, 15. [Google Scholar] [CrossRef]
- Xie, B.N.; Jia, X.X.; Qin, Z.F.; Shen, J.; Chang, Q.R. Vegetation dynamics and climate change on the Loess Plateau, China: 1982–2011. Reg. Environ. Chang. 2016, 16, 1583–1594. [Google Scholar] [CrossRef]
- Ding, Z.; Peng, J.; Qiu, S.; Zhao, Y. Nearly Half of Global Vegetated Area Experienced Inconsistent Vegetation Growth in Terms of Greenness, Cover, and Productivity. Earths Future 2020, 8, e2020EF001618. [Google Scholar] [CrossRef]
- Wang, Y.X.; Ran, L.S.; Fang, N.F.; Shi, Z.H. Aggregate stability and associated organic carbon and nitrogen as affected by soil erosion and vegetation rehabilitation on the Loess Plateau. Catena 2018, 167, 257–265. [Google Scholar] [CrossRef]
- Zhang, G.G.; Kang, Y.M.; Han, G.D.; Mei, H.; Sakurai, K. Grassland degradation reduces the carbon sequestration capacity of the vegetation and enhances the soil carbon and nitrogen loss. Acta Agric. Scand. Sect. B Soil Plant Sci. 2011, 61, 356–364. [Google Scholar] [CrossRef]
- Bai, J.; Shi, H.; Yu, Q.; Xie, Z.Y.; Li, L.H.; Luo, G.P.; Jin, N.; Li, J. Satellite-observed vegetation stability in response to changes in climate and total water storage in Central Asia. Sci. Total Environ. 2019, 659, 862–871. [Google Scholar] [CrossRef] [PubMed]
- Wu, S.H.; Zhou, S.L.; Chen, D.X.; Wei, Z.Q.; Dai, L.; Li, X.G. Determining the contributions of urbanisation and climate change to NPP variations over the last decade in the Yangtze River Delta, China. Sci. Total Environ. 2014, 472, 397–406. [Google Scholar] [CrossRef] [PubMed]
- Murray-Tortarolo, G.; Friedlingstein, P.; Sitch, S.; Seneviratne, S.I.; Fletcher, I.; Mueller, B.; Greve, P.; Anav, A.; Liu, Y.; Ahlström, A.; et al. The dry season intensity as a key driver of NPP trends. Geophys. Res. Lett. 2016, 43, 2632–2639. [Google Scholar] [CrossRef]
- Song, L.Y.; Li, M.Y.; Xu, H.; Guo, Y.; Wang, Z.; Li, Y.C.; Wu, X.J.; Feng, L.C.; Chen, J.; Lu, X.; et al. Spatiotemporal variation and driving factors of vegetation net primary productivity in a typical karst area in China from 2000 to 2010. Ecol. Indic. 2021, 132, 108280. [Google Scholar] [CrossRef]
- Reich, P.B.; Hobbie, S.E.; Lee, T.D.; Rich, R.; Pastore, M.A.; Worm, K. Synergistic effects of four climate change drivers on terrestrial carbon cycling. Nat. Geosci. 2020, 13, 787–793. [Google Scholar] [CrossRef]
- Craine, J.M. The importance of precipitation timing for grassland productivity. Plant Ecol. 2013, 214, 1085–1089. [Google Scholar] [CrossRef]
- Gao, Z.H.; Sun, B.; Wang, H.Y.; Bai, L.N.; Wang, B.Y. Npp Variation and Its Respond To Precipitation Change in Potential Extent of Desertification in China during 2001–2010. In Proceedings of the 2013 IEEE International Geoscience and Remote Sensing Symposium, Melbourne, VIC, Australia, 21–26 July 2013; pp. 1831–1834. [Google Scholar] [CrossRef]
- Xu, X.; Sherry, R.A.; Niu, S.L.; Li, D.J.; Luo, Y.Q. Net primary productivity and rain-use efficiency as affected by warming, altered precipitation, and clipping in a mixed-grass prairie. Glob. Chang. Biol. 2013, 19, 2753–2764. [Google Scholar] [CrossRef]
- Zhang, W.X.; Furtado, K.; Wu, P.L.; Zhou, T.J.; Chadwick, R.; Marzin, C.; Rostron, J.; Sexton, D. Increasing precipitation variability on daily-to-multiyear time scales in a warmer world. Sci. Adv. 2021, 7, eabf8021. [Google Scholar] [CrossRef] [PubMed]
- Gherardi, L.A.; Sala, O.E. Effect of interannual precipitation variability on dryland productivity: A global synthesis. Glob. Change Biol. 2019, 25, 269–276. [Google Scholar] [CrossRef] [PubMed]
- Hou, E.Q.; Litvak, M.E.; Rudgers, J.A.; Jiang, L.F.; Collins, S.L.; Pockman, W.T.; Hui, D.F.; Niu, S.L.; Luo, Y.Q. Divergent responses of primary production to increasing precipitation variability in global drylands. Glob. Change Biol. 2021, 27, 5225–5237. [Google Scholar] [CrossRef] [PubMed]
- Cramer, W.; Kicklighter, D.W.; Bondeau, A.; Moore, B.; Churkina, G.; Nemry, B.; Ruimy, A.; Schloss, A.L.; The Participants of the Potsdam NpP. Model IntercomparisonComparing global models of terrestrial net primary productivity (NPP): Overview and key results. Glob. Change Biol. 1999, 5, 1–15. [Google Scholar] [CrossRef]
- Liu, J.X.; Price, D.T.; Chen, J.A. Nitrogen controls on ecosystem carbon sequestration: A model implementation and application to Saskatchewan, Canada. Ecol. Model. 2005, 186, 178–195. [Google Scholar] [CrossRef]
- Tian, H.Q.; Wang, S.Q.; Liu, J.Y.; Pan, S.F.; Chen, H.; Zhang, C.; Shi, X.Z. Patterns of soil nitrogen storage in China. Glob. Biogeochem. Cycles 2006, 20, GB1001. [Google Scholar] [CrossRef]
- Lehman, C.L.; Tilman, D. Biodiversity, stability, and productivity in competitive communities. Am. Nat. 2000, 156, 534–552. [Google Scholar] [CrossRef]
- Li, Z.Y.; Ma, T.X.; Cai, Y.M.; Fei, T.T.; Zhai, C.; Qi, W.X.; Dong, S.K.; Gao, J.X.; Wang, X.G.; Wang, S.P. Stable or unstable? Landscape diversity and ecosystem stability across scales in the forest-grassland ecotone in northern China. Landsc. Ecol. 2023, 38, 3889–3902. [Google Scholar] [CrossRef]
- Liu, H.Y.; Mi, Z.R.; Lin, L.; Wang, Y.H.; Zhang, Z.H.; Zhang, F.W.; Wang, H.; Liu, L.L.; Zhu, B.A.; Cao, G.M.; et al. Shifting plant species composition in response to climate change stabilizes grassland primary production. Proc. Natl. Acad. Sci. USA 2018, 115, 4051–4056. [Google Scholar] [CrossRef]
- Ma, W.; Liang, X.S.; Wang, Z.W.; Luo, W.T.; Yu, Q.; Han, X.G. Resistance of steppe communities to extreme drought in northeast China. Plant Soil 2022, 473, 181–194. [Google Scholar] [CrossRef]
Disclaimer/Publisher’s Note: The statements, opinions and data contained in all publications are solely those of the individual author(s) and contributor(s) and not of MDPI and/or the editor(s). MDPI and/or the editor(s) disclaim responsibility for any injury to people or property resulting from any ideas, methods, instructions or products referred to in the content. |
© 2024 by the authors. Licensee MDPI, Basel, Switzerland. This article is an open access article distributed under the terms and conditions of the Creative Commons Attribution (CC BY) license (https://creativecommons.org/licenses/by/4.0/).