Article

Changing Relationship between Specific Leaf Area and Leaf Matter Dry Content of Moso Bamboo Phyllostachys pubescens syn. edulis (Poales: Poaceae) under the Stress of Pantana phyllostachysae (Lepidoptera: Lymantriidae)

1
College of Environment and Safety Engineering, Academy of Geography and Ecological Environment, Fuzhou University, Fuzhou 350108, China
2
Key Laboratory of Spatial Data Mining & Information Sharing, Ministry of Education, The Academy of Digital China, Fuzhou University, Fuzhou 350108, China
3
Fujian Key Laboratory of Island Monitoring and Ecological Development, Fuzhou 350400, China
4
Xiamen Administration Center of Afforestation, Xiamen 361004, China
*
Author to whom correspondence should be addressed.
Forests 2024, 15(3), 540; https://doi.org/10.3390/f15030540
Submission received: 28 January 2024 / Revised: 12 March 2024 / Accepted: 13 March 2024 / Published: 15 March 2024
(This article belongs to the Section Forest Inventory, Modeling and Remote Sensing)

Abstract

:
The objective of this study was to deeply understand the adaptation mechanism of the functional traits of Moso bamboo Phyllostachys pubescens syn. edulis (Poales: Poaceae) leaves to the environment under different Pantana phyllostachysae Chao damage levels, analyzing the changes in the relationship between specific leaf area (SLA) and leaf dry matter content (LDMC). We combined different machine learning models (decision tree, RF, XGBoost, and CatBoost regression models), and used different canopy heights and different levels of infestation, to analyze the changes in the relationship between the two under different levels of infestation based on the results of the best estimation model. The results showed the following: (1) The SLA of Ph. pubescens showed a decreasing trend with the increase om insect pest degree, and LDMC showed an inverse trend. (2) The SLA of bamboo leaves was negatively correlated with the LDMC under different insect pest degrees; the correlation of the data under the healthy class was higher than that of other insect pest levels, and at the same time better than that of the full sample, which laterally confirmed the effect of insect pest stress on the functional traits of Ph. pubescens leaves. (3) When modeling under different infestation levels, the CatBoost model was used for heavy damage and the RF model was used for the rest of the cases; the decision tree regression model was used when modeling different canopy heights. The findings contribute certain insights into the nuanced responses and adaptive mechanisms of Ph. pubescens forests to environmental fluctuations. Moreover, these results furnish a robust scientific foundation, essential for ensuring the enduring sustainability of Ph. pubescens forest ecosystems.

1. Introduction

Bamboo forests play a crucial role in global forest ecosystems, exhibiting substantial carbon sequestration capabilities and widespread distribution on the Earth. Du et al. [1] estimated the total distribution area of bamboo forests worldwide to be 3053.84 × 104 ha by using multi-source remote sensing data. “2021 China’s Forest and Grassland Ecology Comprehensive Monitoring and Evaluation Report” indicated that the area of bamboo forest in China in 2021 was 7,562,700 ha, accounting for 3.31% of the total forest area. Its carbon storage significantly contributes to achieving the “double carbon” goal. The carbon storage of bamboo forests contributes a lot to the realization of the goal of “double carbon”, which is conducive to the ecological security and socioeconomic development of society. Among them, Moso bamboo, Phyllostachys pubescens syn. edulis (Carrière) J. Houz. (Poales: Poaceae) is an important bamboo plant that is widely distributed in tropical and subtropical regions of Asia, Africa, and the Americas, and has attracted much attention globally for its rapid growth and diverse uses [2]. However, Pantana phyllostachysae Chao (Lepidoptera: Lymantriidae), as a leaf-feeding pest, feeds on the leaves of Ph. pubescens, leading to symptoms such as deficiencies, yellowing, and lesions on the leaves [3,4]. This not only affects the growth status of bamboo forests but also reduces the carbon storage capacity and biomass of bamboo forests, which has a serious impact on the yield and quality of bamboo products [5]. Every year, P. phyllostachysae causes huge ecological and economic losses to bamboo forests. Therefore, it is of great significance to study the leaf characteristics of Ph. pubescens forests and their intrinsic relationship patterns under the stress of the P. phyllostachysae, which can help to understand the leaf functional attributes and the embodiment of the intrinsic mechanism and adaptive capacity of bamboo forests.
The vitality of vegetation is often gauged by the physiological condition of leaves [6], and leaf functional traits serve as key indicators of a plant’s adaptive response to its environment at the leaf level. Over recent years, physiological ecologists have increasingly focused on unraveling plant adaptation strategies through the examination of leaf functional traits [7,8]. These traits, intricately linked to plant growth responses and resource utilization efficiency, encompass specific leaf area (SLA), leaf dry matter content (LDMC), leaf thickness, leaf area, leaf longevity, leaf nitrogen content (N), phosphorus content (P), chlorophyll content (Chl), and so on [9]. A comprehensive analysis of these indicators provides valuable insights into the adaptation mechanisms and resource utilization strategies of plants in diverse environments. While current studies on plant traits predominantly concentrate on a large-scale level [10], there is a noticeable dearth of attention towards changes in leaf functional traits during the developmental stages of individual plants—an essential aspect for the in-depth exploration of individual plant growth and development [11]. Hence, there is a pressing need for intensified systematic research on the dynamics of leaf functional traits at the individual plant level to foster a more comprehensive understanding of the mechanisms driving plant adaptation, growth, and development. Leaf functional traits serve as reflections of the physiological and morphological adaptations undertaken by plants in response to environmental changes [12,13,14]. Within this array of traits, SLA and LDMC emerge as pivotal indicators, encapsulating a plant’s ability to harness resources and adapt to its environment for survival [15,16,17,18]. SLA, denoted as the ratio of leaf unifacial area to leaf dry weight, provides insights into a plant’s adaptive condition in diverse environmental conditions [15,19]. It serves as a fundamental leaf trait within the global leaf economic phenotype spectrum, offering a key component in plant carbon harvesting strategies and indicating the efficiency of plants in utilizing light, temperature, and water resources [20,21,22]. In contrast, LDMC is intricately linked to the nutritional status of plants and the establishment of carbon pools [16,23]. The study of leaf functional traits is indispensable for comprehending and predicting plant responses to environmental changes amid the global shift.
The examination of trait variations in plants under stress situations is an important area in plant ecology and environmental biology [24]. Stressors encompass biological stresses (e.g., pathogen infection), physical stresses (e.g., heat, drought, and salinity), and chemical stresses (e.g., soil contamination) [25,26,27], which may induce a range of physiological, morphological, and molecular trait changes in plants. Currently, scholars’ studies on plants under various natural environmental conditions and different elemental stresses primarily focus on physical and chemical stresses. For instance, in a study of 12 species of broadleaf evergreen eucalypts in Victoria, Liz et al. [28] observed that SLA and leaf area decreased with increasing tree height and age, while leaf thickness increased. Similarly, when examining North American redwoods in temperate forests of northern California, Koch et al. [29] found that leaf area decreased with increasing tree height, and specific leaf mass increased. Canham et al. [22] noted that LDMC serves as a predictor of resource acquisition stability, reflecting a plant’s nutrient conservation capability. Wilson et al. [30] demonstrated that leaf water content influences LDMC, with dry matter content being less affected by leaf thickness. Other studies have indicated an elevation-related increase in LDMC [31], and research by Hu et al. [32] suggested that the LDMC of evergreen tree species tends to rise with elevation. Cui et al. [33] illustrated that a higher LDMC benefits plants in nutrient storage, aiding adaptation to arid and infertile environments, thus thriving in challenging conditions. Conversely, analyses of the correlation between SLA and LDMC traits under biotic stresses, particularly concurrent pest stresses, have yielded fewer discernible patterns. Understanding plant survival strategies and predicting ecosystem stability are integral to comprehending ecosystem responses to environmental shifts, facilitating the design and implementation of biodiversity conservation measures. There is a lot of research related to predicting and monitoring plants through modeling. For instance, a decision tree regression model was applied to build the extraction model of plants [34], for wetland information extraction [35], etc.; the RF regression model was applied for the identification of bamboo forest patches [36], and to build the model for estimating the chlorophyll of winter wheat canopy [37]; the XGBoost regression model was applied to build the prediction model of the five metabolites in mustard leaves [38], to build the inversion model of the concentration of phytoplankton pigments [39], to identify bamboo species [40], and for the detection of P. phyllostachysae, etc. [41]; and the Catboost regression model was used in the study of the estimation of cedar monocotyledonous storage, etc. [42].
Based on this, SLA and LDMC combine to reflect a plant ability to utilize its resources and embody key leaf functional traits in adapting to the environment. The external morphology and internal biochemical composition of leaves undergo changes in response to pest stress. In order to comprehensively understand the interactions between the SLA and LDMC of Ph. pubescens leaves under different infestation levels, the degree of Ph. pubescens leaves subject to predation by P. phyllostachysae was measured using leaf functional trait indexes. In order to make a judgment on the quantification of a plant’s function and its adaptive ability to environmental changes in large-scale monitoring and research work, we use the visual interpretation method with the help of the canopy and leaves of Ph. pubescens forests, and at the same time, provide certain strategic needs for the control of P. phyllostachysae of the bamboo. Moreover, these findings provide certain ideas for the implementation of preventive and control measures by relevant departments, as well as offer a scientific foundation for the effective management of greening projects and ensuring the sustainable development of Ph. pubescens forest ecosystems.

2. Materials and Methods
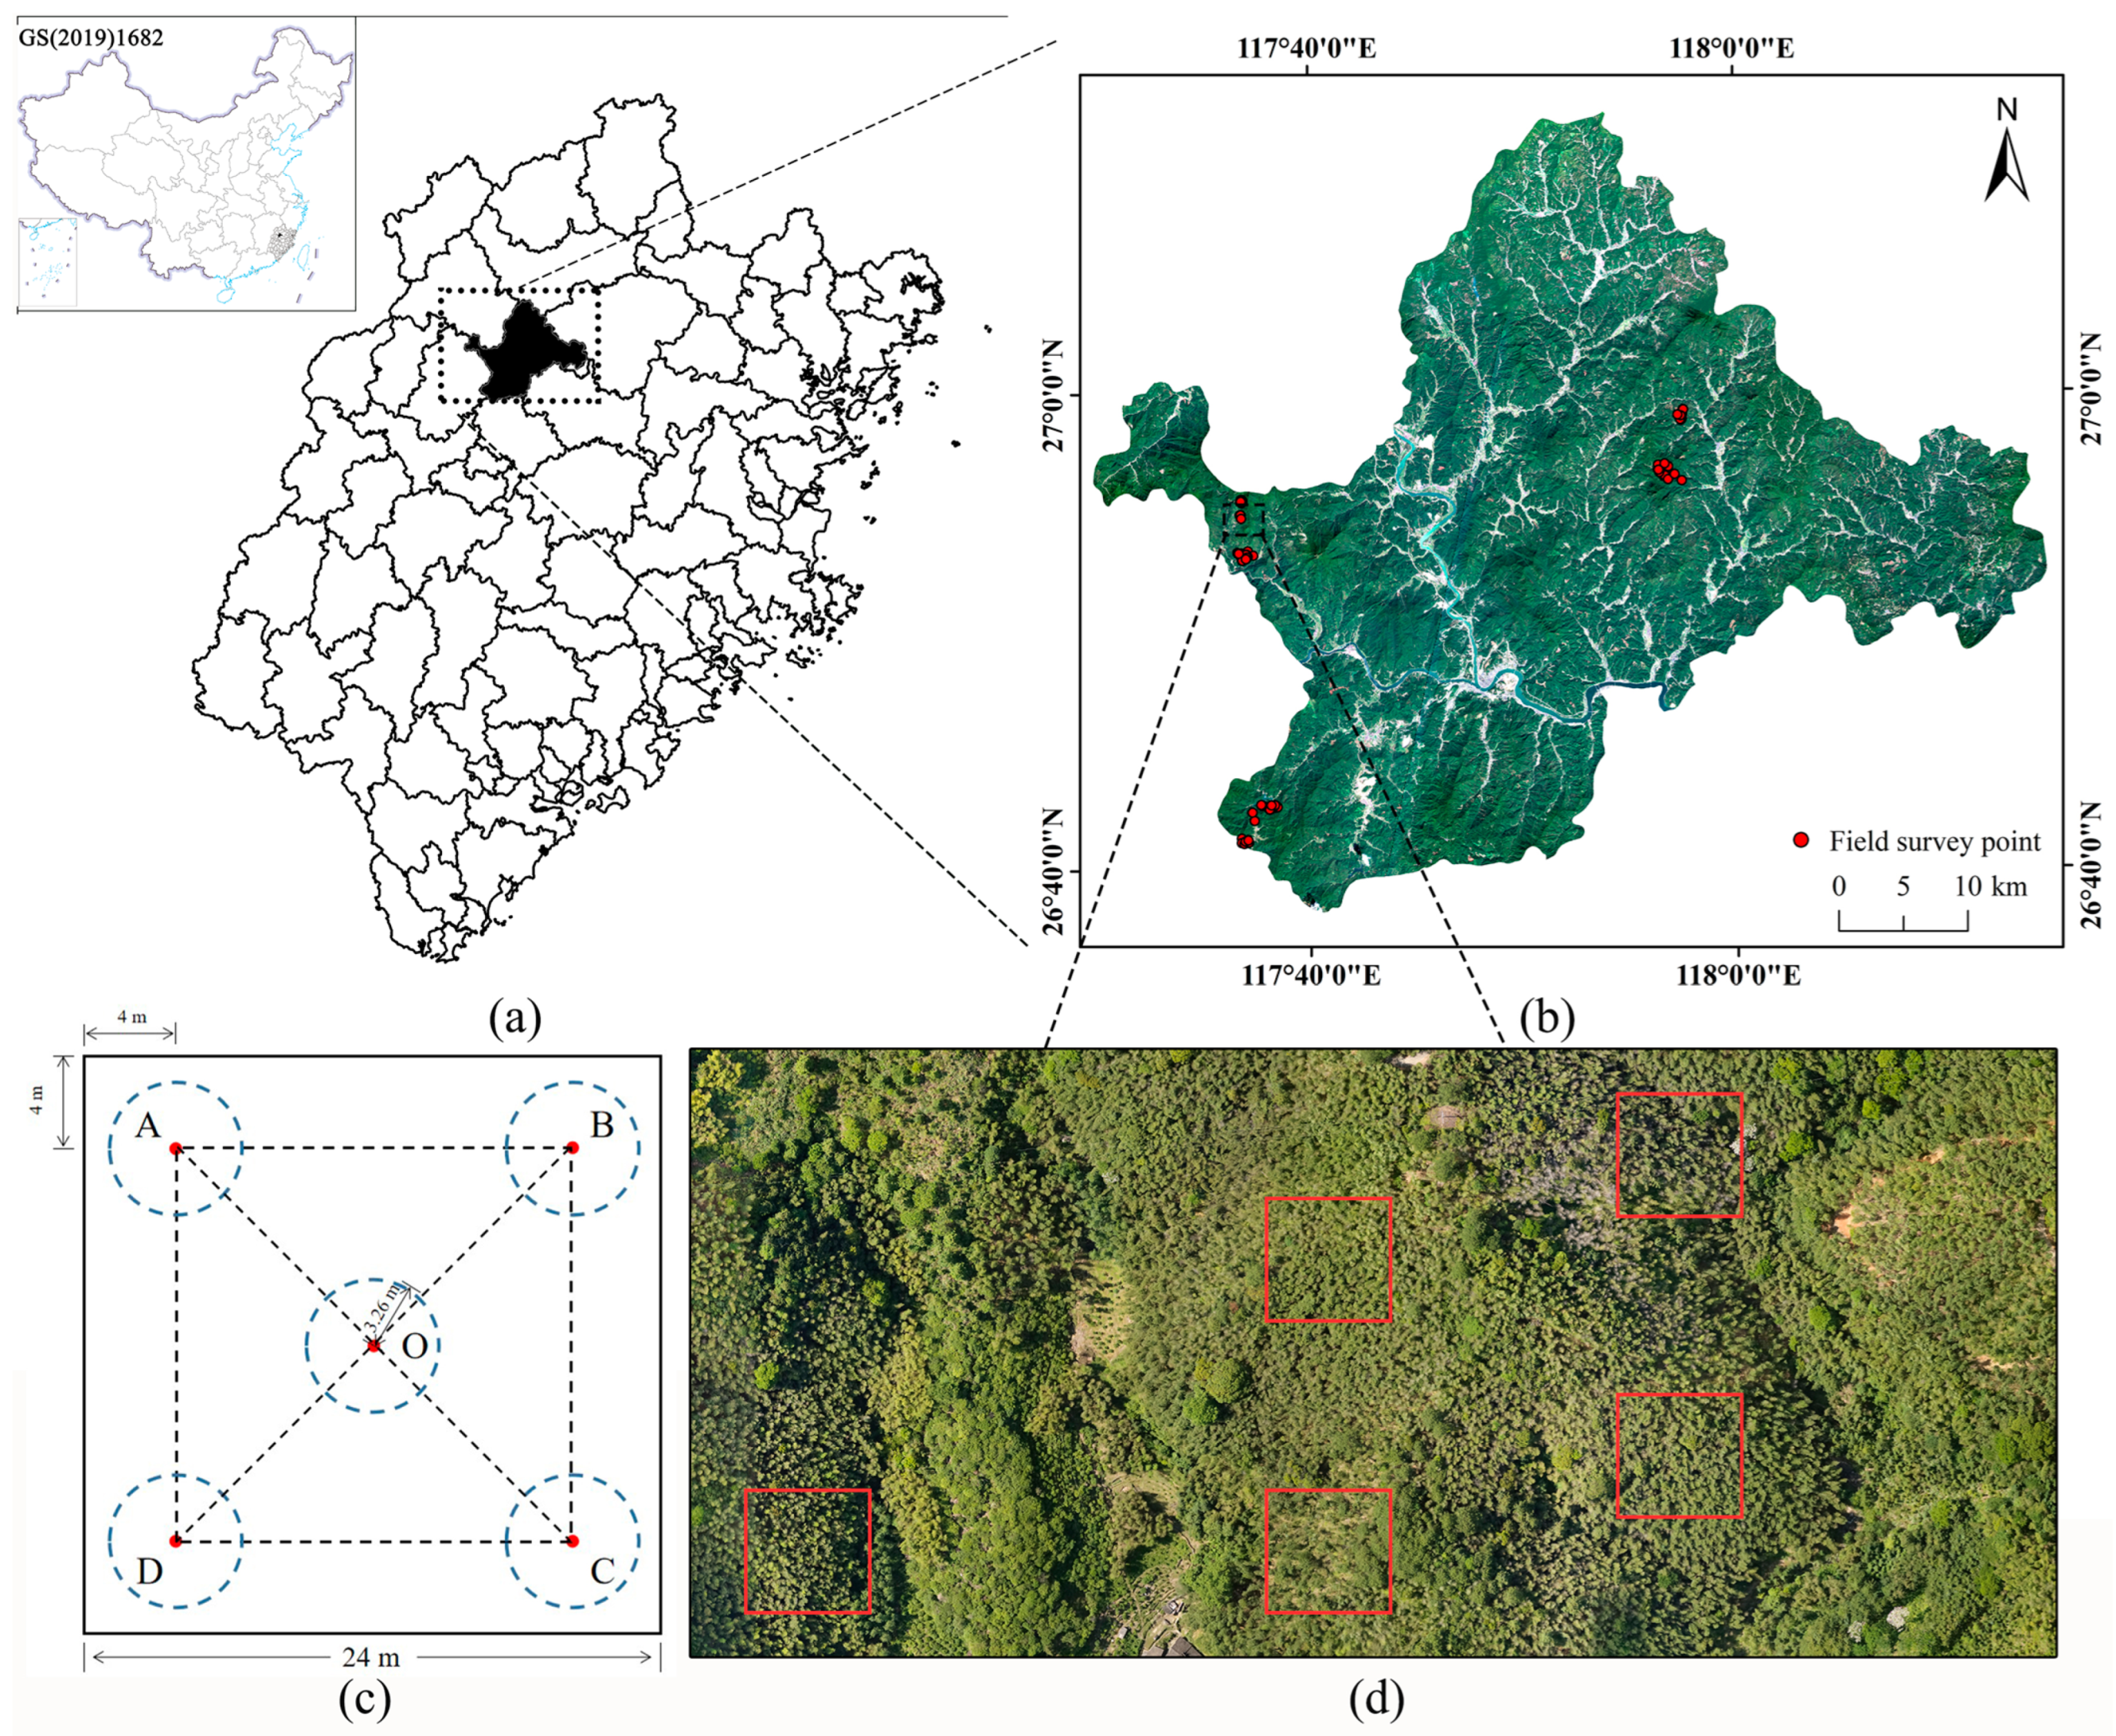
2.1. Field Research

The study area is situated in Shunchang County, Nanping City, Fujian Province, spanning geographic coordinates from 117°30′ to 118°14′ E and 26°39′ to 27°12′ N (Figure 1). Covering a width of 74 km from east to west and a length of 61 km from north to south, the county occupies an area of 1985 km2. The region experiences a subtropical monsoon climate, influenced by continental climate factors. Abundant in water resources, Shunchang County falls within a water-rich zone, boasting a total water volume of 33.429 × 10⁸ m3. The predominant vegetation includes subtropical oceanic monsoon evergreen broad-leaved forests and pine and fir forests. Forest resources in the county undergo significant artificial intervention, with artificial forests and secondary forests being predominant. As a crucial forested region in the south, the county maintains an impressive forest coverage rate of 80.5%. The forested land area spans 167,000 ha, including 44,000 ha dedicated to bamboo forests. The overall forest volume is estimated at 1.531 × 10⁷ m3, with the standing volume of Ph. pubescens reaching 110 million sticks. The county has been awarded several honors, including being recognized as the “First Batch Bamboo Town”, “National Timber Strategic Reserve Base County”, and “Demonstration County for Precise Improvement of Forest Quality”. It has also successfully completed the first national timber carbon trading at the Fujian Strait Equity Exchange, with a transaction volume of 537.63 tons per million yuan for timber carbon and 555.56 tons per million yuan for bamboo carbon. Pantana phyllostachysae infests an area close to 1000 ha in Shunchang County annually. In Fujian Province, P. phyllostachysae undergoes three generations in a year, with the first generation causing the most damage between late June and late August.
Three field surveys were conducted in mid-May, mid-July, and mid-to-late October 2021, with 70 sample plots selected, totaling 112 monitoring sampling points. Survey plots, measuring 24 m × 24 m, were centered on the monitoring points, resulting in a collection of 835 leaves. The field survey involved precise positioning to record routine survey content, focusing on surveying, sampling, and experimentally determining the structural parameters of the stands, insect pest conditions, spectra, and leaf physicochemical parameters in the survey plots. The diagonal five-point method was used to determine the leaf area index (LAI), standard error of the leaf area index (SEL), mean leaf inclination angle (MTA), and other indicators. A sample circle with a radius of 3.26 m measured the degree of standing bamboo. In each sample circle, one sample plant was selected, and the height of the bamboo, height under the branches (measured with an altimeter), and crown height were obtained. The mean value of five points was considered the value of the corresponding stand structure parameter in the investigation plot. Simultaneously, on-site photographs were taken to determine the grade of Ph. pubescens with different hazard levels and recorded [43,44]. The basis for determining the infestation level of P. phyllostachysae on Ph. pubescens and the photographs of the canopy and leaves of Ph. pubescens under different infestation levels are from a former study [44] (Figure 2).

2.2. Species Research

Phyllostachys pubescens is a common bamboo species in the family of Bambusoideae. It accounts for about 70% of the total area of bamboo forests in China and has become the most important ecological and economic bamboo species due to its fast growth and high utilization rate [45]. Phyllostachys pubescens has various ecological functions, including water source protection, soil and water conservation, and the maintenance of the carbon–oxygen balance [46]. It is mainly distributed in the eastern regions of China, such as Zhejiang, Fujian, and Guangdong, as well as central regions including Jiangxi, Anhui, Hunan, Hubei, and western regions like Guangxi, Guizhou, Chongqing, Sichuan, and Yunnan, among others. Among them, Fujian, Zhejiang, Jiangxi, and Hunan provinces have the highest distribution of Ph. pubescens. The lifespan of Ph. pubescens varies depending on growth conditions and management practices, but generally, it can live up to 20 years or even longer. Under favorable growing conditions, some Ph. pubescens forests can survive for several decades. Phyllostachys pubescens reproduces naturally or through artificial propagation methods.

2.3. Measurement of Leaf Functional Traits

The leaf functional trait characterization parameters SLA and LDMC are two parameters commonly used in plant physiology and ecology to describe the structure and function of plant leaves. The methods used in this study to measure these two metrics were as follows:
(1)
A sample of 835 leaves was selected from the sample plot, and each leaf was numbered.
(2)
Leaf area (LA) was combined with the YMJ-C leaf area meter to obtain an image of each leaf, supplemented by image processing software to carry out measurements [47].
(3)
Leaf fresh weight (m0) was measured on the spot during field collection. The measured leaves were then placed in a self-sealing bag, sealed, and stored in a liquid nitrogen tank to maintain freshness.
(4)
For leaf-saturated fresh weight (m1), after bringing the liquid nitrogen tank indoors, we retrieved the leaf samples, and placed them in distilled water for storage for approximately 24 h. Afterward, we removed them, quickly absorbed water from the surface of the leaves with filter paper, and weighed them on an electronic balance accurate to one part per million to obtain the saturated fresh weight (m1).
(5)
After obtaining the saturated fresh weight of a leaf, we dried it in an oven (heating it at 105 °C for 30 min and then continuing to dry it at 80 °C until a constant weight was reached). We weighed the dried leaf to obtain the dried weight (m2).
(6)
Specific leaf area (SLA) is defined as the ratio of leaf area to leaf dry weight, and the results are usually expressed in cm2/g and calculated using Equation (1):
SLA = LA ( cm 2 ) m 2 ( g )
(7)
Leaf dry matter content (LDMC), defined as the ratio of leaf dry weight to leaf saturated fresh weight, was calculated using Equation (2):
LDMC = m 2 ( g ) m 1 ( g )

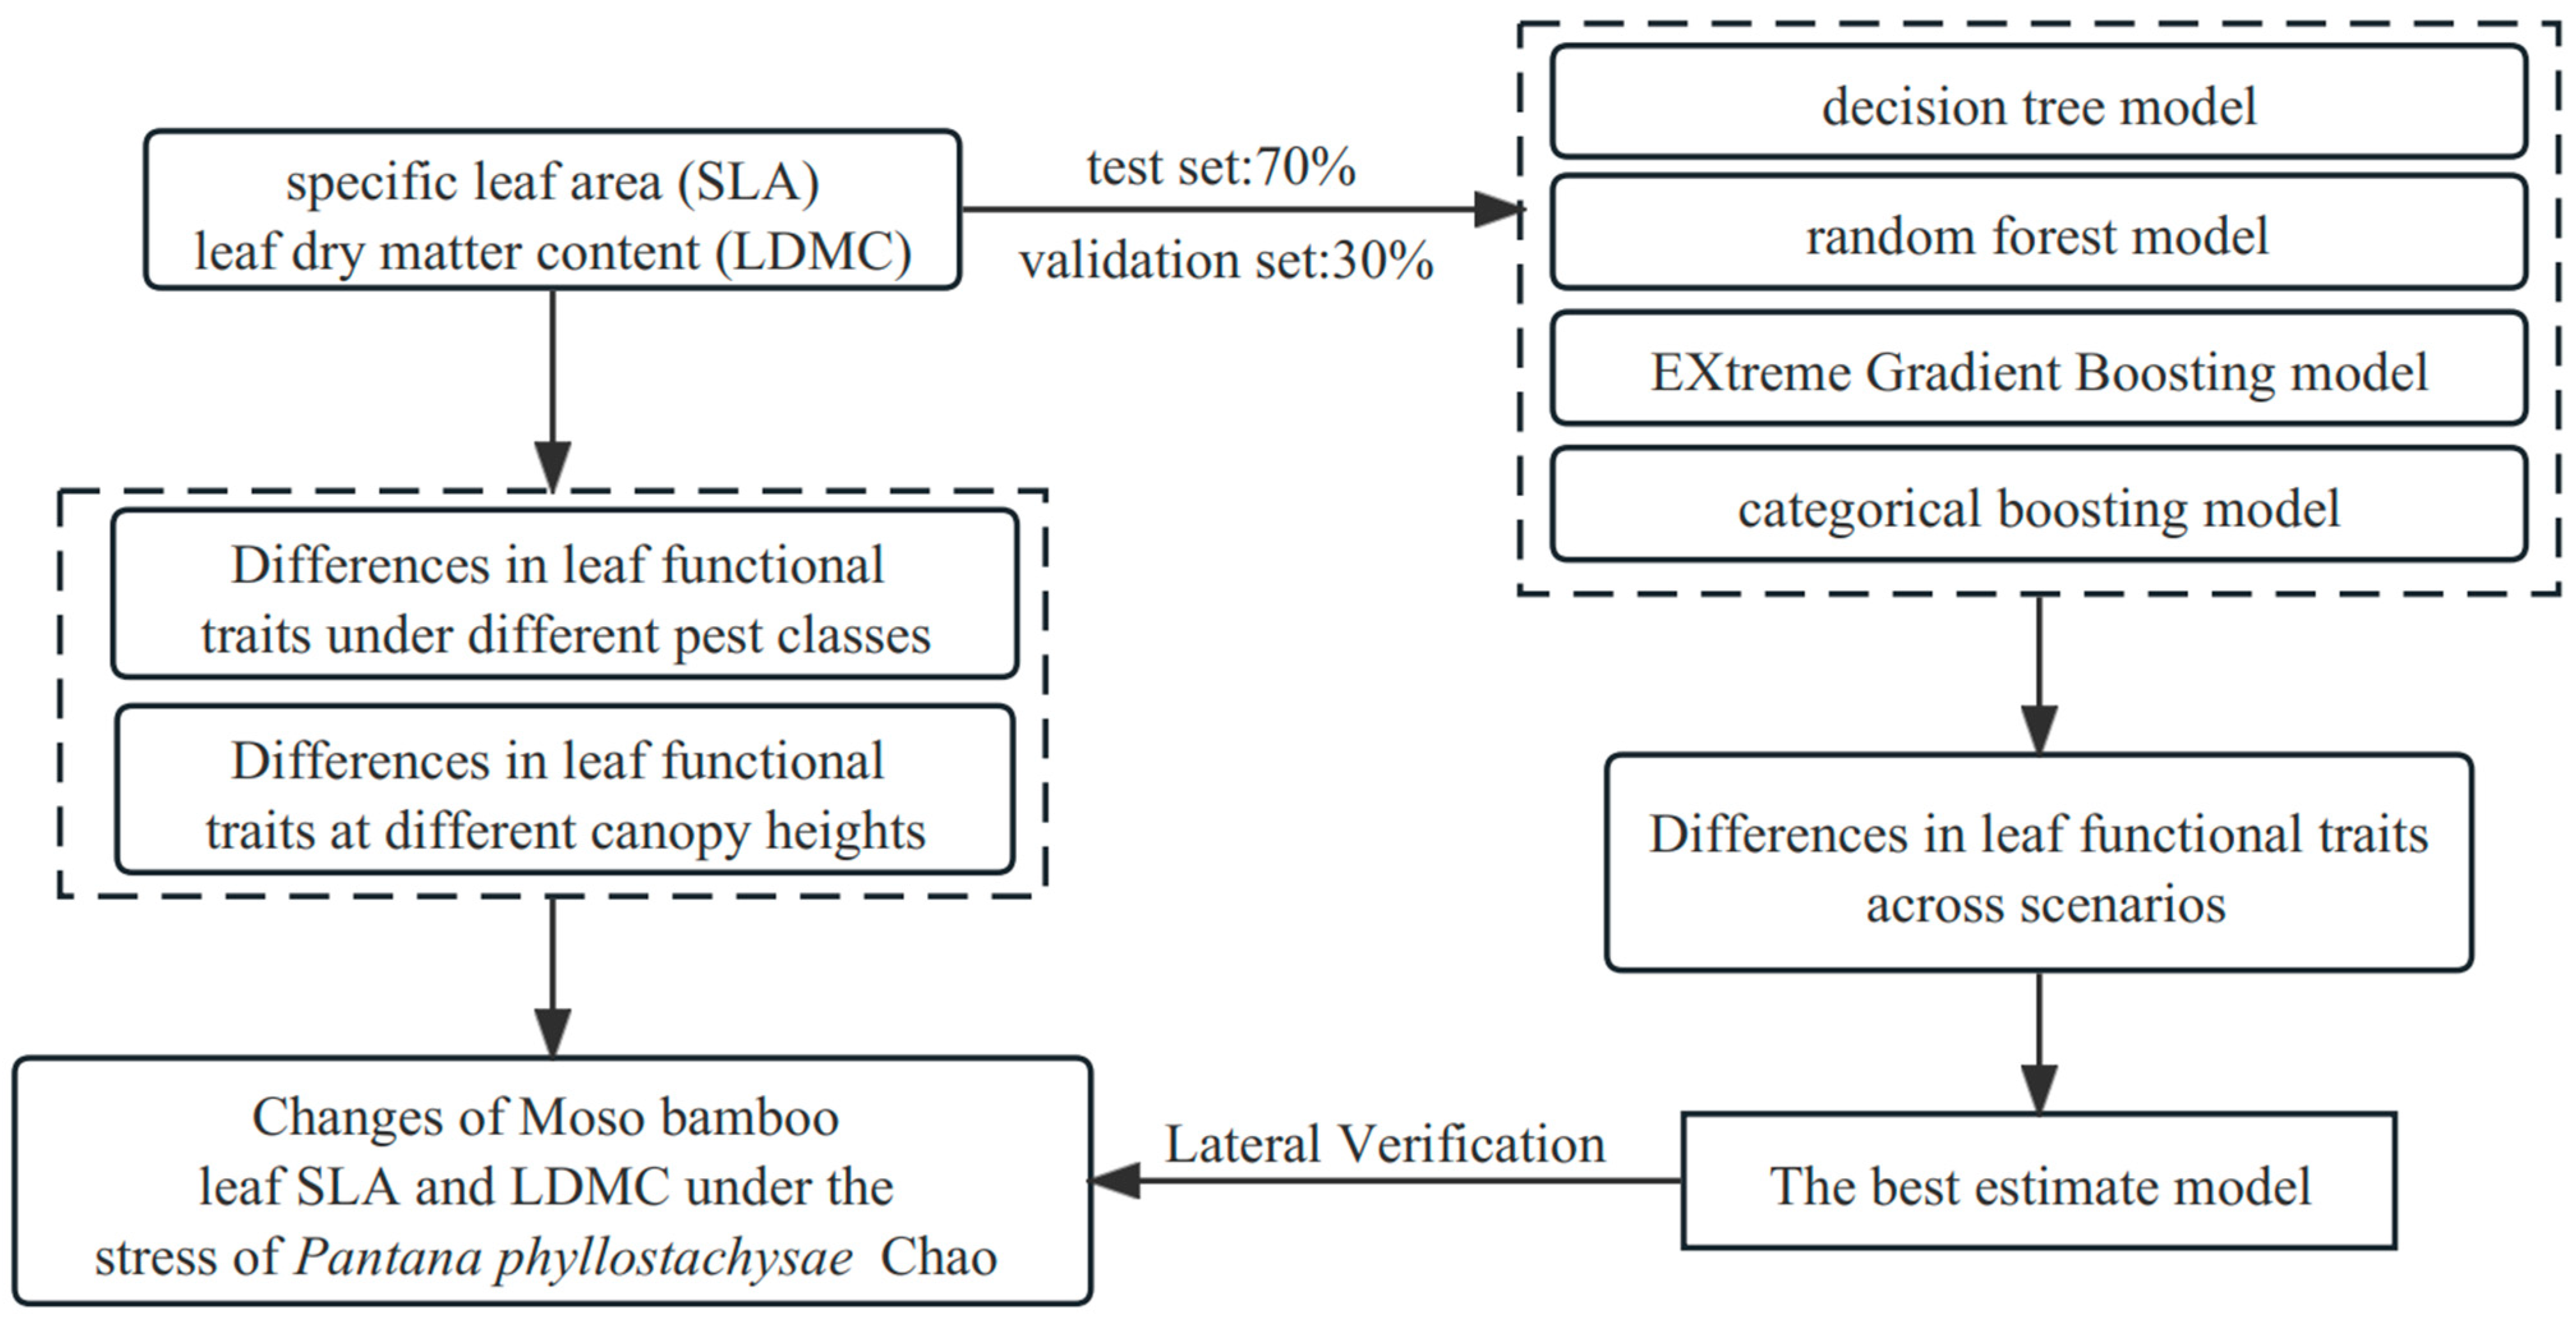
2.4. Relationship Modeling and Analysis

When measuring the above indicators, standardization in the sampling and measurement process is ensured in practice to obtain reliable and comparable data. Additionally, appropriate statistical methods were employed to analyze the results, assessing the accuracy and reliability of the measurements. The establishment of a machine learning regression model can predict the stress trend and assess the pest level of P. phyllostachysae, which is of great significance for pest identification and prevention, the optimization of pest control decisions, the improvement of pest management efficiency, and reducing the risk of pest damage. In this paper, four models—namely decision tree regression, random forest regression, eXtreme gradient boosting regression, and “Categorical + Boosting” regression—were used to model and analyze the data of leaf samples under different pest-included damage levels. Decision tree models can flexibly capture and model nonlinear relationships and naturally handle mixed types of features—both continuous and discrete. They can also divide data into regions and make predictions on data within each region [48]. RF was proposed by Leo Breiman in 2001. Initially designed to solve classification problems, it was later extended to regression problems. It is a powerful machine learning model that performs well and is relatively easy to tune for handling complex datasets and high-dimensional data [49]. XGBoost is a gradient boosting tree (GBT) algorithm. First proposed by Tianqi Chen in 2014 to address some of the issues with the GBT algorithm in terms of speed and performance, XGBoost has been widely used in practical problems [50]. The CatBoost regression model, first proposed in 2017 by a team of data scientists at the Russian search engine company Yandex, is a powerful gradient-boosting framework for classification and regression problems. It excels at dealing with datasets with a large number of class features [51]. The patterns of SLA and LDMC under different pest levels and different canopy heights were analyzed using the four models mentioned above. Then, the correlation between SLA and LDMC under different pest levels and different canopy heights was explored with SLA as the independent variable and LDMC as the dependent variable. The specific experimental steps are as follows (Figure 3):

3. Results and Analysis

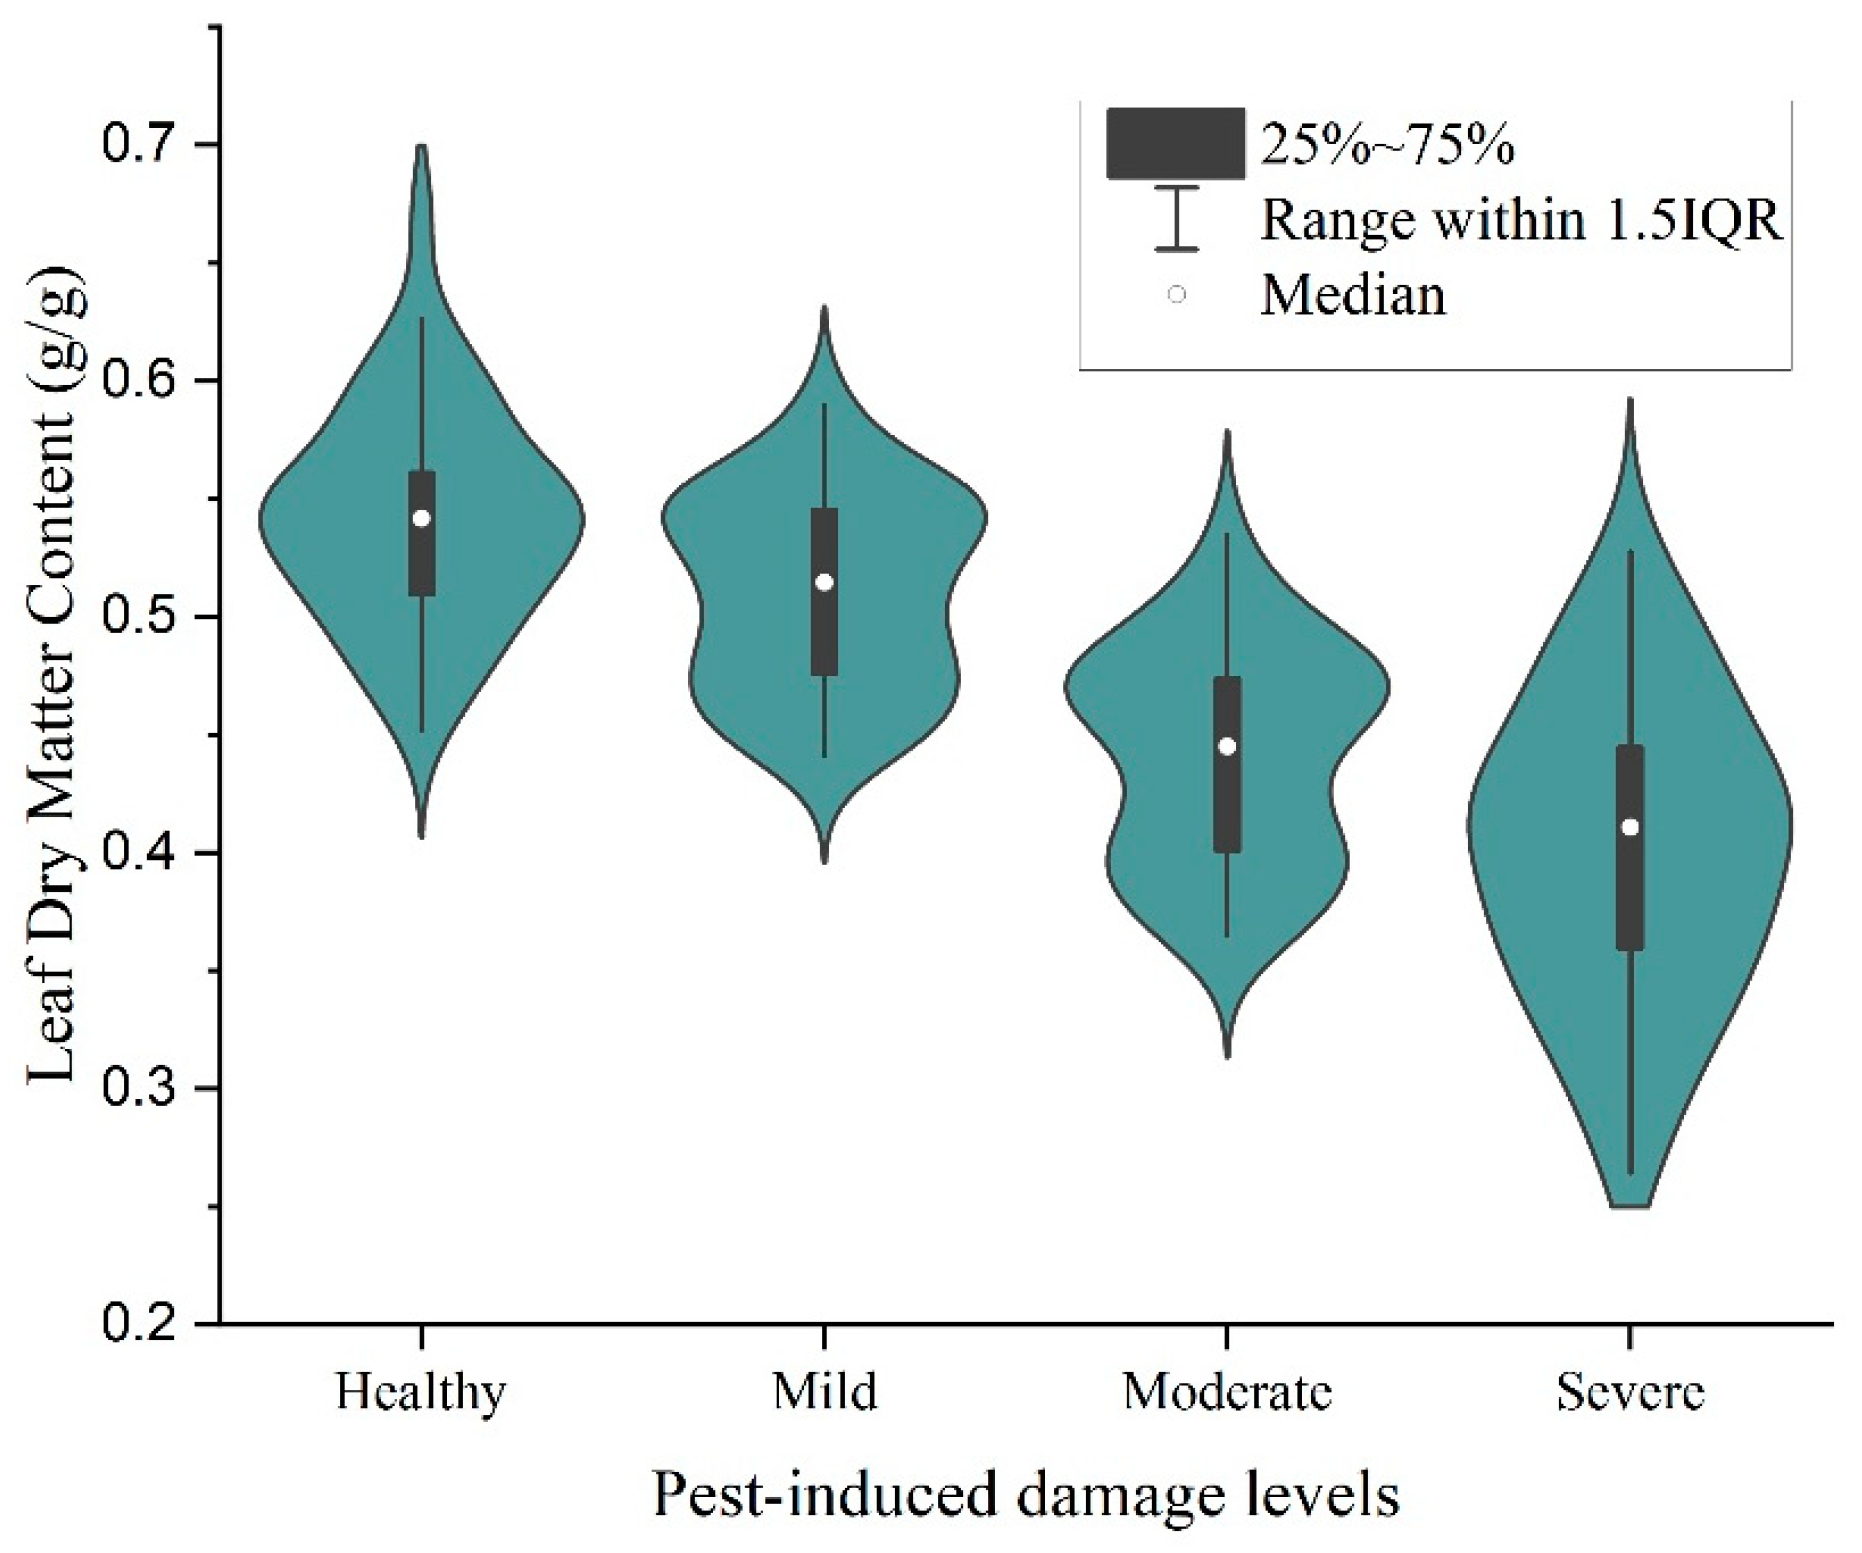
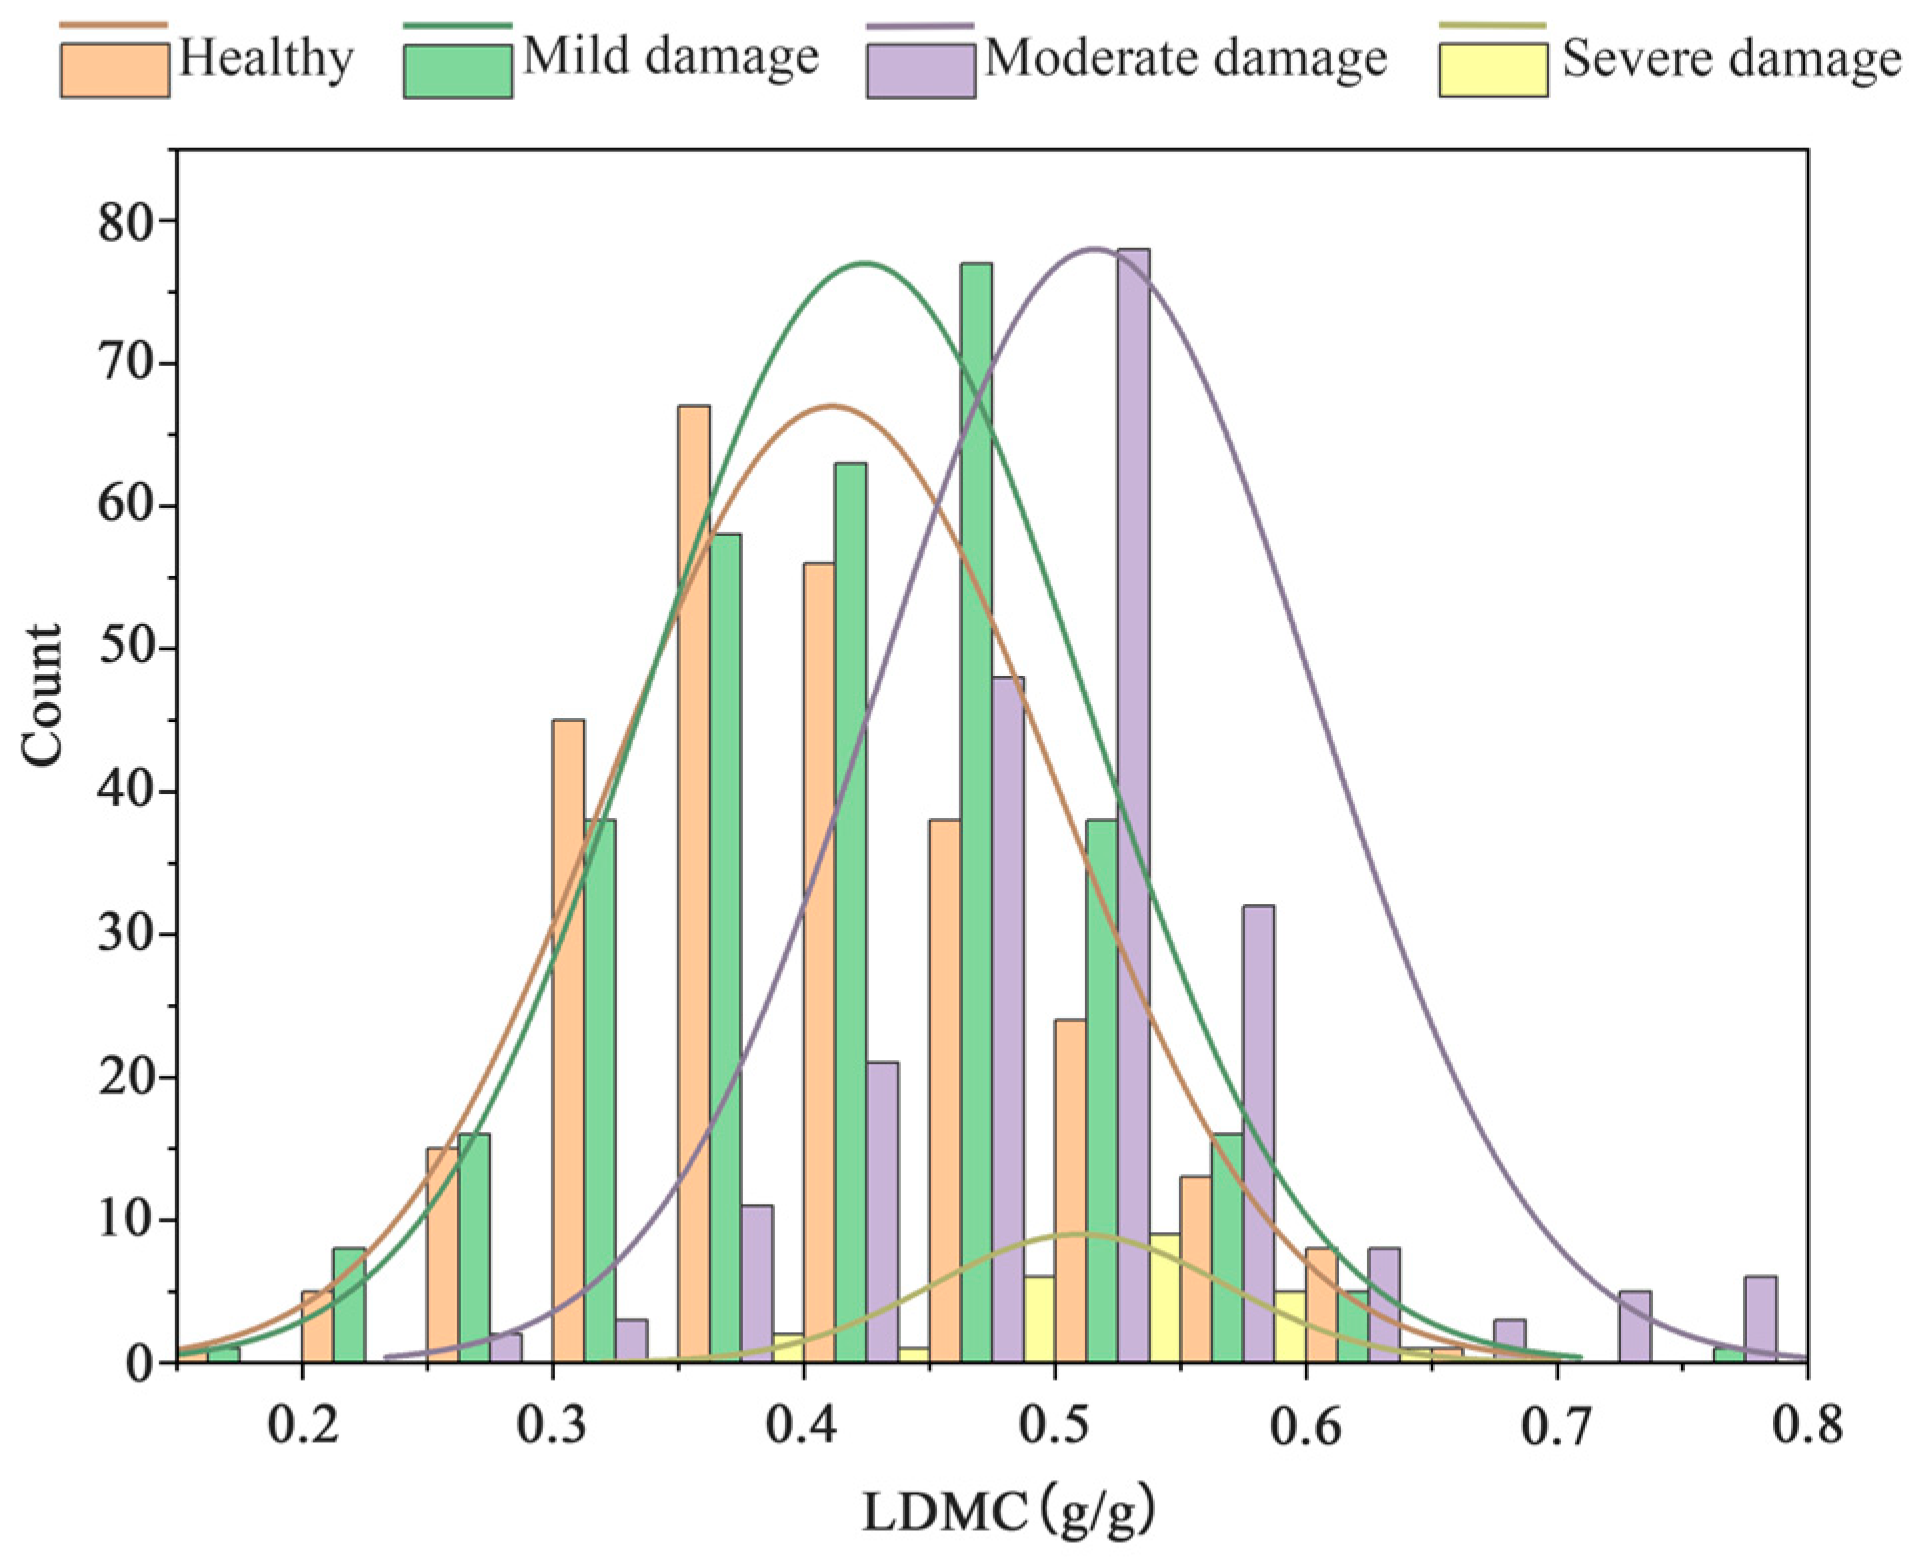
3.1. Descriptive Statistical Analysis of Data under Different Pest Levels of Stress

The range and variability of SLA and LDMC of Ph. pubescens leaves were analyzed for the full sample and leaf samples under different pest levels. The mean value of leaf SLA for the full sample was 218.041 cm2/g, exhibiting a decreasing trend with an increase in infestation levels. The mean value of leaf LDMC ranged from 0.412 g/g to 0.512 g/g. The data were also examined for normal distribution using the K-S test, and the results indicated that all the data for SLA and LDMC conformed to a normal distribution (Table 1). An analysis of variance revealed that both the SLA and LDMC of Ph. pubescens leaves under heavy infestation levels were significantly different from those under other infestation levels.
To elucidate the dynamics of leaf SLA across varying pest levels under the stress of P. phyllostachysae, an in-depth analysis of SLA alterations under different infestation levels was conducted (Figure 4 and Figure 5). Notably, the data concentration varied, with a wider distribution and the presence of outliers observed across different pest levels. A discernible skew towards smaller values was evident. The heavy infestation level exhibited the most significant SLA variation. The impact of P. phyllostachysae on the SLA of Ph. pubescens leaves was evident. Under non-pest-stressed conditions, the SLA ranged from 126.72 to 389.69 cm2/g, with a mean value of (249.94 ± 56.02) cm2/g. In mild infestation, the SLA ranged from 92.37 to 381.73 cm2/g, with a mean value of (212.00 ± 25.42) cm2/g. For moderate infestation, the SLA range was 126.56 to 300.68 cm2/g, with a mean value of (193.38 ± 22.60) cm2/g, and under severe infestation, it ranged from 114.15 to 190.87 cm2/g, with a mean value of (163.39 ± 18.87) cm2/g. The SLA of Ph. pubescens leaves showed a gradual decreasing trend with the increase in the infestation level of P. phyllostachysae and was negatively correlated with the infestation level. The maximum, minimum, and mean values of the SLA of Ph. pubescens leaves showed a decreasing trend with the increase in pest levels, as shown by the basic characteristic values. Among them, the SLA of Ph. pubescens leaves under healthy conditions was the largest (388.5 cm2/g), while the SLA under heavy damage was the smallest (114.2 cm2/g).
To comprehensively understand the dynamics of leaf LDMC across varying pest level sizes amidst the stress imposed by P. phyllostachysae, an in-depth analysis of LDMC variations under different infestation levels was undertaken (Figure 6). Notably, the data concentration varied, showcasing a wider distribution and the presence of outliers across distinct pest levels. A discernible skew towards smaller values was evident. The heavy infestation level exhibited the most significant LDMC variation. Among them, the distribution range of leaf LDMC for healthy Ph. pubescens under no insect pest stress was 0.20–0.64 g/g, with an average value of (0.424 ± 0.043) g/g. In mild infestation, the range was 0.24 to 0.63 g/g, with a mean value of (0.451 ± 0.044) g/g, and for moderate infestation, it was 0.38 to 0.62 g/g, with a mean value of (0.478 ± 0.063) g/g. Under severe infestation, the LDMC range was 0.37 to 0.61 g/g, with a mean value of (0.552 ± 0.043) g/g. The LDMC of Ph. pubescens leaves (Figure 7) exhibited a consistently decreasing trend with the increase in P. phyllostachysae infestation levels, correlating negatively with the infestation level. Fundamental eigenvalues showcased a declining trend in the maximum, minimum, and mean values of LDMC for Ph. pubescens leaves as the infestation level of P. phyllostachysae increased. Specifically, LDMC was largest under healthy conditions (0.671 g/g) and smallest under heavy infestation (0.526 g/g). Notably, in the full sample data, there was no discernible pattern indicating a significant change in simple leaf area size concerning different infestation levels. This situation suggested instances where healthy leaves were smaller than infested leaves, introducing a chance value scenario for LDMC.

3.2. Analysis of the Relationship between SLA and LDMC of Ph. pubescens Leaves under Different Insect Pest Levels of Stress

The leaf SLA and LDMC of Ph. pubescens exhibited a consistent linear negative correlation trend across various infestation levels (Figure 8). Data analysis revealed a diminishing correlation trend with increasing infestation levels, although this correlation was not evident under heavy damage. To provide a more detailed depiction of the relationship between SLA and LDMC, Pearson’s correlation analysis was conducted on the entire dataset of Ph. pubescens leaves (Table 2), and the results illustrated a negative correlation between SLA and LDMC in Ph. pubescens. The pattern of change of LDMC with SLA under different infestation levels was expressed by the relationship equations, Equations (3)–(5), for the healthy, mild, and moderate states (p < 0.001), where R2 was 0.514, 0.447, and 0.408, respectively.
y = 0.0012 x + 0.6808
y = 0.0009 x + 0.6401
y = 0.0009 x + 0.6890
where the independent variable x represents the SLA and the dependent variable y represents LDMC.
When the infestation level was severe, SLA and LDMC did not correlate. This lack of correlation was attributed to the extensive damage suffered by Ph. pubescens leaves under severe infestation, where most leaves were nibbled to stumps, resulting in a substantial disparity between the original attributes of the leaf blade and the attributes of healthy leaves. In the same sample site, leaves in a healthy state exhibited larger areas compared to those affected by pests. Notably, the higher the infestation level, the more pronounced the defoliation, coupled with increased leaf density and leaf saturation fresh weight. While a general decreasing trend in LDMC with increasing SLA was observed, the range of values varied among pest levels. The correlation between SLA and LDMC under different pest levels was non-linear, indicating that the impact of insect pests on the physiological properties of plant leaves is not a straightforward linear association. Instead, this suggests the presence of complex ecological mechanisms (Table 3).

3.3. Analysis of the Relationship between SLA and LDMC of Ph. pubescens Leaves at Different Canopy Heights

To further demonstrate the effects of insect pests on leaves, the choice was made to verify if a linear relationship exists between SLA and LDMC at different canopy heights. This could help determine the general effects of insect pests on plant leaf traits, not just under specific pest levels. In the context of the vertical pattern (Figure 9 and Figure 10), the leaf SLA of the upper leaves of Ph. pubescens tended to be smaller than that of the lower leaves. A comprehensive analysis of the changes in SLA values with canopy height in Ph. pubescens forests under the stress of P. phyllostachysae revealed that the SLAs of the leaves under different pest levels (R2 = 0.6295, p < 0.001) exhibited a significant decreasing tendency with increasing canopy height. Particularly, the decrease in SLA was more pronounced in healthy leaves, indicating a larger slope and, consequently, a larger SLA with a greater variation relative to insect-infested leaves. The changes in the LDMC of Ph. pubescens leaves with canopy height showed an increase and then a decrease in the middle and lower layers with the increase in canopy height. However, in the upper leaves, LDMC showed a decreasing trend with the increase in canopy height. The changes in LDMC with canopy height in Ph. pubescens leaves under different pest levels of stress were as follows: in the middle and lower layers, LDMC increased with canopy height, while in the middle and upper layers, LDMC showed a decreasing trend with the increase in height. The changes in SLA with canopy height were mainly affected by light. In the depressed forest stand, solar radiation along the vertical gradient of the canopy followed an obvious vertical change rule. Solar radiation energy available to the leaves in the upper layer of the canopy increased with the increase in canopy height. The solar radiation energy available to the leaves is significantly higher than that of the lower part. Therefore, the upper canopy leaves usually adapt to the stronger light environment by increasing leaf thickness and density, thus showing a lower SLA. The results revealed that the SLA of the upper and middle parts of the canopy in Ph. pubescens forests is significantly higher than the average height of the lower and middle canopy under it. Because of the absence of the shade phenomenon in the depressional forest stand, both the middle and upper parts of the canopy experience similar light conditions. The variation in LDMC with canopy height reflects the plant’s adaptation to the light environment from another perspective and also reflects the plant’s utilization of water resources. Leaves located at the upper and top of the canopy are under the threat of severe water loss in an environment with high radiant energy. Therefore, the plant leaves prevent further water loss by increasing cuticle thickness and closing stomata.
From the full sample of Ph. pubescens leaves and different canopy heights, Ph. pubescens leaf SLA and LDMC at different canopy heights showed a significant negative correlation and linear relationship (p < 0.001). These relationships can be represented by linear equations, Equations (6)–(9), demonstrating the changing patterns of leaf LDMC with SLA in the full sample, the upper, the middle, and the lower layers of the Ph. pubescens forests in the study area, respectively.
y = 0.0110 x + 0.6893
y = 0.0011 x + 0.6972
y = 0.0001 x + 0.6808
y = 0.0011 x + 0.7001
where the independent x represents SLA and the dependent y represents LDMC.
Correspondingly, R2 values were 0.5302, 0.4227, 0.5630, and 0.5163, respectively. With the increase of leaf SLA, the LDMC generally showed a decreasing trend, but the range of values was inconsistent across canopy heights. Leaf SLA values at different canopy heights ranged from 100 cm2/g to 600 cm2/g, with upper leaf SLA values not exceeding 450 cm2/g. Leaf LDMC values at different canopy heights all ranged from 0.2 to 0.8. To further illustrate the correlation analysis between SLA and LDMC, binary linear analysis was performed on all Ph. pubescens leaves SLA and LDMC. The results showed that the adjusted R2 was 0.539, 0.513, 0.561, and 0.515 for the lower, upper, middle, and lower leaves of the full sample, respectively. These results indicated a significant correlation analysis between leaf SLA and LDMC of Ph. pubescens (Figure 11).

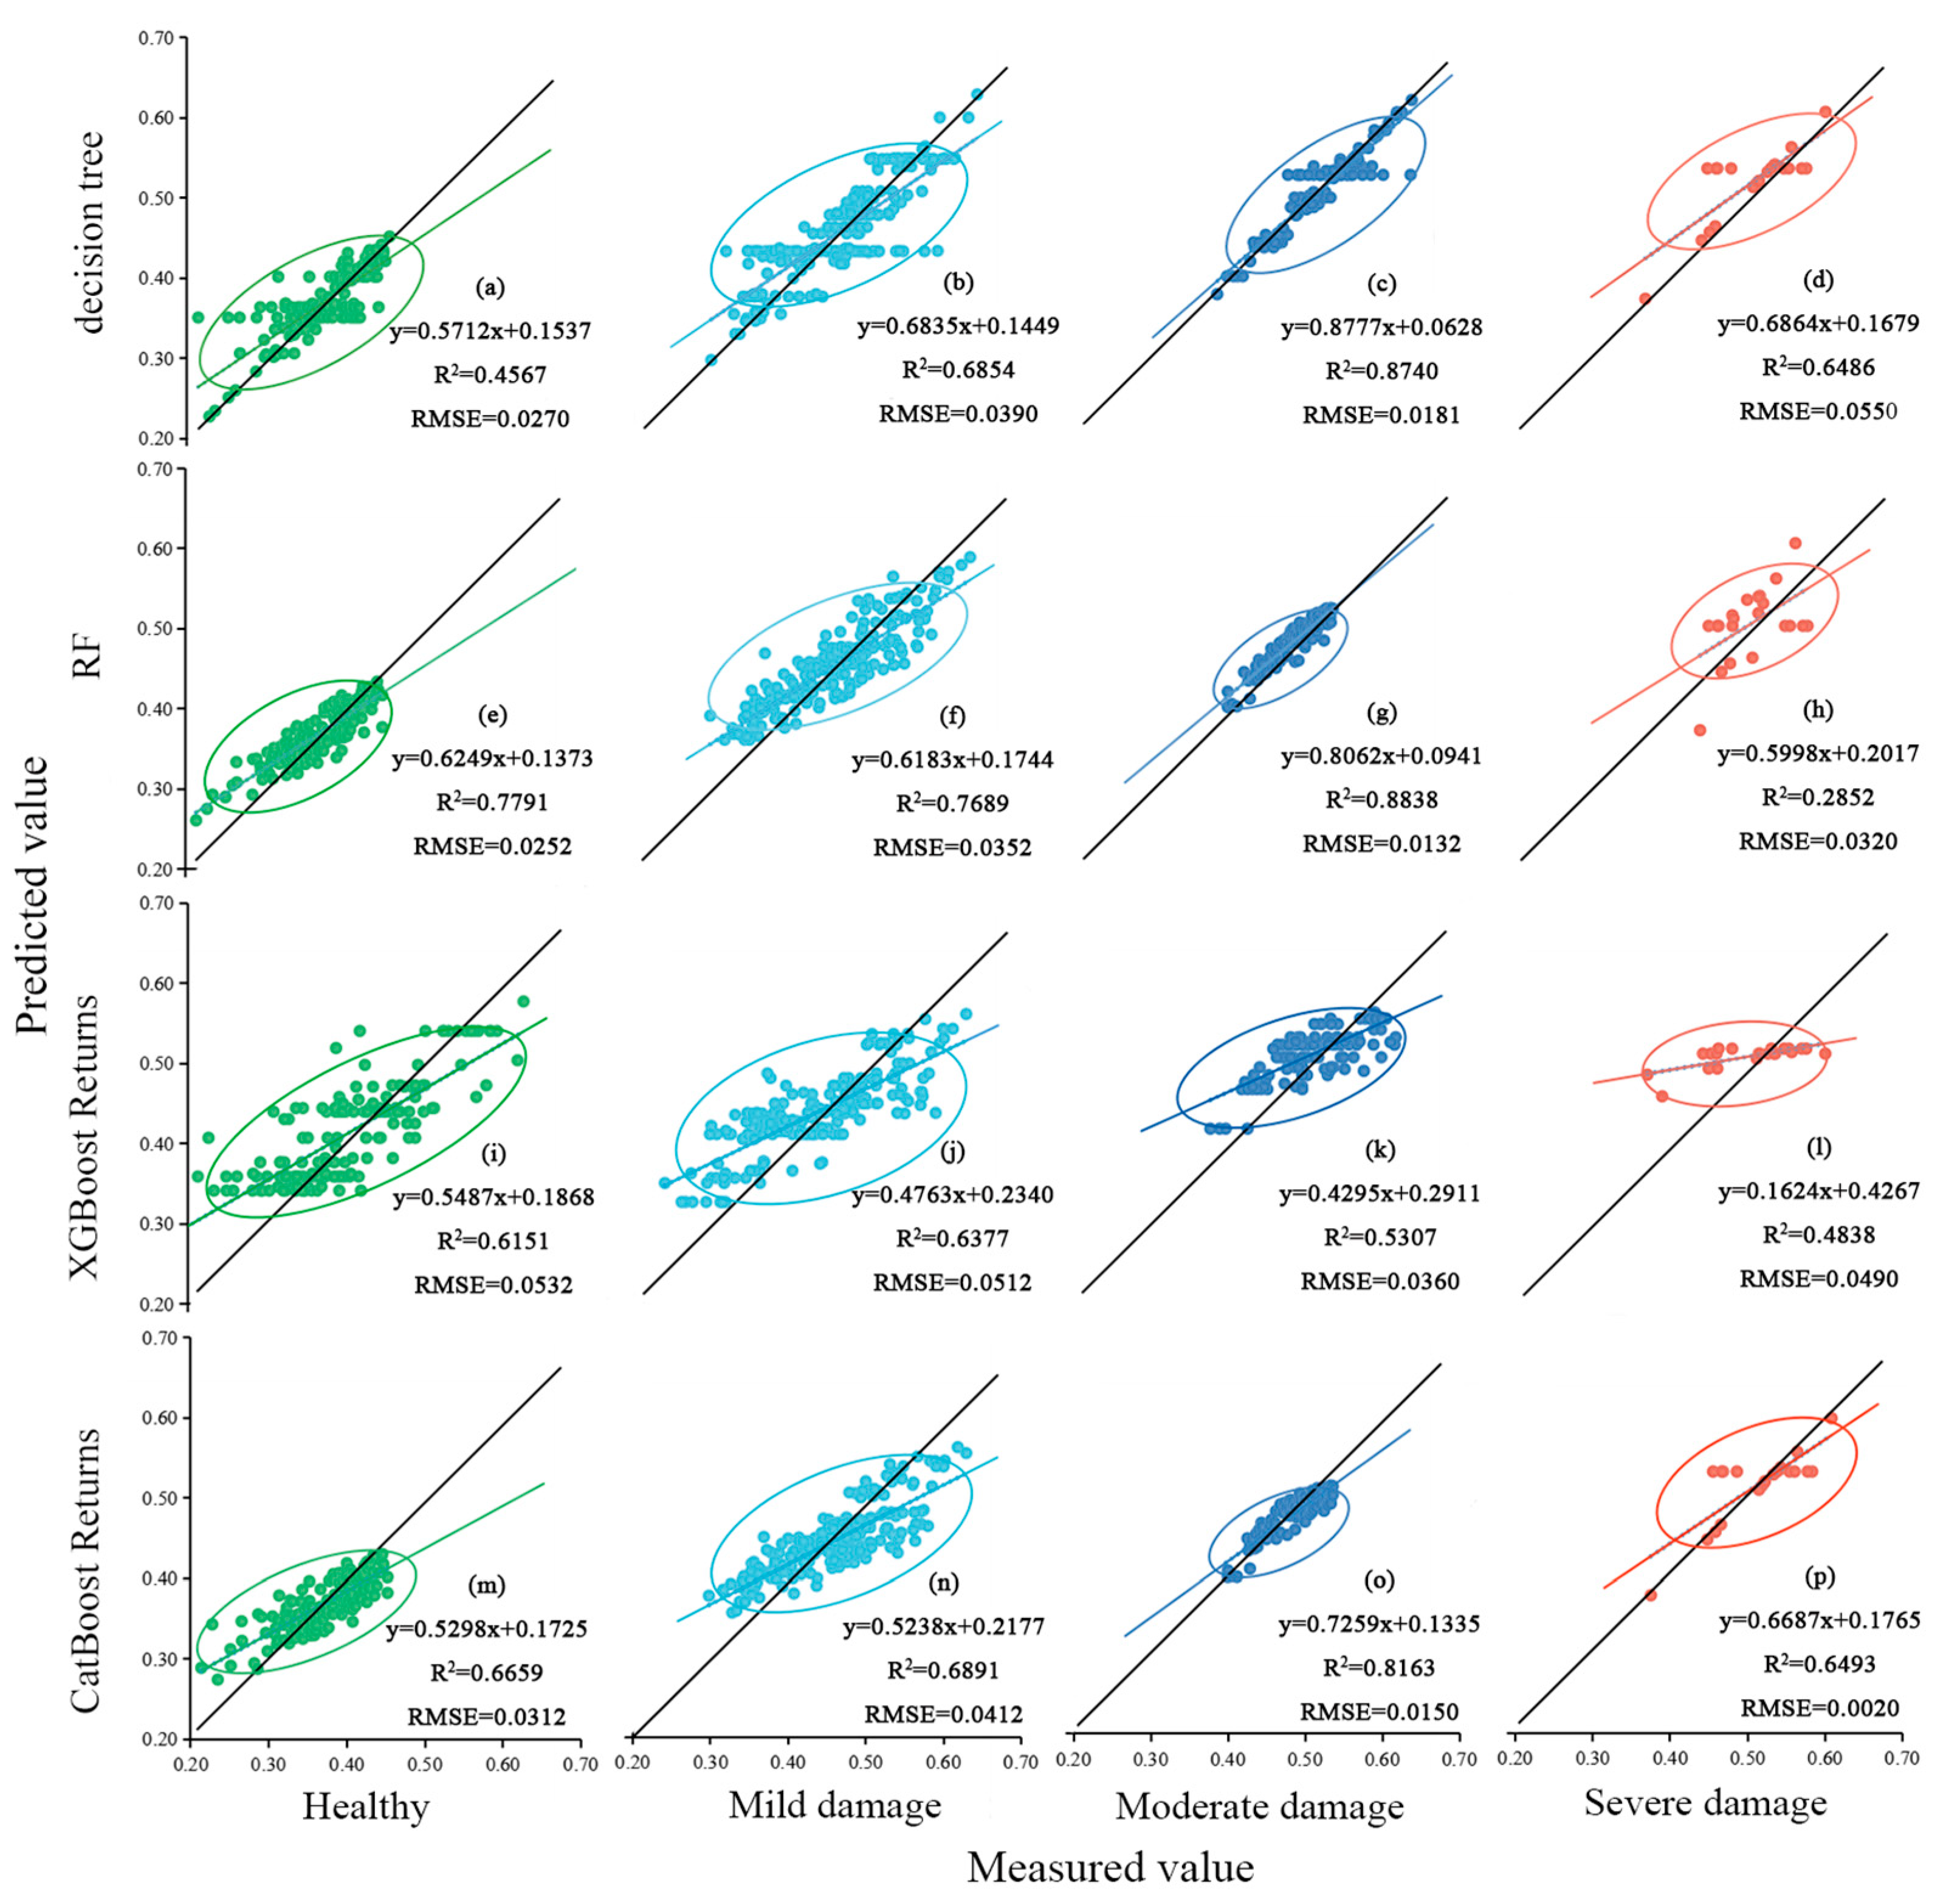
3.4. Modeling and Analysis of the Changing Patterns of SLA and LDMC in Ph. pubescens Leaves under Pest Stress

Conclusions regarding the impact of insect pests on the leaves of Ph. pubescens can be drawn from the analysis under different pest levels and canopy heights. This involves non-linear variation in specific attributes or characteristics possessed by the leaves under various pest levels, while other attributes or characteristics of the leaves show linear variations under different canopy heights. This systematic analysis enables a deeper understanding of the mechanisms by which insect pests affect the growth and leaf condition of Ph. pubescens. To explore more systematically the mechanism of the influence of insect pests on the growth and leaf functional shape of Ph. pubescens, various models were introduced for the analysis. Comprehensive modeling was carried out in this regard to understand the effects of insect pests on the Ph. pubescens ecosystem more comprehensively and in-depth. This provides us with more accurate and comprehensive information to help reveal the complex relationship between insect pests and Ph. pubescens growth, and leaf condition.
Briefly, 70% of the samples were substituted into the decision tree model, RF model, XGBoost regression model, and CatBoost regression model. After comparing the detection results of the above models under different pest levels, the main features were as follows:
(1)
Analyzing the models’ R2 values, the RF regression model is better than the other models, and the R2 values for the RF regression model vary across different hazard levels: 0.696 for the full sample, 0.755 for healthy leaves, 0.740 for leaves with mild infestation, 0.879 for leaves with moderate infestation, and 0.717 for leaves with severe infestation.
(2)
Upon scrutinizing the RMSE of the models, the RF regression model exhibited a commendable level of stability. The RMSE values for different hazard levels were consistently low, standing at 0.044 for the full sample, 0.025 for healthy leaves, 0.035 for leaves with mild infestation, 0.013 for leaves with moderate infestation, and 0.032 for severe infestation samples.
In summary, it was judged that the random forest regression analysis could better estimate leaf SLA and LDMC for the full sample, healthy leaves, and leaves with mild insect infestation. It outperformed other models in leaf estimation under insect stress.

3.4.1. Changes in SLA and LDMC under Different Pest Level Stresses

Under the full sample, the correlation between SLA and LDMC exhibited variability. Changes in pest levels introduced fluctuations in the correlation between SLA and LDMC because different pests may have had different effects on the physiological and morphological characteristics of the plant leaves. The number of samples with different pest levels under the full sample would affected the correlation between SLA and LDMC. Healthy leaves would have shown a better physiological status and may have exhibited the highest negative correlation between SLA and LDMC, reflecting relatively a high SLA and relatively low LDMC. This correlation was higher than the correlation under the full sample because the full-sample leaves were affected by insect pest stress, disrupting leaf morphology and biochemical components. The correlation between SLA and LDMC of mildly infested leaves showed a negative correlation, but to a lesser extent than that in healthy leaves. This is because mild infestation caused some physiological adjustments in the leaves that affected the correlation between SLA and LDMC. The correlation between SLA and LDMC under moderate infestation was worse than that in the light state, to the point where leaves under heavy infestation appeared to be in a disordered state, demonstrating a robust influence of the degree of infestation on SLA and LDMC.
It was shown that the simulation and prediction results of the SLA and LDMC of Ph. pubescens leaves under different infestation levels varied considerably with different regression models. From the perspective of the same model, the accuracies of the full sample were generally lower than those under healthy and light infestation levels, but higher than those under severe damage. Among them, the patterns of RF, XGBoost, and CatBoost have more relevant consistency, and the decision tree regression model introduces chance in the classification of different pest levels, which is not suitable for making predictions for P. phyllostachysae under different pest levels. From the other three models, it seems that RF has better leaf accuracy in predicting the full sample, and samples with healthy, mild, and moderate damage, while CatBoost is optimal in predicting severe damage compared with the three. Therefore, from the comprehensive analysis of the four models for the prediction accuracy R2 values and RMSE of leaf functional traits of P. phyllostachysae on Ph. pubescens under different infestation levels, the CatBoost regression model was used for prediction under severe damage, and the RF model could be used in all other cases (Table 4). The horizontal coordinates in the figure represent the measured values of SLA, the vertical coordinates represent the predicted values of LDMC, and different colors represent different pest classes; from the horizontal view, from left to right, they represent healthy, light pest infestation, medium pest infestation, and heavy pest infestation in that order. Vertically, from top to bottom, the validation accuracy of the four models, namely decision tree regression, RF regression, XGBoost regression, and CatBoost regression, is analyzed under different pest levels. The linear equation, R2 and RMSE, of the two under several conditions is given in Figure 12.

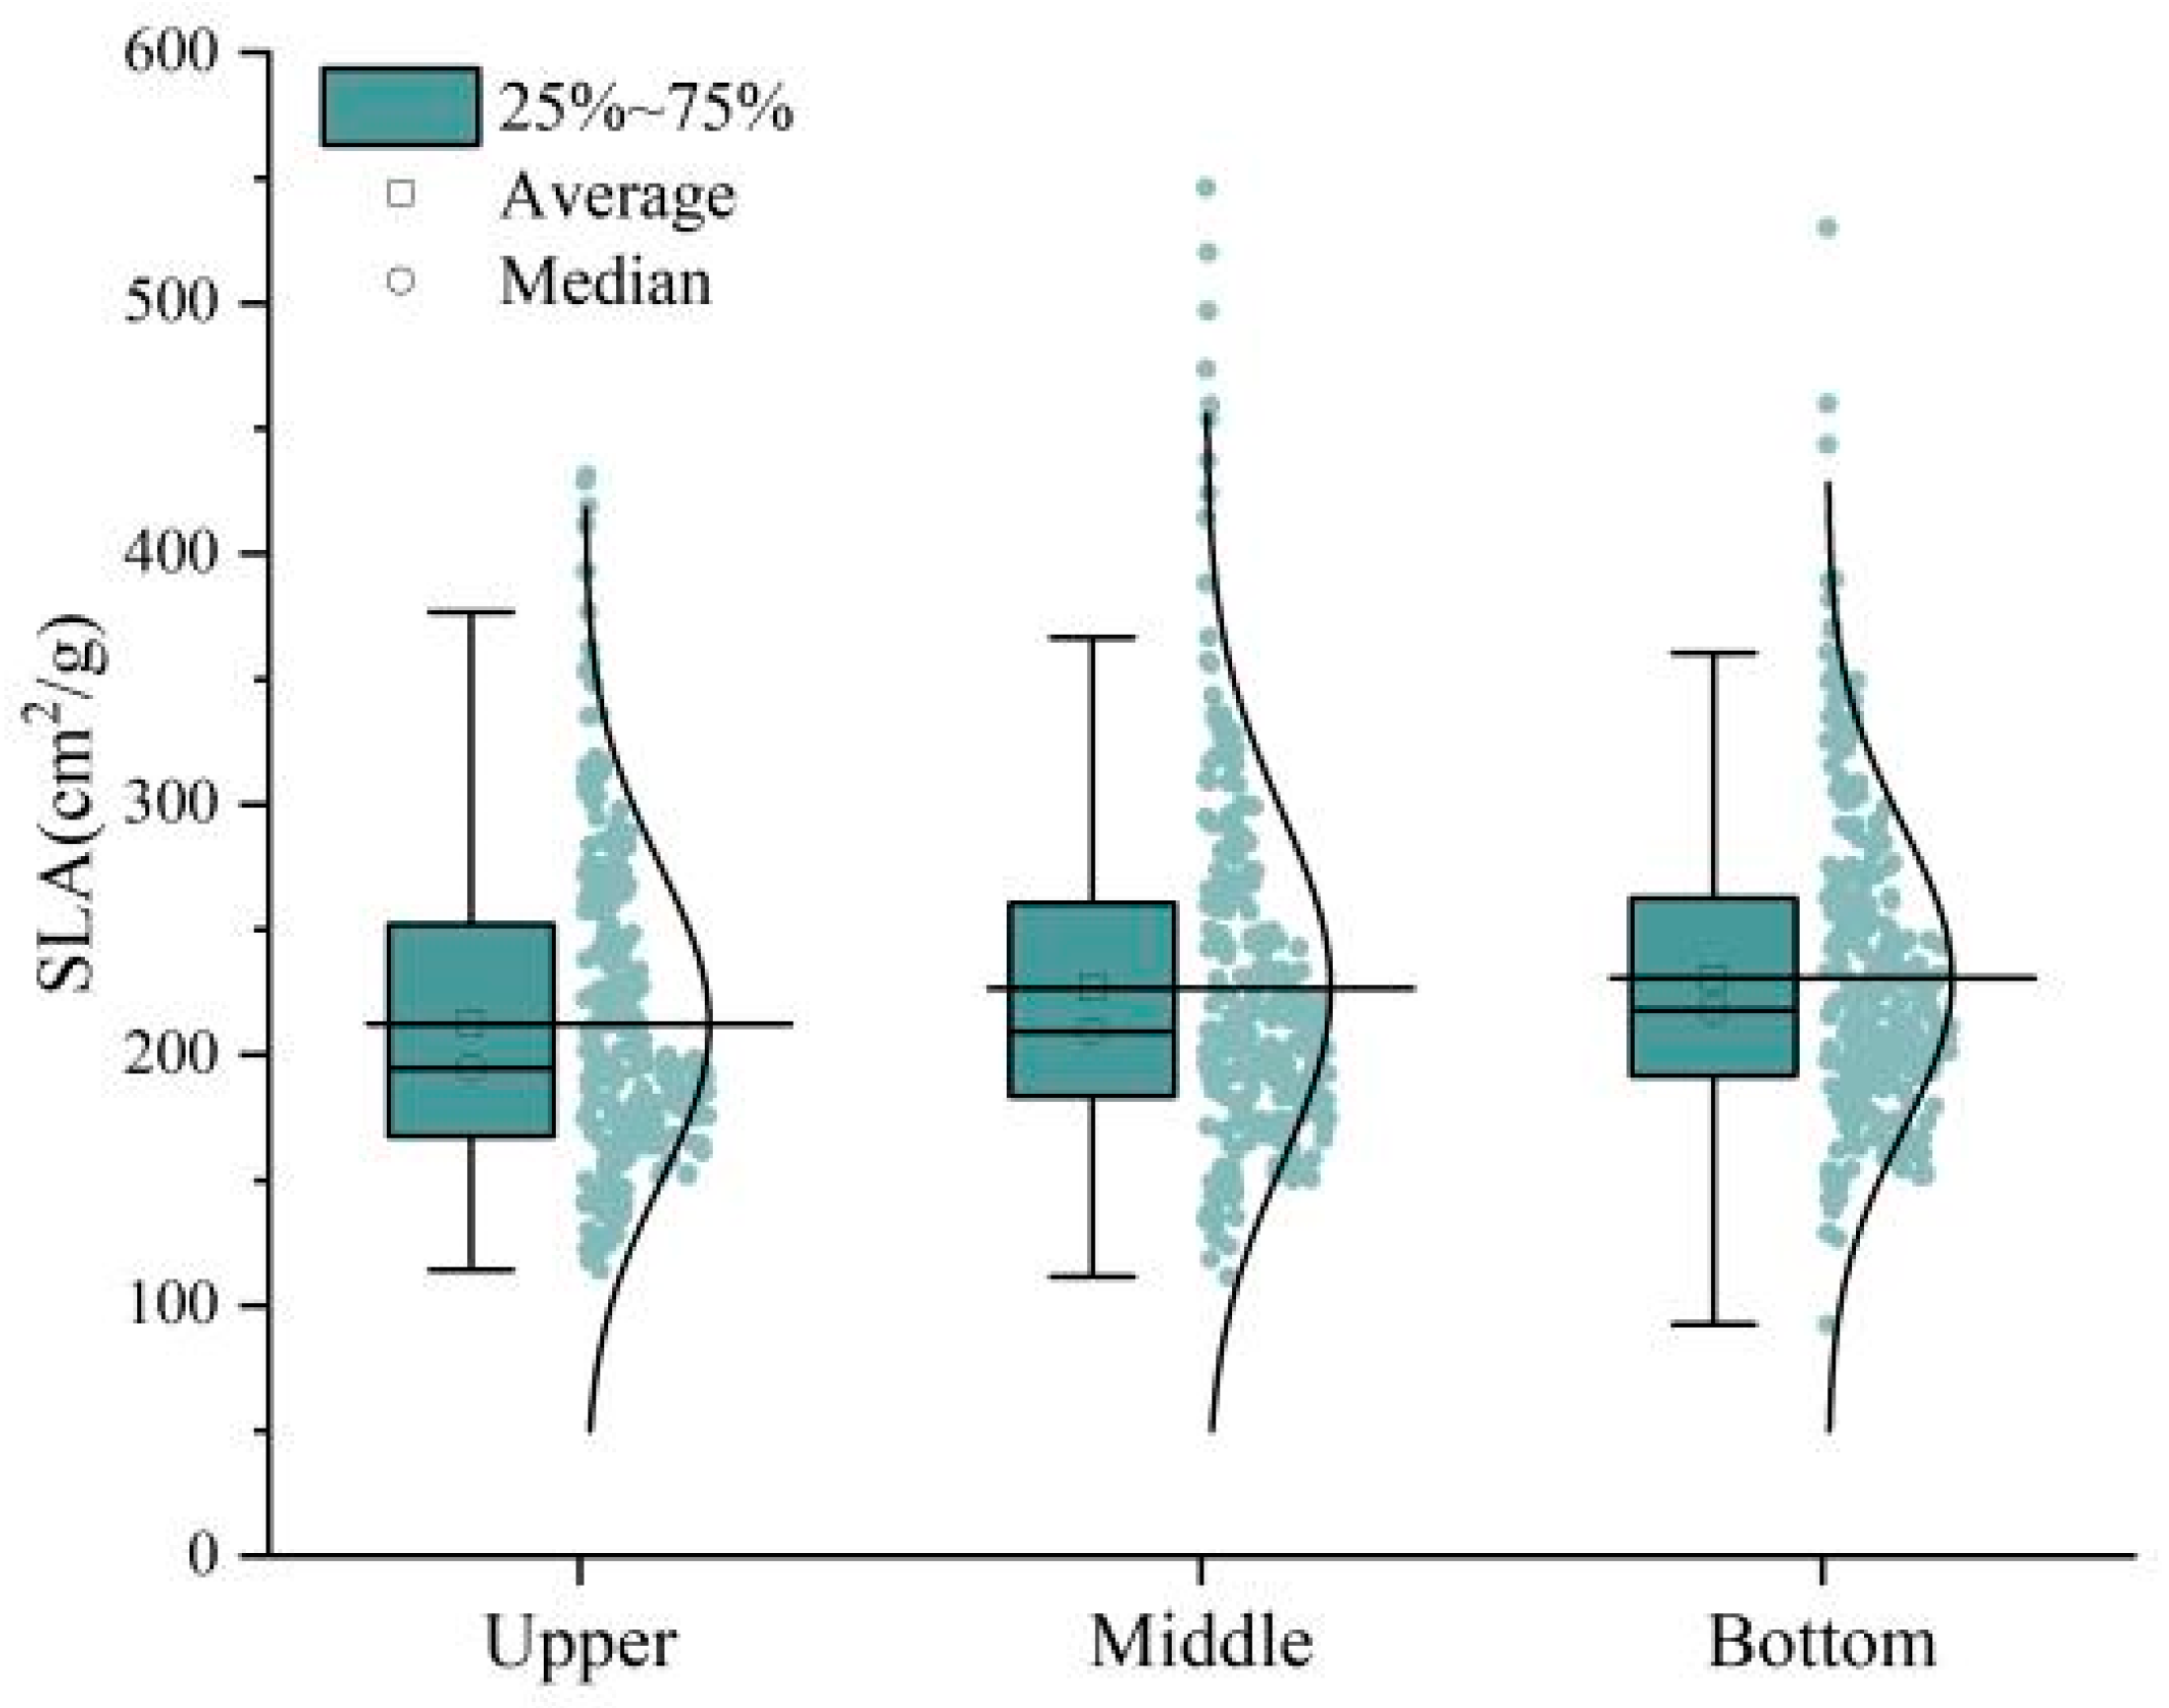
3.4.2. Changes in SLA and LDMC under Different Canopy Heights

The results revealed changes in the specific attributes of insect-infested Ph. pubescens leaves under different canopies. These attributes encompass physiological properties, chemical composition, and more. Notably, leaves in the upper layers exhibited heightened physiological adaptations to resist insect damage. The upper-layer foliage experienced less susceptibility to insect pests, showcasing a canopy height buffering effect against their impact. This phenomenon is likely associated with environmental factors such as increased light intensity in the upper layers. Differences in the degree of insect damage to Ph. pubescens leaves at various canopy heights were observed. It was found that the effect of insect pests on Ph. pubescens leaves is significant in specific canopy height ranges. A prediction model was developed to analyze the trend of plant leaves subjected to insect pests under different canopy heights, and the results verified the conclusion that the upper leaves were subjected to a lower degree of insect pest stress.
The study showed that the simulation and prediction results of the SLA and LDMC of Ph. pubescens leaves under different canopy heights varied considerably with different regression models. From the perspective of the same model, the accuracy of the full sample was lower than that viewed in sub-canopies. From the data analysis, it seems that the number of leaves in different canopy heights is comparable and that the condition affected by the infestation level is not much different; the number of full-sample leaves is nearly three times the number of single-canopy leaves, and analyzing the results of R2 and RMSE of the model accuracies, the decision-tree regression model shows better prediction accuracy. Therefore, when the R2 and RMSE of the four models were analyzed, the decision tree regression model showed the best performance in predicting the leaf functional traits of Ph. pubescens at different canopy heights (Table 5). The horizontal coordinates in the figure represent the measured values of SLA, the vertical coordinates represent the predicted values of LDMC, and different colors represent different canopy heights; from a horizontal view, and from left to right, they represent the full sample, upper, middle, and bottom. Vertically, from top to bottom, the validation accuracy analysis of four models, namely decision tree regression, RF regression, XGBoost regression and CatBoost regression, is analyzed under different canopy heights. The linear equation, R2 and RMSE, of the two under several conditions is given in Figure 13.

4. Discussion

4.1. Factors Influencing Differences in Leaf Functional Traits

In examining the LDMC of Ph. pubescens leaves across different infestation levels, an intriguing pattern emerged. Although the overall trend indicated a reduction in LDMC with the increasing severity of infestation levels, the maximum and minimum values were not observed in the healthy and heavy infestation levels, respectively. This deviation can be attributed to the calculation of LDMC, derived from the ratio of leaf dry weight to saturated fresh weight, inherently influenced by leaf area. The sampling process introduces a potential bias as leaves may be larger under heavy infestation levels, impacting individual LDMC values incidentally. It is crucial to recognize that such variations may be incidental and normal. The observed disparities can be linked, on one hand, to changes in the light environment. Phyllostachys pubescens forests in a healthy state typically reside in sections with high stand depression, resulting in a weak light environment in the lower part of the canopy due to shading. In contrast, Ph. pubescens forests under insect pest stress experience a lower degree of depression, leading to more adequate illumination in the lower part of the canopy [52]. On the other hand, aside from the influence of physical characteristics such as height and diameter at breast height on leaf functional traits, the size and annual condition of Ph. pubescens itself may involve intrinsic regulatory mechanisms, potentially influenced by genetic factors. This multifaceted interplay highlights the need for a comprehensive understanding of both environmental and intrinsic factors in deciphering nuanced variations in Ph. pubescens leaf traits under different infestation levels.

4.2. Indications of Changes in Leaf Functional Traits on Resource Utilization in the Canopy Vertical Space

The height of a tree is closely related to water transportation within the plant. Plants absorb soil moisture through the root system and subsequently transport water from the xylem of the trunk to the canopy via transpiration pull, creating a distinct water potential gradient from the inter-root soil to the top of the canopy. As the size of the tree increases, the elongation of the water transport pathway leads to an increase in the resistance to upward water movement due to friction and the effect of water column gravity. To prevent cavitation due to excessive xylem tension, stomata in the upper leaves of large trees usually close early, reducing the carbon assimilation capacity of the leaves and ultimately limiting their growth [53,54,55]. The hydraulic limitation hypothesis is used to explain the phenomenon that tree height growth tends to stagnate after a certain age. Due to hydraulic limitation, even tall trees growing in humid environments may face severe water deficits in the leaves at the top of the canopy. The anatomical configuration of the leaves may even resemble that of plants in arid zones [56].
The decrease in SLA with increasing canopy height is attributed to the diminishing top-to-bottom distribution of light resources in the canopy, as well as the potential inadequacy of the water supply in the upper part of the canopy [57]. The results revealed a trend in the LDMC of Ph. pubescens leaves, showing an initial increase followed by a decrease with canopy height. From the lower layer to the upper layer, leaf water content decreased, indicating the presence of water stress induced by increasing tree height. However, contrary to expectations, LDMC exhibited a decreasing trend with height, suggesting the nonlinear response of leaves to resource demand. Water appeared to be the absolute constraint, leading leaves to adopt strategies such as curling up and closing stomata to prevent further water dispersion [58]. Furthermore, in the Ph. pubescens forest, the upper leaf LDMC exhibited a decreasing trend with increasing height, indicating a reduction in leaf density. Given the negative correlation between SLA and leaf density, the SLA should theoretically increase. In the middle and upper layers, the SLA did not vary significantly with height, suggesting the influence of factors other than height, with leaf thickness being a key factor. Maintaining or reducing leaf thickness is crucial, and in the upper canopy, leaves increase thickness to enhance the photosynthetic rate per unit area while limiting water loss. In summary, the spatial differences between SLA and LDMC in the vertical direction of the canopy reflect the plant’s strategy for resource utilization at different heights. For Ph. pubescens forests, light is the primary limiting resource in the lower-middle layer and may become the dominant limiting resource in the upper-middle layer. This information is crucial for modeling and estimating regional biological productivity using LiDAR technology to detect tree height [59].

4.3. Analysis of the Relationship between Physiological Metabolic Processes and Leaf Functional Traits

Among the myriad of plant functional traits, leaf functional traits are intricately linked to plant growth responses, individual biomass, and plant resource utilization strategies, playing a pivotal role in shaping fundamental plant behaviors and functions [60]. As the primary organs for photosynthesis, leaves serve as the crucial connection for primary producers to convert and harness energy from nature [61]. SLA stands out as a key leaf functional trait influencing the plant carbon harvesting strategy, reflecting the delicate balance between carbon acquisition and utilization [62,63]. Our next focus involves delving into the relationship analysis between carbon and SLA in Ph. pubescens leaves. Carbon and nitrogen metabolism represent two major physiological processes in plants, directly impacting photosynthesis output, mineral uptake, protein synthesis, and other essential processes [64]. Through experiments conducted in this study, it is postulated that a relationship exists between the carbon content of Ph. pubescens leaves and leaf thickness, SLA, leaf nitrogen content, and the C/N ratio. Simultaneously, soil moisture emerges as a potential primary limiting factor for the carbon content of Ph. pubescens leaves. Subsequent research will be dedicated to substantiating the interplay between the carbon and nitrogen content of leaves, their metabolism, and their role in establishing the plasticity of Ph. pubescens leaves.

5. Conclusions

The results delve into the dynamic patterns of SLA and LDMC in Ph. pubescens leaves across varying degrees of pest infestation and different canopy measurements. They further examine the evolving relationship between these two parameters under distinct levels of hazard, utilizing the outcomes from the optimal machine learning regression estimation model. This study measured and analyzed the changing patterns of the SLA and LDMC of Ph. pubescens leaves from different levels of infestation and under different canopies, proving the influence of infestation on the functional traits of Ph. pubescens leaves. These findings offer valuable insights, serving as a foundation for the formulation and implementation of effective control measures by relevant departments. The primary conclusions drawn from this analysis are as follows:
(1)
Pure forests of Ph. pubescens have a high leaf density, and the canopy as a whole has a high sense of vertical hierarchy and a high degree of coverage. The understory of mixed forests of Ph. pubescens is rich in vegetation, and usually consists of horsetail pine, Pinus massoniana Lamb. (Pinales: Pinaceae), long-stalked mizuna, Brassica rapa subsp. nipposinica (L. H. Bailey) Hanelt (Capparales: Brassicaceae), and deciduous trees mixed with Ph. pubescens to form various types of mixed forests, in which Ph. pubescens generally resides in the second layer, and taller species such as pines reside in the first layer. Under the stress of the P. phyllostachysae, the SLA exhibited a notable downward trend across various pest levels as canopy height increased. This trend was primarily driven by light conditions. Conversely, the LDMC in Ph. pubescens displayed an initial increase followed by a decrease with canopy height, showcasing the plant’s adaptive responses to the light environment and its strategic use of water resources. Leaves situated at the upper canopy faced the imminent risk of substantial water loss in a high-radiant-energy environment. In response, plant leaves employed mechanisms such as increasing cuticle thickness and closing stomata to mitigate further water loss.
(2)
The analysis of Ph. pubescens leaf SLA and LDMC revealed a significant negative correlation under different levels of P. phyllostachysae stress, but the correlation was not significant under heavy damage. The leaf area in a healthy state was larger than that when infested by a pest; the higher the infestation level, the more likely the leaf area was defoliated, while leaf density was higher and leaf saturation fresh weight was higher. There was a general trend of decreasing LDMC with increasing leaf SLA at different canopy heights, but the range of values was not consistent. Analyzing the accuracy of four models in the paper for investigating the leaves of Ph. pubescens forests under different levels of the P. phyllostachysae stress and different canopy heights, the results showed that the CatBoost model was suitable for heavy damage monitoring from the point of view of different infestation levels, and RF was used in the other cases, whereas the decision tree model was the best one to be used for predicting different canopy heights.
(3)
The SLA and LDMC play pivotal roles in reflecting the growth rate of plants and their resource utilization efficiency. In the case of Ph. pubescens leaves, SLA exhibited a decreasing trend with an escalating infestation level from the poisonous moth, establishing a negative correlation with the degree of infestation. Conversely, LDMC displayed an increasing trend, highlighting that leaves in a healthy state possessed a higher SLA and lower LDMC. The potential existence of chance values in LDMC is attributed to the inconsistently decreasing pattern of leaf area under varying pest levels, suggesting that the leaf area in the healthy state might be relatively small. The impact of insect pest stress on leaf water content in Ph. pubescens forests becomes more pronounced with a higher degree of infestation. Spatial and temporal variability in insect damage to Ph. pubescens leaves across different canopy levels, seasons, or geographic locations may contribute to a more comprehensive understanding of the intrinsic mechanisms operating in Ph. pubescens forests under the influence of P. phyllostachysae. Plants “talk” to each other by means of chemical or physical signals, and when they are infested by pests, the amount of biochemical components and the relationship between them will change, which is on the one hand a physiological change to resist the attack, and on the other hand a warning signal to the plants in the same community, especially to the plants of the same species, of the existence of a potential danger. In this study, this subtle “dialogue” was detected by remote sensing, which is of great significance to protect the health of bamboo forests. This dimension adds depth to this research perspective and opens avenues for future investigations.

Author Contributions

Conceptualization, W.S. and Z.X.; methodology, W.S., Z.X., N.Q. and X.Y.; software, L.C. and Y.Y.; validation, N.Q., L.C., Y.Y. and A.H.; formal analysis, N.Q. and Y.Y.; investigation, W.S. and L.S.; resources, H.Z., X.Y. and X.L.; data curation, W.S., X.Y., A.H. and L.S.; writing—original draft preparation, W.S.; writing—review and editing, W.S., Z.X., N.Q., L.C., Y.Y., H.Z., X.Y., A.H., L.S. and X.L.; visualization, L.S. and X.L.; supervision, Z.X., H.Z. and X.L.; project administration, W.S., H.Z. and X.L.; funding acquisition, Z.X. All authors have read and agreed to the published version of the manuscript.

Funding

This research was funded by the Project of National Key R&D Program of China (2023YFD2201205), the National Natural Science Foundation of China (42071300, 41501361), the Fujian Province Natural Science Foundation Project (2020J01504), the Fund of Fujian Key Laboratory of Island Monitoring and Ecological Development (2023ZD03), the China Postdoctoral Science Foundation (2018M630728), the Open Fund of Fujian Provincial Key Laboratory of Resources and Environment Monitoring & Sustainable Management and Utilization (ZD202102), the Program for Innovative Research Team in Science and Technology in Fujian Province University (KC190002), the Open Fund of University Key Lab of Geomatics Technology, and Optimize Resources Utilization in Fujian Province (fafugeo201901), and was supported by the Research Project of Jinjiang Fuda Science and Education Park Development Center (2019-JJFDKY-17).

Data Availability Statement

The data that support the findings of this study are available from the corresponding author, Zhanghua Xu, upon reasonable request.

Acknowledgments

We are grateful to the Shunchang County forestry bureau for their help in this work. Special thanks go to Huakang Zhou, Zhaoquan Zhong, and Xianyun Lin for their help in the field component of this research. Comments made by the anonymous reviewers are greatly appreciated.

Conflicts of Interest

The authors declare that they have no known competing financial interests or personal relationships that could have appeared to influence the work reported in this paper.

References

  1. Du, H.Q.; Mao, F.J.; Li, X.J.; Zhou, G.M.; Xu, X.J.; Han, N.; Sun, S.B.; Gao, G.L.; Cui, L.; Li, Y.G.; et al. Mapping global bamboo forest distribution using multisource remote sensing data. IEEE J. Sel. Top. Appl. Earth Obs. Remote Sens. 2018, 11, 1458–1471. [Google Scholar] [CrossRef]
  2. Cai, C.J.; Yang, Z.H.; Liu, L.; Lai, Y.S.; Lei, J.J.; Fan, S.H.; Tang, X.L. Consistent Effects of Canopy vs. Understory Nitrogen Addition on Soil Respiration and Net Ecosystem Production in Moso Bamboo Forests. Forests 2021, 12, 1427. [Google Scholar] [CrossRef]
  3. Yen, T.M.; Lee, J.S. Comparing aboveground carbon sequestration between Moso bamboo (Phyllostachys heterocycla) and China fir (Cunninghamia lanceolata) forests based on the allometric model. For. Ecol. Manag. 2011, 261, 995–1002. [Google Scholar] [CrossRef]
  4. Ouyang, M.; Yang, C.; Tian, D.; Pan, J.; Chen, G.P.; Su, H.J.; Yan, Z.B.; Ji, C.J.; Tang, Z.Y.; Fang, J.Y. A field-based estimation of moso bamboo forest biomass in China. For. Ecol. Manag. 2022, 505, 119885. [Google Scholar] [CrossRef]
  5. Seidl, R.; Klonner, G.; Rammer, W.; Essl, F.; Moreno, A.; Neumann, M.; Dullinger, S. Invasive alien pests threaten the carbon stored in Europe’s forests. Nat. Commun. 2018, 9, 1626. [Google Scholar] [CrossRef]
  6. Baxter, I.R.; Vitek, O.; Lahner, B.; Muthukumar, B.; Borghi, M.; Morrissey, J.; Guerinot, M.L.; Salt, D.E. The leaf ionome as a multivariable system to detect a plant’s physiological status. Proc. Natl. Acad. Sci. USA 2008, 105, 12081–12086. [Google Scholar] [CrossRef] [PubMed]
  7. Roa-Fuentes, L.L.; Templer, P.H.; Campo, J. Effects of precipitation regime and soil nitrogen on leaf traits in seasonally dry tropical forests of the Yucatan Peninsula, Mexico. Oecologia 2015, 179, 585–597. [Google Scholar] [CrossRef]
  8. Münchinger, I.K.; Hajek, P.; Akdogan, B.; Caicoya, A.T.; Kunert, N. Leaf thermal tolerance and sensitivity of temperate tree species are correlated with leaf physiological and functional drought resistance traits. J. For. Res. 2023, 34, 63–76. [Google Scholar] [CrossRef]
  9. Ochoa-Beltrán, A.; Martínez-Villa, J.A.; Kennedy, P.G.; Salgado-Negret, B.; Duque, A. Plant Trait Assembly in Species-Rich Forests at Varying Elevations in the Northwest Andes of Colombia. Land 2021, 10, 1057. [Google Scholar] [CrossRef]
  10. Long, Q.Z.; Du, H.; Su, L.; Zeng, F.D.; Lian, Z.W.; Peng, W.X.; Liu, K.P.; Tan, W.N. Variation of plant functional traits and adaptive strategies in Karst evergreen deciduous broad-leaved forest. Acta Ecol. Sin. 2023, 43, 8875–8883. [Google Scholar]
  11. Ajilogba, C.F.; Walker, S. Using crop modeling to find solutions for wheat diseases: A review. Front. Environ. Sci. 2023, 10, 987765. [Google Scholar] [CrossRef]
  12. Haris, M.; Huaasin, T.; Mohamed, H.I.; Khan, A.; Ansari, M.S.; Tauseef, A.; Khan, A.A.; Akhtar, N. Nanotechnology-A new frontier of nano-farming in agricultural and food production and its development. Sci. Total Environ. 2023, 857, 159639. [Google Scholar] [CrossRef] [PubMed]
  13. Chianucci, F.; Ferrara, C.; Pollastrini, M.; Corona, P. Development of digital photographic approaches to assess leaf traits in broadleaf tree species. Ecol. Indic. 2019, 106, 105547. [Google Scholar] [CrossRef]
  14. Zhu, X.X.; Wen, Z.M.; Zheng, C.; Gao, Y.; Zhang, G.Y.; Wang, W.W.; Diao, X.C.; Wan, J.F. Functional traits of plant life forms and their responses to environmental factors in the Yanhe river basin. Res. Soil Water Conserv. 2023, 30, 328–336. [Google Scholar]
  15. Yang, J.Y.; Wang, Z.J. Exploring urban remnant forest soil bacterial diversity responses to woody plant leaf functional traits. Plant Soil 2023, 494, 463–475. [Google Scholar] [CrossRef]
  16. Begum, G.; Gao, J.; Xue, W.; Yu, F.H. Plant-soil feedbacks in Hydrocotyle vulgaris: Genotypic differences and relations to functional traits. Ecol. Indic. 2023, 146, 109766. [Google Scholar] [CrossRef]
  17. Orzech, K.; Wanic, M.; Copeland, L. The Effects of Soil Compaction and Different Tillage Systems on the Bulk Density and Moisture Content of Soil and the Yields of Winter Oilseed Rape and Cereals. Agriculture 2021, 11, 666. [Google Scholar] [CrossRef]
  18. Tasset, E.; Boulanger, T.; Diquelou, S.; Laine, P.; Lemauviel-Lavenant, S. Plant trait to fodder quality relationships at both species and community levels in wet grasslands. Ecol. Indic. 2019, 97, 389–397. [Google Scholar] [CrossRef]
  19. Garrish, V.; Cernusak, L.A.; Winter, K.; Turner, B.L. Nitrogen to phosphorus ratio of plant biomass versus soil solution in a tropical pioneer tree, Ficus insipida. J. Exp. Bot. 2010, 61, 3735. [Google Scholar] [CrossRef]
  20. Siegwolf, R.; Lehmann, M.; Goldsmith, G.; Sidorova, O.C.; Mirande-Ney, C.; Timoveeva, G.; Weight, R.B.; Saurer, M. Updating the dual C and O isotope-Gas-exchange model: A concept to understand plant responses to the environment and its implications for tree rings. Plant Cell Environ. 2023, 46, 2606–2627. [Google Scholar] [CrossRef] [PubMed]
  21. Kumordzi, B.B.; Bello, F.D.; Freschet, G.T.; Bagousse-Pinguet, Y.L.; Lep, J.; Wardle, D.A. Linkage of plant trait space to successional age and species richness in boreal forest understorey vegetation. J. Ecol. 2015, 103, 1610–1620. [Google Scholar] [CrossRef]
  22. Canham, C.A.; Woods, C.; Setterfield, S.A.; Veneklaas, E.J.; Freestone, F.L.; Beesley, L.S.; Douglas, M.M. Functional traits of riparian trees in the lower Fitzroy River, Western Australia. Ecohydrology 2023, 16, e2488. [Google Scholar] [CrossRef]
  23. Carvalho, C.E.; Sfair, J.C.; Eller, C.B.; Menezes, B.S.; Menezes, M.O.T.; Araujo, F.S. Tree height, leaf thickness and seed size drive Caatinga plants’ sensitivity to climate change. J. Biogeogr. 2023, 50, 2057–2068. [Google Scholar] [CrossRef]
  24. Alvi, A.F.; Iqbal, N.; Albaqami, M.; Khan, N.A. The emerging key role of reactive sulfur species in abiotic stress tolerance in plants. Physiol. Plant. 2023, 175, e13945. [Google Scholar] [CrossRef] [PubMed]
  25. Zhang, H.; Zhang, W.; Huang, S.; Xu, P.; Cao, Z.; Chen, M.; Lin, X. The potential role of plasma membrane proteins in response to Zn stress in rice roots based on iTRAQ and PRM under low Cd condition. J. Hazard. Mater. 2022, 429, 128324. [Google Scholar] [CrossRef] [PubMed]
  26. Abbasi, A.R.; Sarvestani, R.; Mohammadi, B.; Baghery, A. Drought stress-induced changes at physiological and biochemical levels in some common vetch (Vicia sativa L.) genotypes. J. Agric. Sci. Technol. 2014, 16, 505–516. [Google Scholar]
  27. Monarca, S.; Feretti, D.; Zerbini, I.; Alberti, A.; Zani, C.; Resola, S.; Gelatti, U.; Nardi, G. Soil Contamination Detected Using Bacterial and Plant Mutagenicity Tests and Chemical Analyses. Environ. Res. 2002, 88, 64–69. [Google Scholar] [CrossRef]
  28. Liz, F.A.; Adam, K.; Jan, A.; Peter, N.M.; Alan, C.; Fritz, S.; Jii, D. Comparative anatomy of leaf petioles in temperate trees and shrubs: The role of plant size, environment and phylogeny. Ann. Bot. 2022, 129, 567–582. [Google Scholar]
  29. Koch, G.W.; Sillett, S.C.; Jennings, G.M.; Davis, S.D. The limits to tree height. Nature 2004, 428, 851–854. [Google Scholar] [CrossRef]
  30. Wilson, P.J.; Thompson, K.; Hodgson, J.G. Specific leaf area and leaf dry matter content as alternative predictors of plant strategies. New Phytol. 2010, 143, 155–162. [Google Scholar] [CrossRef]
  31. Wangchuk, K.; Darabant, A.; Wangdi, J.; Nirola, H.; Wangdi, J.; Gratzer, G. Climate warming decreases plant diversity but increases community biomass in high-altitude grasslands. Rangel. Ecol. Manag. 2021, 75, 51–57. [Google Scholar] [CrossRef]
  32. Hu, Y.T.; Sun, Z.H.; Zeng, Y.L.; Ouyang, S.; Chen, L.; Lei, P.F.; Deng, X.W.; Zhao, Z.H.; Fang, X.; Xiang, W.H. Tree-level stomatal regulation is more closely related to xylem hydraulic traits than to leaf photosynthetic traits across diverse tree species. Agric. For. Meteorol. 2023, 329, 109291. [Google Scholar] [CrossRef]
  33. Cui, E.Q.; Weng, E.S.; Yan, E.R.; Xia, J.Y. Robust leaf trait relationships across species under global environmental changes. Nat. Commun. 2020, 11, 2999. [Google Scholar] [CrossRef]
  34. Jiang, Y.; Chen, X.F.; Yang, X.J. Changes of aquatic plants in Donghu Lake of Wuhan based 1990–2020 Landsat images. Chin. J. Plant Ecol. 2022, 46, 1551–1561. [Google Scholar] [CrossRef]
  35. Zhang, Y.Y.; Cai, X.B.; Song, X.X.; Suo, J.R.; Wang, Z.; Li, E.H.; Wang, X.L. Remote sensing information extraction of aquatic plants in Honghu Lake based on decision tree. Wetl. Sci. 2018, 16, 213–222. [Google Scholar]
  36. Ghosh, A.; Joshi, P.K. A comparison of selected classification algorithms for mapping bamboo patches in lower Gangetic plains using very high resolution WorldView 2 imagery. Int. J. Appl. Earth Obs. Geoinf. 2014, 26, 298–311. [Google Scholar] [CrossRef]
  37. Wang, Q.; Chang, Q.R.; Li, K.; Chen, X.K.; Miu, H.L.; Shi, B.T.; Zeng, X.L.; Li, Z.F. Estimation of winter wheat canopy chlorophyll content based on principal component analysis and random forest regression. J. Triticeae Crops 2024, 43, 1–11. [Google Scholar]
  38. Yoon, H.I.; Lee, H.; Yang, J.S.; Choi, J.H.; Jung, D.H.; Park, Y.J.; Park, J.E.; Kim, S.M.; Park, S.H. Predicting models for plant metabolites based on PLSR, AdaBoost, XGBoost, and LightGBM algorithms using hyperspectral imaging of brassica juncea. Agriculture 2023, 13, 1477. [Google Scholar] [CrossRef]
  39. Wang, L.Q.; Wang, S.Q.; Sun, D.Y.; Li, J.S.; Zhu, Y.X.; Xu, Y.J.; Zhang, H.L. XGBoost-Based inversion of phytoplankton pigment concentrations from field measured fluorescence excitation spectra. Acta Opt. Sin. 2022, 42, 215–224. [Google Scholar]
  40. Zhou, G.L.; Ni, Z.Y.; Zhao, Y.B.; Luan, J.W. Identification of bamboo species based on extreme gradient boosting (XGBoost) using Zhuhai-1 orbita hyperspectral remote sensing imagery. Sensors 2022, 22, 5434. [Google Scholar] [CrossRef]
  41. Xu, Z.H.; Zhang, Q.; Xiang, S.Y.; Li, Y.F.; Huang, X.Y.; Zhang, Y.W.; Zhou, X.; Li, Z.L.; Yao, X.; Li, Q.S.; et al. Monitoring the severity of Pantana phyllostachysae Chao infestation in Moso bamboo forests based on UAV multi-spectral remote sensing feature selection. Forests 2022, 13, 418. [Google Scholar] [CrossRef]
  42. Sun, M.L.; Yu, K.Y.; Zhang, X.P.; Zhao, G.J.; Chen, Y.C.; Chen, X.Y.; Huang, X.; Liu, J. Research on estimation of single wood accumulation of fir based on airborne Lidar point cloud data and Catboost algorithm. J. Southwest For. Univ. (Nat. Sci.) 2024, 44, 1–9. [Google Scholar]
  43. Xu, Z.H.; Zhang, Y.W.; Li, Z.L.; Xiang, S.Y.; Zhang, Q.; Li, Y.F.; Zhou, X.; Yu, H.; Shen, W.L. Improved “slice-based class-oriented” remote sensing algorithm for bamboo forest information extraction and its application. Remote Sens. Technol. Appl. 2023, 38, 393–404. [Google Scholar]
  44. Xu, Z.H.; He, A.Q.; Zhang, Y.W.; Hao, Z.B.; Li, Y.F.; Xiang, S.Y.; Li, B.; Chen, L.Y.; Yu, H.; Shen, W.L.; et al. Retrieving chlorophyll content and equivalent water thickness of Moso bamboo (Phyllostachys pubescens) forests under Pantana phyllostachysae Chao-induced stress from Sentinel-2A/B images in a multiple LUTs-based PROSAIL framework. For. Ecosyst. 2023, 10, 100–108. [Google Scholar] [CrossRef]
  45. Huang, X.; Xu, Z.; Yang, X.; Shi, J.; Hu, X.; Ju, W. Monitoring the severity of Pantana phyllostachysae Chao on bamboo using leaf hyperspectral data. Remote Sens. 2021, 13, 4146. [Google Scholar] [CrossRef]
  46. Chen, L.Y.; He, A.Q.; Xu, Z.H.; Li, B.; Zhang, H.F.; Li, G.T.; Guo, X.Y.; Li, Z.L. Mapping aboveground biomass of Moso bamboo (Phyllostachys pubescens) forests under Pantana phyllostachysae Chao-induced stress using Sentinel-2 imagery. Ecol. Indic. 2024, 158, 111564. [Google Scholar] [CrossRef]
  47. Xu, Z.H.; Sun, L.; Li, B. Design of leaf area measurement system based on Android smartphone. Lab. Technol. Manag. 2023, 40, 89–94. [Google Scholar]
  48. Samuel, A.L. Some studies in machine learning using the game of checkers. IBM J. Res. Dev. 2000, 44, 206–226. [Google Scholar] [CrossRef]
  49. Breiman, L. Random forests. Mach. Learn. 2001, 45, 5–23. [Google Scholar] [CrossRef]
  50. Tianqi, C.; Guestrin, C.E. XGBoost: A scalable tree boosting system. In Proceedings of the 22nd ACM SIGKDD International Conference on Knowledge Discovery and Data Mining, San Francisco, CA, USA, 13–17 August 2016; pp. 785–794. [Google Scholar]
  51. Prokhorenkova, L.; Gusev, G.; Vorobev, A.; Dorogush, A.V.; Gulin, A. CatBoost: Unbiased boosting with categorical features. arXiv 2019, arXiv:1706.09516. [Google Scholar]
  52. Edna, E.; Robyn, H.L.; Alethea, A.; Timothy, C. Technology assessment and resource allocation for predictive genetic testing: A study of the perspectives of Canadian genetic health care providers. BMC Med. Ethics 2009, 10, 6. [Google Scholar]
  53. Griffin-Nolan, R.; Sandel, B. Global intraspecific trait–climate relationships for grasses are linked to a species’ typical form and function. Ecography 2023, 2023, e06586. [Google Scholar] [CrossRef]
  54. Gao, J.; Wang, J.F.; Wang, K.Q.; Li, Y.H.; Zhang, X. Patterns and drivers of community specific leaf area in China—ScienceDirect. Glob. Ecol. Conserv. 2023, 33, e02331. [Google Scholar]
  55. Day, M.E.; Greenwood, M.S.; White, A.S. Age-related changes in foliar morphology and physiology in red spruce and their influence on declining photosynthetic rates and productivity with tree age. Tree Physiol. 2001, 21, 1195–1204. [Google Scholar] [CrossRef] [PubMed]
  56. Vendramini, F.; Díaz, S.; Gurvich, D.E.; Wilson, P.J.; Thompson, K.; Hodgson, J.G. Leaf traits as indicators of resource—Use strategy in floras with succulent species. New Phytol. 2002, 154, 147–157. [Google Scholar] [CrossRef]
  57. Ryan, M.G.; Yoder, B.J. Hydraulic limits to tree height and tree growth. Bioscience 1997, 47, 235–242. [Google Scholar] [CrossRef]
  58. Nykiel, M.; Gietler, M.; Fidler, J.; Graska, J.; RybarczykPłońska, A.; Prabucka, B.; Muszyńska, E.; Bocianowski, J.; Labudda, M. Differential water deficit in leaves is a principal factor modifying barley response to drought stress. Int. J. Mol. Sci. 2022, 23, 15240. [Google Scholar] [CrossRef]
  59. Miller, C.D.; Forthman, M.; Miller, C.W.; Kimball, R.T. Extracting ‘legacy loci’ from an invertebrate sequence capture data set. Zool. Scr. 2022, 51, 14–31. [Google Scholar] [CrossRef]
  60. Miller, C.W.; Kimball, R.T.; Michael, F. The evolution of multi-component weapons in the superfamily of leaf-footed bugs. Evolution 2024, 2024, qpae011. [Google Scholar] [CrossRef]
  61. Poorter, H.; Niinemets, Ü.; Poorter, L.; Wright, I.J.; Villar, R. Causes and consequences of variation in leaf mass per area (LMA): A meta-analysis. New Phytol. 2009, 182, 565–588. [Google Scholar] [CrossRef]
  62. Ali, A.M.; Darvishzadeh, R.; Skidmore, A.K.; van Duren, I.; Heiden, U.; Heurich, M. Estimating leaf functional traits by inversion of prospect: Assessing leaf dry matter content and specific leaf area in mixed mountainous forest. Int. J. Appl. Earth Obs. Geoinf. 2016, 45, 66–76. [Google Scholar] [CrossRef]
  63. Smart, S.M.; Glanville, H.C.; Blanes, M.D.C.; Mercado, L.M.; Emmett, B.A.; Jones, D.L.; Cosby, B.J.; Marrs, R.H.; Butler, A.; Marshall, M.R.; et al. Leaf dry matter content is better at predicting above-ground net primary production than specific leaf area. Funct. Ecol. 2017, 31, 1336–1344. [Google Scholar] [CrossRef]
  64. Baek, G.; Lim, H.; Noh, N.J.; Kim, C. No impact of nitrogen fertilization on carbon sequestration in a temperatePinus densifloraforest. Sci. Rep. 2023, 13, 1743. [Google Scholar] [CrossRef] [PubMed]
Figure 1. Overview of the study area: (a) location of the study area; (b) Sentinel-2 MSI images and sampling locations; (c) sampling points in selected study areas from a drone perspective; (d) schematic diagram of the five-point sampling method, where each endpoint utilizes a sample circle method with a radius of 3.26 m.
Forests 15 00540 g001
Figure 2. Flowchart for determining the infestation level of Moso bamboo Phyllostachys pubescens syn. edulis (Poales: Poaceae) [44].
Forests 15 00540 g002
Figure 3. Schematic diagram of experimental steps.
Forests 15 00540 g003
Figure 4. Correlation between SLA and pest rating of Ph. pubescens leaves.
Forests 15 00540 g004
Figure 5. Analysis of the effect of SLA on the frequency of different pest levels.
Forests 15 00540 g005
Figure 6. Correlation between LDMC and pest rating of Ph. pubescens leaves.
Forests 15 00540 g006
Figure 7. Analysis of the effect of LDMC on the frequency of different pest levels.
Forests 15 00540 g007
Figure 8. Correlation between SLA and LDMC of Ph. pubescens leaves under different pest levels.
Forests 15 00540 g008
Figure 9. Correlation between SLA and canopy height of Ph. pubescens leaves.
Forests 15 00540 g009
Figure 10. Correlation between LDMC and canopy height of Ph. pubescens leaves.
Forests 15 00540 g010
Figure 11. Correlation between leaf SLA and LDMC in Ph. pubescens forests with different canopy heights.
Forests 15 00540 g011
Figure 12. Analysis of validation accuracy of four models under different pest levels.
Forests 15 00540 g012
Figure 13. Analysis of validation accuracy of four models at different canopy heights.
Forests 15 00540 g013
Table 1. Descriptive statistics for SLA of Ph. pubescens leaves under stress at different pest levels.
Dry Matter TypePest LevelsNumber of Leaves/PieceMean
(cm2/g)
SD
(cm2/g)
Min.
(cm2/g)
Max.
(cm2/g)
CV
(%)
SkewnessKurtosis
SLAFull sample835218.04154.39192.374389.6930.281.722.28
Healthy267230.64452.197126.721389.6930.230.530.23
Mild damage306229.11858.28292.374381.730.250.510.33
Middle damage188190.64634.261126.553300.680.180.760.62
Severe damage74150.99221.286114.152190.870.140.151.14
Note: significance level of Kolmogorov–Smirnov test (K-S test) is 0.01.
Table 2. Descriptive statistics for LDMC of Ph. pubescens leaves under stress at different pest levels.
Dry Matter TypePest LevelsNumber of Leaves/PieceMean
(g/g)
SD
(g/g)
Min.
(g/g)
Max.
(g/g)
CV
(%)
SkewnessKurtosis
LDMCFull sample8350.4510.0890.1980.6430.190.140.56
Healthy2670.4120.0910.1980.6430.210.390.07
Mild damage3060.4340.0840.2430.6290.180.050.56
Middle damage1880.5080.0530.3840.6220.100.130.19
Severe damage740.5120.0660.3730.6120.120.610.02
Note: significance level of Kolmogorov–Smirnov test (K-S test) is 0.01.
Table 3. Binary linear regression results for leaf samples at different canopy scales.
Evaluation IndicatorsRR2Adjusted R2Standard Deviation
Full sample0.728 a0.5300.5390.0670
Upper0.718 a0.5150.5130.0707
Middle0.750 a0.5630.5610.6497
Lower0.719 a0.5160.5150.6517
a predictor variable: (constant), SLA.
Table 4. Pearson’s correlation analysis of four models under different pest levels.
(R2, RMSE)Decision TreeRFXGBoostCatBoost
Full sample(0.658, 0.047)(0.704, 0.044)(0.597, 0.053)(0.588, 0.052)
Healthy(0.457, 0.027)(0.779, 0.025)(0.615, 0.053)(0.666, 0.031)
Mild damage(0.685, 0.039)(0.769, 0.035)(0.638, 0.051)(0.689, 0.041)
Moderate damage(0.874, 0.018)(0.884, 0.013)(0.531, 0.036)(0.816, 0.015)
Severe damage(0.649, 0.055)(0.285, 0.032)(0.484, 0.049)(0.649, 0.002)
Table 5. Pearson’s correlation analysis of four models at different canopy heights.
(R2, RMSE)Decision TreeRFXGBoostCatBoost
Full sample(0.658, 0.051)(0.704, 0.048)(0.597, 0.064)(0.588, 0.058)
Upper(0.913, 0.032)(0.886, 0.038)(0.687, 0.064)(0.832, 0.046)
Middle(0.917, 0.030)(0.913, 0.032)(0.623, 0.063)(0.874, 0.038)
Bottom(0.870, 0.038)(0.885, 0.036)(0.693, 0.046)(0.823, 0.045)
Disclaimer/Publisher’s Note: The statements, opinions and data contained in all publications are solely those of the individual author(s) and contributor(s) and not of MDPI and/or the editor(s). MDPI and/or the editor(s) disclaim responsibility for any injury to people or property resulting from any ideas, methods, instructions or products referred to in the content.

