
Residents’ Willingness to Pay for Forest Ecosystem Services Based on Forest Ownership Classification in South Korea


Abstract
1. Introduction
1.1. The Tragedy of the Commons
1.2. Ecosystem Services Valuation
2. Materials and Methods
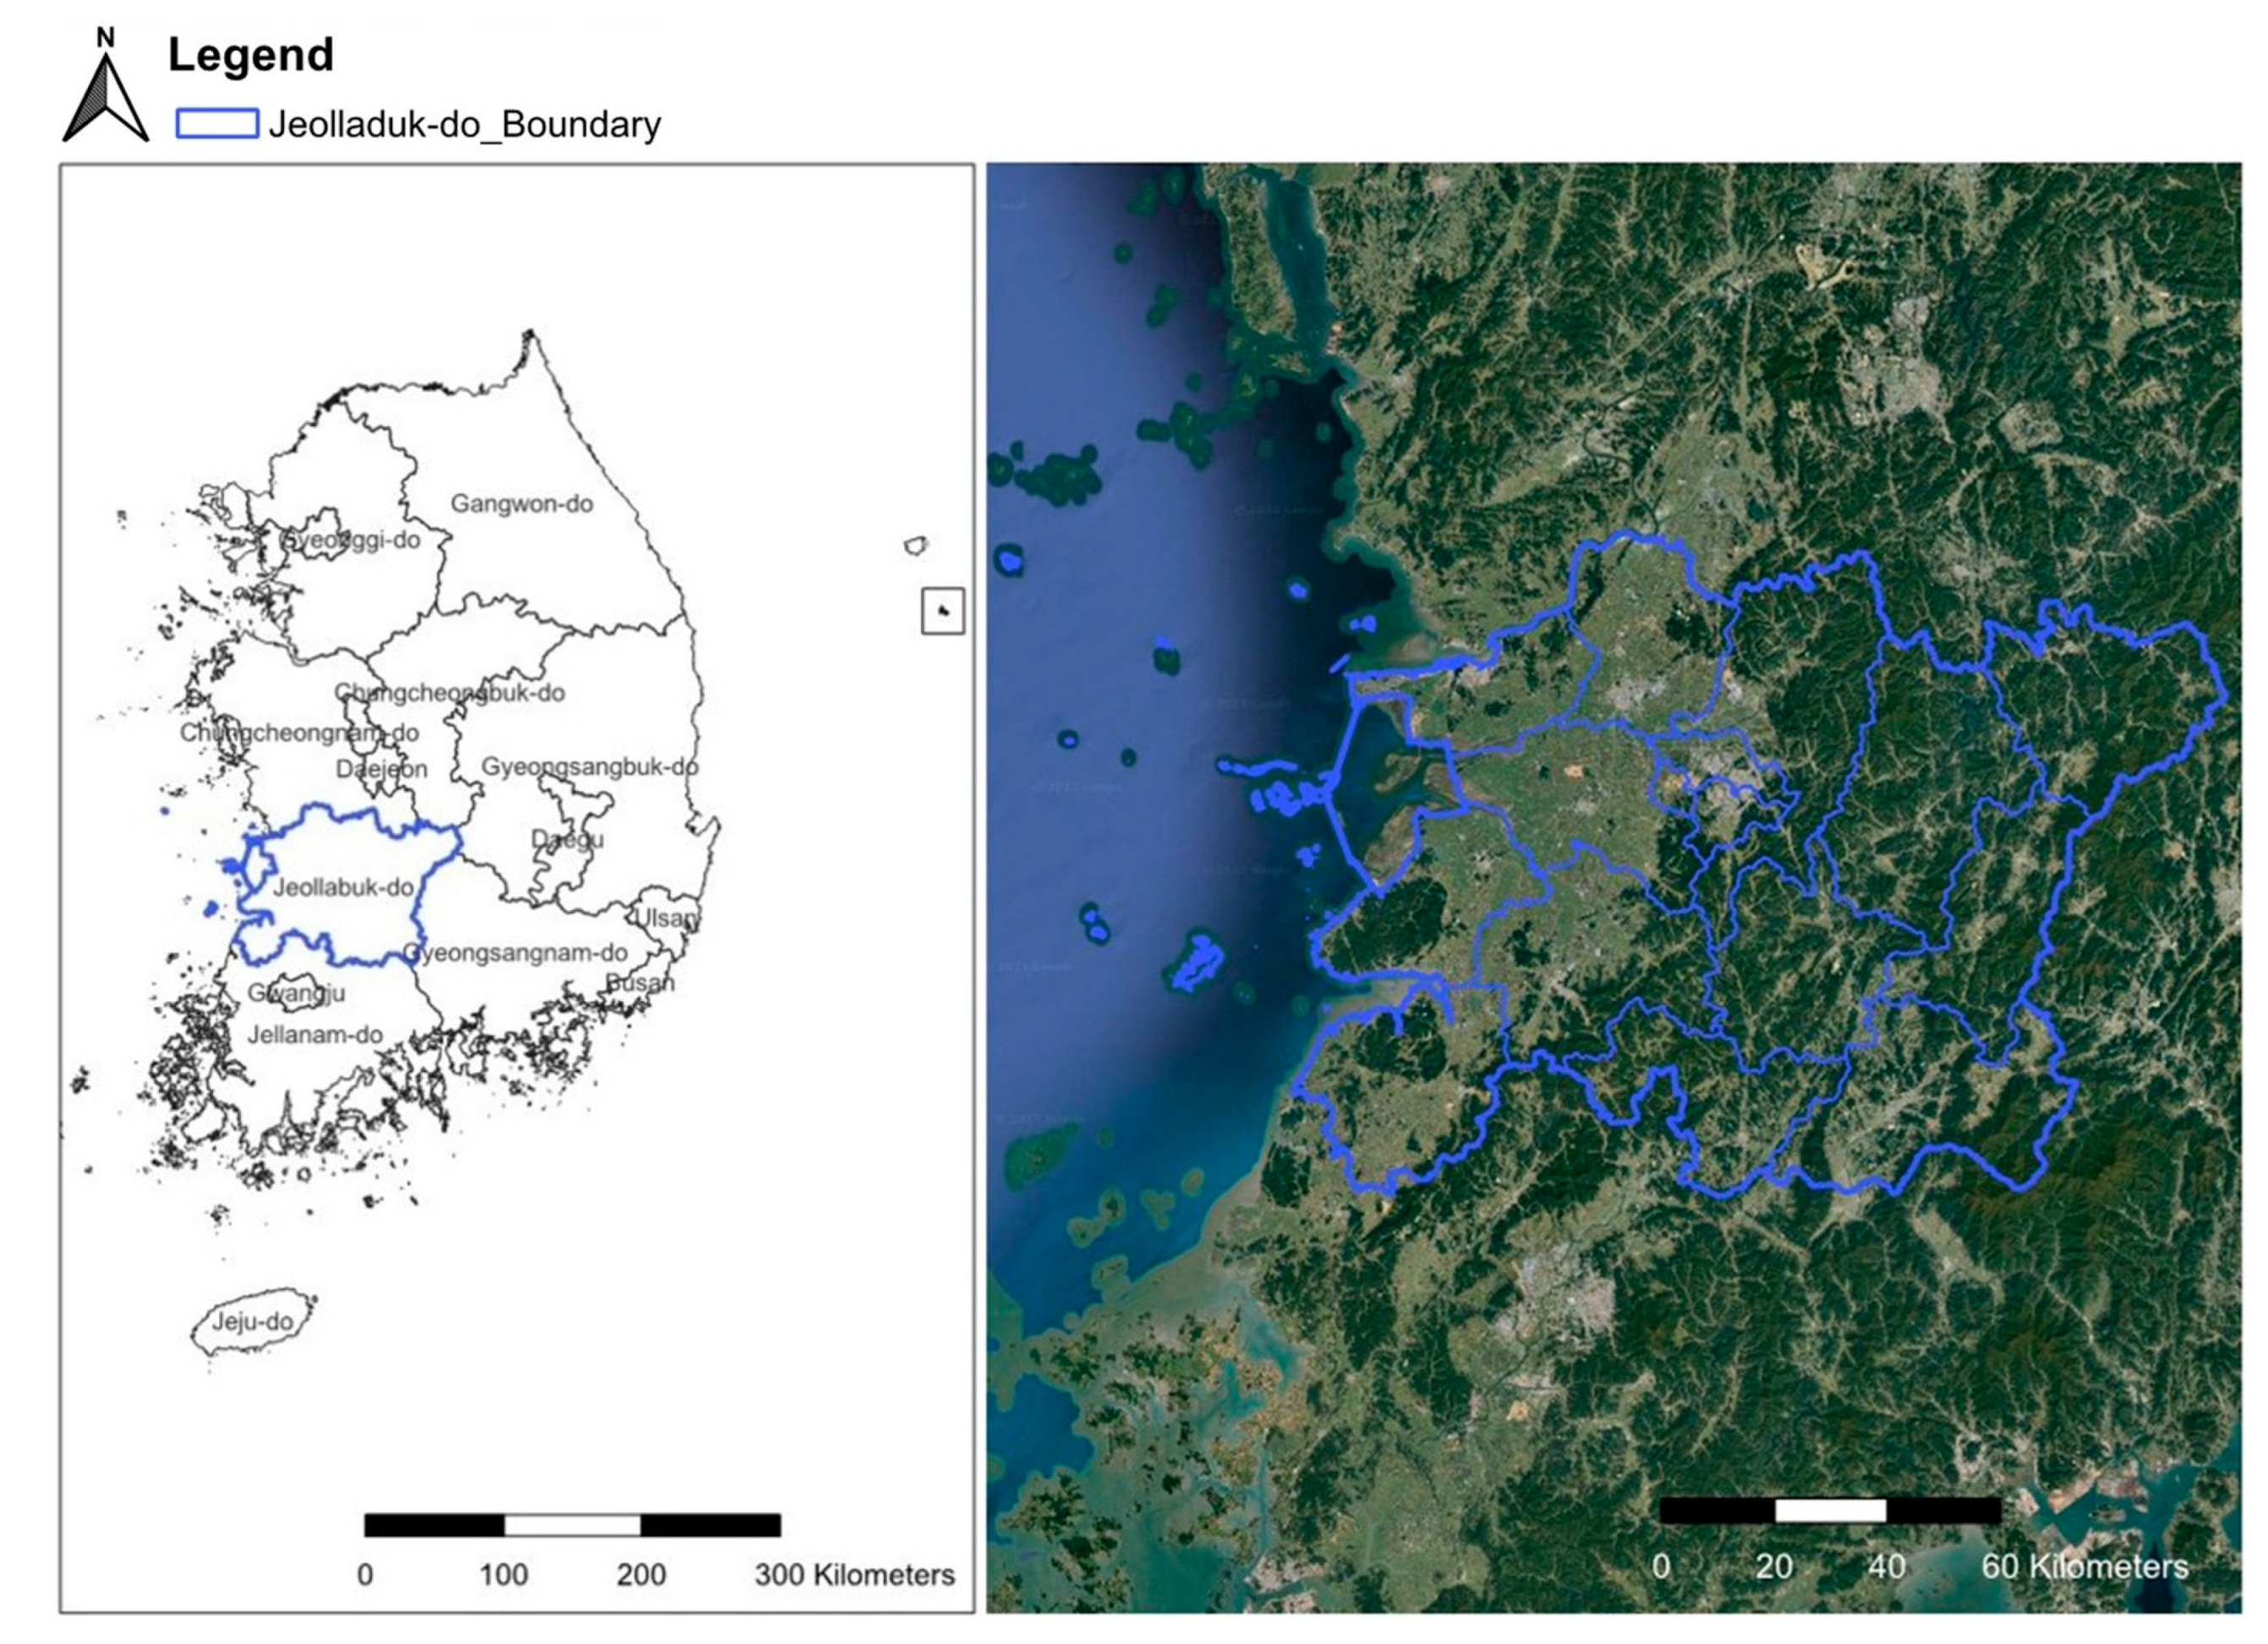
2.1. Study Site
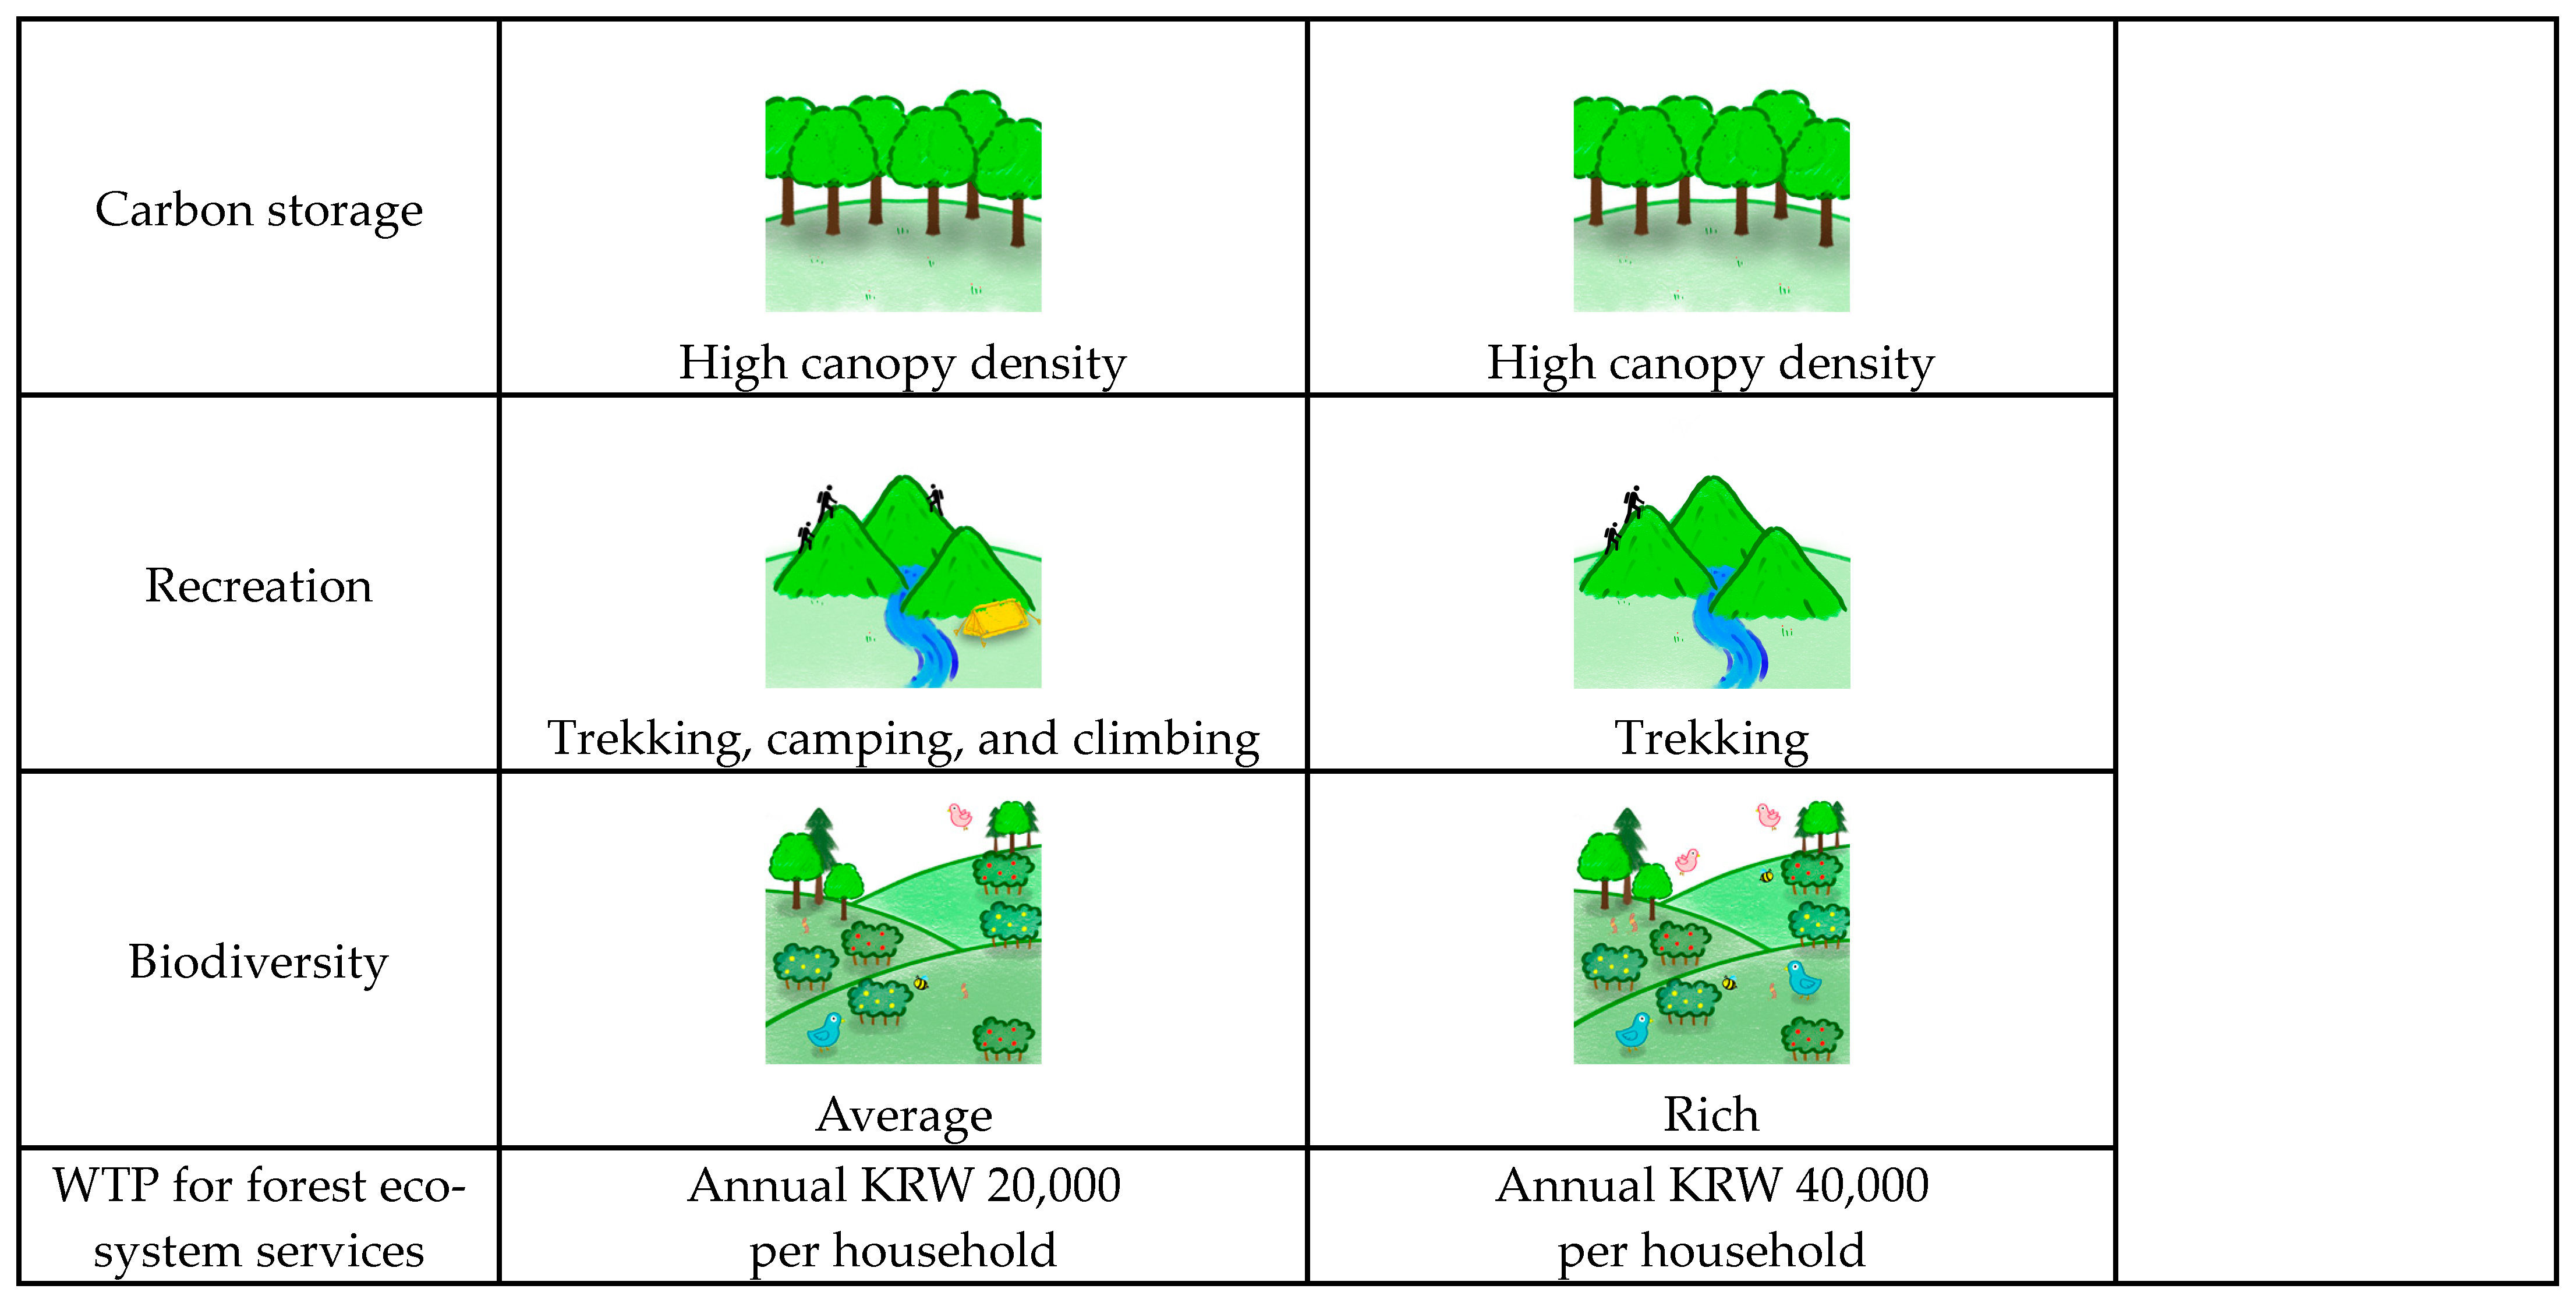
2.2. Choice Experiment
2.2.1. Survey Design
2.2.2. Choice Experiment Theoretical Model
3. Results
3.1. Characteristics of Respondents
3.2. Results of Estimation
4. Discussion
4.1. National/Public Forest Ecosystem Services
4.2. Private Forest Ecosystem Services
5. Conclusions
Author Contributions
Funding
Data Availability Statement
Conflicts of Interest
References
- FAO; UNEP. The State of the World’s Forests 2020: Forests, Biodiversity and People; Food and Agriculture Organization of the United Nations: Rome, Italy, 2020. [Google Scholar]
- Jin, X.; Ma, J.; Cai, T.; Sun, X. Non-use Value Assessment for Wetland Ecosystem Service of Hongxing National Nature Reserve in Northeast China. J. For. Res. 2016, 27, 1435–1442. [Google Scholar] [CrossRef]
- Siiskonen, H. The Conflict between Traditional and Scientific Forest Management in 20th Century Finland. For. Ecol. Manag. 2007, 249, 125–133. [Google Scholar] [CrossRef]
- Kumagai, J.; Wakamatsu, M.; Hashimoto, S.; Saito, O.; Yoshida, T.; Yamakita, T.; Hori, K.; Matsui, T.; Oguro, M.; Aiba, M. Natural Capital for Nature’s Contributions to People: The Case of Japan. Sustain. Sci. 2021, 6, 5162–5186. [Google Scholar] [CrossRef]
- Park, M.S.; Lee, H. Forest Policy and Law for Sustainability within the Korean Peninsula. Sustainability 2014, 6, 5162–5186. [Google Scholar] [CrossRef]
- Builan, G. The Multilocality of Satoyama. Landscape, Cultural Heritage and Environmental Sustainability in Japan; Ca’foscari Japanese Studies: Venezia, Italy, 2021. [Google Scholar] [CrossRef]
- Li, Y.; Mei, B.; Linhares-Juvenal, T. The Economic Contribution of the World’s Forest Sector. For. Policy Econ. 2019, 100, 236–253. [Google Scholar] [CrossRef]
- Korea Forest Service. Statistical Yearbook of Forestry; Korea Forest Service: Seoul, Republic of Korea, 2022. [Google Scholar]
- Korea Forest Service. 2020 Forest Statistics; Korea Forest Service: Seoul, Republic of Korea, 2021. [Google Scholar]
- De Groot, R.S.; Wilson, M.A.; Boumans, R.M. A Typology for the Classification, Description and Valuation of Ecosystem Functions, Goods and Services. Ecol. Econ. 2002, 41, 393–408. [Google Scholar] [CrossRef]
- Maes, J.; Liquete, C.; Teller, A.; Erhard, M.; Paracchini, M.L.; Barredo, J.I.; Grizzetti, B.; Cardoso, A.; Somma, F.; Petersen, J. An Indicator Framework for Assessing Ecosystem Services in Support of the EU Biodiversity Strategy to 2020. Ecosyst. Serv. 2016, 17, 14–23. [Google Scholar] [CrossRef]
- Costanza, R.; d’Arge, R.; De Groot, R.; Farber, S.; Grasso, M.; Hannon, B.; Limburg, K.; Naeem, S.; O’neill, R.V.; Paruelo, J. The Value of the World’s Ecosystem Services and Natural Capital. Nature 1997, 387, 253–260. [Google Scholar] [CrossRef]
- Daily, G.C. Introduction: What Are Ecosystem Services; Island Press: Washington, DC, USA, 1997. [Google Scholar]
- Millennium Ecosystem Assessment. Ecosystems and Human Well-Being; Island Press: Washington, DC, USA, 2005. [Google Scholar]
- Khan, A.; Khan, S.U.; Ali, M.A.S.; Khan, A.A.; Zhao, M. Prioritizing Stakeholders’ Preferences for Policy Scenarios of Vul-nerable Ecosystems with Spatial Heterogeneity in Choice Experiment: Coupling Stated Preferences with Elevation. J. Environ. Manag. 2022, 310, 114757. [Google Scholar] [CrossRef]
- Tian, N.; Poudyal, N.C.; Hodges, D.G.; Young, T.M.; Hoyt, K.P. Understanding the Factors Influencing Nonindustrial Private Forest Landowner Interest in Supplying Ecosystem Services in Cumberland Plateau, Tennessee. Forests 2015, 6, 3985–4000. [Google Scholar] [CrossRef]
- Castro, A.J.; Vaughn, C.C.; Julian, J.P.; García-Llorente, M. Social Demand for Ecosystem Services and Implications for Wa-tershed Management. JAWRA J. Am. Water Resour. Assoc. 2016, 52, 209–221. [Google Scholar] [CrossRef]
- Jo, J.H.; Choi, M.; Shin, S.; Lee, C. Navigating Nature’s Benefits to People: An Examination of Asymmetrical Stakeholder Preferences for Local Forest Ecosystem Services in South Korea. Forestry 2023, 96, 277–292. [Google Scholar] [CrossRef]
- An, H.; Seok, H.D.; Lee, S.; Choi, J. Forest Management Practice for Enhancing Carbon Sequestration in National Forests of Korea. For. Sci. Technol. 2019, 15, 80–91. [Google Scholar] [CrossRef]
- Vondolia, G.K.; Navrud, S. Are Non-Monetary Payment Modes More Uncertain for Stated Preference Elicitation in Developing Countries? J. Choice Model. 2019, 30, 73–87. [Google Scholar] [CrossRef]
- Thompson, D.W.; Hansen, E.N. Factors Affecting the Attitudes of Nonindustrial Private Forest Landowners regarding Carbon Sequestration and Trading. J. For. 2012, 110, 129–137. [Google Scholar] [CrossRef]
- De Juan, S.; Gelcich, S.; Fernandez, M. Integrating Stakeholder Perceptions and Preferences on Ecosystem Services in the Management of Coastal Areas. Ocean Coast. Manag. 2017, 136, 38–48. [Google Scholar] [CrossRef]
- Quyen, N.T.K.; Berg, H.; Gallardo, W.; Da, C.T. Stakeholders’ Perceptions of Ecosystem Services and Pangasius Catfish Farming Development along the Hau River in the Mekong Delta, Vietnam. Ecosyst. Serv. 2017, 25, 2–14. [Google Scholar] [CrossRef]
- Lapointe, M.; Cumming, G.S.; Gurney, G.G. Comparing Ecosystem Service Preferences between Urban and Rural Dwellers. Bioscience 2019, 69, 108–116. [Google Scholar] [CrossRef]
- McDermott, C.L.; Cashore, B.; Kanowski, P. Setting the Bar: An International Comparison of Public and Private Forest Policy Specifications and Implications for Explaining Policy Trends. Environ. Sci. 2009, 6, 217–237. [Google Scholar] [CrossRef]
- Kumar, S.; Kant, S. Exploded Logit Modeling of Stakeholders’ Preferences for Multiple Forest Values. For. Policy Eco-Nomics 2007, 9, 516–526. [Google Scholar] [CrossRef]
- Edwards, D.; Jay, M.; Jensen, F.S.; Lucas, B.; Marzano, M.; Montagné, C.; Peace, A.; Weiss, G. Public Preferences for Structural Attributes of Forests: Towards a Pan-European Perspective. For. Policy Econ. 2012, 19, 12–19. [Google Scholar] [CrossRef]
- Hardin, G. The Tragedy of the Commons: The Population Problem has no Technical Solution; it Requires a Fundamental Extension in Morality. Science 1968, 162, 1243–1248. [Google Scholar] [CrossRef]
- Rana, M.S.; Mousumi, M. Role of Institutions in Natural Resource Management (NRM): The Nexus between Natural Resources and Conflict. Acad. Lett. 2021, 2, 2517. [Google Scholar] [CrossRef]
- Saijo, T.; Yamato, T. A Voluntary Participation Game with a Non-Excludable Public Good. J. Econ. Theory 1999, 84, 227–242. [Google Scholar] [CrossRef]
- Kotchen, M. Public Goods. Environmental and Natural Resource Economics: An Encyclopedia; Greenwood Publishing Group: Westport, CT, USA, 2014. [Google Scholar]
- Forster, J. The Creation, Maintenance and Governance of Public Goods and Free Goods. Public Manag. Int. J. Res. Theory 1999, 1, 313–327. [Google Scholar] [CrossRef]
- Hardin, G. The Tragedy of the Unmanaged Commons. Trends Ecol. Evol. 1994, 9, 199. [Google Scholar] [CrossRef] [PubMed]
- Orbell, J.M.; Dawes, R.M. Social Welfare, Cooperators’ Advantage, and the Option of Not Playing the Game. Am. Sociol. Rev. 1993, 58, 787–800. [Google Scholar] [CrossRef]
- Rand, D.G.; Nowak, M.A. The Evolution of Antisocial Punishment in Optional Public Goods Games. Nat. Commun. 2011, 2, 434. [Google Scholar] [CrossRef] [PubMed]
- Gross, J.; De Dreu, C.K. Individual Solutions to Shared Problems Create a Modern Tragedy of the Commons. Sci. Adv. 2019, 5, eaau7296. [Google Scholar] [CrossRef] [PubMed]
- Partelow, S.; Abson, D.; Schlüter, A.; Fernández-Giménez, M.; von Wehrden, H.; Collier, N. Privatizing the Commons: New Approaches Need Broader Evaluative Criteria for Sustainability. Int. J. Commons 2019, 13, 747–776. [Google Scholar] [CrossRef]
- Ostrom, E. Governing the Commons: The Evolution of Institutions for Collective Action; Cambridge University Press: Cambridge, UK, 1990. [Google Scholar]
- Ostrom, E. A Behavioral Approach to the Rational Choice Theory of Collective Action: Presidential Address, American Po-litical Science Association, 1997. Am. Political Sci. Rev. 1998, 92, 1–22. [Google Scholar] [CrossRef]
- Ostrom, E. Institutional Arrangements for Resolving the Commons Dilemma: Some Contending Approaches; ICS Press: San Francisco, CA, USA, 1988. [Google Scholar]
- Buffum, B. Why is there no Tragedy in these Commons? An Analysis of Forest User Groups and Forest Policy in Bhutan. Sustainability 2012, 4, 1448–1465. [Google Scholar] [CrossRef]
- De Groot, R.; Brander, L.; Van Der Ploeg, S.; Costanza, R.; Bernard, F.; Braat, L.; Christie, M.; Crossman, N.; Ghermandi, A.; Hein, L. Global Estimates of the Value of Ecosystems and Their Services in Monetary Units. Ecosyst. Serv. 2012, 1, 50–61. [Google Scholar] [CrossRef]
- Baciu, G.E.; Dobrotă, C.E.; Apostol, E.N. Valuing Forest Ecosystem Services. Why is an Integrative Approach Needed? Forests 2021, 12, 677. [Google Scholar] [CrossRef]
- Bateman, I.; Department of Transport Großbritannien. Economic Valuation with Stated Preference Techniques: A Manual; Ed-Ward Elgar Publishing: Cheltenham, UK, 2002. [Google Scholar]
- Menzel, S.; Bögeholz, S. Values, Beliefs and Norms that Foster Chilean and German Pupils’ Commitment to Protect Biodiversity. Int. J. Environ. Sci. Educ. 2010, 5, 31–49. [Google Scholar]
- Jones-Walters, L.; Mulder, I. Valuing Nature: The Economics of Biodiversity. J. Nat. Conserv. 2009, 17, 245–247. [Google Scholar] [CrossRef]
- Kopp, R.J. Why Existence Value should be used in Cost-Benefit Analysis. J. Policy Anal. Manag. 1992, 11, 123–130. [Google Scholar] [CrossRef]
- Fisher, B.; Turner, R.K.; Morling, P. Defining and Classifying Ecosystem Services for Decision Making. Ecol. Econ. 2009, 68, 643–653. [Google Scholar] [CrossRef]
- Dunford, R.; Harrison, P.; Smith, A.; Dick, J.; Barton, D.N.; Martin-Lopez, B.; Kelemen, E.; Jacobs, S.; Saarikoski, H.; Turkel-boom, F. Integrating Methods for Ecosystem Service Assessment: Experiences from Real World Situations. Ecosyst. Serv. 2018, 29, 499–514. [Google Scholar] [CrossRef]
- Resende, F.M.; Fernandes, G.W.; Andrade, D.C.; Néder, H.D. Economic Valuation of the Ecosystem Services Provided by a Protected Area in the Brazilian Cerrado: Application of the Contingent Valuation Method. Braz. J. Biol. 2017, 77, 762–773. [Google Scholar] [CrossRef]
- Ghermandi, A. Integrating Social Media Analysis and Revealed Preference Methods to Value the Recreation Services of Ecologically Engineered Wetlands. Ecosyst. Serv. 2018, 31, 351–357. [Google Scholar] [CrossRef]
- Venkatachalam, L. The Contingent Valuation Method: A Review. Environ. Impact Assess. Rev. 2004, 24, 89–124. [Google Scholar] [CrossRef]
- Hanley, N.; MacMillan, D.; Wright, R.E.; Bullock, C.; Simpson, I.; Parsisson, D.; Crabtree, B. Contingent Valuation Versus Choice Experiments: Estimating the Benefits of Environmentally Sensitive Areas in Scotland. J. Agric. Econ. 1998, 49, 1–15. [Google Scholar] [CrossRef]
- Jo, J.H.; Park, S.H.; Koo, J.C.; Roh, T.; Emily, M.L.; Youn, Y.C. Preferences for Ecosystem Services Provided by Urban Forests in South Korea. For. Sci. Technol. 2020, 16, 86–103. [Google Scholar] [CrossRef]
- Tahvanainen, L.; Tyrväinen, L.; Ihalainen, M.; Vuorela, N.; Kolehmainen, O. Forest Management and Public Perceptions—Visual Versus Verbal Information. Landsc. Urban Plann. 2001, 53, 53–70. [Google Scholar] [CrossRef]
- Kuvan, Y.; Akan, P. Residents’ Attitudes Toward General and Forest-Related Impacts of Tourism: The Case of Belek, Antalya. Tour. Manag. 2005, 26, 691–706. [Google Scholar] [CrossRef]
- Jeonju University-Industry Cooperation Foundation. 2022 Jeollabuk-do Social Survey Report; Jeonju University-Industry Cooperation Foundation: Jeonju, Republic of Korea, 2022. [Google Scholar]
- Korea Forest Service. The 7th National Forest Resource Survey Report; Korea Forest Service: Jeonju, Republic of Korea, 2022. [Google Scholar]
- Jeonbuk Institute. Jeollabuk-do Mountainous Resource Specialization Plan; Jeonbuk Institute: Jeonju, Republic of Korea, 2017. [Google Scholar]
- Louviere, J.J. Choice Experiments: An Overview of Concepts and Issues; Edward Elgar Publishing: Cheltenham, UK, 2001. [Google Scholar] [CrossRef]
- Koo, J.C.; Park, M.S.; Youn, Y.C. Preferences of Urban Dwellers on Urban Forest Recreational Services in South Korea. Urban For. Urban Green. 2013, 12, 200–210. [Google Scholar] [CrossRef]
- Statistics Korea. Population Census. Statistics; Statistics Korea: Seoul, Republic of Korea, 2023. [Google Scholar]
- National Institute of Forest Science. Assessment of Forest Public Benefit Functions; National Institute of Forest Science: Seoul, Republic of Korea, 2020. [Google Scholar]
- Swank, W.T.; Douglass, J.E. Streamflow Greatly Reduced by Converting Deciduous Hardwood Stands to Pine. Science 1974, 185, 857–859. [Google Scholar] [CrossRef]
- Breil, M.; Weber, A.; Pinto, J.G. The Potential of an Increased Deciduous Forest Fraction to Mitigate the Effects of Heat Extremes in Europe. Biogeosciences 2023, 20, 2237–2250. [Google Scholar] [CrossRef]
- Nepal, P.; Johnston, C.M.; Ganguly, I. Effects on Global Forests and Wood Product Markets of Increased Demand for Mass Timber. Sustainability 2021, 13, 13943. [Google Scholar] [CrossRef]
- FAO. Global Forest Resources Assessment 2000; Food and Agriculture Organization of the United Nations: Rome, Italy, 2001. [Google Scholar]
- Colombo, S.; Hanley, N.; Calatrava-Requena, J. Designing Policy for Reducing the Off-farm Effects of Soil Erosion using Choice Experiments. J. Agric. Econ. 2005, 56, 81–95. [Google Scholar] [CrossRef]
- Pregitzer, C.C.; Hanna, C.; Charlop-Powers, S.; Bradford, M.A. Estimating Carbon Storage in Urban Forests of New York City. Urban Ecosyst. 2022, 25, 617–631. [Google Scholar] [CrossRef]
- Nowak, D.J.; Crane, D.E. Carbon Storage and Sequestration by Urban Trees in the USA. Environ. Pollut. 2002, 116, 381–389. [Google Scholar] [CrossRef]
- Hardiman, B.S.; Gough, C.M.; Halperin, A.; Hofmeister, K.L.; Nave, L.E.; Bohrer, G.; Curtis, P.S. Maintaining High Rates of Carbon Storage in Old Forests: A Mechanism Linking Canopy Structure to Forest Function. For. Ecol. Manag. 2013, 298, 111–119. [Google Scholar] [CrossRef]
- Meyer, V.; Saatchi, S.; Clark, D.B.; Keller, M.; Vincent, G.; Ferraz, A.; Espírito-Santo, F.; d’Oliveira, M.V.; Kaki, D.; Chave, J. Canopy Area of Large Trees Explains Aboveground Biomass Variations Across Neotropical Forest Landscapes. Biogeosciences 2018, 15, 3377–3390. [Google Scholar] [CrossRef]
- Shin, Y.J.; Park, S.J.; Park, C.R. Valuation of Cultural Ecosystem Services using the Choice Experiment Method (CE). Sanrim Hyu’yang Yeon’gu 2016, 20, 65–77. [Google Scholar] [CrossRef]
- Mohneke, M.; Erguvan, F.; Schlüter, K. Explorative Study about Knowledge of Species in the Field of Early Years Education. J. Emergent. Sci. 2016, 11, 1–234. [Google Scholar]
- Hooykaas, M.J.; Schilthuizen, M.; Smeets, I. Expanding the Role of Biodiversity in Laypeople’s Lives: The View of Communicators. Sustainability 2020, 12, 2768. [Google Scholar] [CrossRef]
- Vanhöfen, J.; Schöffski, N.; Härtel, T.; Randler, C. Are Lay People Able to Estimate Breeding Bird Diversity? Animals 2022, 12, 3095. [Google Scholar] [CrossRef] [PubMed]
- Breitschopf, E.; Bråthen, K.A. Perception and Appreciation of Plant Biodiversity among Experts and Laypeople. People Nat. 2023, 5, 826–838. [Google Scholar] [CrossRef]
- Jo, J.; Lee, C.; Cho, H.; Lee, J. Estimation of Citizens’ Willingness to Pay for the Implementation of Payment for Local Forest Ecosystem Services: The Case of Taxes and Donations. Sustainability 2021, 13, 6186. [Google Scholar] [CrossRef]
- Yu, Y.; Wang, E.; Wang, Z. Valuing Nonuse Value of a National Forest Park with Consideration of the Local Residents’ En-vironmental Attitudes. Forests 2023, 14, 1487. [Google Scholar] [CrossRef]
- Moeltner, K.; Fanara, T.; Foroutan, H.; Hanlon, R.; Lovko, V.; Ross, S.; Schmale, D., III. Harmful Algal Blooms and Toxic Air: The Economic Value of Improved Forecasts. Mar. Resour. Econ. 2023, 38, 1–28. [Google Scholar] [CrossRef]
- Mangham, L.J.; Hanson, K.; McPake, B. How to do (or Not to do) … Designing a Discrete Choice Experiment for Application in a Low-Income Country. Health Policy Plan 2009, 24, 151–158. [Google Scholar] [CrossRef]
- Marshall, D.; Bridges, J.F.; Hauber, B.; Cameron, R.; Donnalley, L.; Fyie, K.; Reed Johnson, F. Conjoint Analysis Applications in Health—How are Studies being Designed and Reported? An Update on Current Practice in the Published Literature between 2005 and 2008. Patient Patient-Centered Outcomes Res. 2010, 3, 249–256. [Google Scholar] [CrossRef]
- Phelps, R.H.; Shanteau, J. Livestock Judges: How Much Information can an Expert use? Organ. Behav. Hum. Perform. 1978, 21, 209–219. [Google Scholar] [CrossRef]
- Szinay, D.; Cameron, R.; Naughton, F.; Whitty, J.A.; Brown, J.; Jones, A. Understanding Uptake of Digital Health Products: Methodology Tutorial for a Discrete Choice Experiment using the Bayesian Efficient Design. J. Med. Internet Res. 2021, 23, e32365. [Google Scholar] [CrossRef]
- Ratcliffe, J.; Longworth, L. Investigating the Structural Reliability of a Discrete Choice Experiment within Health Technology Assessment. Int. J. Technol. Assess. Health Care 2002, 18, 139–144. [Google Scholar]
- Green, P.E. On the Design of Choice Experiments Involving Multifactor Alternatives. J. Consum. Res. 1974, 1, 61–68. [Google Scholar] [CrossRef]
- Alamri, A.S.; Georgiou, S.; Stylianou, S. Discrete Choice Experiments: An Overview on Constructing D-optimal and Near-optimal Choice Sets. Heliyon 2023, 9, e18256. [Google Scholar] [CrossRef]
- Rolfe, J.; Bennett, J. The Impact of Offering Two Versus Three Alternatives in Choice Modelling Experiments. Ecol. Econ. 2009, 68, 1140–1148. [Google Scholar] [CrossRef]
- Patterson, Z.; Darbani, J.M.; Rezaei, A.; Zacharias, J.; Yazdizadeh, A. Comparing Text-only and Virtual Reality Discrete Choice Experiments of Neighbourhood Choice. Landsc. Urban Plann. 2017, 157, 63–74. [Google Scholar] [CrossRef]
- Bateman, I.J.; Day, B.H.; Jones, A.P.; Jude, S. Reducing Gain–loss Asymmetry: A Virtual Reality Choice Experiment Valuing Land use Change. J. Environ. Econ. Manag. 2009, 58, 106–118. [Google Scholar] [CrossRef]
- Matthews, Y.; Scarpa, R.; Marsh, D. Using Virtual Environments to Improve the Realism of Choice Experiments: A Case Study about Coastal Erosion Management. J. Environ. Econ. Manag. 2017, 81, 193–208. [Google Scholar] [CrossRef]
- Shr, Y.J.; Ready, R.; Orland, B.; Echols, S. How do Visual Representations Influence Survey Responses? Evidence from a Choice Experiment on Landscape Attributes of Green Infrastructure. Ecol. Econ. 2019, 156, 375–386. [Google Scholar] [CrossRef]
- Train, K.E. Discrete Choice Methods with Simulation; Cambridge University Press: Cambridge, UK, 2009. [Google Scholar] [CrossRef]
- McFadden, D. A Conditional Logit Analysis of Qualitative Behavior; Academic Press: Cambridge, UK, 1973. [Google Scholar]
- Hanemann, W.M. Discrete/Continuous Models of Consumer Demand. Econom. J. Econom. Soc. 1984, 52, 541–561. [Google Scholar] [CrossRef]
- Lancaster, K.J. A New Approach to Consumer Theory. J. Political Econ. 1966, 74, 132–157. [Google Scholar] [CrossRef]
- Aizaki, H.; Nakatani, T.; Sato, K. Stated Preference Methods Using R; CRC Press: Boca Raton, FL, USA, 2014. [Google Scholar] [CrossRef]
- Fowler, F.J., Jr. Survey Research Methods; Sage Publications: Thousand Oaks, CA, USA, 2013. [Google Scholar]
- Dillman, D.A.; Christenson, J.A.; Carpenter, E.H.; Brooks, R.M. Increasing Mail Questionnaire Response: A Four State Comparison. Am. Sociol. Rev. 1974, 39, 744–756. [Google Scholar] [CrossRef]
- O’Hare, W.P. 2020 Census Faces Challenges in Rural America; The Carsey School of Public Policy at the Scholars’s Repository; The University of New Hampshire: Durham, NH, USA, 2018; Volume 330. [Google Scholar] [CrossRef]
- Aizaki, H. Basic Functions for Supporting an Implementation of Choice Experiments in R. J. Stat. Softw. 2012, 50, 1–24. [Google Scholar] [CrossRef]
- Duncker, P.S.; Barreiro, S.M.; Hengeveld, G.M.; Lind, T.; Mason, W.L.; Ambrozy, S.; Spiecker, H. Classification of Forest Management Approaches: A New Conceptual Framework and Its Applicability to European Forestry. Ecol. Soc. 2012, 17, 4. [Google Scholar] [CrossRef]
- Duncker, P.S.; Raulund-Rasmussen, K.; Gundersen, P.; Katzensteiner, K.; De Jong, J.; Ravn, H.P.; Smith, M.; Eckmüllner, O.; Spiecker, H. How Forest Management Affects Ecosystem Services, Including Timber Production and Economic Return: Syn-ergies and Trade-Offs. Ecol. Soc. 2012, 17, 4. [Google Scholar] [CrossRef]
- Aquilué, N.; Messier, C.; Martins, K.T.; Dumais-Lalonde, V.; Mina, M. A Simple-to-use Management Approach to Boost Adaptive Capacity of Forests to Global Uncertainty. For. Ecol. Manag. 2021, 481, 118692. [Google Scholar] [CrossRef]
- Han, Z.Y.; Youn, Y.C. Beijing Resident’s Preferences of Ecosystem Services of Urban Forests. Forests 2020, 12, 14. [Google Scholar] [CrossRef]
- Shoyama, K.; Managi, S.; Yamagata, Y. Public Preferences for Biodiversity Conservation and Climate-Change Mitigation: A Choice Experiment using Ecosystem Services Indicators. Land Use Policy 2013, 34, 282–293. [Google Scholar] [CrossRef]
- Müller, F.; Fohrer, N.; Chicharo, L. The Basic Ideas of the Ecosystem Service Concept. In Ecosystem Services and River Basin Ecohydrology; Springer: Berlin/Heidelberg, Germany, 2015; pp. 7–33. [Google Scholar] [CrossRef]
- Rands, M.R.; Adams, W.M.; Bennun, L.; Butchart, S.H.; Clements, A.; Coomes, D.; Entwistle, A.; Hodge, I.; Kapos, V.; Scharlemann, J.P. Biodiversity Conservation: Challenges beyond 2010. Science 2010, 329, 1298–1303. [Google Scholar] [CrossRef]
- Jacobsen, J.B.; Hanley, N. Are there Income Effects on Global Willingness to Pay for Biodiversity Conservation? Environ. Resour. Econ. 2009, 43, 137–160. [Google Scholar] [CrossRef]
- Yishay, A.B.; Fraker, A.; Guiteras, R.; Palloni, G.; Shah, N.B.; Shirrell, S.; Wang, P. Microcredit and Willingness to Pay for Environmental Quality: Evidence from a Randomized-Controlled Trial of Finance for Sanitation in Rural Cambodia. J. Environ. Econ. Manag. 2017, 86, 121–140. [Google Scholar] [CrossRef]
- Korea Forest Service. Landslide Information System; Korea Forest Service: Seoul, Republic of Korea, 2023. [Google Scholar]
- Chaturvedi, P.; Dutt, V. Evaluating the Public Perceptions of Landslide Risks in the Himalayan Mandi Town. Proc. Hum. Factors Ergon. Soc. Annu. Meet. 2015, 59, 1491–1495. [Google Scholar] [CrossRef]
- Liu, N.; Caldwell, P.V.; Dobbs, G.R.; Miniat, C.F.; Bolstad, P.V.; Nelson, S.A.; Sun, G. Forested Lands Dominate Drinking Water Supply in the Conterminous United States. Environ. Res. Lett. 2021, 16, 084008. [Google Scholar] [CrossRef]
- Ficko, A.; Lidestav, G.; Dhubháin, Á.N.; Karppinen, H.; Zivojinovic, I.; Westin, K. European Private Forest Owner Typologies: A Review of Methods and Use. For. Policy Econ. 2019, 99, 21–31. [Google Scholar] [CrossRef]
- Dwiyahreni, A.; Fuad, H.A.; Sunaryo, S.; Soesilo, T.E.B.; Margules, C.; Supriatna, J. Forest Cover Changes in Indonesia’s Terrestrial National Parks between 2012 and 2017. Biodiversitas J. Biol. Divers. 2021, 22, 3. [Google Scholar] [CrossRef]
- Mäkelä, A.; Minunno, F.; Kujala, H.; Kosenius, A.; Heikkinen, R.K.; Junttila, V.; Peltoniemi, M.; Forsius, M. Effect of Forest Management Choices on Carbon Sequestration and Biodiversity at National Scale. Ambio 2023, 52, 1737–1756. [Google Scholar] [CrossRef] [PubMed]
- Yang, H.; Song, W.; Moon, J. Mega-Events and Conflict: The Case of the 2018 Pyeongchang Winter Olympics. J. Qual. Assur. Hosp. Tour. 2019, 20, 552–571. [Google Scholar] [CrossRef]
- Steven, R.; Pickering, C.; Castley, J.G. A Review of the Impacts of Nature Based Recreation on Birds. J. Environ. Manag. 2011, 92, 2287–2294. [Google Scholar] [CrossRef] [PubMed]
- Evju, M.; Hagen, D.; Jokerud, M.; Olsen, S.L.; Selvaag, S.K.; Vistad, O.I. Effects of Mountain Biking Versus Hiking on Trails under Different Environmental Conditions. J. Environ. Manag. 2021, 278, 111554. [Google Scholar] [CrossRef] [PubMed]
- Moegenburg, S.M.; Levey, D.J. Prospects for Conserving Biodiversity in Amazonian Extractive Reserves. Ecol. Lett. 2002, 5, 320–324. [Google Scholar] [CrossRef]
- Albers, H.J.; Robinson, E. A Review of the Spatial Economics of Non-Timber Forest Product Extraction: Implications for Policy. Ecol. Econ. 2013, 92, 87–95. [Google Scholar] [CrossRef]
- Manning, R.; Valliere, W.; Minteer, B. Values, Ethics, and Attitudes toward National Forest Management: An Empirical Study. Soc. Nat. Resour. 1999, 12, 421–436. [Google Scholar] [CrossRef]
- Hirsch, F.; Schmithüsen, F.J. Private Forest Ownership in Europe; ETH Zurich: Zurich, Switzerland, 2010. [Google Scholar]
- Sotomayor, S.; Barbieri, C.; Wilhelm Stanis, S.; Aguilar, F.X.; Smith, J.W. Motivations for Recreating on Farmlands, Private Forests, and State or National Parks. Environ. Manag. 2014, 54, 138–150. [Google Scholar] [CrossRef]
- Farrell, E.P.; Führer, E.; Ryan, D.; Andersson, F.; Hüttl, R.; Piussi, P. European Forest Ecosystems: Building the Future on the Legacy of the Past. For. Ecol. Manag. 2000, 132, 5–20. [Google Scholar] [CrossRef]
- Levers, C.; Verkerk, P.J.; Müller, D.; Verburg, P.H.; Butsic, V.; Leitão, P.J.; Lindner, M.; Kuemmerle, T. Drivers of Forest Harvesting Intensity Patterns in Europe. For. Ecol. Manag. 2014, 315, 160–172. [Google Scholar] [CrossRef]
- Heinonen, T.; Pukkala, T.; Asikainen, A. Variation in Forest Landowners’ Management Preferences Reduces Timber Supply from Finnish Forests. Ann. For. Sci. 2020, 77, 31. [Google Scholar] [CrossRef]
- Carrus, G.; Panno, A.; Aragonés, J.I.; Marchetti, M.; Motta, R.; Tonon, G.; Sanesi, G. Public Perceptions of Forests Across Italy: An Exploratory National Survey. Iforest-Biogeosci. For. 2020, 13, 323. [Google Scholar] [CrossRef]
- Nordlund, A.; Westin, K. Forest Values and Forest Management Attitudes among Private Forest Owners in Sweden. Forests 2010, 2, 30–50. [Google Scholar] [CrossRef]
- Dissanayake, S.; Beyene, A.; Bluffstone, R.A.; Gebreegziabher, Z.; Martinsson, P.; Mekonnen, A.; Vieider, F.M. Preferences for REDD+ contract attributes in low-income countries: A choice experiment in Ethiopia. In World Bank Policy Research Working PAPER; World Bank: Washington DC, USA, 2015; p. 7296. [Google Scholar] [CrossRef]
- Rakatama, A.; Pandit, R.; Iftekhar, S.; Ma, C. Heterogeneous public preference for REDD+ projects under different forest management regimes. Land Use Policy 2018, 78, 266–277. [Google Scholar] [CrossRef]
- Grieg-Gran, M.; Mohammed, E.Y.; Nhantumbo, I. What People Want from REDD+: Assessing Local Views and Preferences; IIED Briefing Paper-International Institute for Environment and Development: London, UK, 2014; p. 17217. [Google Scholar]


| Attributes | Levels | References | |
|---|---|---|---|
| Provisioning | Water supply | Low: less than 25% of deciduous trees Medium: 25% to less than 75% of deciduous trees High: more than 75% of deciduous trees | [64,65,67] |
| Timber supply | Low: less than 25% of coniferous trees Medium: 25% to less than 75% of coniferous trees High: more than 75% of coniferous trees | [66,67] | |
| Non-timber forest products supply | Low: less than 25% of forest products and fruit trees planting Medium: 25% to less than 75% of forest products and fruit trees planting High: more than 75% of forest products and fruit trees planting | [54] | |
| Regulating | Erosion control | Low: area covered by the forest 33% Medium: area covered by the forest 66% High: area covered by the forest 99% | [68] |
| Carbon storage | Low: low canopy density (less than 40% canopy cover area by trees) Medium: medium canopy density (canopy cover area of 41~70%) High: high canopy density (more than 71% canopy cover area by trees) | [58,69,70] | |
| Cultural | Recreation | Low: trekking Medium: trekking, camping, and climbing High: trekking, camping, climbing, MTB, paragliding, etc. | [73] |
| Supporting | Biodiversity | Low: poor Medium: average High: high | [61] |
| Tax | WTP for forest ecosystem service (Tax) (KRW/household/year) | Low: KRW 10,000 (USD 7.68) Medium: KRW 20,000 (USD 15.37) Rich: KRW 40,000 (USD 30.74) | [54] |
| Status | Case Number (Person) | Proportion (%) | |||
|---|---|---|---|---|---|
| Survey link successfully sent | Received Survey link unchecked | 3387 | 81.1 | ||
| Received Survey link checked | Out | Not targeted subject | 83 | 2.0 | |
| Exceeded targeted subject | 154 | 3.7 | |||
| Incomplete response | 63 | 1.4 | |||
| Response completed | Untrustworthy data | 90 | 2.2 | ||
| Completed response | 400 | 9.6 | |||
| Total | 4177 | 100.0 | |||
| Category | Sample Size (%) | Proportion of Jeollabuk-do’s Total Population, as of 2020 (%) | ||
|---|---|---|---|---|
| Variables | Code | |||
| Age | 20s | 2 | 26.5 | 15.7 |
| 30s | 3 | 26.8 | 11.2 | |
| 40s | 4 | 26.8 | 10.0 | |
| 50s and above | 5 | 20.0 | 48.8 | |
| Sex | Male | 1 | 50.0 | 49.8 |
| Female | 2 | 50.0 | 51.1 | |
| Marriage | Single | 0 | 52.0 | 12.0 |
| Married | 1 | 48.0 | 88.0 | |
| Number of children | None | 0 | 15.5 | - |
| 1 | 1 | 13.3 | ||
| 2 | 2 | 16.8 | ||
| 3 above | 3 | 2.5 | ||
| Education | Less than middle school graduate | 1 | 0.8 | 48.1 |
| High school graduate | 2 | 12.3 | 29.2 | |
| Attending or graduated university | 3 | 73.0 | 21.0 | |
| Graduate school student or graduate degree holder | 4 | 14.0 | 1.7 | |
| Monthly household income | Less than KRW 1,000,000 | 0 | 6.3 | 21.7 |
| KRW 1,000,000 to less than KRW 2,000,000 | 1 | 5.5 | 18.3 | |
| KRW 2,000,000 to less than KRW 3,000,000 | 2 | 21.0 | 20.2 | |
| KRW 3,000,000 to less than KRW 4,000,000 | 3 | 16.8 | 14.7 | |
| KRW 4,000,000 to less than KRW 5,000,000 | 4 | 14.3 | 9.5 | |
| KRW 5,000,000 to less than KRW 6,000,000 | 5 | 14.3 | 6.4 | |
| KRW 6,000,000 to less than KRW 7,000,000 | 6 | 8.0 | 3.5 | |
| KRW 7,000,000 to less than KEW 8,000,000 | 7 | 6.3 | 1.8 | |
| KRW 8,000,000 or more | 8 | 7.8 | 3.9 | |
| Number of forest visits in the past year | None | 1 | 24.8 | - |
| More than once | 2 | 75.3 | ||
| Purpose of visit | Forestry activities | 1 | 0.3 | |
| Relaxation/walking | 2 | 46.5 | ||
| Nature experience(education) | 3 | 1.0 | ||
| Physical activity | 4 | 27.0 | ||
| Others | 5 | 0.5 | ||
| Ecosystem Service (Attributes) | Attributes and Levels | National/Public Forest (N) | Private Forest (P) | Hypothesis Testing (βN = βP) χ2 (1) |
|---|---|---|---|---|
| Alternative specific constant (ASC) | 1.302 *** | 1.568 *** | ||
| Water supply (Reference level: less than 25% of deciduous trees) | 25% to less than 75% of deciduous trees | 0.073 | 0.107 | 0.065 |
| More than 75% of deciduous trees | 0.468 *** | 0.183 * | 4.921 ** | |
| Timber supply (Reference level: less than 25% of coniferous trees) | 25% to less than 75% of coniferous trees | 0.000 | −0.084 | 0.437 |
| More than 75% of coniferous trees | 0.077 | 0.041 | 0.080 | |
| Non-timber forest product supply (Reference level: less than 25% of forest products and fruit tree planting) | 25% to less than 75% of forest products and fruit trees planting | −0.085 | 0.098 | 2.007 |
| More than 75% of forest products and fruit trees planting | −0.236 * | 0.207 * | 11.658 *** | |
| Erosion control (Reference level: area covered by the forest 33%) | Area covered by the forest 66% | 0.383 *** | 0.415 *** | 0.057 |
| Area covered by the forest 99% | 0.697 *** | 0.498 *** | 2.356 | |
| Carbon storage (Reference level: low canopy density) | Medium canopy density | 0.542 *** | 0.123 | 10.181 *** |
| High canopy density | 0.627 *** | 0.437 *** | 2.149 | |
| Recreation (Reference level: trekking) | Trekking, camping, and climbing | 0.226 * | 0.337 *** | 0.738 |
| Trekking, camping, climbing, MTB, paragliding, etc. | 0.194 * | 0.519 *** | 6.214 ** | |
| Biodiversity (Reference level: poor) | Average | 0.504 *** | 0.380 *** | 0.898 |
| Rich | 0.745 *** | 0.598 *** | 1.271 | |
| WTP for forest ecosystem service (Tax) (KRW/household/year) | −0.022*** | −0.015 *** |
| Ecosystem Service (Attributes) | Attributes and Levels | Coefficient | z | p > z | MWTP (Unit: Korean Won (KRW)) | ||
|---|---|---|---|---|---|---|---|
| Mean | 95% CI | ||||||
| Alternative specific constant (ASC) | 1.302 *** | 6.39 | 0.000 | ||||
| Water supply (Reference level: less than 25% of deciduous) | 25% to less than 75% of deciduous trees | 0.073 | 0.79 | 0.429 | 3339 | −5127 | 12,379 |
| More than 75% of deciduous trees | 0.468 *** | 5.13 | 0.000 | 21,271 | 12,446 | 33,170 | |
| Timber supply (Reference level: less than 25% of coniferous trees) | 25% to less than 75% of coniferous trees | 0.000 | 0.01 | 0.996 | 0.021 | −8405 | 8309 |
| More than 75% of coniferous trees | 0.077 | 0.84 | 0.401 | 3511 | −4745 | 12,317 | |
| Non-timber forest products supply (Reference level: less than 25% of forest products production and fruit tree planting) | 25% to less than 75% of forest products and fruit trees planting | −0.085 | −0.93 | 0.354 | −3855 | −12,420 | 4387 |
| More than 75% of forest products production and fruit trees planting | −0.236 * | −2.50 | 0.013 | −10,719 | −20,600 | −2207 | |
| Erosion control (Reference level: area covered by the forest 33%) | Area covered by the forest 66% | 0.383 *** | 4.04 | 0.000 | 17,421 | 8733 | 29,122 |
| Area covered by the forest 99% | 0.697 *** | 7.50 | 0.000 | 31,667 | 21,928 | 45,975 | |
| Carbon storage (Reference level: low canopy density) | Medium canopy density | 0.542 *** | 5.67 | 0.000 | 24,618 | 15,279 | 37,450 |
| High canopy density | 0.627 *** | 6.65 | 0.000 | 28,517 | 19,001 | 42,076 | |
| Recreation (Reference level: trekking) | Trekking, camping, and climbing | 0.226 * | 2.41 | 0.016 | 10,250 | 1947 | 20,301 |
| Trekking, camping, climbing, MTB, paragliding, etc. | 0.194 * | 2.09 | 0.036 | 8836 | 0.486 | 18,453 | |
| Biodiversity enhancement (Reference level: poor) | Average | 0.504 *** | 5.42 | 0.000 | 22,896 | 13,703 | 35,699 |
| Rich | 0.745 *** | 7.99 | 0.000 | 33,844 | 23,710 | 48,961 | |
| WTP for forest ecosystem service (Tax) (KRW/household/year) | −0.022 *** | −7.08 | 0.000 | ||||
| Ecosystem Service (Attributes) | Attributes and Levels | Coefficient | z | p > z | MWTP (Unit: Korean Won (KRW)) | ||
|---|---|---|---|---|---|---|---|
| Mean | 95% CI | ||||||
| Alternative specific constant (ASC) | 1.568 *** | 7.45 | 0.000 | ||||
| Water supply (Reference level: less than 25% of deciduous trees) | 25% to less than 75% of deciduous trees | 0.107 | 1.18 | 0.239 | 6902 | −4669 | 21,024 |
| More than 75% of deciduous trees | −0.183 * | 2.03 | 0.042 | 11,881 | 0.581 | 27,492 | |
| Timber supply (Reference level: less than 25% of coniferous trees) | 25% to less than 75% of coniferous trees | −0.084 | −0.93 | 0.351 | −5445 | −18,722 | 6198 |
| More than 75% of coniferous trees | 0.041 | 0.45 | 0.649 | 2648 | −9260 | 15,796 | |
| Non-timber forest products supply (Reference level: less than 25% of forest product production and fruit tree planting) | 25% to less than 75% of forest products and fruit trees planting | 0.098 | 1.08 | 0.282 | 6360 | −5628 | 20,058 |
| More than 75% of forest products production and fruit trees planting | 0.207 * | 2.33 | 0.020 | 13,408 | 1888 | 29,378 | |
| Erosion control (Reference level: area covered by the forest 33%) | Area covered by the forest 66% | 0.415 *** | 4.57 | 0.000 | 26,875 | 14,268 | 49,000 |
| Area covered by the forest 99% | 0.498 *** | 5.49 | 0.000 | 32,241 | 18,924 | 56,331 | |
| Carbon storage (Reference level: low canopy density) | Medium canopy density | 0.123 | 1.36 | 0.173 | 7952 | −3466 | 22,077 |
| High canopy density | 0.437 *** | 4.86 | 0.000 | 28,287 | 15,365 | 50,023 | |
| Recreation (Reference level: trekking) | Trekking, camping, and climbing | 0.337 *** | 3.73 | 0.000 | 21,846 | 10,066 | 40,975 |
| Trekking, camping, climbing, MTB, paragliding, etc. | 0.519 *** | 5.69 | 0.000 | 33,617 | 20,075 | 57,152 | |
| Biodiversity enhancement (Reference level: poor) | Average | 0.380 *** | 4.12 | 0.000 | 24,609 | 12,036 | 44,247 |
| Rich | 0.598 *** | 6.56 | 0.000 | 38,730 | 24,164 | 64,404 | |
| WTP for forest ecosystem service (Tax) (KRW/household/year) | −0.015 *** | −5.19 | 0.000 | ||||
Disclaimer/Publisher’s Note: The statements, opinions and data contained in all publications are solely those of the individual author(s) and contributor(s) and not of MDPI and/or the editor(s). MDPI and/or the editor(s) disclaim responsibility for any injury to people or property resulting from any ideas, methods, instructions or products referred to in the content. |
© 2024 by the authors. Licensee MDPI, Basel, Switzerland. This article is an open access article distributed under the terms and conditions of the Creative Commons Attribution (CC BY) license (https://creativecommons.org/licenses/by/4.0/).
Share and Cite
Son, Y.-G.; Lee, Y.; Jo, J.-H. Residents’ Willingness to Pay for Forest Ecosystem Services Based on Forest Ownership Classification in South Korea. Forests 2024, 15, 551. https://doi.org/10.3390/f15030551
Son Y-G, Lee Y, Jo J-H. Residents’ Willingness to Pay for Forest Ecosystem Services Based on Forest Ownership Classification in South Korea. Forests. 2024; 15(3):551. https://doi.org/10.3390/f15030551
Chicago/Turabian StyleSon, Young-Gyun, Yohan Lee, and Jang-Hwan Jo. 2024. "Residents’ Willingness to Pay for Forest Ecosystem Services Based on Forest Ownership Classification in South Korea" Forests 15, no. 3: 551. https://doi.org/10.3390/f15030551
APA StyleSon, Y.-G., Lee, Y., & Jo, J.-H. (2024). Residents’ Willingness to Pay for Forest Ecosystem Services Based on Forest Ownership Classification in South Korea. Forests, 15(3), 551. https://doi.org/10.3390/f15030551