Article

Effects of Understory Vegetation Conversion on Soil Greenhouse Gas Emissions and Soil C and N Pools in Chinese Hickory Plantation Forests

1
State Key Laboratory of Subtropical Silviculture, Zhejiang A&F University, Hangzhou 311300, China
2
Key Laboratory of Carbon Cycling in Forest Ecosystems and Carbon Sequestration of Zhejiang Province, Zhejiang A&F University, Hangzhou 311300, China
3
School of Environmental and Resources Science, Zhejiang A&F University, Hangzhou 311300, China
4
Agriculture and Rural Bureau of Lin’an District, Hangzhou 311300, China
*
Author to whom correspondence should be addressed.
These authors contributed equally to this work.
Forests 2024, 15(3), 558; https://doi.org/10.3390/f15030558
Submission received: 18 February 2024 / Revised: 15 March 2024 / Accepted: 16 March 2024 / Published: 19 March 2024
(This article belongs to the Section Forest Soil)

Abstract

:
Forest management, especially understory vegetation conversion, significantly affects soil greenhouse gas (GHG) emissions and soil C and N pools. However, it remains unclear what effect renovating understory vegetation has on GHG emissions and soil C and N pools in plantations. This study investigates the impact of renovating understory vegetation on these factors in Chinese hickory (Carya cathayensis Sarg) plantation forests. Different understory renovation modes were used in a 12-month field experiment: a safflower camellia (SC) (Camellia chekiangoleosa Hu) planting density of 600 plants ha−1 and wild rape (WR) (Brassica napus L.) strip sowing (UM1); SC 600 plants ha−1 and WR scatter sowing (UM2); SC 1200 plants ha−1 and WR strip sowing (UM3); SC 1200 plants ha−1 and WR scatter sowing (UM4); and removal of the understory vegetation layer (CK). The results showed that understory vegetation modification significantly increased soil CO2 and emission fluxes and decreased soil CH4 uptake fluxes (p < 0.01). The understory vegetation transformation significantly improved soil labile carbon and labile nitrogen pools (p < 0.01). This study proposes that understory vegetation conversion can bolster soil carbon sinks, preserve soil fertility, and advance sustainable development of Chinese hickory plantation forests.

1. Introduction

Due to the expansion of the global economy and continued population growth, a variety of human activities have led to a significant rise in greenhouse gas levels in the atmosphere [1]. This is steadily becoming a prominent driver of worldwide climate change. Given their extensive species diversity and vast biomass, forests serve as the largest carbon reservoirs on land, playing a crucial part in combating the global climate crisis [2]. In numerous forests, soil respiration, organic matter decomposition, and nitrification and denitrification are the principal sources of the greenhouse gases CO2, N2O, and CH4. These activities are significantly impacted by both the environment and practices related to forest management [3]. The management of forests is a crucial action in reducing greenhouse gas (GHG) emission levels and addressing climate change, particularly in plantations [4].
The impact of differing forest management techniques on greenhouse gas emissions and climate change is variable [5]. A study by Xu et al. demonstrates that using silicate fertilizers decreases soil emissions of greenhouse gases in bamboo forests, which enhances the carbon sink capacity of moso bamboo (Bambusoideae) ecosystems [6]. However, Liu et al.’s study demonstrated a substantial increase in soil CO2 emissions from bamboo forests in Northwestern China under intensive management with large-scale farming [7]. On the one hand, forest management conservation measures have a positive impact on soil GHG emissions. However, excessive harvesting and management practices negatively affect climate change and disturb the balance within the ecosystem.
Understory vegetation is a crucial element of forest ecosystems and influences ecological communities, biodiversity maintenance, understory microclimate, as well as nutrient cycling in both above-ground and below-ground ecosystems [8]. Furthermore, support for these findings was obtained by Duan et al. based on their research conducted on northeastern larch (Larix gmelinii (Rupr.) Kuzen) forests, revealing that understory species composition can indirectly affect soil greenhouse gas emission fluxes by influencing bacterial communities and thus indirectly affect soil GHG emission fluxes [9]. Li found that modifying the understory by clearing it and adding nitrogen-fixing species can result in changes to soil temperature and moisture levels, which can consequently affect soil CH4 flux emissions [10]. Understory vegetation conversion is a commonplace management technique employed in plantations [11]. Appropriate conversion of understory vegetation contributes to the augmentation of species diversity and stability of the ecosystem [12,13].
Chinese hickory (Carya cathayensis Sarg) is a valuable dry fruit and oilseed species that is unique to China and primarily found in the Tianmu mountain range that marks the border of Zhejiang and Anhui. Due to its prevalence and favorable economic returns, a huge number of the mixed Chinese hickory–broadleaf forests have been transformed into monoculture hickory forests, resulting in an ecosystem with reverse succession [14]. The intensification of the management process in Chinese hickory plantation forests has resulted in soil erosion and the destruction of the soil structure on the forest floor. This is due to measures such as removing understory shrubs and weeds and applying significant amounts of chemical fertilizers, pesticides, and herbicides [15]. As a consequence, soil GHG emissions and the stability of soil carbon and nitrogen pools have been impacted. Previous studies have centered on the objective discussion of the soil’s physicochemical properties in hickory plantation forests in China. Wu et al. discovered that the soil’s carbon pool’s water-soluble organic carbon (WSOC) and microbial biomass carbon (MBC) content could be boosted by planting herbs [16]. Jin et al. reported that soil pH could be affected by the long-term management of hickory plantation forests [17]. However, research into the effects of planting a scrub layer to modify understory vegetation in Chinese hickory plantation forests on soil GHG emissions remains scarce.
To gain further insight into the impact of understory vegetation modification on soil GHGs, we planted safflower camellia (Camellia chekiangoleosa Hu) (SC) and wild rape (Brassica napus L.) (WR) in the forest for ecological transformation. SC and WR are suitable for planting in steep woodlands, survive easily, and have good water and soil retention capacities, which is convenient for experiments. A one-year field experiment was carried out in Chinese hickory plantation forests. This study aimed to assess the impacts of adjustments made to the understory vegetation on soil temperature, soil water content, soil pH, soil WSOC, soil MBC, soil water-soluble organic N (WSON), soil microbial biomass N (MBN), soil NO3–N, soil NH4+–N content, and GHG emission fluxes. The findings will provide valuable information regarding the potential consequences of understory vegetation modification on soil GHGs in this ecosystem. The aims of this inquiry were to (1) examine the impacts of changing understory vegetation on soil GHG emission fluxes and soil C and N pools in Chinese hickory plantation forests on a short-term (1-year) basis, and (2) ascertain the correlation between soil environmental factors and soil GHG emission fluxes.

2. Materials and Methods

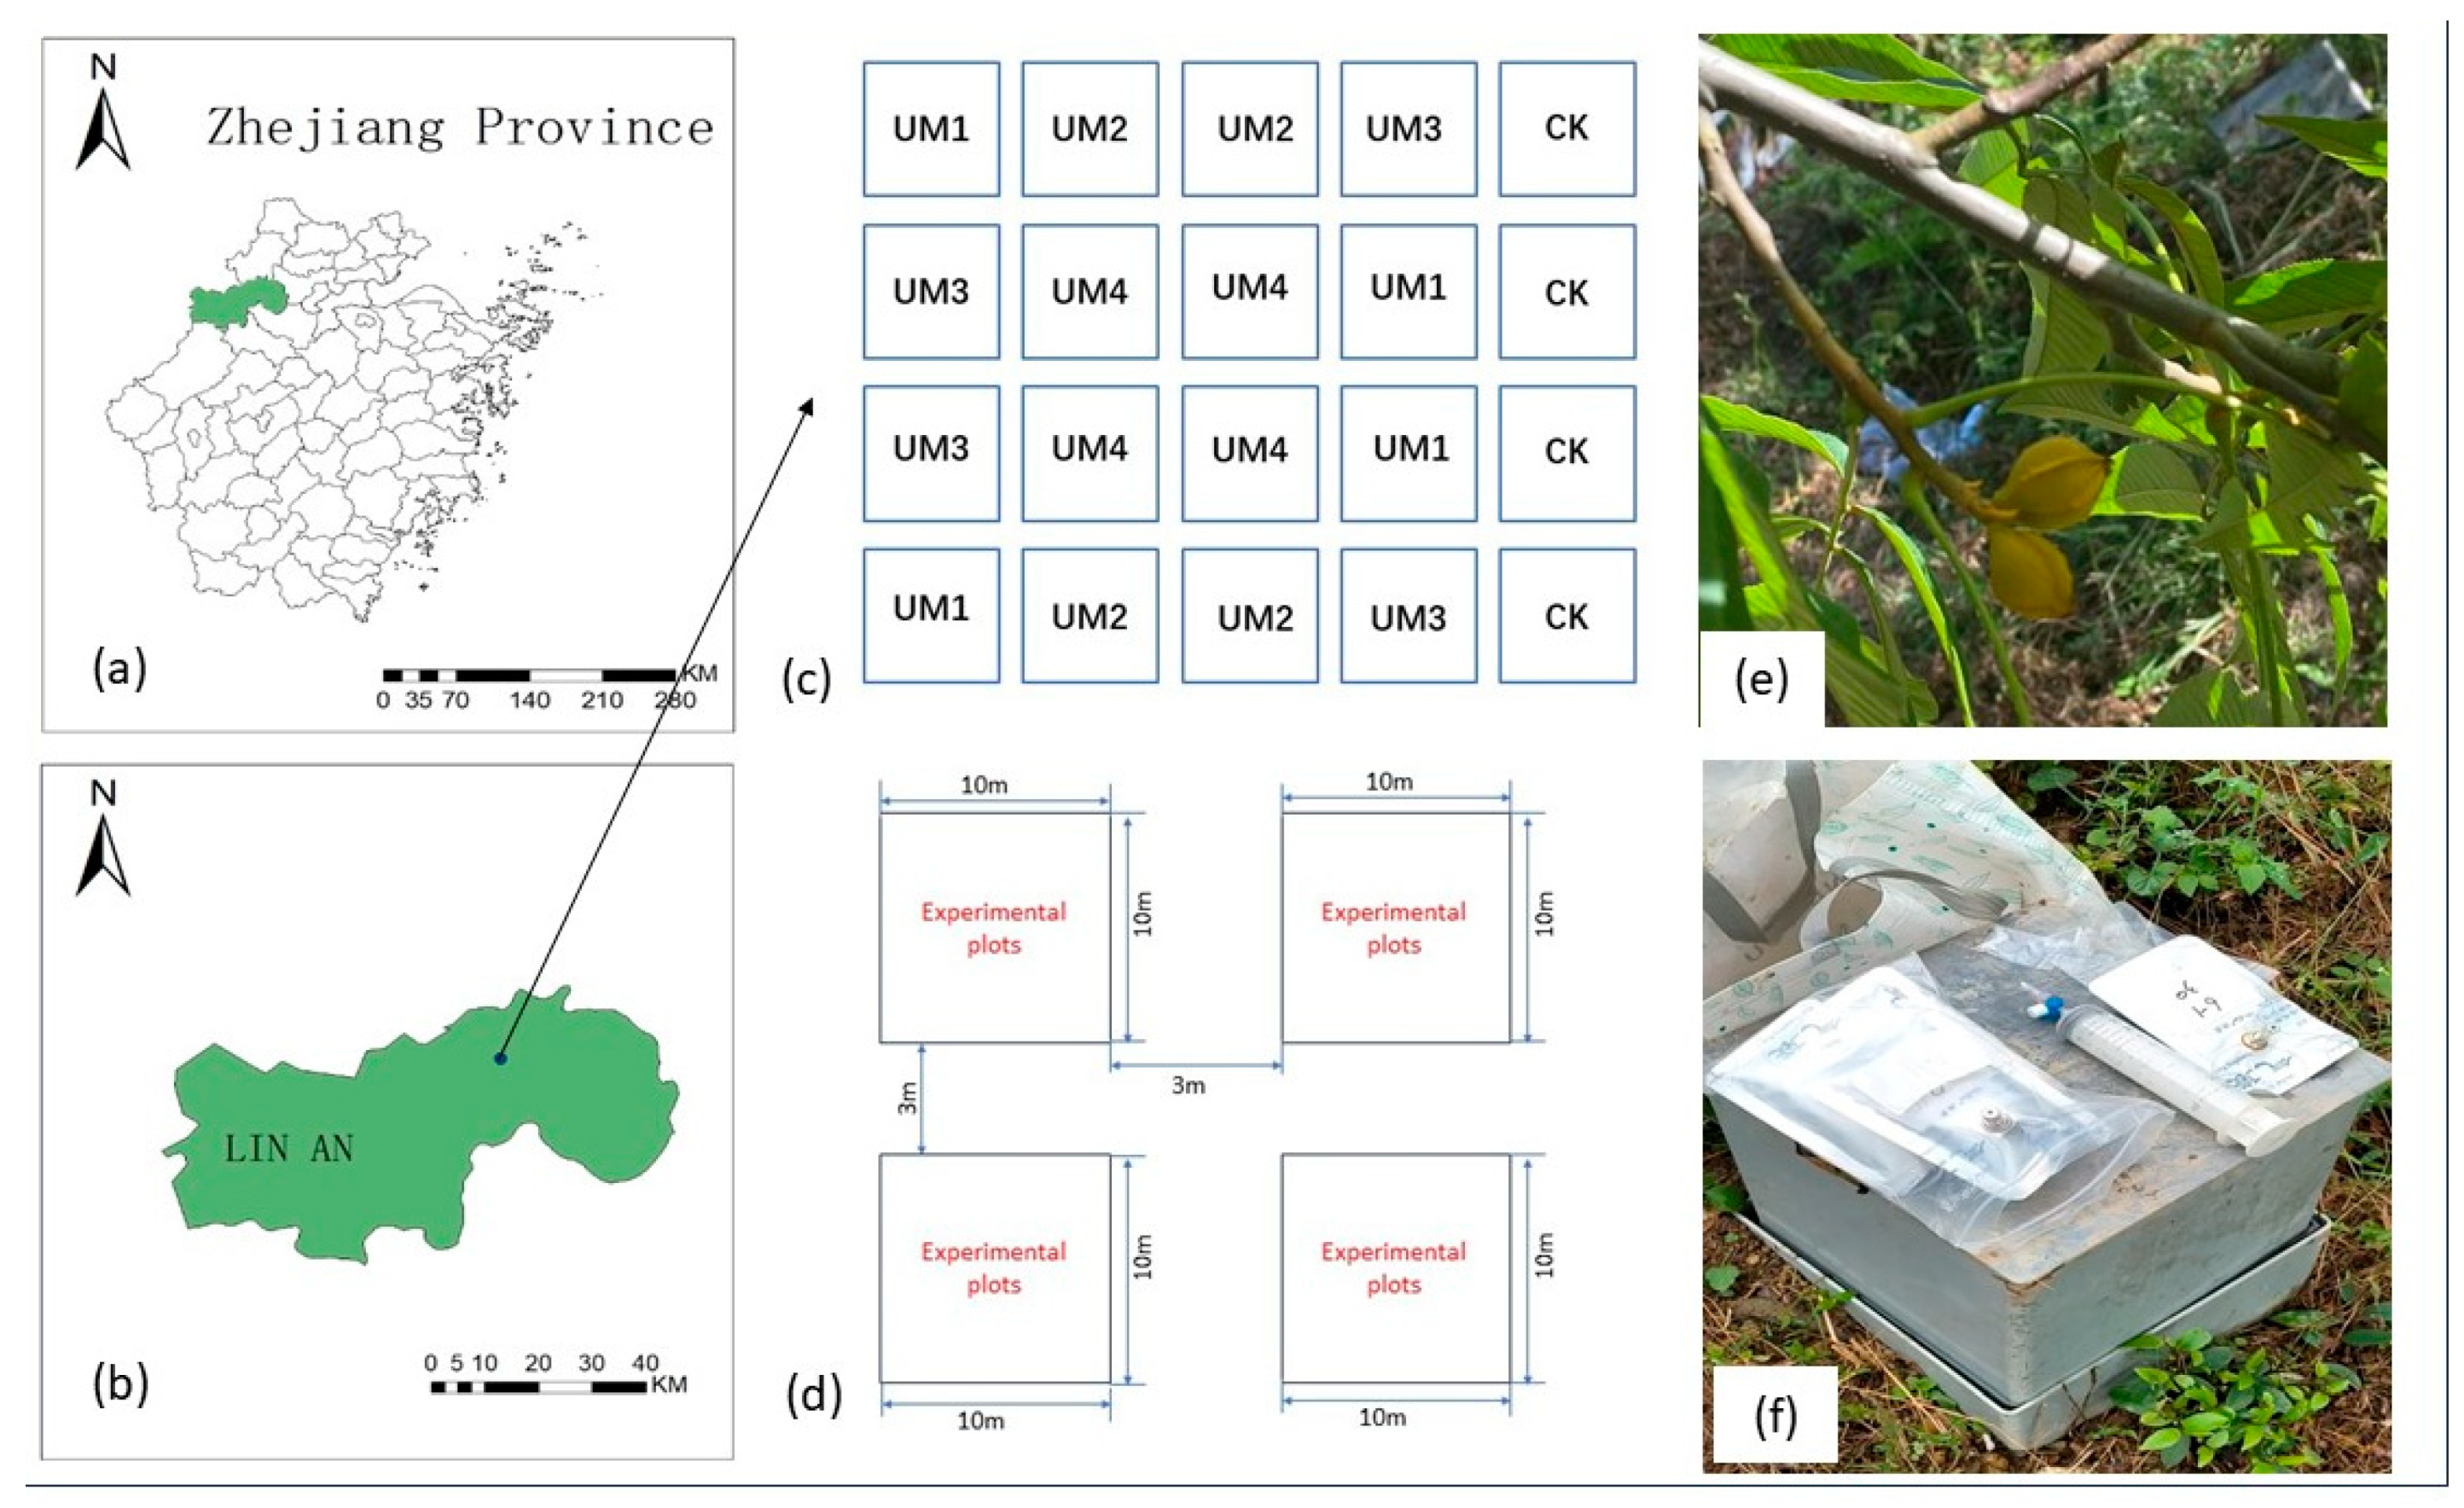
2.1. General Description of the Study Area

This study was conducted in Lin’an District, Zhejiang Province (29°–31° N, 118°–120° E) (Figure 1). The region experiences a subtropical monsoon climate, with an average yearly temperature of 16 °C, 1774 annual sunshine hours, 237 days of frost-free conditions, and an average annual precipitation ranging from 1350–1500 mm. The area’s topography comprises hills and mountains, and the experimental site is positioned around an altitude of 120 m above sea level, with a slope of approximately 30°. The primary soil type in the research region is slightly acidic, red soil.
A representative Chinese hickory plantation woodland was the subject of the field research, and a field experiment was conducted on it in May 2022. The planting density of the hickory plantation forest was about 240 trees ha−1, with an average diameter at breast height (DBH) of 12.4 cm, an average age of 12.5 years, and an average height of 6.4 m. Prior to conducting the experimental treatments, the soil profiles were excavated at a 20 cm depth and samples were collected from the bottom up for analysis of the basic physicochemical properties. The soil analysis revealed a bulk density of 1.10 g cm−3, 131.67 mg kg−1 of K available, a pH of 4.9, 4.92 mg kg−1 of P available, 161.76 g kg−1 of total nitrogen, and 11.06 g kg−1 of organic carbon.

2.2. Experimental Design

In May–June 2022, we selected pure Chinese hickory plantation forests with comparable growth histories, stand conditions, and slopes in the study area. We planted five treatments, each replicated four times, using a completely randomized block design. The experimental plot size was 10 m × 10 m, and a 3 m buffer strip was included in each plot to eliminate edge effects (Figure 1c,d).
The experimental plot underwent modifications to its understory vegetation and changes in plant densities of SC through the use of different sowing methods of WR. Five treatments were implemented: (1) SC planting density of 600 plants ha−1 and WR strip sowing (UM1); (2) SC 600 plants ha−1 and WR scatter sowing (UM2); (3) SC 1200 plants ha−1 and WR strip sowing (UM3); (4) SC 1200 plants ha−1 and WR scatter sowing (UM4); (5) removal of understory vegetation layer (CK).
In early June, all the native vegetation was manually removed from the study area using machetes without disrupting the soil. Subsequently, SC (seedling annual, ground diameter 0.27 cm) was transplanted and WR was sown. Strip sowing, a technique in which seeds are evenly distributed in strips and then concealed with soil, was employed. The crops were planted according to a specification of 30 cm × 100 cm × 30 cm, with a planting furrow spacing of 2 m. The seeds were evenly spread on the soil surface without creating furrows, holes or row-spacing, and without ploughing the soil. WR was sown manually at a density of 30 kg per hectare.

2.3. Measurement of GHG Emissions from Soils

Between July 2022 and June 2023, this study utilized the static box–gas chromatography approach to monitor soil CO2, N2O, and CH4 emissions according to the method of Ge et al. [18]. The static boxes, crafted entirely from polyvinyl chloride (PVC) material, were structured with a top box measuring 50 cm × 50 cm × 50 cm containing a 1 cm diameter hole in the center of its top and a base size of 50 cm × 50 cm × 10 cm featuring a U-shaped sink 5 cm wide and 5 cm deep at the top of the base. Gas samples were collected during the latter half of each month on a sunny morning following 3–5 consecutive days of sunshine. Prior to the gas sampling, the fresh vegetation was pruned at the base using scissors, and a fan was activated. The complete U-shaped tank was replenished with distilled water, and subsequently, the top segment was securely fastened onto the base to seal the entire stationary box. The gas was collected at 10 min intervals (0, 10, 20, 30 min) after being mixed evenly. Thereafter, 90 mL of gas was extracted using a 100 mL medical syringe, sealed in a 100 mL aluminum bag, and transported to the laboratory. A flux analysis was carried out using the capillary and packed gas chromatograph GC-204 (Shimadzu Corporation, Kyoto, Japan). Soil GHG fluxes were measured once every month. To obtain soil temperature data at a depth of 5 cm, a ground thermometer was inserted into the soil at a depth of 5 cm near the fixation box. Formula (1) was applied to calculate the soil CO2, N2O, and CH4 emissions:
F x = ρ x V A P P 0 T 0 T d C t x d t x
where F is the emission flux of soil greenhouse gases (CO2, CH4, and N2O) (mg CO2 m−2 h−1, µg N2O m−2 h−1, µg CH4 m−2 h−1); ρ is the density of greenhouse gases in the standard state (CO2: 1.98 × 10³ g m−3; CH4: 7.163 × 10² g m−3; N2O: 1.964 × 10³ g m−3); V is the effective volume of the box; A is the area of the bottom of the static box, i.e., the surface area of the soil where the gases are collected in the static box (m2); P (Pa) is the actual atmospheric pressure in the static box; P0 (Pa) is the atmospheric pressure in the standard condition; T0 (K) is the absolute temperature under the standard condition; T is the absolute temperature of the static box at the time of sampling; and d C t d t is the rate of change of the concentrations of the CO2, CH4, and N2O (ppm).
Formula (2) was applied to the calculation of the annual cumulative emission fluxes of greenhouse gases from the soils:
M = F i + 1 + F i 2 × k i + 1 k i × 24 × 10 5
where M is the cumulative GHG emissions (Mg CO2 ha−1 year−1, kg N2O ha−1 year−1, kg CH4 ha−1 year−1), F is the monthly emission flux of the gas (mg CO2 m−2 h−1, µg N2O m−2 h−1, µg CH4 m−2 h−1), i is the number of samples, and k is the sampling time.
In order to estimate the comprehensive effect of understory vegetation modification on soil greenhouse gas emissions, Formula (3) was used to determine soil GHG emissions.
S o i l   G H G   e m i s s i o n s = M C O 2 + 298 × M N 2 O 25 × M C H 4
The soil GHG emissions are expressed in CO2 equivalents (Mg CO2-eq ha−1 year−1); abd M C O 2 ,   M N 2 O , and M C H 4 are the annual cumulative CO2 and N2O emissions and CH4 uptake (Mg ha−1 year−1), respectively. Fluxes of N2O and CH4 are converted to CO2 equivalent via multiplication by their global warming potentials on a 100-year scale (298 and 25, respectively)

2.4. Measurement Methods for Soil Physico-Chemical Properties

The soil samples were collected using the two-point sampling method. At first, two sampling points were placed along the diagonal of each test plot. Thereafter, the soil profile was excavated to a depth of 20 cm, and the samples were gathered from the soil bottom, brought back to the laboratory, and subjected to removal of stones with a diameter larger than 2 mm and residual plant roots. After sieving through a 10-mesh filter, the soil samples were separated into two portions. One portion was stored in a refrigerator at a temperature of 4 °C to determine the soil moisture content, soil carbon fractions (WSOC and MBC), and soil nitrogen fractions (NO3–N, NH4+–N, WSON, and MBN). The other part was naturally air-dried and used to determine the soil pH.
The soil moisture was assessed utilizing the constant weight drying method at a temperature of 105 °C. A Shimadzu Total Organic Carbon Analyzer (TOC-VCPH) (Shimadzu Corporation, Kyoto, Japan) was employed to determine and quantify the soil MBC and MBN contents following the methodology outlined by Xu et al. [18]. Furthermore, TOC-VCPH was utilized in ascertaining the soil WSOC and WSON contents as described in Singh et al. [19]. The soil NO3–N was measured via UV spectrophotometry, while the soil NH4+–N content was evaluated using the indophenol blue colorimetric technique [20]. The soil pH was determined utilizing a pH meter [17].

2.5. Statistics and Analyses

The data were analyzed by averaging four replications. To investigate the importance of the annual mean, annual cumulative soil GHG emissions, and soil physicochemical properties under different forest understory vegetation modifications, we used a one-way ANOVA (one-way analysis of variance) and the least significant difference (LSD) method. Before the ANOVA, the data underwent testing for normality and homogeneity. If deemed necessary, they was log-transformed. Stepwise regression equations were used to examine the correlations between soil GHG emissions and environmental factors under different understory vegetation modifications.
Structural equation modelling (SEM) was employed to analyze the impact of soil carbon (C) and nitrogen (N) pools on soil GHG emissions. The SEM utilized a maximum likelihood (χ2) goodness of fit test, goodness of fit index (GFI), normed fit index (NFI), and comparative fit index (CFI) to assess the model’s reliability. The best model employed in this study was based on the following standard criteria: (1) non-significant χ2 test statistics (p > 0.05) and (2) GFI, NFI, and CFI values greater than 0.90.
Statistical analyses were performed through the use of Microsoft Excel 2013 software (Microsoft, Redmond, WA, USA) and SPSS 19.0 data analysis software (IBM Inc., Amok, NC, USA), and graphical representations were plotted using Origin 2018 (OriginLab Inc., Northampton, MA, USA). Structural equation modelling was conducted via the application of the AMOS (Analysis of Moment Structures) 24.0 module.

3. Results

3.1. Impact of Understory Vegetation Conversion on Soil Greenhouse Gas Emissions

In a series of experiments testing various modifications of the understory vegetation over a one-year period, it was observed that the soil GHG emissions from the Chinese hickory plantation forests followed a consistent trend, displaying clear seasonal variations. The peak in soil GHG emissions occurred during the summer of July–August, while the nadir was observed in December–March of the subsequent year (Figure 2). According to formula (1), the flux of soil CO2 and N2O is positive, which is manifested as emissions, and the concentration gradually increases at 0, 10, 20, and 30 min. The flux of CH4 in the soil is negative, showing uptake, and the concentration gradually decreases at 0, 10, 20, and 30 min.
The annual variations in soil carbon dioxide emissions under the various modifications to the understory vegetation ranged from 81.0 to 722.4 in UM1, from 17.2 to 619.5 in UM2, from 50.6 to 556.8 in UM3, from 71.3 to 502.4 in UM4, and from 44.8 to 472.1 in CK mg m−2 h−1 (Figure 2a). Specifically, for the UM1, UM2, UM3, UM4, and CK modifications, the annual cumulative CO2 emissions from the soils were 28.1 ± 0.8, 25.7 ± 1.3, 22.1 ± 0.4, 21.2 ± 0.7, and 19.4 ± 0.8 Mg ha−1yr−1, respectively (Figure 3a). The annual cumulative CO2 emissions from the soil in the Chinese hickory plantation forests were significantly higher under the understory vegetation modifications compared to normal operation (CK). The difference was statistically significant (p < 0.01) and increased by 45% (UM1), 33% (UM2), 14% (UM3), and 9% (UM4), respectively (Figure 3a) (% was relative % of the studied parameters).
The yearly fluctuations in N2O emissions from the soil, observed under varying understory vegetation modifications (UM1, UM2, UM3, UM4, CK), ranged from 3.41 to 49.46, from 7.5 to 65.2, from 2.6 to 50.3, from 4.6 to 53.5, and from 2.5 to 40.4 μg m−2 h−1 (Figure 2b). The yearly fluctuations in soil N2O emissions were examined with regards to varying forms of understory vegetation (UM1, UM2, UM3, UM4, CK). The yearly cumulative N2O emissions from the soil were measured for each modification (UM1, UM2, UM3, UM4, CK) and found to be 1.3 ± 0.1, 2.1 ± 0.1, 1.3 ± 0.1, 1.6 ± 0.1, and 1.1 ± 0.1 kg ha−1yr−1 (Figure 3b). The annual cumulative N2O emissions from the soil in Chinese hickory plantation forests with understory vegetation modifications were compared to those under normal operation (CK). The emissions were significantly different (p < 0.01), with values of 14% (UM1), 84% (UM2), 18% (UM3), and 42% (UM4), respectively (Figure 3b).
The yearly fluctuation in the soil uptake of CH4 varied across various understory vegetation modifications (UM1, UM2, UM3, UM4, and CK), with values ranging from 24.6 to 86.2, from 25.4 to 110.7, from 25.3 to 100.1, from 25.1 to 88.5, and from 38.6 to 110.5 mg m−2 h−1 (Figure 2c). The annual fluctuations in soil CH4 uptake were observed under various understory vegetation modifications (UM1, UM2, UM3, UM4, and CK). The annual cumulative CH4 uptake from the soils under different understory vegetation modifications (UM1, UM2, UM3, UM4, and CK) were 4.4 ± 0.1, 5.6 ± 0.2, 5.1 ± 0.3, 4.4 ± 0.1, and 6.3 ± 0.1 kg ha−1yr−1, respectively (Figure 3c). The annual soil uptake from the Chinese hickory plantations subjected to understory management were found to be reduced compared to those under normal management (CK). The reductions in uptake were significant (p < 0.01) and amounted to 30% (UM1), 20% (UM2), 14% (UM3), and 30% (UM4), respectively (Figure 3c) (% was relative % of the studied parameters).
In summary, the total soil GHG emissions resulting from varied modifications of understory vegetation (UM1, UM2, UM3, UM4, and CK) were 28.6 ± 0.8, 26.5 ± 1.3, 22.7 ± 0.5, 21.8 ± 0.7, and 19.9 ± 0.8 Mg ha−1yr−1, respectively. The total yearly emissions of CO2 from the soil in the Chinese hickory plantation forests significantly differed (p < 0.01) when they were subjected to modifications of the forest understory vegetation. The emissions increased by 44% (UM1), 33% (UM2), 14% (UM3), and 10% (UM4), respectively, compared to normal operation (CK) (Figure 3d).

3.2. Effects of Understory Vegetation Conversion on Soil Environmental Factors

Combined with the monthly average temperature and monthly precipitation of the sample plot (Table 1), the soil temperature at a depth of 5 cm displayed a consistent seasonal pattern, with the highest temperatures observed in the summer of July and the lowest in the winter of November–December (Figure 4a). Likewise, at a depth of 0–20 cm, both the soil moisture and pH displayed a clear seasonal trend, with the highest values noted in winter and the lowest values recorded in spring and autumn (Figure 4b,c). The soil’s 5 cm temperature and pH did not exhibit significant differences (p > 0.05) among the varied forest vegetation modifications. A comparison with the normal operation (CK) revealed a significant increase (p < 0.01) in the annual average soil water content, specifically by 18% in UM1 and 10% in the UM3 treatment, while no substantial difference (p > 0.05) was observed in soil moisture among the other treatments (Figure 4).
Seasonal variations were observed in the soil carbon pool’s WSOC and MBC contents under varying understory vegetation restoration practices (Figure 5). Under different restoration practices, compared to normal operation (CK), the annual mean soil WSOC values were elevated significantly (p < 0.01) by 26% (UM1), 30% (UM2), 16% (UM3), and 24% (UM4), respectively (Figure 5a). The yearly average of soil MBC demonstrated a noteworthy increase of 37% (UM1), 55% (UM2), 18% (UM3), and 22% (UM4), respectively, in comparison to regular operation (CK) (p < 0.01) (Figure 5b).
Seasonal variations in the soil nitrogen pool were evident based on the NO3–N, WSON, and MBN contents, showing higher levels in summer and lower levels in winter. The NH4+–N content had a similar trend, with no distinct seasonal characteristics, peaking in September and reaching its lowest levels in May of the following year (Figure 6).
Compared to normal operation (CK), the annual average amounts of soil NO3–N were notably higher (p < 0.01) by 57% (UM1), 27% (UM2), 16% (UM3), and 43% (UM4) (Figure 6a). In addition, the annual average amounts of soil NH4+–N were significantly increased (p < 0.01) by 54% (UM1), 69% (UM2), 120% (UM3), and 80% (UM4) (Figure 6b).
The mean values of soil WSON demonstrated a significant increase (p < 0.01) when the understory vegetation modifications were applied. The increases were 61% (UM1), 90% (UM2), 52% (UM3), and 45% (UM4) in comparison to normal operation (CK) (Figure 6c). Additionally, the soil MBN mean values also showed a significant increase (p < 0.01) of 56% (UM1), 103% (UM2), 51% (UM3), and 54% (UM4) compared to normal operation (CK) (Figure 6d).

3.3. Relationship between Soil GHG Emissions and Soil Environmental Factors under Forest Vegetation Conversion

Significant positive correlations were observed between the soil carbon dioxide and nitrous oxide emission fluxes and soil temperature at a depth of 5 cm under both treatment conditions (p < 0.01) (Table 2, Table 3 and Table 4). Additionally, significant correlations were observed between the soil CH4 uptake fluxes and MBC content, except under treatment UM3 (p > 0.05) (Table 3). However, no significant relationship was found between the soil CO2 uptake flux and soil water content or between the soil N2O emission flux and pH under either treatment condition (Table 2 and Table 3).
Structural equation models were subsequently constructed to elucidate and simulate the impact of the soil carbon and nitrogen pools on the soil GHG emission fluxes. The structural equation model revealed that the main driver of soil CO2 emission fluxes was the soil NO3–N content, which showed a positive correlation. There was a significant correlation between the soil CO2 emission flux and Soil NO3–N content (p < 0.05) (Figure 7a). This study found that the soil MBC content had the most substantial effect on soil N2O emission fluxes, with a highly significant positive correlation (p < 0.01) (Figure 7b). The soil MBC content was found to have the most substantial impact on soil CH4 uptake, exhibiting a notable positive correlation (p < 0.01). Moreover, soil NO3–N was identified as a leading factor driving soil CH4 uptake, displaying a significant negative correlation (p < 0.05) (Figure 7c).

4. Discussion

4.1. Impact of Understory Vegetation Conversion on Soil GHG Emissions

In a one-year field trial, modification of understory vegetation led to a significant increase in the annual cumulative emissions of soil CO2 and N2O (Figure 3a,b). This result is in line with the findings of Zhang [21], who found that planting understory grasses in chestnut (Castanea mollissima Blume) forests significantly increased soil CO2 and N2O emissions. Similarly, Rao et al. uncovered a corresponding result in rubber (Hevea brasiliensis (Willd. ex A. Juss.) Muell. Arg.) forests, where the addition of legumes markedly curbed soil CH4 uptake [22]. Furthermore, the incorporation of understory vegetation substantially decreased the yearly combined release of soil CH4 uptake (Figure 3c). This underscores the mechanisms underpinning the impact of forest vegetation modification on soil GHG.
Atmospheric carbon dioxide is taken up by plants through photosynthesis and subsequently released back into the atmosphere via organic matter decomposition and respiration in soil, according to Tang et al. [23]. Soil respiration is a multifaceted biological process that is impacted by several different factors. Soil CO2 emissions are the result of both abiotic and biotic factors. Abiotic factors, including soil temperature, soil water content, apoplectic material, and soil C and N content, can impact soil CO2 emissions. In addition, biotic factors such as vegetation type, root biomass, and human activities have a combined effect on soil CO2 emissions. A recent study by Xiao et al. specifically showed that converting understory vegetation led to an increase in soil CO2 emissions [24]. Cultivating understory vegetation can enhance plant growth and promote the soil root system and root secretion, which in turn stimulates autotrophic respiration of the soil root system [25]. Simultaneously, the amplified quantity of plant remains and root excretions facilitated the influx of additional fresh organic substances into the soil. This, in turn, encouraged a significant number of soil microorganisms, subsequently leading to a surge in metabolic functioning and the stimulation of heterotrophic respiration of microorganisms. The net outcome was an augmentation in soil CO2 discharges.
The key microbial pathways responsible for N2O production in soil are nitrification and denitrification. These pathways are influenced by several factors, including soil properties, temperature, moisture, plant systems, and fertilizer application [26]. The nitrification and denitrification reactions use NO3–N and NH4+–N as sources of material. The introduction of SC and WR to the hickory understory increased the content of NO3–N and NH4+–N in the soil (Figure 6a,b). This intensified the nitrification and denitrification reactions, leading to an increase in N2O emissions from the soil. The increase in soil N2O emission may be attributed to this. Additionally, the structural equation modelling revealed a significant positive correlation between the soil MBC content and soil N2O emissions (Figure 7b). The increase in soil MBC compared to the control with the removal of understory vegetation may be due to the increase in deadfall and root residues of SC and WR. The root residues of SC and WR, as carbon-containing materials in the root zone, stimulate the activity of denitrifying microorganisms, leading to an increase in the intensity of inter-root denitrification, which in turn increases the emission of N2O.
Soil CH4 fluxes were determined based on the combined action of methane-producing and methane-oxidizing bacteria. The forest understory vegetation modification led to a decrease in soil CH4 uptake. The data analysis showed that the soil MBC content was related to the soil CH4 uptake (Table 4), and the understory vegetation conversion increased the soil MBC content, which may have increased the activity and amount of methyltrophic radicals and decreased soil CH4 uptake. Additionally, a decrease in soil CH4 uptake may be associated with soil moisture levels. The conversion of understory vegetation led to an increase in the soil moisture content (as shown in Figure 4b), resulting in a decrease in the anaerobic conditions of the soil and an increase in methane oxidation. Under favorable aeration conditions, methane-oxidizing bacteria utilize the oxygen in the soil to oxidize atmospheric and soil CH4 into CO2.
It is worth noting that this study had a one-year observation period, which may only reflect the short-term effects of understory vegetation modification on soil GHG emission fluxes in Chinese hickory forests. Previous studies have demonstrated differences in soil GHG emission flux changes based on yearly durations. For instance, Toma et al. conducted a two-year study and discovered no significant variation in annual CH4 and N2O emissions, heterotrophic respiration, and net GHG emissions with the application of green manure or mid-season drainage extension [27]. The long-term effects of forest management on forest soils require further attention in future studies. Additionally, soil respiration comprises autotrophic respiration and heterotrophic respiration, and these two types react diversely to alterations in forest understory vegetation [28]. Consequently, subsequent studies need to observe and discuss them separately.

4.2. Effects of Understory Vegetation Conversion on Soil C and N Pools

Soil water-soluble organic matter (WSOM) is a significant component of soil, reflecting minor soil changes due to environmental and anthropogenic measures, principally constituting WSOC and WSON [29]. A rising trend was observed in the contents of soil WSOC and WSON under different understory vegetation transformations, with the annual mean values showing significant increases (p < 0.01) in contrast to the blank control (Figure 5a and Figure 6c). The study showed that renovating the understory vegetation led to an increase in soil water-soluble organic matter (WSOC and WSON), promoting the accumulation of soil water-soluble C and N pools. Zhang et al. also discovered that seeding with Medicago sativa L. and other herbs in Chinese chestnut plantation forests significantly enhanced the soil WSOC content, which aligns with the outcomes of our investigation [30]. The modification of understory vegetation on the forest floor has resulted in increased species diversity and amounts of apoplectic material. The increase in soil moisture and the modification of forest understory vegetation may have caused this. The change in soil moisture dissolved soil surface organic matter [31], especially WSOM in the apoplectic matter of SC and WR, and soil WSOM increased when the WSOM on the soil surface entered the soil.
The soil microbiota serves as a reservoir of active nutrients in soil, and its exuberant metabolic activity is an indication of the state of the microbial community [32]. Our study indicated that the soil MBC and MBN contents demonstrated an upward trend under varied understory vegetation renovation compared to the blank control (Figure 5b and Figure 6d). Moreover, the yearly average value of soil MBC and MBN was immensely higher (p < 0.01), showing that the modification of understory vegetation led to an increase in soil microbial biomass (MBC, MBN), resulting in the accumulation of soil microbial C and N pools. Our findings align with Zhao et al.’s research, which showed that conserving the understory vegetation in Eucalyptus (Eucalyptus robusta Smith) plantation forests could enhance soil microbiome contents compared to its removal [33]. This increase in biomass, which included apoplectic material and root secretion, provided an input of energy material that eventually led to an increase in soil MBC and MBN contents. The control treatment with over-intensive management had the lowest soil MBC and MBN contents, likely due to the lack of energy inputs. These results indicate that understory vegetation conversion improves soil biomass inputs, nutrient status, and microbial storage and activity.
Soil NH4+–N and NO3–N are the principal forms of nitrogen utilized by microorganisms and plants, according to Yuan et al. [34]. It was found that modifying the understory vegetation facilitated the accumulation of soil nitrogen pools. The experimental results indicated that the soil NH4+–N content was significantly higher (p < 0.01) in the modified understory vegetation than in the blank control, and the modified understory vegetation had a positive effect on the soil nitrogen pool (Figure 6a). The primary cause could be the rise in the deposition of dead Chinese hickory leaves and the shrub herb layer following the restoration of understory vegetation in the forest. Additionally, the NH4+–N that was initially lost due to bare ground was conserved, resulting in its absorption by the soil. Concurrently, the soil NO3–N content was notably higher in the modified understory vegetation (p < 0.01) (Figure 6b). Correspondingly, Zhao et al. found comparable results in a plantation forest of camphor pine (Pinus sylvestris Linn. var. mongolica Litv.), where soil NO3–N was substantially depleted by 45% with understory clearing compared to retention of understory vegetation [35]. It is plausible that the deadwood replenished the soil nitrogen content and expedited the soil nitrogen mineralization, thereby augmenting the soil nitrate–nitrogen content.
The impact of converting understory vegetation on soil carbon and nitrogen storage is largely driven by microbial activity, which was evaluated in this study through measures of soil organic matter and soil microorganisms. Previous research [36] has indicated that it may be beneficial to examine the mechanisms involved in these responses through the lens of bacteria, fungi, and enzymes. Li et al. discovered that warming and reclamation both enhance soil nitrification by boosting relevant enzyme activities, as observed from the perspective of soil enzyme activity [37]. Truu et al. further associated the abundance of soil bacteria and their nutrient conversion processes in the cycling of C and N in coastal regions to GHG emissions [38]. Hence, future studies require additional research experiments on soil bacteria and enzymes to more comprehensively examine the impact of understory vegetation transformation on the soil microbial communities that are involved in carbon and nitrogen cycling in Chinese hickory forest soils.

4.3. Influence of Soil Environmental Factors on Soil GHG Emissions

Comparable results were shown by Zhang et al. in montane forest and meadow ecosystems [39,40]. According to the structural equations, there was a notable and affirmative correlation between the emission fluxes of soil CO2 and N2O and soil 5 cm temperature within this study (p < 0.01). This could be because the modification of the understory vegetation can decrease the emission fluxes of soil CO2 and N2O in response to the soil 5 cm temperature, allowing for the accumulation of soil organic C (Table 2 and Table 3). The CH4 uptake fluxes were significantly affected by the soil temperature at a depth of 5 cm only under the blank treatment, with a positive correlation shown (p < 0.01). This indicates that the soil temperature’s impact on soil CH4 uptake was altered by the implementation of understory vegetation conversion (Table 4). It is possible that the forest soil did not reach the optimum temperature value after the conversion.
A structural equation model (SEM) was developed to analyze the effects of converting understory vegetation on soil CO2 emission fluxes using soil C and N pool correlation factors to explore this relationship (Figure 7a). The results demonstrated that the correlation factors of soil C and N pools accounted for 54% of the soil CO2 emission flux. Significant and positive correlations were observed between the soil CO2 emission fluxes and soil NO3–N at a level of p < 0.05. This relationship aligns with the findings of Fang et al. and suggests that the accumulation of NO3–N resulting from environmental changes was the primary catalyst for the elevated soil CO2 emissions in the Chinese hickory plantation forest [41]. A possible explanation is that the dead wood replenished the nitrogen content in the soil, and the increased the nitrate nitrogen content in the soil facilitated the microbial fixation on the soil. Moreover, the substantial number of microbial activities boosted the heterotrophic respiration, leading to an elevation in soil CO2 flux emissions.
Structural equation modelling (SEM) revealed that 63% of the soil N2O emission fluxes were explained by the correlation factors of soil C and N pools (Figure 7b). Significant and positive correlations were observed between the soil N2O emission fluxes and the contents of soil MBC and MBN (p < 0.05), consistent with Du et al.’s findings [42]. This indicates a positive impact of soil microbiome accumulation on soil N2O emission in Chinese hickory plantation forests. Excessive soil N2O emissions could be triggered by root residues that generate organic carbon compounds that boost the denitrifying microbial activity. Furthermore, it is plausible that the MBN content of the soil increased after the renovation of the understory vegetation. This increase in nitrogen-fixing microorganisms in the soil could have resulted in increased N fixation, ultimately reducing N2O emissions.
Structural equation modelling (SEM) demonstrated that the correlation factors between the soil carbon and nitrogen pools accounted for 53% of the soil CH4 uptake (Figure 7c). A significant and positive correlation was observed between the soil CH4 uptake and the soil MBN content (p < 0.01). This result is consistent with the findings of Lin et al. [43]. It is possible that the MBN content in the soil facilitated the activity and number of methylotrophic bacteria and encouraged the activity of microorganisms involved in methane uptake following modification of the forest understory vegetation. Furthermore, there was a significant and negative correlation (p < 0.01) between the soil NO3–N and soil CH4 uptake fluxes, which aligns with the findings of Geng et al. [44]. It was discovered that adjustments in CH4 absorption in temperate forests were significantly and negatively related to soil NO3–N in the presence of an abundance of nitrogen. The reduction in soil CH4 uptake fluxes can be credited to N addition obstructing the apomictic decomposition process and the resulting apomictic layer restricting CH4 diffusion into the soil. Experimentally derived results indicated a significant soil nitrogen content response to soil CH4 content.

5. Conclusions

This study revealed that there is a pronounced seasonal pattern in soil greenhouse gases within Chinese hickory plantation forests, with high emissions in summer and autumn and low emissions in winter and spring. The conversion of the understory vegetation had a significant impact on GHG emission fluxes, leading to a marked increase in soil CO2 and N2O emission fluxes, a significant decrease in soil CH4 uptake fluxes, and an overall increase in total soil GHG emissions. At the same time, an accumulation of soil organic carbon and nitrogen and their water-soluble forms was observed. In terms of soil carbon and nitrogen pools, converting understory vegetation may be the most effective management technique. This is due to its ability to enhance the levels and activity of soil water-soluble organic matter and microbial mass, stabilize and preserve soil in plantations subjected to intensive management, and foster favorable alterations in soil carbon and nitrogen pool accumulation. Therefore, the observations imply that the regeneration of understory vegetation with planted shrub and grass layers may enhance carbon sinks and preserve soil fertility in Chinese hickory plantation forests. Based on a combination of planting costs, total soil GHG emissions, and unstable soil carbon and nitrogen pools, a SC planting density of 600 plants ha−1 and WR scatter sowing (UM2) is more likely to deliver better ecological results in actual plantings.
Furthermore, this research was conducted solely during the first year after renovation, indicating short-term effects only. Future long-term field experiments are necessary to gain a better understanding of the impact of management practices on soil C and N dynamics in Chinese hickory plantation forests. The chosen vegetation types in this study, SC and WR, possess territorial vegetation characteristics and follow a singular planting pattern and density. Therefore, they serve as an ideal candidate for conducting large-scale studies, combining multiple understory vegetation types in future investigations.

Author Contributions

Conceptualization, Y.S.; data curation, Y.G.; formal analysis, Y.G. and H.S.; investigation, Y.G., H.S., Y.C., S.H., Z.N. and E.W.; funding acquisition, Y.S. and Y.Z.; writing—original draft preparation, Y.G. All authors have read and agreed to the published version of the manuscript.

Funding

This research was funded by the Key Research and Development Program of Zhejiang Province (Grant number: 2022C03039; 2021C02005) and the China National Key Research and Development Program (Grant No. 2023YFE0105100).

Data Availability Statement

Data are contained within the article.

Acknowledgments

We would like to thank the editor and anonymous reviewers for their contributions to the peer-review process of our study.

Conflicts of Interest

The authors declare no conflicts of interest.

References

  1. Lamb, W.F.; Wiedmann, T.; Pongratz, J.; Andrew, R.; Crippa, M.; Olivier, J.G.J.; Wiedenhofer, D.; Mattioli, G.; Khourdajie, A.A.; House, J.; et al. A review of trends and drivers of greenhouse gas emissions by sector from 1990 to 2018. Environ. Res. Lett. 2021, 16, 073005. [Google Scholar] [CrossRef]
  2. Rajeev, J.; Hukum, S. Carbon sequestration potential of disturbed and non-disturbed forest ecosystem: A tool for mitigating climate change. Afr. J. Environ. Sci. Technol. 2020, 14, 385–393. [Google Scholar] [CrossRef]
  3. Qureshi, A.; Kumar, A.; Lal Nag, J. Precision Agriculture and Carbon Sequestration—Need of an Hour in Current Climate Changing Scenario. Int. J. Curr. Microbiol. Appl. Sci. 2018, 7, 1668–1673. [Google Scholar] [CrossRef]
  4. Graves, R.A.; Haugo, R.D.; Holz, A.; Nielsen-Pincus, M.; Jones, A.; Kellogg, B.; Macdonald, C.; Popper, K.; Schindel, M. Potential greenhouse gas reductions from Natural Climate Solutions in Oregon, USA. PLoS ONE 2020, 15, e0230424. [Google Scholar] [CrossRef] [PubMed]
  5. Mäkipää, R.; Abramoff, R.; Adamczyk, B.; Baldy, V.; Biryol, C.; Bosela, M.; Casals, P.; Curiel Yuste, J.; Dondini, M.; Filipek, S.; et al. How does management affect soil C sequestration and greenhouse gas fluxes in boreal and temperate forests?—A review. For. Ecol. Manag. 2023, 529, 120637. [Google Scholar] [CrossRef]
  6. Xu, L.; Deng, X.; Ying, J.; Zhou, G.; Shi, Y. Silicate fertilizer application reduces soil greenhouse gas emissions in a Moso bamboo forest. Sci. Total Environ. 2020, 747, 141380. [Google Scholar] [CrossRef] [PubMed]
  7. Liu, J.; Jiang, P.; Wang, H.; Zhou, G.; Wu, J.; Yang, F.; Qian, X. Seasonal soil CO2 efflux dynamics after land use change from a natural forest to Moso bamboo plantations in subtropical China. For. Ecol. Manag. 2011, 262, 1131–1137. [Google Scholar] [CrossRef]
  8. McIntosh, A.C.; Macdonald, S.E.; Quideau, S.A. Understory Plant Community Composition Is Associated with Fine-Scale Above- and Below-Ground Resource Heterogeneity in Mature Lodgepole Pine (Pinus contorta) Forests. PLoS ONE 2016, 11, e0151436. [Google Scholar] [CrossRef] [PubMed]
  9. Duan, B.; Xiao, R.; Cai, T.; Man, X.; Ge, Z.; Gao, M.; Mencuccini, M. Understory species composition mediates soil greenhouse gas fluxes by affecting bacterial community diversity in boreal forests. Front. Microbiol. 2022, 13, 1090169. [Google Scholar] [CrossRef]
  10. Li, H.-F. Soil CH4 fluxes response to understory removal and N-fixing species addition in four forest plantations in Southern China. J. For. Res. 2010, 21, 301–310. [Google Scholar] [CrossRef]
  11. Xiang, H.; Zhang, Y.B.; Wei, H.; Zhang, J.-E.; Zhao, B.-L. Soil properties and carbon and nitrogen pools in a young hillside longan orchard after the introduction of leguminous plants and residues. PeerJ 2018, 6, e5536. [Google Scholar] [CrossRef]
  12. Das Gupta, S.; Pinno, B.D. Drivers of understory species richness in reconstructed boreal ecosystems: A structural equation modeling analysis. Sci. Rep. 2020, 10, 11555. [Google Scholar] [CrossRef]
  13. Wei, H.; Zhang, K.; Zhang, J.; Li, D.; Zhang, Y.; Xiang, H. Grass cultivation alters soil organic carbon fractions in a subtropical orchard of southern China. Soil Tillage Res. 2018, 181, 110–116. [Google Scholar] [CrossRef]
  14. Yang, Y.-S.; Chen, G.; Guo, J.; Xie, J.-S.; Wang, X.-G. Soil respiration and carbon balance in a subtropical native forest and two managed plantations. Plant Ecol. 2007, 193, 71–84. [Google Scholar] [CrossRef]
  15. Jin, J.; Wang, L.; Müller, K.; Wu, J.-S.; Wang, H.; Zhao, K.L.; Berninger, F.; Fu, W. A 10-year monitoring of soil properties dynamics and soil fertility evaluation in Chinese hickory plantation regions of southeastern China. Sci. Rep. 2021, 11, 23531. [Google Scholar] [CrossRef]
  16. Wu, J.; Lin, H.; Meng, C.; Jiang, P.; Fu, W. Effects of intercropping grasses on soil organic carbon and microbial community functional diversity under Chinese hickory (Carya cathayensis Sarg.) stands. Soil Res. 2014, 52, 575–583. [Google Scholar] [CrossRef]
  17. Jin, J.; Huang, X.; Wu, J.; Zhao, W.; Fu, W. A 10-year field experiment proves the neutralization of soil pH in Chinese hickory plantation of southeastern China. J. Soils Sediments 2022, 22, 2995–3005. [Google Scholar] [CrossRef]
  18. Xu, L.; Fang, H.; Deng, X.; Ying, J.; Lv, W.; Shi, Y.; Zhou, G.; Zhou, Y. Biochar application increased ecosystem carbon sequestration capacity in a Moso bamboo forest. For. Ecol. Manag. 2020, 475, 118447. [Google Scholar] [CrossRef]
  19. Singh, B.P.; Hatton, B.J.; Balwant, S.; Cowie, A.L.; Kathuria, A. Influence of biochars on nitrous oxide emission and nitrogen leaching from two contrasting soils. J. Environ. Qual. 2010, 39, 1224–1235. [Google Scholar] [CrossRef] [PubMed]
  20. Zhang, M.; Fan, C.H.; Li, Q.L.; Li, B.; Zhu, Y.Y.; Xiong, Z.Q. A 2-yr field assessment of the effects of chemical and biological nitrification inhibitors on nitrous oxide emissions and nitrogen use efficiency in an intensively managed vegetable cropping system. Agric. Ecosyst. Environ. 2015, 201, 43–50. [Google Scholar] [CrossRef]
  21. Zhang, J.; Li, Y.; Chang, S.X.; Jiang, P.; Zhou, G.; Liu, J.; Wu, J.; Shen, Z. Understory vegetation management affected greenhouse gas emissions and labile organic carbon pools in an intensively managed Chinese chestnut plantation. Plant Soil 2013, 376, 363–375. [Google Scholar] [CrossRef]
  22. Rao, X.; Liu, C.-A.; Tang, J.-W.; Nie, Y.; Liang, M.-Y.; Shen, W.-J.; Siddique, K.H.M. Rubber-leguminous shrub systems stimulate soil N2O but reduce CO2 and CH4 emissions. For. Ecol. Manag. 2021, 480, 118665. [Google Scholar] [CrossRef]
  23. Tang, X.; Fan, S.-h.; Qi, L.; Guan, F.-Y.; Du, M.; Zhang, H. Soil respiration and net ecosystem production in relation to intensive management in Moso bamboo forests. Catena 2016, 137, 219–228. [Google Scholar] [CrossRef]
  24. Xiao, H.B.; Shi, Z.H.; Li, Z.W.; Chen, J.; Huang, B.; Yue, Z.J.; Zhan, Y.M. The regulatory effects of biotic and abiotic factors on soil respiration under different land-use types. Ecol. Indic. 2021, 127, 107787. [Google Scholar] [CrossRef]
  25. Wu, J.; Liu, Z.; Chen, D.; Huang, G.; Zhou, L.; Fu, S. Understory plants can make substantial contributions to soil respiration: Evidence from two subtropical plantations. Soil Biol. Biochem. 2011, 43, 2355–2357. [Google Scholar] [CrossRef]
  26. Yuze, S.; Li, Y.; Cai, Y.; Fu, S.; Luo, Y.; Wang, H.; Liang, C.; Lin, Z.; Hu, S.; Li, Y.; et al. Biochar decreases soil N2O emissions in Moso bamboo plantations through decreasing labile N concentrations, N-cycling enzyme activities and nitrification/denitrification rates. Geoderma 2019, 348, 135–145. [Google Scholar]
  27. Toma, Y.; Nufita Sari, N.; Akamatsu, K.; Oomori, S.; Nagata, O.; Nishimura, S.; Purwanto, B.; Ueno, H. Effects of Green Manure Application and Prolonging Mid-Season Drainage on Greenhouse Gas Emission from Paddy Fields in Ehime, Southwestern Japan. Agriculture 2019, 9, 29. [Google Scholar] [CrossRef]
  28. Hu, S.; Li, Y.; Chang, S.X.; Li, Y.; Yang, W.; Fu, W.; Liu, J.; Jiang, P.; Lin, Z. Soil autotrophic and heterotrophic respiration respond differently to land-use change and variations in environmental factors. Agric. For. Meteorol. 2018, 250–251, 290–298. [Google Scholar] [CrossRef]
  29. Wardinski, K.M.; Hotchkiss, E.R.; Jones, C.N.; McLaughlin, D.L.; Strahm, B.D.; Scott, D.T. Water-Soluble Organic Matter From Soils at the Terrestrial-Aquatic Interface in Wetland-Dominated Landscapes. J. Geophys. Res. Biogeosci. 2022, 127, e2022JG006994. [Google Scholar] [CrossRef]
  30. Zhang, J.; Li, Y.; Chang, S.X.; Qin, H.; Fu, S.; Jiang, P. Understory management and fertilization affected soil greenhouse gas emissions and labile organic carbon pools in a Chinese chestnut plantation. For. Ecol. Manag. 2015, 337, 126–134. [Google Scholar] [CrossRef]
  31. Karavanova, E.I.; Zolovkina, D.F. The Effect of Litter Composition on the Characteristics of Their Water-Soluble Organic Matter. Mosc. Univ. Soil Sci. Bull. 2020, 75, 67–73. [Google Scholar] [CrossRef]
  32. Wu, Y.-p.; Wang, X.; Hu, R.; Zhao, J.; Jiang, Y. Responses of Soil Microbial Traits to Ground Cover in Citrus Orchards in Central China. Microorganisms 2021, 9, 2507. [Google Scholar] [CrossRef]
  33. Zhao, J.; Wan, S.; Fu, S.; Wang, X.; Wang, M.; Liang, C.; Chen, Y.; Zhu, X. Effects of understory removal and nitrogen fertilization on soil microbial communities in Eucalyptus plantations. For. Ecol. Manag. 2013, 310, 80–86. [Google Scholar] [CrossRef]
  34. Yuan, B.; Yu, D.; Hu, A.; Wang, Y.; Sun, Y.; Li, C. Effects of green manure intercropping on soil nutrient content and bacterial community structure in litchi orchards in China. Front. Environ. Sci. 2023, 10, 1059800. [Google Scholar] [CrossRef]
  35. Zhao, Q.; Classen, A.T.; Wang, W.-W.; Zhao, X.-R.; Mao, B.; Zeng, D.-H. Asymmetric effects of litter removal and litter addition on the structure and function of soil microbial communities in a managed pine forest. Plant Soil 2017, 414, 81–93. [Google Scholar] [CrossRef]
  36. Ding, K.; Zhang, Y.; Yang, A.; Zhang, Y.; Lu, M.; Ge, S.; Qiu, Y.; Zhang, J.; Tong, Z.-k. Understory vegetation restoration improves soil physicochemical properties, enzymatic activity, and changes diazotrophic communities in Cunninghamia lanceolata plantations but depends on site history. Plant Soil 2023, 492, 605–623. [Google Scholar] [CrossRef]
  37. Li, Z.; Li, Y.; Hu, G.; Wu, H.; Liang, Y.; Yan, J.; He, S.; Ganjurjav, H.; Gao, Q. Reclamation intensifies the positive effects of warming on N2O emission in an alpine meadow. Front. Plant Sci. 2023, 14, 1162160. [Google Scholar] [CrossRef] [PubMed]
  38. Truu, M.; Nõlvak, H.; Ostonen, I.; Oopkaup, K.; Maddison, M.; Ligi, T.; Espenberg, M.; Uri, V.; Mander, Ü.; Truu, J. Soil Bacterial and Archaeal Communities and Their Potential to Perform N-Cycling Processes in Soils of Boreal Forests Growing on Well-Drained Peat. Front. Microbiol. 2020, 11, 591358. [Google Scholar] [CrossRef]
  39. Zhang, J.; Peng, C.; Zhu, Q.; Xue, W.; Shen, Y.; Yang, Y.; Shi, G.; Shi, S.; Wang, M. Temperature sensitivity of soil carbon dioxide and nitrous oxide emissions in mountain forest and meadow ecosystems in China. Atmos. Environ. 2016, 142, 340–350. [Google Scholar] [CrossRef]
  40. Liu, Y.; Li, J.; Hai, X.; Wu, J.; Dong, L.; Pan, Y.; Shangguan, Z.; Wang, K.; Deng, L. Carbon inputs regulate the temperature sensitivity of soil respiration in temperate forests. J. Arid. Land 2022, 14, 1055–1068. [Google Scholar] [CrossRef]
  41. Fang, H.J.; Yu, G.R.; Cheng, S.L.; Zhu, T.H.; Wang, Y.S.; Yan, J.H.; Wang, M.; Cao, M.; Zhou, M. Effects of multiple environmental factors on CO2 emission and CH4 uptake from old-growth forest soils. Biogeosciences 2010, 7, 395–407. [Google Scholar] [CrossRef]
  42. Du, M.; Yuan, J.; Zhuo, M.; Sadiq, M.; Wu, J.; Xu, G.; Liu, S.; Li, J.; Li, G.; Yan, L. Effects of different land use patterns on soil properties and N2O emissions on a semi-arid Loess Plateau of Central Gansu. Front. Ecol. Evol. 2023, 11, 1128236. [Google Scholar] [CrossRef]
  43. Lin, S.; Zhang, S.; Shen, G.; Shaaban, M.; Ju, W.; Cui, Y.; Duan, C.; Fang, L. Effects of inorganic and organic fertilizers on CO2 and CH4 fluxes from tea plantation soil. Elem. Sci. Anthr. 2021, 9, 090. [Google Scholar] [CrossRef]
  44. Geng, J.; Cheng, S.; Fang, H.; Yu, G.; Li, X.; Si, G.; He, S.; Yu, G. Soil nitrate accumulation explains the nonlinear responses of soil CO2 and CH4 fluxes to nitrogen addition in a temperate needle-broadleaved mixed forest. Ecol. Indic. 2017, 79, 28–36. [Google Scholar] [CrossRef]
Figure 1. (a,b) Schematic of the location of the test sample plots. (c) Distribution map of the test sample plots; (d) size and spacing distance of each sample plot; (e) Chinese hickory test subjects in the test sample plots; (f) field soil GHG collection tool.
Forests 15 00558 g001
Figure 2. Effects of different understory vegetation modifications on (a) CO2, (b) N2O, and (c) CH4 uptake from Chinese hickory plantation soils. Standard deviations are indicated by error lines.
Forests 15 00558 g002
Figure 3. Effects of different understory vegetation modifications on annual cumulative (a) CO2 emissions, (b) N2O emissions, (c) CH4 uptake, and (d) total soil GHG emissions from Chinese hickory plantation soils. Standard deviations are indicated by error lines. The letters a, b, c, and d are the distinctive symbols of annual emissions or annual absorption.
Forests 15 00558 g003
Figure 4. Effects of different understory management on (a) 5 cm temperature, (b) soil moisture, and (c) pH of Chinese hickory plantation soils. Standard deviations are indicated by error lines.
Forests 15 00558 g004
Figure 5. Effects of different understory management on (a) WSOC and (b) MBC content of Chinese hickory plantation soils. Standard deviations are indicated by error lines.
Forests 15 00558 g005
Figure 6. Effects of different understory management conditions on (a) NO3–N, (b) NH4+–N, (c) WSON, and (d) MBN contents of Chinese hickory plantation soils. Standard deviations are indicated by error lines.
Forests 15 00558 g006
Figure 7. Structural equation modelling of soil WSOC, MBC, NO3–N, NH4+–N, WSON, and MBN concentrations affecting (a) CO2, (b) NO2, and (c) CH4 fluxes after forest understory vegetation conversion. Numbers next to arrows indicate correlation coefficients and significance. R2 indicates the rate of model explanation, GFI is the goodness-of-fit index, NFI is the normative fit index, and CFI is the comparative fit index.
Forests 15 00558 g007
Table 1. Weather and environmental conditions in Lin’an, Hangzhou, Zhejiang, China, from July 2022 to June 2023: average monthly temperature (°C), monthly precipitation (mm).
Weather Environment20222023
Jul.Aug.Spe.Oct.Nov.DecJan.Feb.Mar.Apr.May.Jun.
Average monthly temperature (°C)30.5312417.515−4.5−5.5712.51721.525.5
Precipitation (mm)68.22025.847.427.342.955.563.350.4137.5121.1204.6
Table 2. Stepwise regression analysis model between CO2 flux (mg m−2 h−1) and soil temperature (T, °C), soil moisture (M, g kg−1), water-soluble organic C (WSOC, mg kg−1), microbial biomass C (MBC, mg kg−1), NO3–N, and NH4+–N under the UM1, UM2, UM3, UM4, and CK treatments. N, water-soluble organic N (WSON, mg kg−1), and microbial biomass N (MBN, mg kg−1) were modelled in a stepwise regression analysis. Coefficients in the model are standardized. R2 indicates the rate of model explanation.
GHGTreatmentModeldfR2p
CO2UM1Y = 0.745T480.545**
Y = 0.826T − 0.222WSON480.579**
Y = 1.018T − 0.278WSON − 273WSOC480.615**
Y = 1.251T − 0.392WSON − 426WSOC + 0.282NH4+–N480.662**
UM2Y = 0.857T480.729**
Y = 1.044T − 0.303MBN480.783**
UM3Y = 0.878T480.766**
Y = 1.054T − 0.246MBC480.792**
Y = 1.223T − 0.372MBC − 0.234WSON480.831**
Y = 1.229T − 0.409MBC − 0.179WSON + 0.136pH480.842**
UM4Y = 0.884T480.777**
Y = 1.019T − 0.234NO3–N480.811**
Y = 1.143T − 0.375NO3–N + 0.293NH4+–N480.882**
CKY = 0.881T480.772**
Y = 0.701T + 0.315WSOC480.837**
Y = 0.723T + 0.358WSOC − 0.224WSON480.883**
** represents significance p < 0.01.
Table 3. Stepwise regression analysis model between N2O flux (μg m−2 h−1) and soil temperature (T, °C), soil moisture (M, g kg−1), water-soluble organic C (WSOC, mg kg−1), microbial biomass C (MBC, mg kg−1), NO3–N, and NH4+–N in the UM1, UM2, UM3, UM4, and CK treatments. N, water-soluble organic N (WSON, mg kg−1), and microbial biomass N (MBN, mg kg−1) were modelled in a stepwise regression analysis. Coefficients in the model are standardized. R2 indicates the rate of model explanation.
GHGTreatmentModeldfR2p
N2OUM1Y = 0.712MBC480.496**
Y = 0.807MBC − 0.229NO3–N480.531**
Y = 0.456MBC − 0.305NO3–N + 0.461T480.587**
Y = 0.370MBC − 0.409NO3–N + 0.688T + 0.315NH4+–N480.661**
Y = 0.598MBC − 0.515NO3–N + 0.802T + 0.422NH4+–N − 0.345WSOC480.697**
UM2Y = 0.729T480.521**
Y = 0.720T + 0.334NH4+–N480.627**
Y = 0.824T + 0.458NH4+–N − 0.333WSON480.708**
UM3Y = 0.712T480.496**
Y = 0.785T + 0.388M480.635**
Y = 0.755T + 0.424M + 0.237NH4+–N480.685**
Y = 0.805T + 0.298M + 0.230NH4+–N − 0.215WSON480.706**
Y = 1.108T + 0.302M + 0.147NH4+–N − 0.313WSON − 0.358MBC480.750**
UM4Y = 0.718T480.505**
Y = 0.754T + 0.397M480.657**
Y = 0.788T + 0.441M + 0.206NH4+–N480.692**
CKY = 0.685WSOC480.457**
Y = 0.441WSOC + 0.427T480.573**
Y = 0.503WSOC + 0.458T − 0.324WSON480.668**
Y = 0.551WSOC + 0.715T − 0.369WSON−0.377MBN480.730**
Y = 0.436WSOC + 0.777T − 0.329WSON − 0.349MBN + 0.194M480.756**
** represents significance p < 0.01.
Table 4. Stepwise regression analysis model between CH4 flux (μg m−2 h−1) and soil temperature (T, °C), soil moisture (M, g kg−1), water-soluble organic C (WSOC, mg kg−1), microbial biomass C (MBC, mg kg−1), NO3–N, and NH4+-H in the UM1, UM2, UM3, UM4, and CK treatments. N, water-soluble organic N (WSON, mg kg−1), and microbial biomass N (MBN, mg kg−1) were modelled in a stepwise regression analysis. Coefficients in the model are standardized. R2 indicates the rate of model explanation.
GHGTreatmentModeldfR2p
CH4UM1Y = 0.665MBC480.430**
Y = 0.805MBC − 0.339NO3–N480.518**
Y = 0.602MBC − 0.360NO3–N + 0.362MBN480.599**
UM2Y = 0.706MBC480.488**
Y = 0.468MBC + 0.422MBN480.603**
Y = 0.479MBC + 0.542MBN − 0.263NO3–N480.651**
Y = 0.472MBC + 0.577MBN − 0.254NO3–N − 0.176M480.675**
Y = 0.489MBC + 0.656MBN − 0.411NO3–N − 0.237M + 0.249NH4+–N480.711**
UM3Y = 0.681MBC480.466**
Y = 0.685MBC − 0.278WSON480.535**
Y = 0.250MBC − 0.492WSON + 0.603T480.666**
UM4Y = 0.730MBC480.523**
Y = 0.663MBC + 0.279M480.589**
Y = 0.377MBC + 0.314M + 0.354MBN480.630**
CKY = 0.665T480.431**
Y = 0.792T + 0.296NH4+–N480.493**
Y= 0.520T + 0.346NH4+–N + 0.429MBC480.583**
Y = 0.805T + 0.486NH4+–N + 0.397MBC − 0.358WSOC480.649**
Y = 0.900T + 0.562NH4+–N + 0.255MBC − 0.454WSOC + 0.308PH480.719**
** represents significance p < 0.01.
Disclaimer/Publisher’s Note: The statements, opinions and data contained in all publications are solely those of the individual author(s) and contributor(s) and not of MDPI and/or the editor(s). MDPI and/or the editor(s) disclaim responsibility for any injury to people or property resulting from any ideas, methods, instructions or products referred to in the content.

