1. Introduction
The fierce global warming and human activities have had significant impacts on vegetation [
1], and vegetation degradation is an important external expression of vulnerability [
2]. Land use changes and intensified environmental pollution caused by human activities can both result in vegetation degradation [
3,
4] and further increase vegetation vulnerability. Also, continuous global warming can increase the vulnerability of 50% of vegetation on Earth [
5]. In the 21st century, where climate change and human activities are more complex, vegetation vulnerability is more serious [
6].
The concept of “vulnerability” is defined as “the degree to which a system, sub-system, or system component is likely to experience harm due to exposure to a hazard, either a perturbation or a stress/stressor” [
7]. The commonly used quantitative vulnerability assessment frameworks are the analytic hierarchy process [
8] and principal component analysis [
9]. Principal component analysis can achieve data transformation by transforming multiple high-correlation variables into minority low-correlation variables through orthogonal transformation and is often used in assessment frameworks with both natural factors and human factors [
9]. With the development and application of GIS and RS technology, vulnerability assessment systems have become more objective, and visual expression makes vulnerability more intuitive [
10]. Current studies on vegetation vulnerability are mostly based on the changes in net primary production (NPP) and gross primary production (GPP) [
11]. Few studies comprehensively assess vegetation vulnerability by constructing indicator systems.
There have been many studies focusing on the impact of future climate change on vulnerability. These studies used assumed incremental scenarios (average temperature and precipitation increasing equidistant from baseline to the future) [
12] and GCMs (general circulation models) [
13] as the main input data. However, the spatiotemporal resolution of data in existing research is relatively rough. Most prediction models do not take the impact of human activities on vulnerability into consideration and only use a single climate change scenario, which increases the uncertainty of prediction. The CMIP6 dataset is currently the most accurate and high spatiotemporal resolution dataset for simulating future climate change, and SSP1-2.6, SSP2-4.5, and SSP5-8.5 are taken to be representatives of low-, medium-, and high-emission scenarios, respectively [
14]. It can reflect the comprehensive effects of climate and socio-economic factors and has been widely used in predicting future land use patterns [
15]. However, the CMIP6 dataset is barely applied to predict vegetation vulnerability.
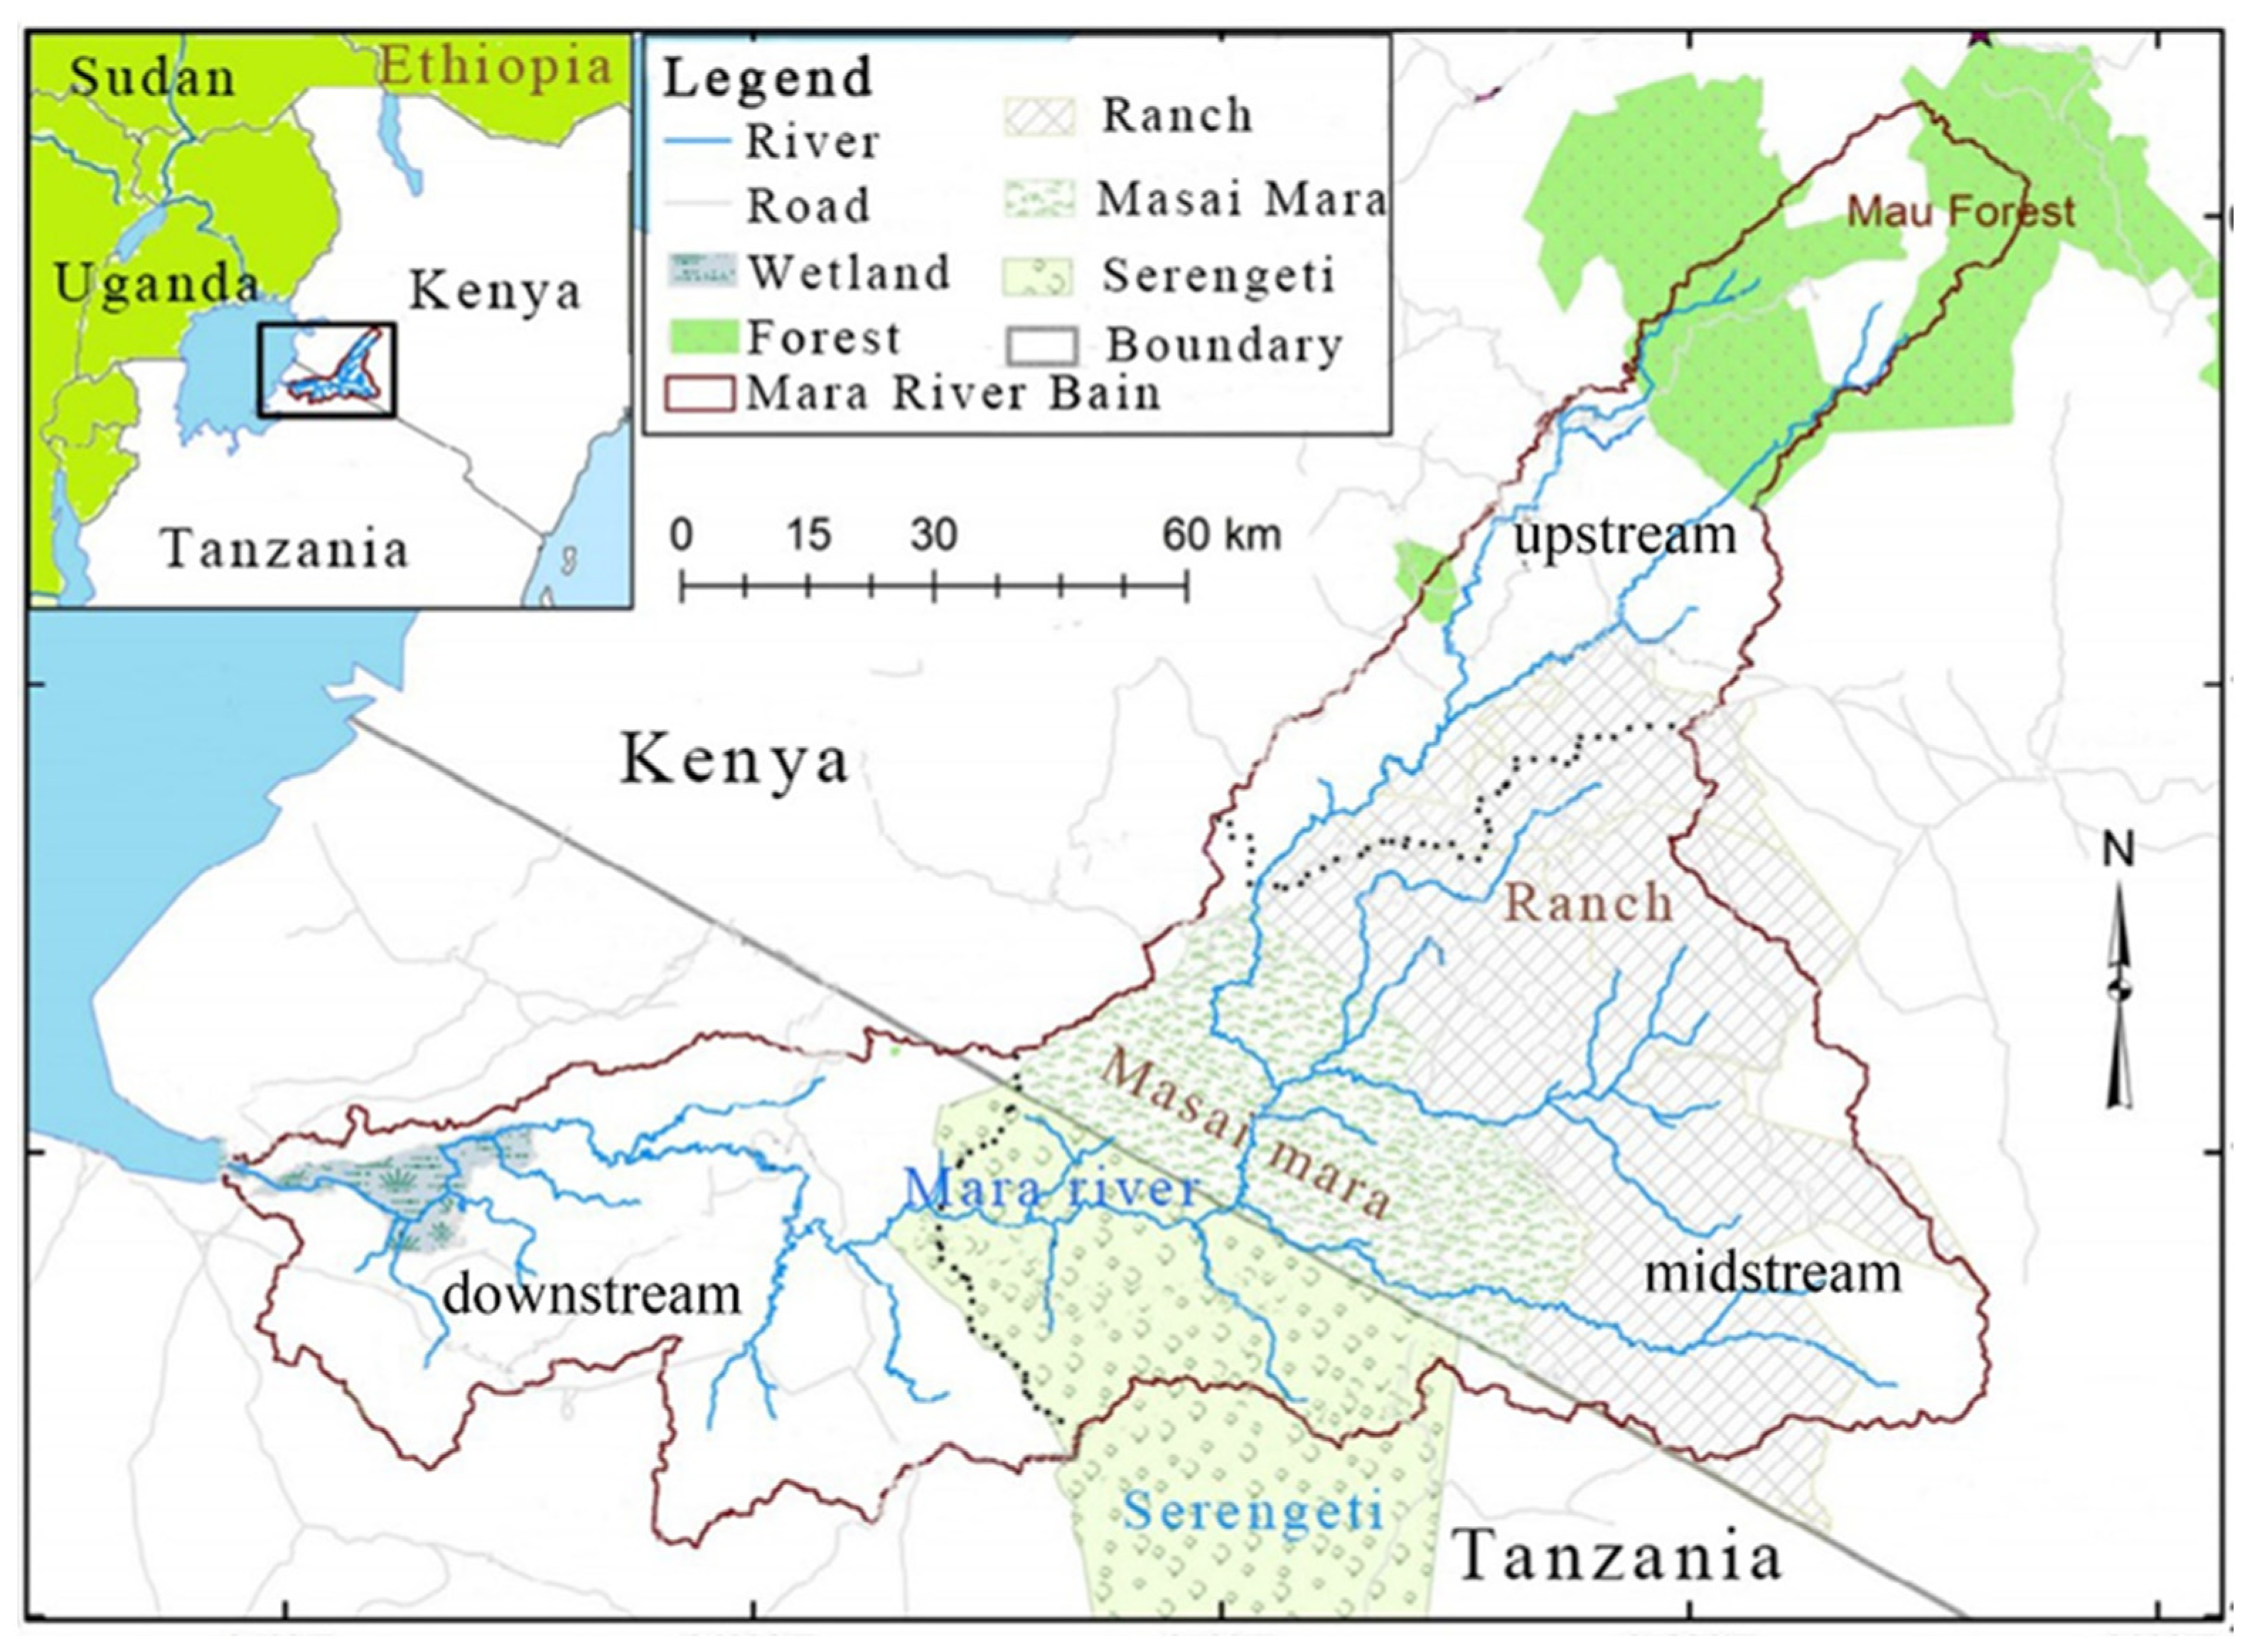
In the past few decades, vegetation in Sub-Saharan Africa has experienced extensive degradation [
16]. The Mara River Basin (MRB) is the home of many precious animals, but one of the most serious vegetation degradation areas due to intensive deforestation, tourism, and mining since the 1970s [
17,
18,
19], it is one of the most serious vegetation degradation areas in the world. The rapid growth of the population in MRB has led to a soaring demand for agriculture and animal husbandry, which destroys much natural vegetation [
20,
21]. The vegetation degradation increases the vegetation vulnerability, and many animals become homeless in the MBR. In addition, the elevation fluctuation exceeds 1000m in the MRB, and the huge elevation fluctuation makes vegetation habitats complex and more susceptible to climate change and human activities, posing a threat to vegetation vulnerability [
9]. Considering the climate and human activities will be more complex in the 21st century [
22], it is necessary to know the future vegetation vulnerability in advance to protect natural vegetation and precious animals in MRB.
The vulnerability threat caused by vegetation degradation has been studied in many regions, and RS and GIS are important methods for studying vegetation vulnerability in areas with limited data. The studies on vegetation in the MRB mainly focus on the mapping of vegetation types [
23], the response of vegetation to climate change [
24], and the calculation of vegetation ecological water demand [
25], trying to understand the changes in vegetation under natural and socio-economic changes [
26,
27]. However, there are relatively few studies studying vegetation vulnerability. Therefore, taking 2010-2019 as the base period, evenly divided the remaining years of the 21st century as near future period (2020–2059) and distinct future period (2060–2099), vegetation vulnerability system, principal component analysis, and three CMIP6 scenarios (SSP1-2.6, SSP2-4.5, SSP5-8.5) were used to assess vegetation vulnerability in the MRB. Then the spatial cluster of vegetation vulnerability was revealed by spatial correlation analysis, and the stochastic matrix was used to analyze the transition of vegetation vulnerability among the base period, near future period, and distinct future period. This study can provide a comprehensive understanding of vegetation vulnerability and point out the areas with severe vulnerability in the future in the MRB. It can also provide a further understanding of the relationship between vegetation protection and geographic location under different SSPs for scientific support and comprehensive decision-making for vegetation protection for the local government.
4. Results
4.1. Factor Scores
The scores of natural and human factors were shown in
Table 4, the factor scores varied greatly for different periods. Natural factors scored higher than human factors for all periods, and temperature obtained the biggest negative score, land use obtained the biggest positive score. From the low to high emission scenarios, the score of population increased rapidly, and the score of vegetation decreased.
For the base period, temperature obtained the biggest negative score, and land use and elevation obtained the biggest positive score. Precipitation and temperature were factors that contributed significantly to vegetation vulnerability for the near future period and distinct future period. From low to high emission scenarios, for the near future period, the scores of precipitation, temperature, and vegetation decreased, while the scores of land use and population increased. The situation was the same for the distinct future period.
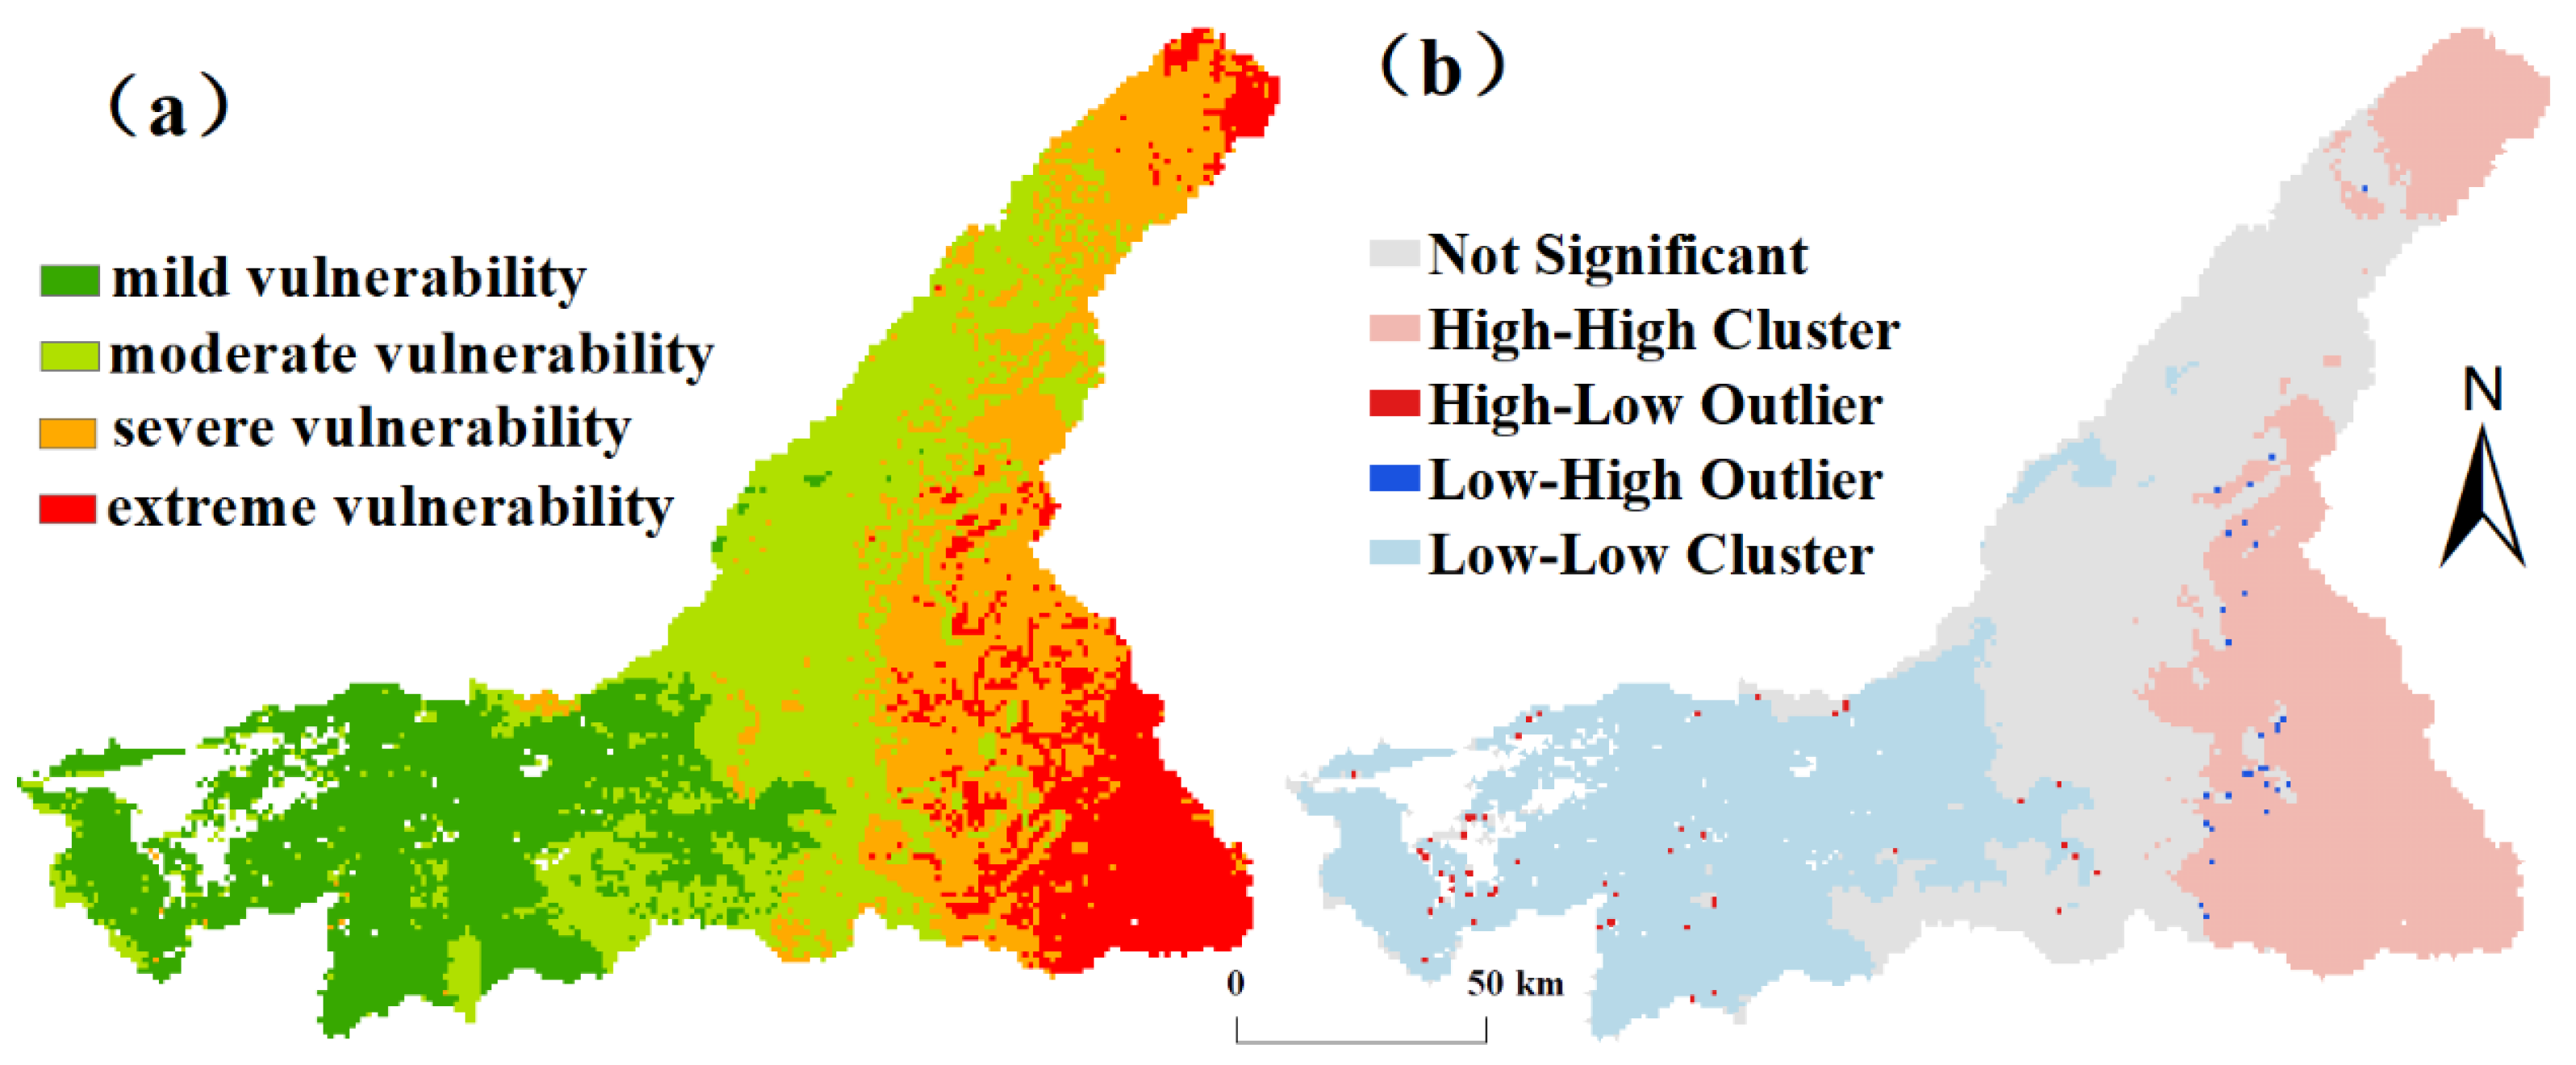
4.2. Vegetation Vulnerability and Spatial Cluster for the Base Period in MRB
Figure 3a shows the spatial distribution of vegetation vulnerability for the base period in MRB. The natural breakpoint method was used to divide the vegetation vulnerability into four categories, namely mild vulnerability, moderate vulnerability, severe vulnerability, and extreme vulnerability. For the base period, extreme vulnerability was in the east part of MRB, and mild vulnerability was in the downstream. There was a decreasing trend in vegetation vulnerability from east to west in the MRB.
The global Moran’s
I of vegetation vulnerability for the base period was 0.7868, the
Z-value was 26.1325, the variance was 0.0009, and the
p-value was less than 0.01. This indicated a strong positive correlation between vegetation vulnerability and geographical location (
Figure 3b). Specifically, severe vulnerability and extreme vulnerability were mostly in the high–high cluster, while mild vulnerability was almost in the low–low cluster.
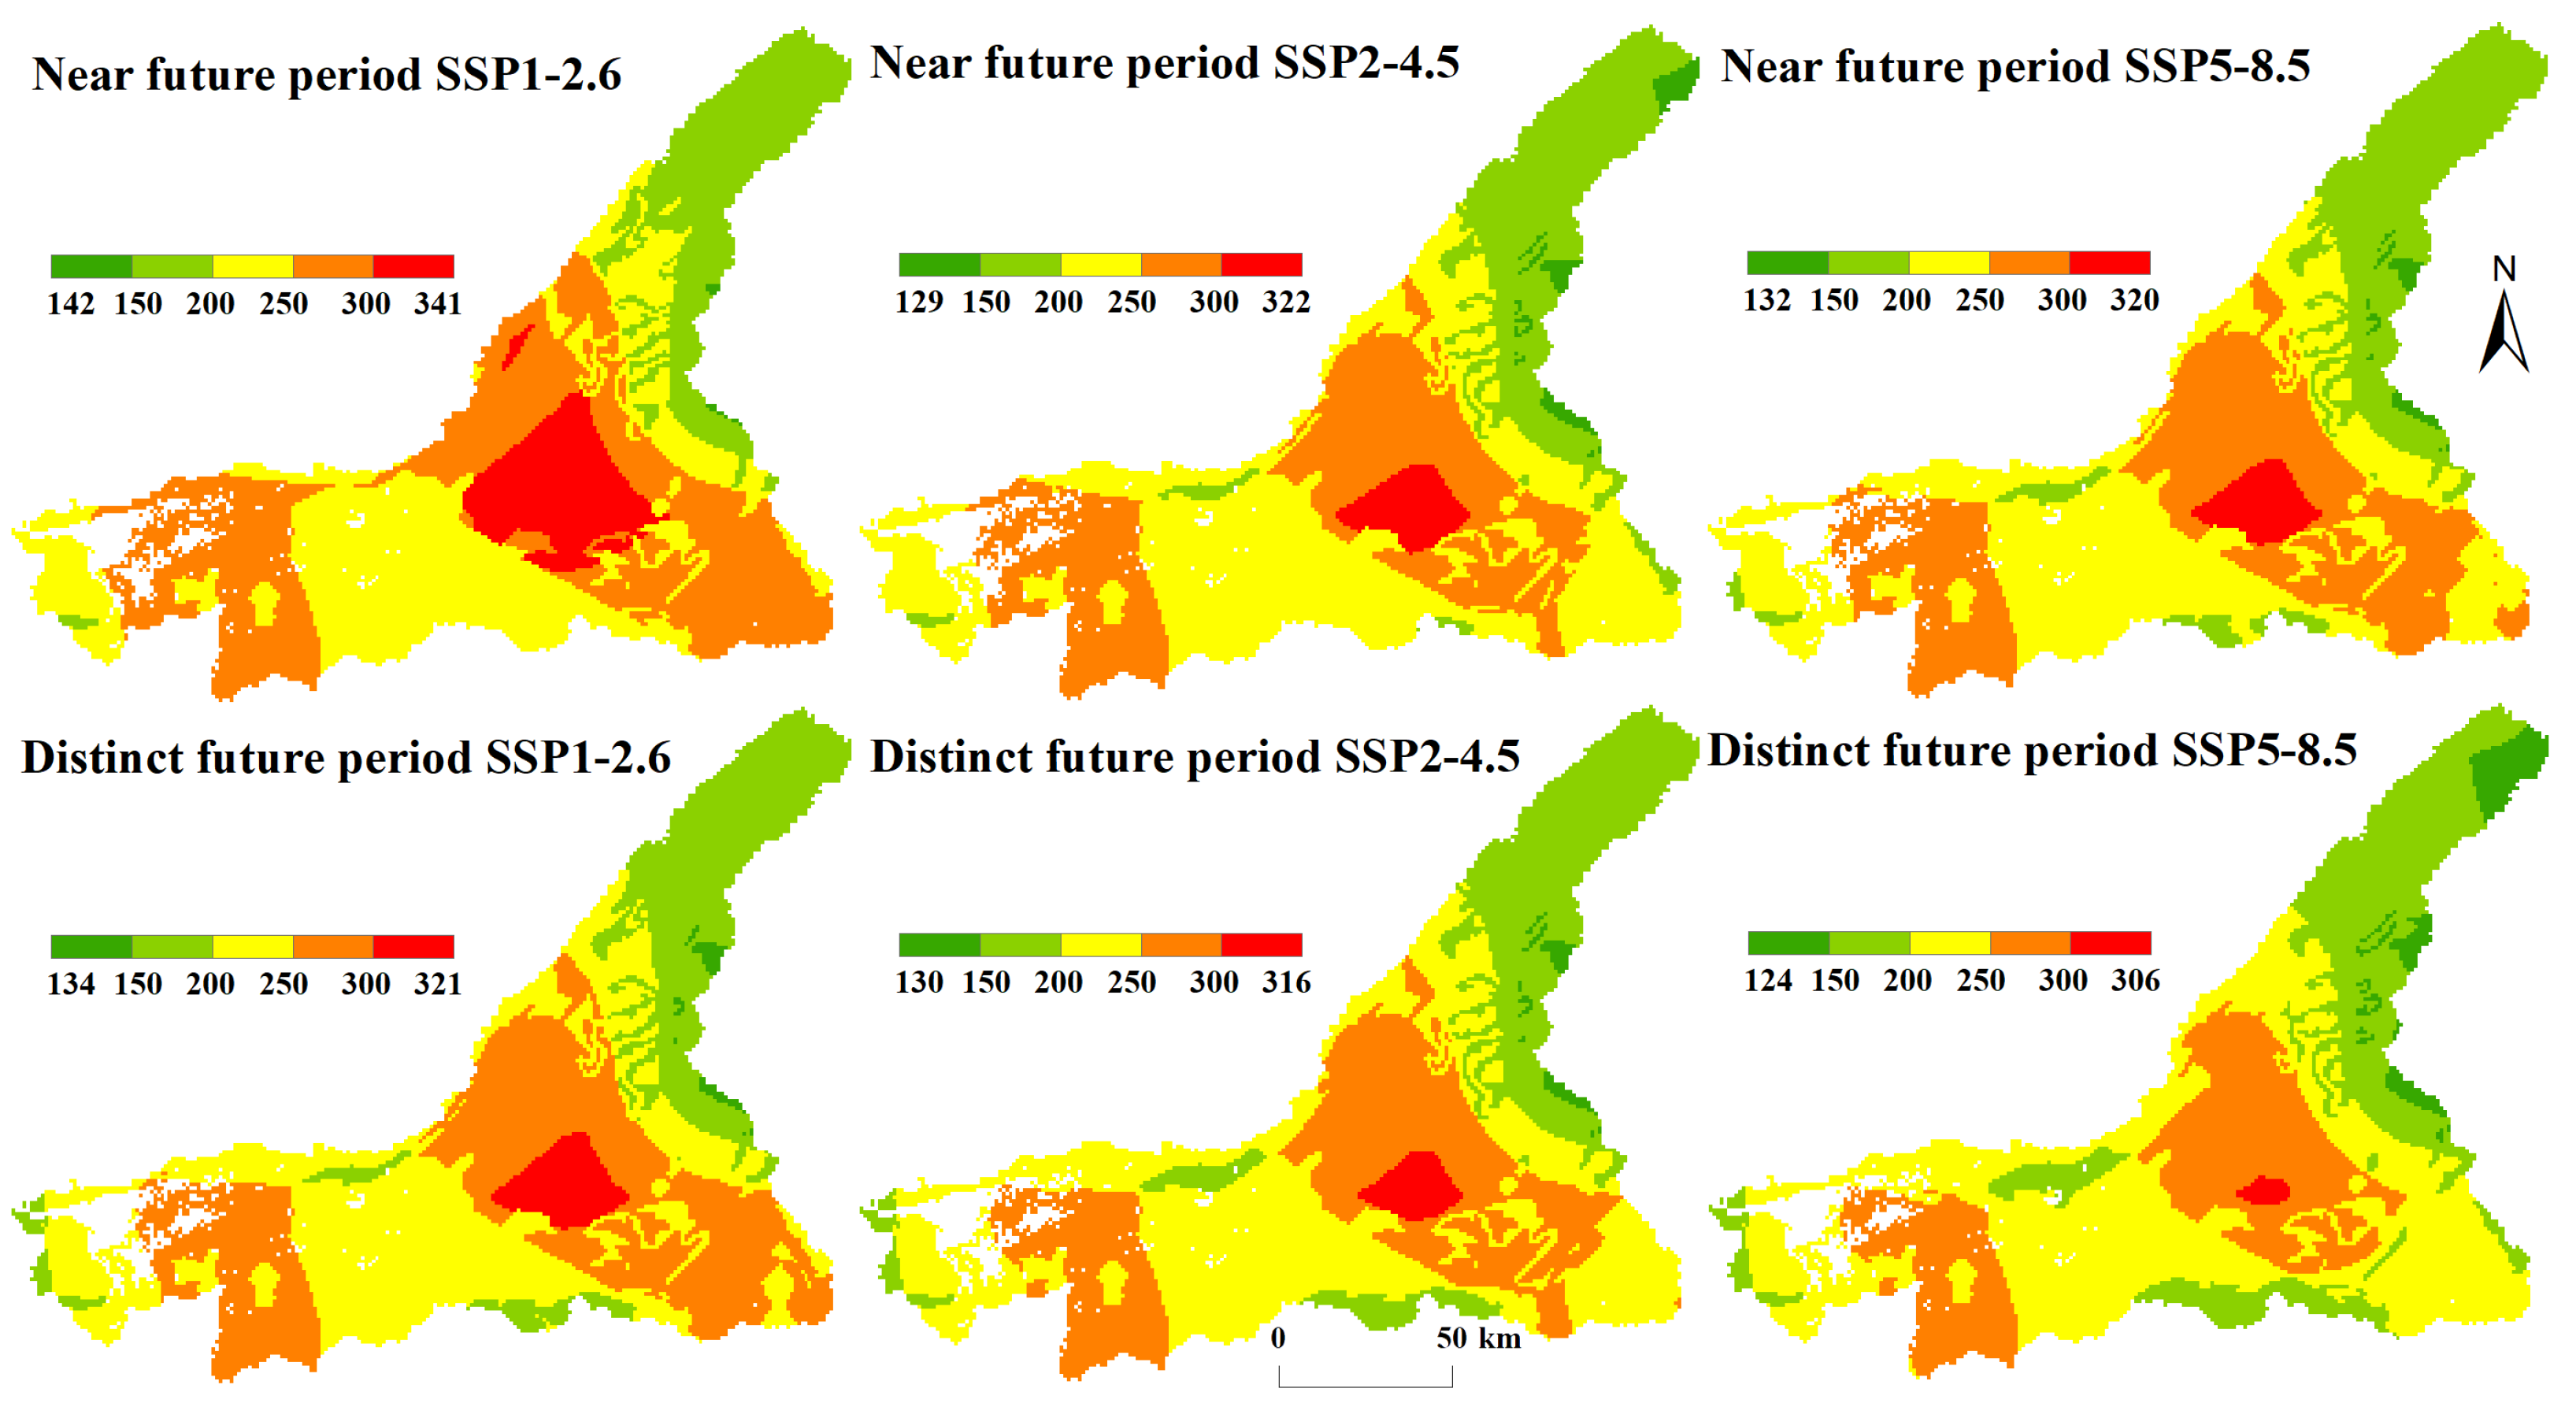
4.3. Vegetation Vulnerability for the Near-Term and Distinct Future Period in MRB
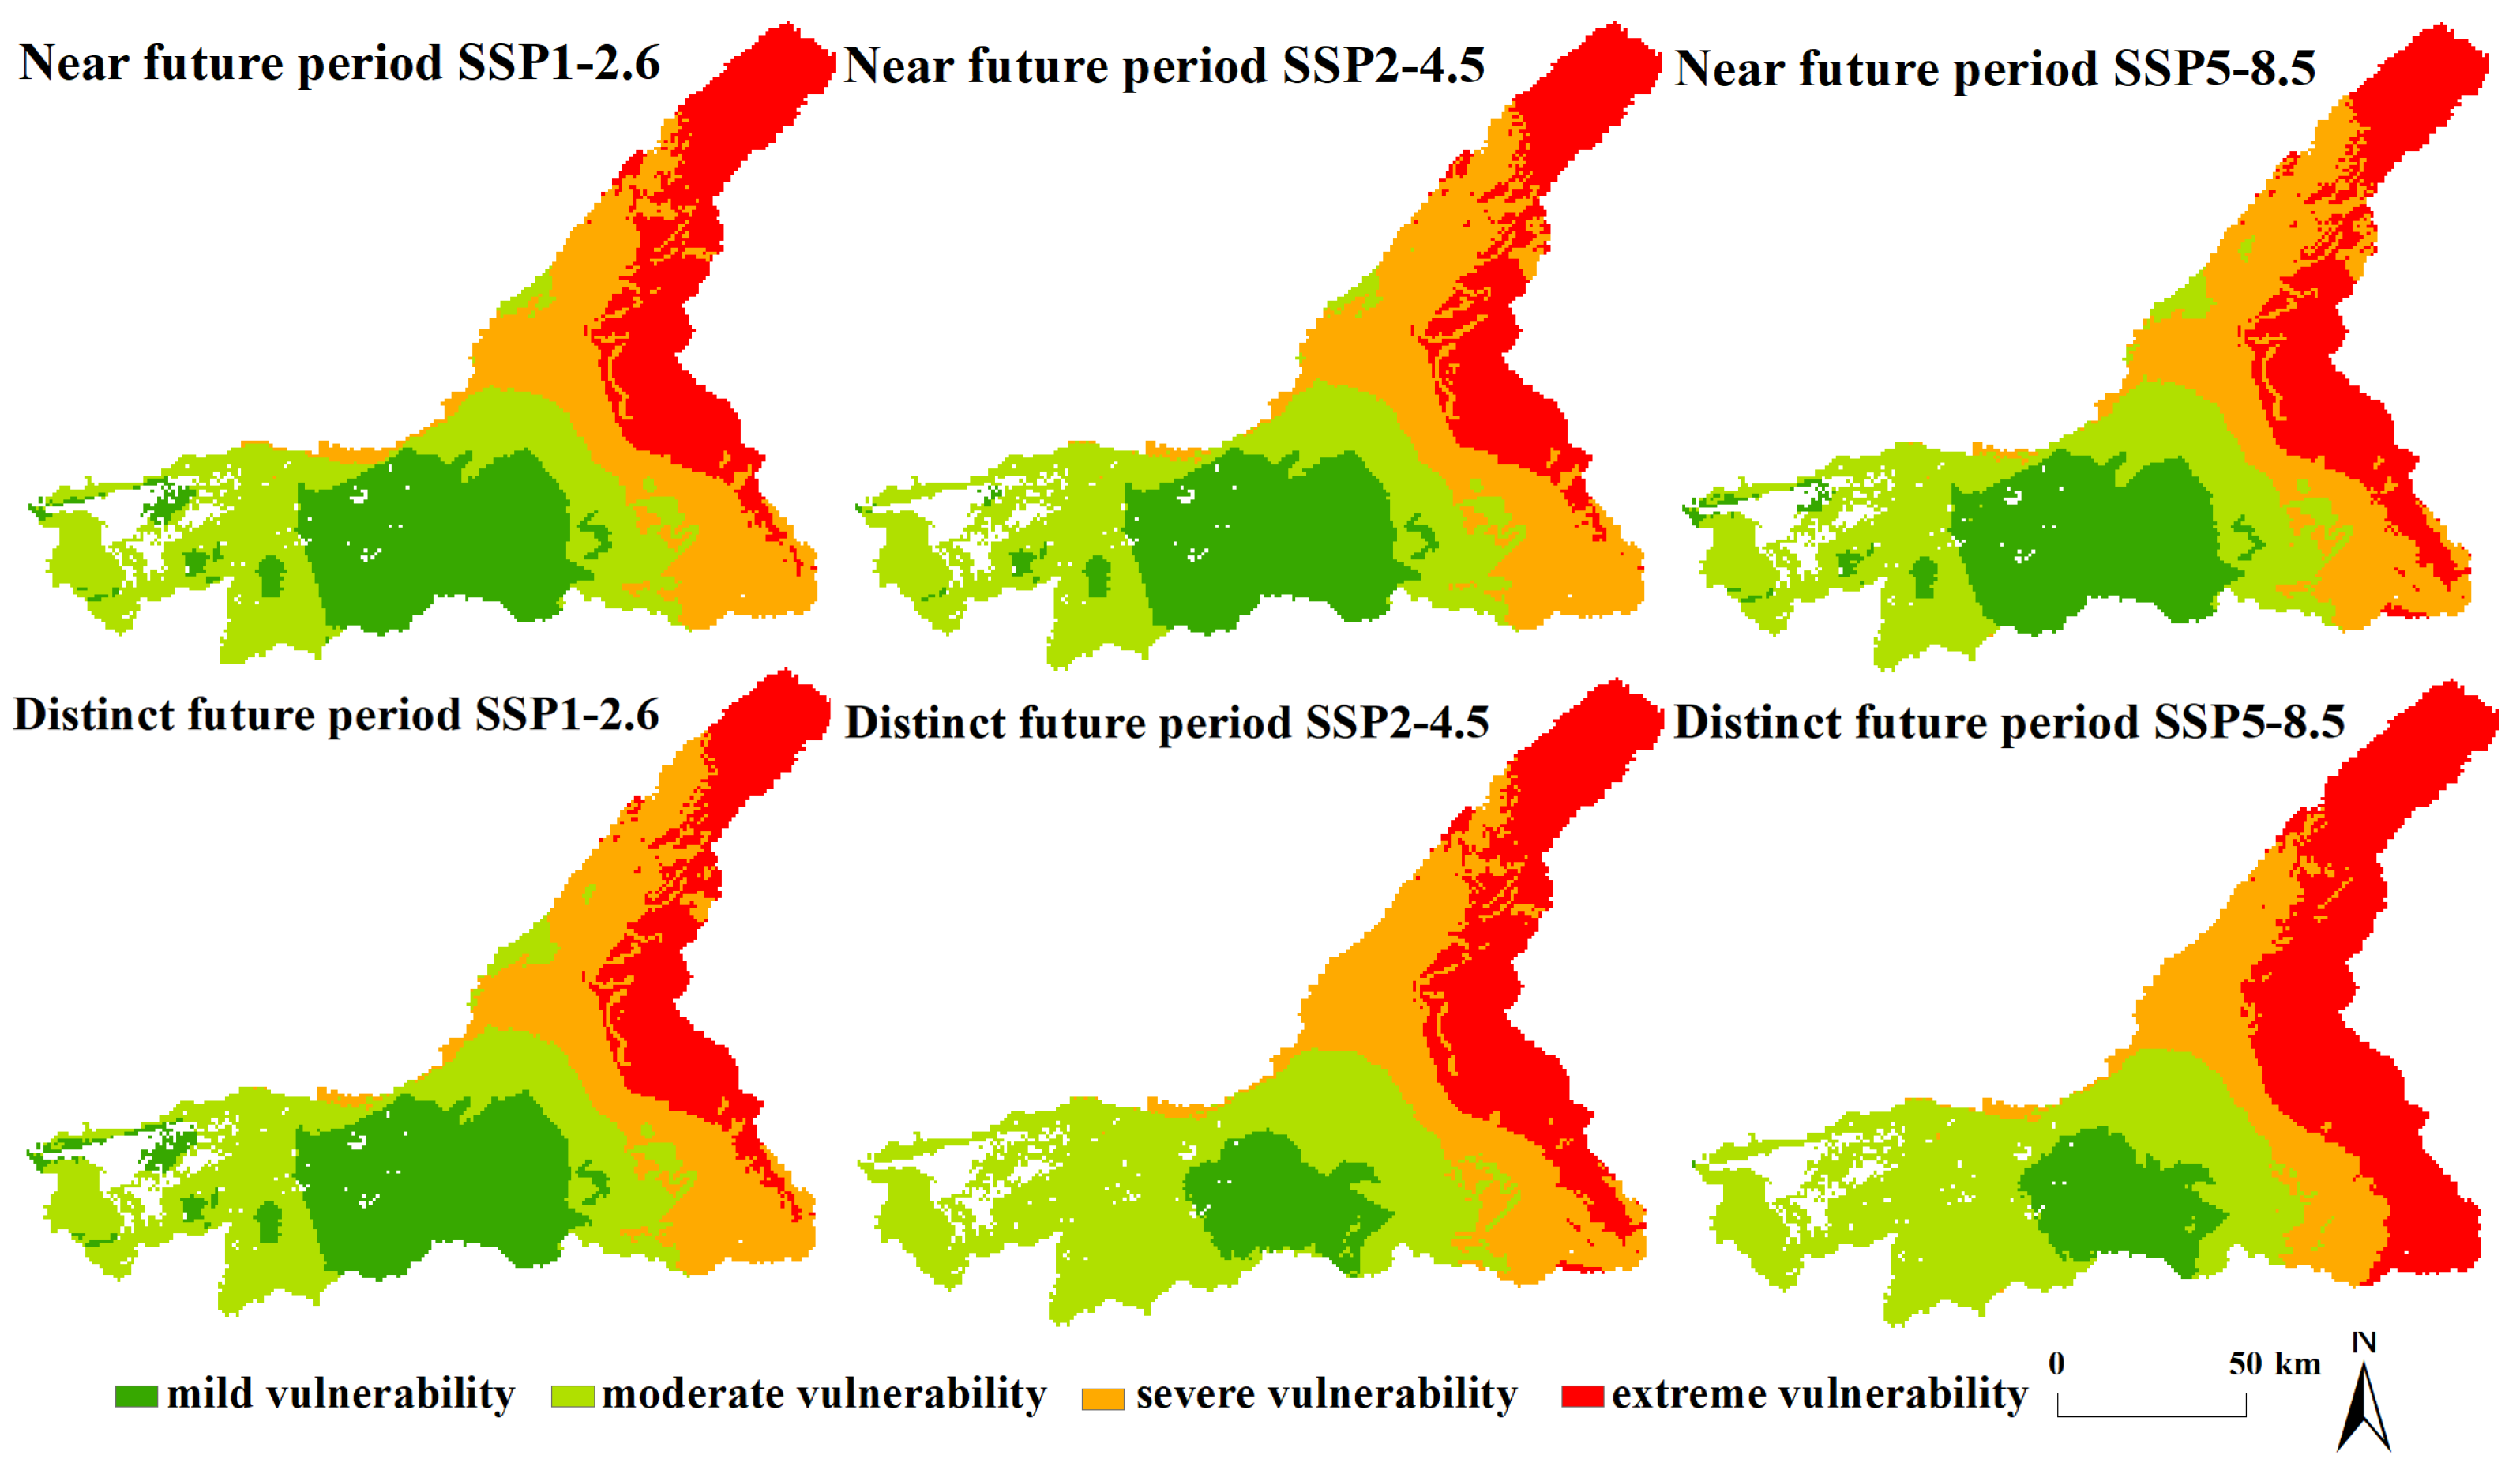
The vegetation vulnerability for the near future period and distinct future period showed a decreasing trend from the upstream to the downstream, with the center being the smallest (
Figure 4). For the near future period, from low to high emission scenarios, the area of mild vulnerability and moderate vulnerability decreased by about 6%, and the area of extreme vulnerability increased by about 8%. For the distinct future period, from low to high emission scenarios, the area of mild vulnerability decreased by about 50%, and the area of severe vulnerability increased by about 20%.
From the near future period to the distinct future period, under the SSP1-2.6, the area of severe vulnerability increased by about 6%, and the area of extreme and mild vulnerability decreased by about 16% and 12%, respectively. Under the SSP2-4.5, the area of mild vulnerability decreased by about 56%, and the area of extreme vulnerability increased by about 33%. Under the SSP5-8.5, the area of mild vulnerability decreased by 50%, and the area of severe vulnerability and extreme vulnerability increased by 20% and 40%, respectively. The vegetation vulnerability increased faster under higher emission scenarios from the near future period to the distinct future period.
4.4. Spatial Cluster of Vegetation Vulnerability for the near Future Period and the Distinct Future Period in the MRB
4.4.1. Global Moran’s I
Table 5 shows the results of global Moran’s
I of vegetation vulnerability in the MRB for the near future period and distinct future period. The Moran’s
I was positive in all scenarios, fluctuating between 0.41 and 0.68. The
p-values were less than 0.01. This indicated a strong positive correlation between vegetation vulnerability and geographical location in the MRB for the near future period and distinct future period.
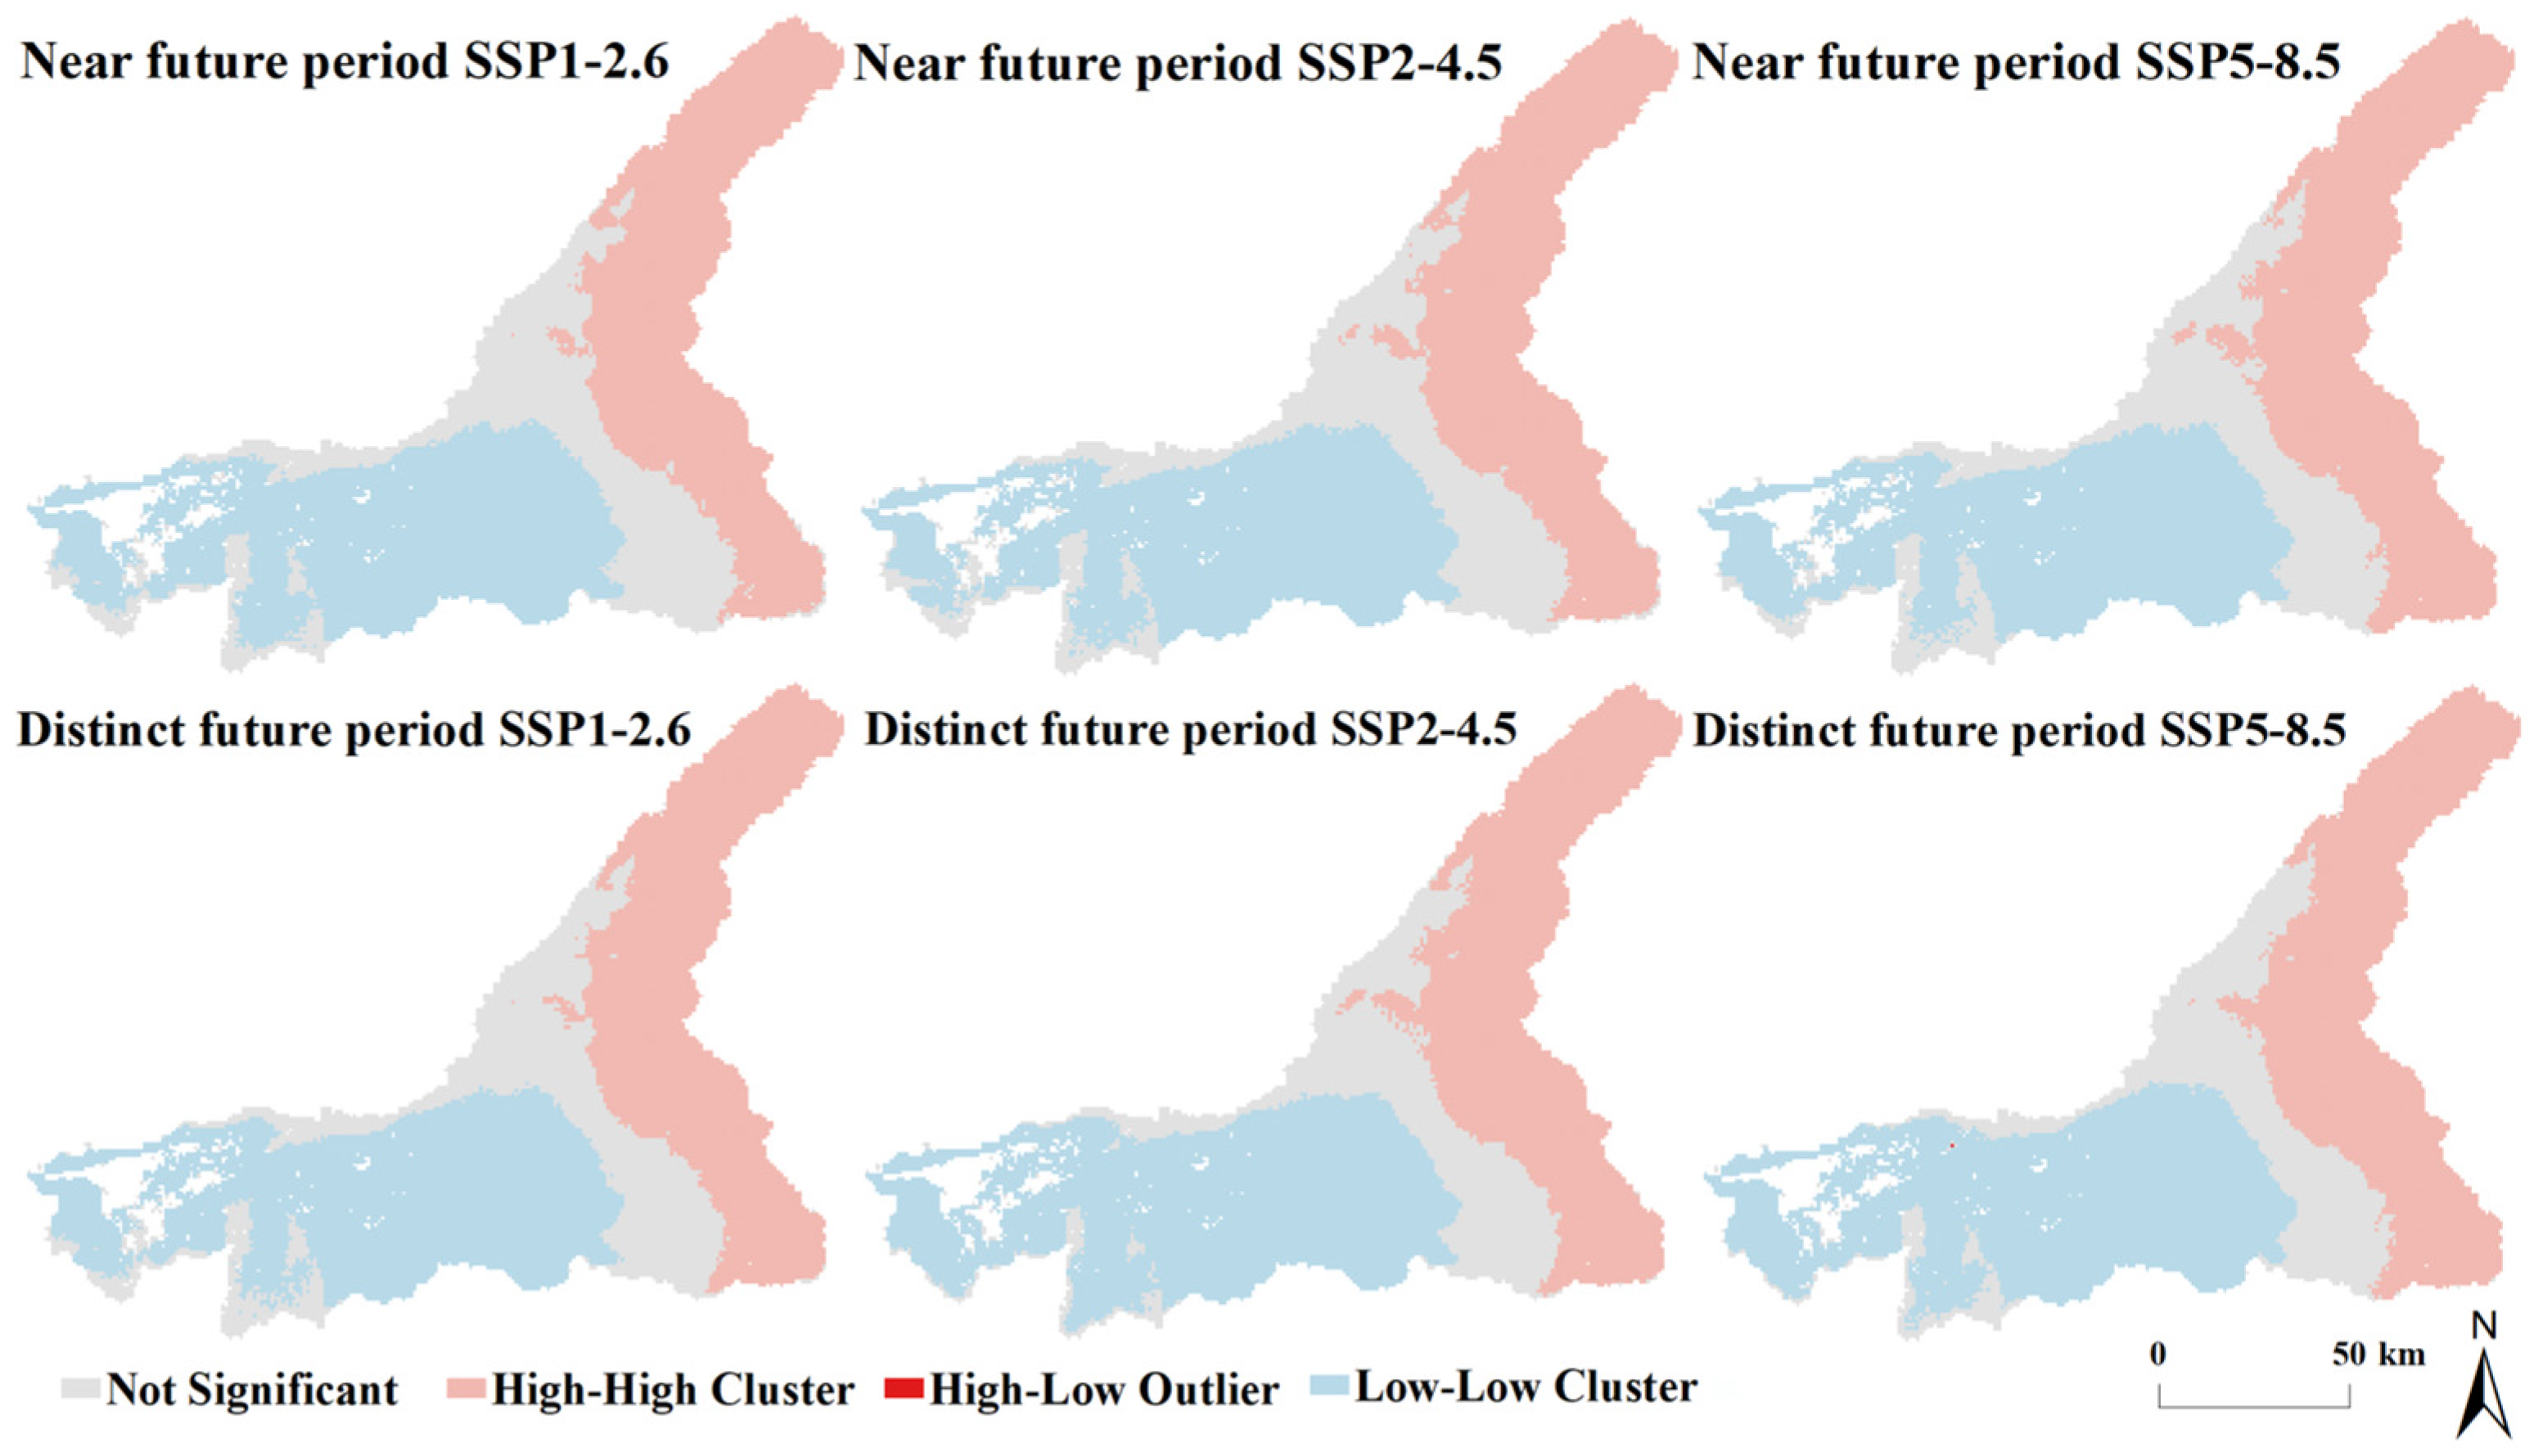
4.4.2. Local Moran’s I
The LISA cluster of vegetation vulnerability for the near future period and distinct future period in the MRB is shown in
Figure 5. The cluster pattern of vegetation vulnerability was a high–high cluster upstream, low–low cluster downstream, not significant midstream for the near future period, and distinct future period in the MRB. There were no high–low outliers and low–high outliers, which indicated that the cluster of vegetation vulnerability was extremely concentrated for the near future period and distinct future period in the MRB. Specifically, the high vegetation vulnerability was in the high–high cluster upstream, the low vulnerability was in the low–low cluster downstream.
From low to high emission scenarios, the area of high–high clusters increased, and the area of low–low clusters decreased. This changing trend was more obvious for the distinct future period. Under the SSP1-2.6, from the near future period to the distinct future period, the area of the high–high cluster decreased upstream, and the low–low cluster increased downstream. The situation was similar under the SSP2-4.5, but the changing areas were larger than the SSP1-2.6. Under the SSP5-8.5, from the near future period to the distinct future period, the area of high–high clusters and low–low clusters both increased. This indicated that from the near future period to the distinct future period, the vegetation vulnerability could be reduced under a low-emission scenario.
4.5. Transition of Vegetation Vulnerability during Different Periods in the MRB
Table 6 shows the transition of vegetation vulnerability during different periods. From the base period to the near future period, under the SSP1-2.6, the mild vulnerability, moderate vulnerability, and severe vulnerability had the largest transition area into moderate vulnerability, severe vulnerability, and extreme vulnerability, respectively, with the area all over 1200 km
2. The transition area from extreme vulnerability to severe vulnerability was twice the area where extreme vulnerability remained unchanged. Under the SSP2-4.5, the mild vulnerability, moderate vulnerability, and severe vulnerability still had the largest transition area into moderate vulnerability, severe vulnerability, and extreme vulnerability, respectively, but the transition area increased 100 km
2 compared to the SSP1-2.6. The transition area of extreme vulnerability to severe vulnerability decreased by 50 km
2 compared to the SSP1-2.6. Under the SSP5-8.5, the transition area of mild vulnerability, moderate vulnerability to severe vulnerability, and extreme vulnerability increased more rapidly compared to the SSP1-2.6 and SSP2-4.5. The area of extreme vulnerability remained unchanged and was the largest compared to the SSP1-2.6 and SSP2-4.5.
From the base period to the distinct future period, under the SSP1-2.6, the area of mild vulnerability transformed into moderate vulnerability unchanged and was almost the same as the area of unchanged mild vulnerability. Similarly, the area of moderate vulnerability transformed into mild vulnerability and was almost the same as the area of unchanged moderate vulnerability, but smaller than the area in which moderate vulnerability transformed into severe vulnerability. Compared with the base period to the near future period, the transition area of severe vulnerability to extreme vulnerability was much less, and the transition area of extreme vulnerability to severe vulnerability was a little less. Under the SSP2-4.5, compared with the base period to the near future period, the transition area of mild vulnerability to moderate vulnerability increased by about 800 km2. The area transformed from moderate vulnerability to mild vulnerability decreased obviously, but the area from moderate vulnerability transformed to extreme vulnerability and increased by 139.41%. The area of unchanged extreme vulnerability increased by 37.73%. Under the SSP5-8.5, the vegetation vulnerability transition was similar to the SSP2-4.5. Compared with the base period to the near future period, the area of mild vulnerability, moderate vulnerability, and severe vulnerability transformed to moderate vulnerability, severe vulnerability, and extreme vulnerability and all increased by about 100 km2. In addition, the area of unchanged extreme vulnerability increased by 77.28% compared with the base period to the near future period.
Under all scenarios, from the base period to the near future period or to the distinct future period, there was no transition between mild vulnerability and extreme vulnerability. From low to high emission scenarios, the area of unchanged vulnerability or less vulnerability gradually decreased, and the area transformed into higher vulnerability increased. From the near future period to the distinct future period, the transition to higher vulnerability became much more obvious, and the transition increased fast under a high emission scenario.


