Abstract
Vegetation plays a leading role in restoring desert ecosystems and increasing productivity. In this study, we elucidate the improvement effects of different restoration areas of Populus alba on the soil particle distribution, sedimentation environment, and fractal characteristics. We selected the restoration areas of P. alba × Caragana korshinskii (YN), P. alba × Hedysarum leave (YY), and P. alba × Hedysarum scoparium (YH), which have a history of twenty-one years. We analyzed the soil nutrients, soil particle size, soil particle size parameters, soil fractal dimension (D) values, and soil multifractal parameters at soil depths of 0–80 cm. We found that the YN, YY, and YH significantly increased the soil nutrients and soil fine particles (p < 0.05) and changed the deposition pattern of the soil particles in the sandy area. The YN, YY, and YH promote soil particle refinement and reduce the sorting performance of the soil particles. The vegetation promotes extremely positive-skewed and very leptokurtic soil particle distributions. The D values in the YN, YY, and YH restoration areas increased by 7.62%–27.94%, 7.36%–26.28%, and 7.10%–17.92%, respectively, relative to those of the LS. The construction of the different restoration areas of P. alba has made the distribution of the soil particles nonuniform. Compared with the YY and YH plantations, the distribution range of the soil particles in the YN plantation is wider, and the distribution heterogeneity is greater. In addition, we found that the fractal parameters are influenced by the soil physicochemical properties, the depositional environment, and vegetation factors. Therefore, we believe that D values and multifractal parameters are necessary as additional information for desert soil texture improvement. The results of this study provide a scientific and theoretical basis for the future revegetation of deserts.
1. Introduction
Desertification resulting from human activities and changing climate patterns has received much attention from countries in recent years [1]. Alarming data show that desertification covers 40% of the global land surface [2]. The Chinese Government has provided the world with a series of experiences in desertification control, such as the Three-North Shelterbelt Program and the Beijing–Tianjin Sandstorm-Control Program [3,4]. Africa built the “Great Green Wall” in the Sahel region to achieve healthier living goals and promote human health and well-being [5]. The implementation of the Spanish Forestry Plan reduces soil erosion and achieves soil conservation through land reforestation [6]. Through long-term remote sensing and field monitoring, researchers have found that growing the right number of plants is the most sustainable and effective way to restore degraded land [7,8]. It is recognized worldwide that moderate afforestation can effectively improve desertification. Vegetation as a roughness element impedes airflow, leading to the gravitational deposition of windborne sediment patterns [9]. This deposition has an immediate and long-term impact on the desert, positively affecting the soil fertility and affecting plant growth directly [10,11]. In addition, plant root secretions and litter facilitate the cycling process of nutrients in the soil and the management of available resources [12,13].
Soil particle distribution is a crucial and widely used indicator of the land degradation in desert areas. There is a high correlation between soil fine particles and soil nutrients (i.e., higher fertility in soil that is rich in clay and silt) [14]. The soil particle size distribution is the basis of the soil physical properties, and the particle size parameters are usually used to reflect the soil erosion process. The particle size parameter characteristics (i.e., mean particle size, skewness, kurtosis, and sorting) reflect the effects of wind on sand transport and sorting. Many studies have focused on the particle size and distribution of mobile dunes, such as those of the Tengger Desert [15] and the Great Indian Desert [16]. The particle size parameter characteristics are affected by vegetation. When vegetation is restored on mobile sandy land, the changes in the airflow patterns caused by vegetation affect the distribution of sediments. Miri and Webb, (2024) found that, due to the blocking and trapping effects of vegetation, an inflection point was observed in the changes in the sorting, Sk, and Kg downwind of the vegetation [17]. The average particle size is higher on the upwind side of the windbreak and decreases with the increasing downwind distance within the windbreak. Webb et al. (2021) showed that the discharge size statistics of surface sand particles vary under different environmental conditions [18]. In addition, differences in plant structures result in differences in the sediment capture efficiency of canopy pores [11]. Due to the development of mathematics and theory, the proposal of fractal theory has made up for the shortcomings of past research on soil particle distribution that only focused on the particle size. Fractal theory can more comprehensively distinguish detailed changes in the soil particle distribution. Currently, there is sufficient research on the value of the fractal dimension (D) value. For example, many researchers have utilized the D values to describe changes in the soil quality, with the available nitrogen and clay driving the D values [19]. In addition, the D values have been utilized to assess the degree of desertification recovery and the development of plant communities [20,21]. The multifractal theory has strong advantages in describing the variability in the soil particle distribution. In a study on multifractal dimensions, Li et al. (2023) used multifractal parameters to reveal the complex link between the soil nutrient and soil particle distributions in deserts [22]. Multifractal parameters are indicative of soil particle variability in the desert. Therefore, information on the distribution of soil particles after vegetation planting still needs to be further supplemented.
The governance of the Hobq Desert serves as a classic case of desertification control in China [7]. Over the past three decades, different types of vegetation have been used to limit the aeolian activity, and there has been a rapid evolution from mobile sandy land to fixed sandy land. Diversification of vegetation types facilitates degraded land restoration, water conservation, carbon sequestration, and biodiversity restoration compared to monocultures [23]. Populus alba has the characteristics of rapid growth and drought resistance [24]. Caragana korshinskii, Hedysarum leave, and Hedysarum scoparium are characterized by high-stress tolerances, adaptation to aeolian environments, rapid growth, and low water requirements during the growth period [25]. As a result, the area forms plantations of trees (i.e., Populus alba) and shrubs (i.e., Caragana korshinskii, Hedysarum leave, and Hedysarum scoparium). Currently, the research on plantations with different types of vegetation focuses on the complementarity, competition, and facilitation between plant species [26,27,28]. However, the stress gradient hypothesis (SGH), which states that facilitation increases and competition decreases as the environmental conditions become harsher, is often referred to when studying plant species interaction relationships [29]. Especially in deserts, a diversity of vegetation types will facilitate habitat restoration. Several studies have been conducted on improving the soil properties in plantations in deserts. There is no consensus on the effects of vegetation restoration on the soil quality in deserts due to the differences in life forms, ages of restoration, and types of plant species [30]. In particular, the effects of the different plantation types of P. alba (i.e., P. alba × C. korshinskii, P. alba × H. leave, and P. alba × H. scoparium) on the soil properties remain unclear. Li et al. (2023) reported that planting with H. scoparium benefits the soil quality and improves the regional ecological security [22]. Moreover, Li et al. (2022b) reported that mixed planting with C. korshinskii favored soil nutrient accumulation, eased the nitrogen limitation, and accelerated soil element cycling [19]. Moukoumi et al. (2012) reported that planting C. korshinskii and trees in poor soils can provide more N fixation [31]. Therefore, it is necessary to study the improvement in the soil properties in different types of plantations of P. alba, which will contribute to our ability to protect and restore desert ecosystems.
Here, we selected three different plantation types of Populus alba (i.e., P. alba × C. korshinskii, P. alba × H. leave, and P. alba × H. scoparium) in the Hobq Desert, with mobile sandy land as a control. We evaluated the effects of the different plantation types on the soil nutrient and soil particle distributions. The main objectives were to (1) quantify the differences in the soil nutrient and soil particle distributions at the 0–80 cm soil depth under different types of plantations, (2) elucidate the depositional processes of the soil particles in the region and the variation in the D values and multifractal parameters, and (3) determine the contribution of the fractal parameters to soil restoration in the desert.
2. Materials and Methods
2.1. Investigation Status of the Study Area
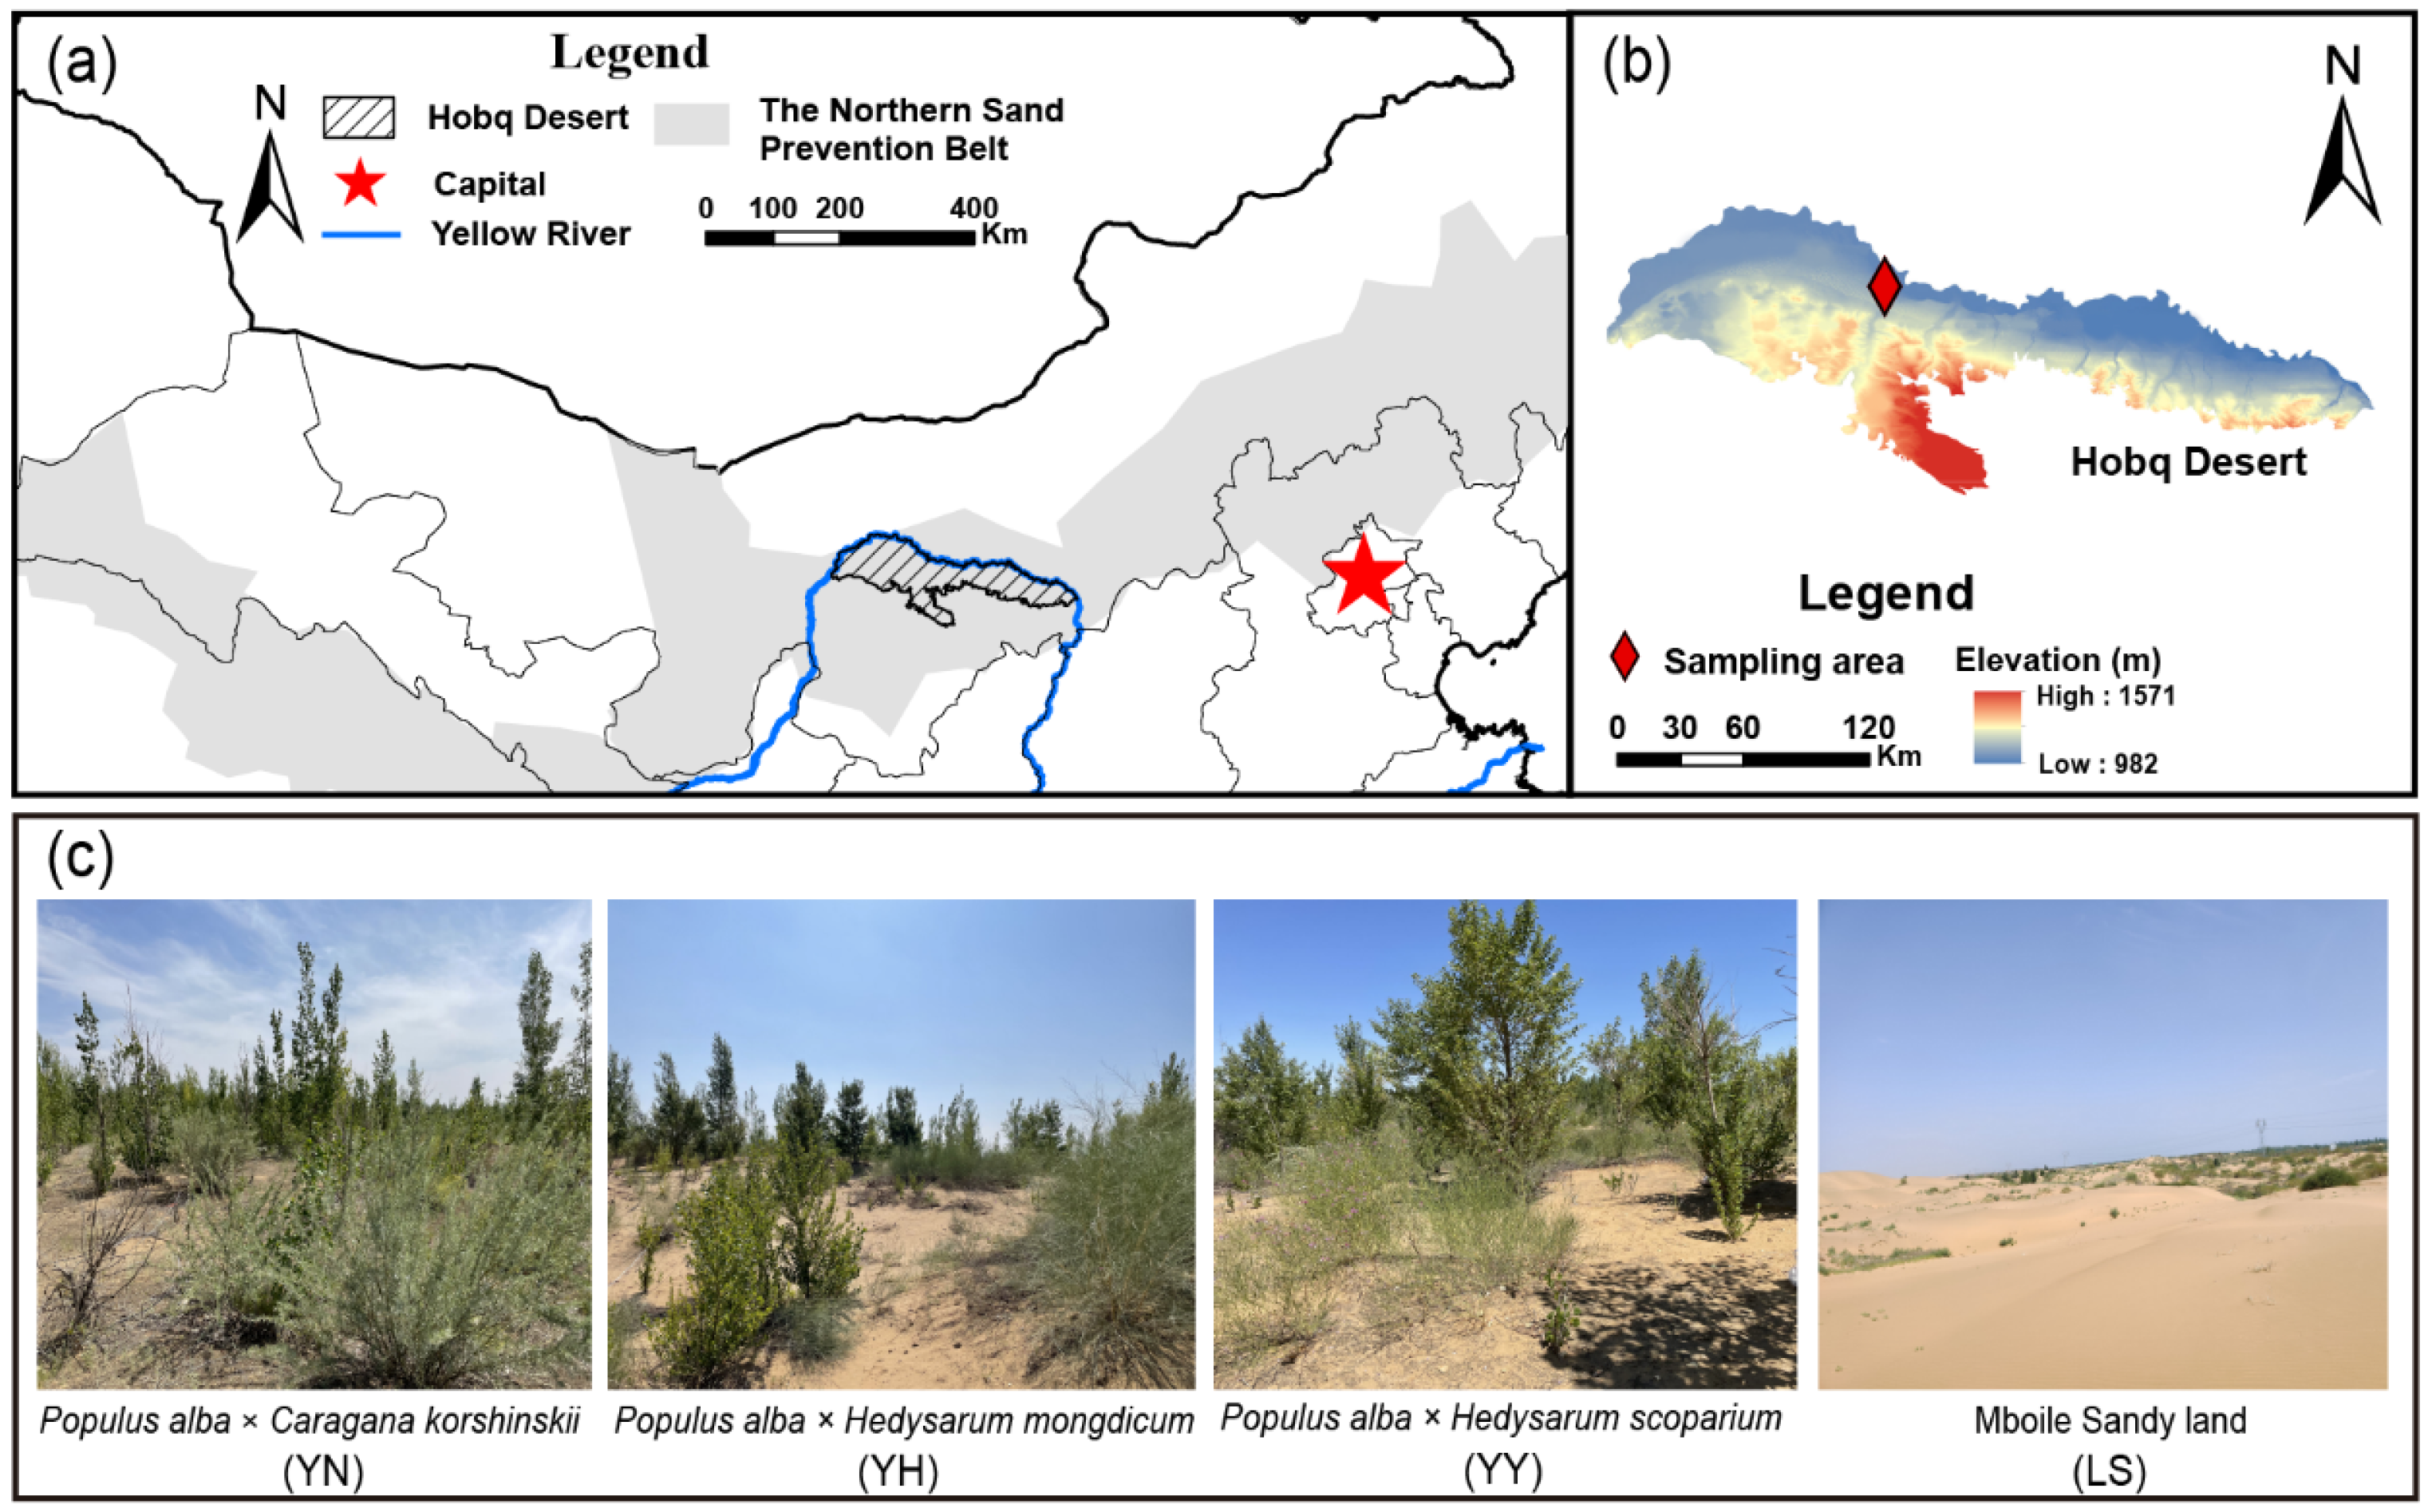
This study was conducted in the Hobq Desert in northern China (Figure 1a). The average annual precipitation in the region for the last four decades has been 227.4 mm, of which 70%–80% is concentrated mainly from July to September. The mean annual temperature in the study area is 7.8 °C. The average annual wind speed is 3.55 m/s, mainly west wind and northwest wind, with the maximum wind speed occurring from March to May. At the same time, it has low precipitation and humidity from March to May of the year, a period of intense aeolian activity [32]. The soil type is sand. Long-term aeolian activities have created a primary landscape dominated by mobile sandy land. As a result, extensive reforestation activities have been carried out over the past three decades. The establishment of vegetation effectively reduces the harm of the aeolian activities to the Yellow River Basin and the cities along the basin. The sand area in the Hobq Desert area has been decreasing year by year, and, as of 2020, the sandy land area has been reduced by 2354.48 km2. The intensity of the soil wind erosion has been on a general downward trend [33]. The dominant shrubs in the study area are mainly C. korshinskii, H. leave, and H. scoparium. The herbaceous vegetation is dominated by Agriophyllum squarrosum, Corispermum hyssopifolium, and Bassia dasyphylla.
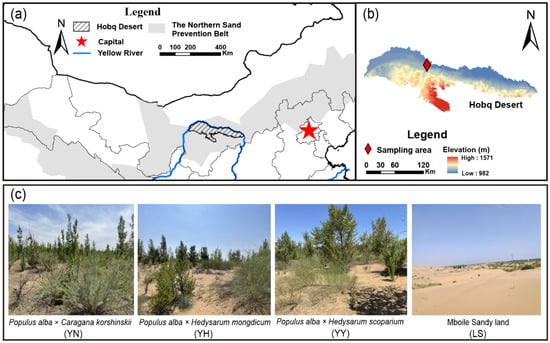
Figure 1.
Location maps of Hobq Desert (a,b) and different types of plantations in the study area (c).
2.2. Sample Plot Survey and Soil Sample Collection
A survey of the major vegetation restoration types in the area revealed different plantation-type patterns of trees and shrubs. These plantation types were established in 2000, with no irrigation activity to date; precipitation and groundwater are the water sources needed for vegetation restoration. We selected three representative artificial plantation types (i.e., P. alba × C. korshinskii, P. alba × H. leave, and P. alba × H. scoparium) (Figure 1c). The plant species were planted in equal numbers (i.e., 1:1 ratio) in these plantation types. We divided six experimental areas under each type of vegetation restoration, each with 20 m × 20 m. Considering that there is only a small amount of herbaceous vegetation in the mobile sandy land, we set up only three experimental areas for it. There were twenty-one test areas, each with a ten-meter difference in distance. Therefore, the geographic characteristics and meteorological factors of these four sample plots were consistent. We surveyed the planting density and herbaceous vegetation restoration in the above experimental areas in July 2022, and the detailed sample plot survey information is shown in Table 1. We collected soil samples evenly and mixed them in each experimental area using the five-point sampling method. Soil collection depths were categorized as 0–10 cm, 10–20 cm, 20–40 cm, 40–60 cm, and 60–80 cm. A total of 105 soil samples were collected. Soil samples were manually passed through a 2 mm soil sieve to remove plant roots into sample bags and returned to the laboratory for air drying.

Table 1.
Basic information on different types of plantations.
2.3. Determination of Physiochemical Properties of Soil
The soil particle size was determined using a Fritsch laser particle sizer (A22 NeXT, Idar Oberstein, Germany) with a measurement range from 0.01 μm to 2000 μm. Compared to methods such as the particle counter, pipette, and sedi-graph, laser technology reduces the bias of the resulting data. The laser technique is less susceptible to the influence of dispersants, and the measured soil particle size is within reasonable limits [34]. The instrument is based on the analysis method of laser scattering. The reproducibility of the measurement results is ±0.5%. The soil particle results obtained were classified as clay (0–2 μm), silt (2–50 μm), and sand (50–2000 μm) according to the grading standards established by the United States Department of Agriculture (USDA). The air-dried soil was manually passed through a 0.149 mm soil sieve for the determination of the total nitrogen (TN) (g/kg), total phosphorus (TP) (g/kg), and organic carbon (SOC) (g/kg). The TN was determined using a semi-micro-Kjeldahl method with high-temperature digestion in concentrated sulfuric acid under accelerated catalysis with CuSO4. The TP was determined spectrophotometrically (ThermoFisher, Waltham, MA, USA) by adding ammonium molybdate after the fusion of NaOH. The SOC was calculated as the amount of organic carbon after oxidation using potassium dichromate under externally heated conditions.
2.4. Calculation of Soil Particle Size Parameters
Based on the soil particle size measurement data of all the soil collected, the particle size parameter characteristics were calculated. We use Udden–Wentworth’s method to calculate the φ(U) in our calculations, and we converted the calculations according to Kum–Dein’s algorithm (φ = , where d is the diameter of the soil particles) [35]. The mean particle size (Mz), sorting (Sd), skewness (Sk), and kurtosis (Kg) were calculated by the Folk–Ward graphical method (1957) [36]. The Folk–Ward graphical method is formally stable with respect to the method of moments for the particle size parameter formulation [37]. Moment-method calculations have a large deviation between samples when calculating skewness and kurtosis [38]:
where φ5, φ16, φ25, φ50, φ75, φ84, and φ95 represent the values of 5%, 16%, 25%, 50%, 75%, 84%, and 95% on the particle size accumulation curve, respectively.
2.5. Calculation of Soil Fractal Dimensions and Multifractal Parameters
2.5.1. Calculation of Soil Fractal Dimension (D) Values
Based on the soil particle size measurement data of all the soil collected, the fractal dimensions and multifractal parameters were calculated. The equations for calculating the D values at different soil depths are referenced from Tyler and Wheatcraft (1992) [39]. This method effectively reduces the introduction of bias into the calculations relative to the method proposed by Tyler and Wheatcraft (1989) [40]. The formula is as follows:
where Rj is the diameter of different soil particles; Rmax is the maximum soil particle diameter in the results obtained for the soil particles; V (r < Rj) is the percentage of soil particles with diameters less than the Rj; VT is the total percentage of soil particles; and D is the D value.
2.5.2. Soil Multifractal Parameter Modeling
To obtain more information about the soil particle distribution, we used multifractal models based on the standard box-counting method developed by Chhabra et al. (1989) [41]. Compared with the D value, the multifractal dimension can more comprehensively reflect the internal morphological and structural characteristics of the soil and the complexity and uniformity of the soil structure. Based on soil particle size measurements, the multifractal analysis was performed in an interval (I (µm) = [a, b]). The soil multifractal interval was I (µm) = [0.02, 2000]. We divided interval I into equal-length intervals (Ii [φi, φi+1] (i = 1, 2, 3, …)), with φi representing the diameter of the soil particles. In addition, each partition had a total of N(ε) intervals of the same size by J = 2k (where k = 1, 2, 3, 4, 5, 6) [42]. In addition, for each partition, the probability of the soil particle distribution was calculated as follows:
Vi and VT in Equation (7) refer to the volume occupied by the soil particles in part i and the total volume, respectively.
The generalized dimension (D(q)) is calculated in [43] as follows:
When q ≠ 1,
and when q = 1,
where q is the probability density weight index, which is an integer between −∞ and +∞ [42]. The D(q) represents the fractal structural complexity and nonuniformity of the soil particle size.
In our study, the q ranges from −10 to 10. Here, D0, D1, and D2 are the capacity dimension, entropy dimension, and correlation dimension when q = 0, 1, and 2, respectively. The D0 represents the width of the continuous soil particle distribution, with larger values implying a wider soil particle distribution. The D1 indicates the degree of concentration of the soil particle distribution; larger values represent more uneven particle size distributions [44]. D2 indicates the variability in the soil particle size, with higher values representing less variability [42].
In addition, the relationship between the Hausdorff dimension and singular intensity mean is another important parameter to characterize the multifractal structure of the soil particle distribution. The singularity index (α(q)) of the multifractal spectrum is calculated using Equation (6). According to the method proposed by Chhabra and Jensen (1989) [45], the α(q) and f(α) are calculated as follows:
The multifractal spectrum (f(α)) is defined as follows:
The singularity profile of a multifractal is quantitatively characterized by a plot of the f(q)-f(a) relationship. In this study, the q ranges from −10 to 10. Δα = (αmax − αmin) quantifies the width of the singularity spectrum across the fractal structure, and its value implies the homogeneity of the distribution of the soil particles. Δƒ[(ƒ(αmax) − ƒ(αmin)] reflects the shape and symmetry of the multifractal spectrum [46].
2.6. Statistical Analyses
One-way ANOVA (Duncan’s Multiple Comparisons) with a probability of less than 0.05 was performed on our selected indicators using SPSS software (Version 24.0) to determine significant differences between the different types of plantations. A circumferential thermal-correlation-clustering plot of indicators under different types of plantations was created using R software (Version 4.3.2) (Auckland, New Zealand). The Mantel test for the soil properties was carried out based on the Vegan analysis package using R software. Mantel’s test for 9999 ordering and analysis of variance was performed to analyze the relationship between the D values, multifractal parameters, particle size parameters, and environmental factors. Principal component analysis with 95% confidence intervals was performed using Origin Lab, version 2023 (Northampton, MA, USA). Partial-least-squares path modeling (PLS-PM) based on structural equation modeling was performed using R software. Plotting was performed using Origin Lab software (Version 2023).
3. Results
3.1. Soil Nutrient Distribution under Different Types of Plantations
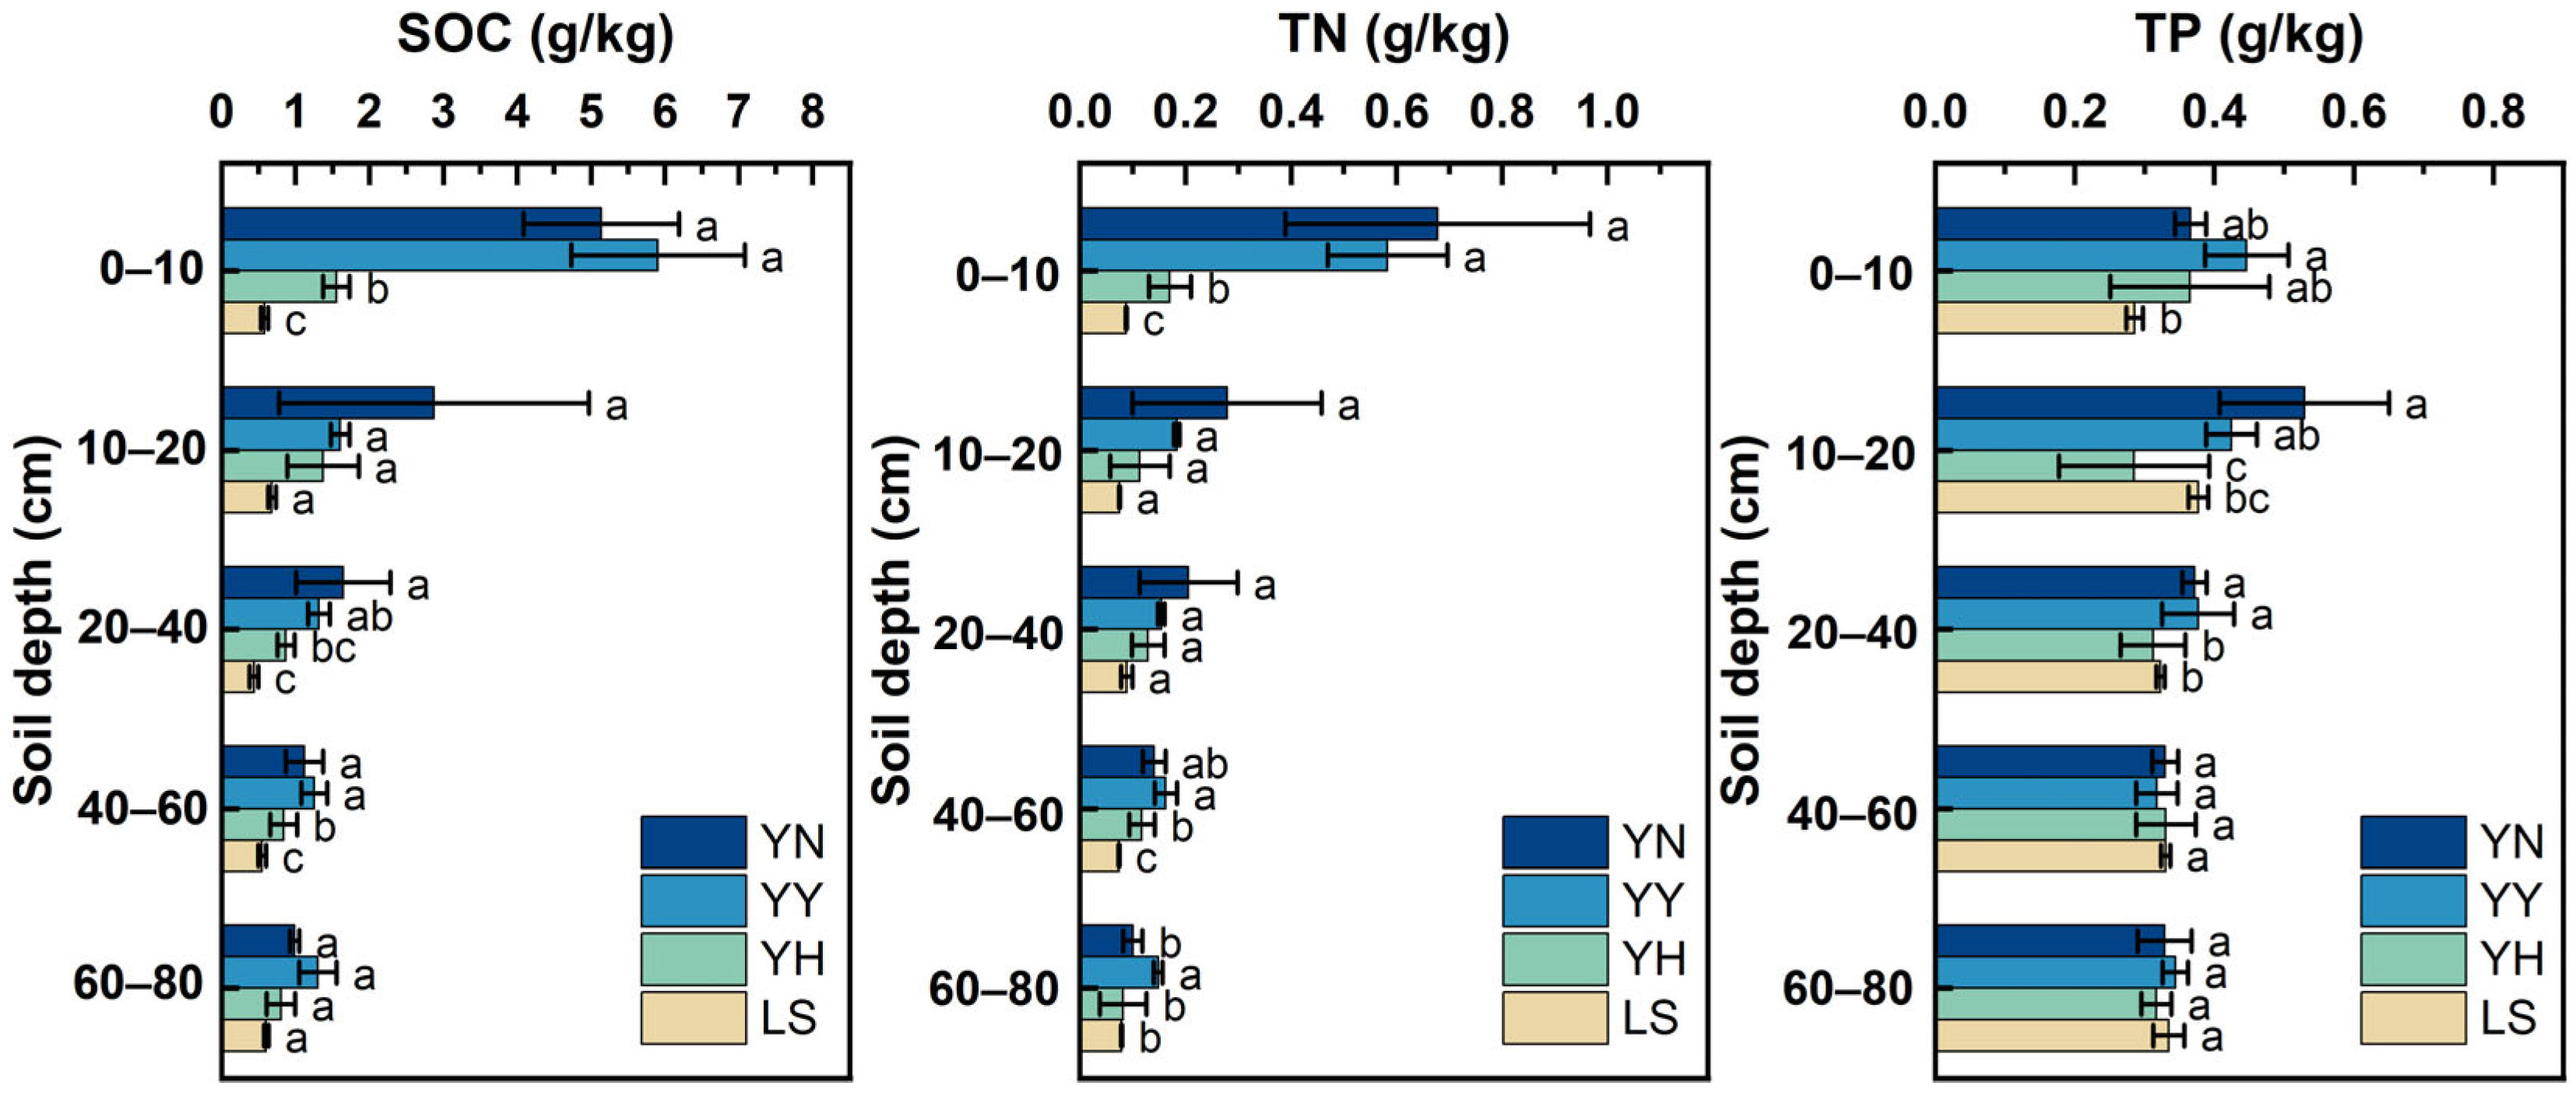
There was variability in the effects of the different plantations on the SOC, TN, and TP (p < 0.05) (Figure 2). The different plantations had significantly increased SOC, TP, and TN at the 0–60 cm soil depth (p < 0.05). The distribution of the soil nutrients broadly shows a decrease with the increasing soil depth. Except for the TP, the YN and YY significantly increased the SOC and TN in the 0–10 soil layer relative to the YH (p < 0.05). Compared with that of the LS, the SOC of the YN, YY, and YH increased by 5.74 times–10.42 times, 6.68 times–12.06 times, and 1.31 times–2.18 times, respectively. The TN of the YN, YY, and YH improved by 3.69 times–9.90 times, 4.5 times–6.94 times, and 0.52 times–1.41 times relative to the LS, respectively.

Figure 2.
Characteristics of soil nutrient distribution at 0–80 cm soil depth under different types of plantations. Note: Significant differences in values with different letters were determined by Duncan’s test (p < 0.05). Abbreviations: YN: P. alba × C. korshinskii; YY: P. alba × H. leave; YH: P. alba × H. scoparium; LS: mobile sandy land; SOC: soil organic carbon; TP: total phosphorus; TN: total nitrogen.
3.2. Distribution of Soil Particle Composition and Size Parameters under Different Types of Plantations
The different plantations significantly increased the soil clay and silt and decreased the sand (p < 0.05) (Table 2). At the soil layer depth of 0–80 cm, the YN, YY, and YH had significantly increased clay and silt particles compared to the LS (p < 0.05). In particular, the clay, silt, and sand between the different plantations were significant only at 0 cm–10 cm. In addition, the distribution of soil particles with the increasing soil depth showed the same distribution pattern as the nutrient distribution. Clay and silt particles decreased with the increasing soil depth. At the 0–10 cm soil depth, the clay of the YN, YY, and YH increased by 0.54 times–1.47 times, 0.44 times–1.18 times, and 0.04 times–0.6 times, respectively, relative to the 10–20 cm soil depth. At the 0–10 cm soil depth, the silt of the YN, YY, and YH increased 5.98 times–1.47 times, 0.44 times–1.18 times, and 0.04 times–0.6 times, respectively, relative to the 10–20 cm soil depth.
Table 2.
Characteristics of soil particle distribution at 0–80 cm soil depth under different types of plantations.
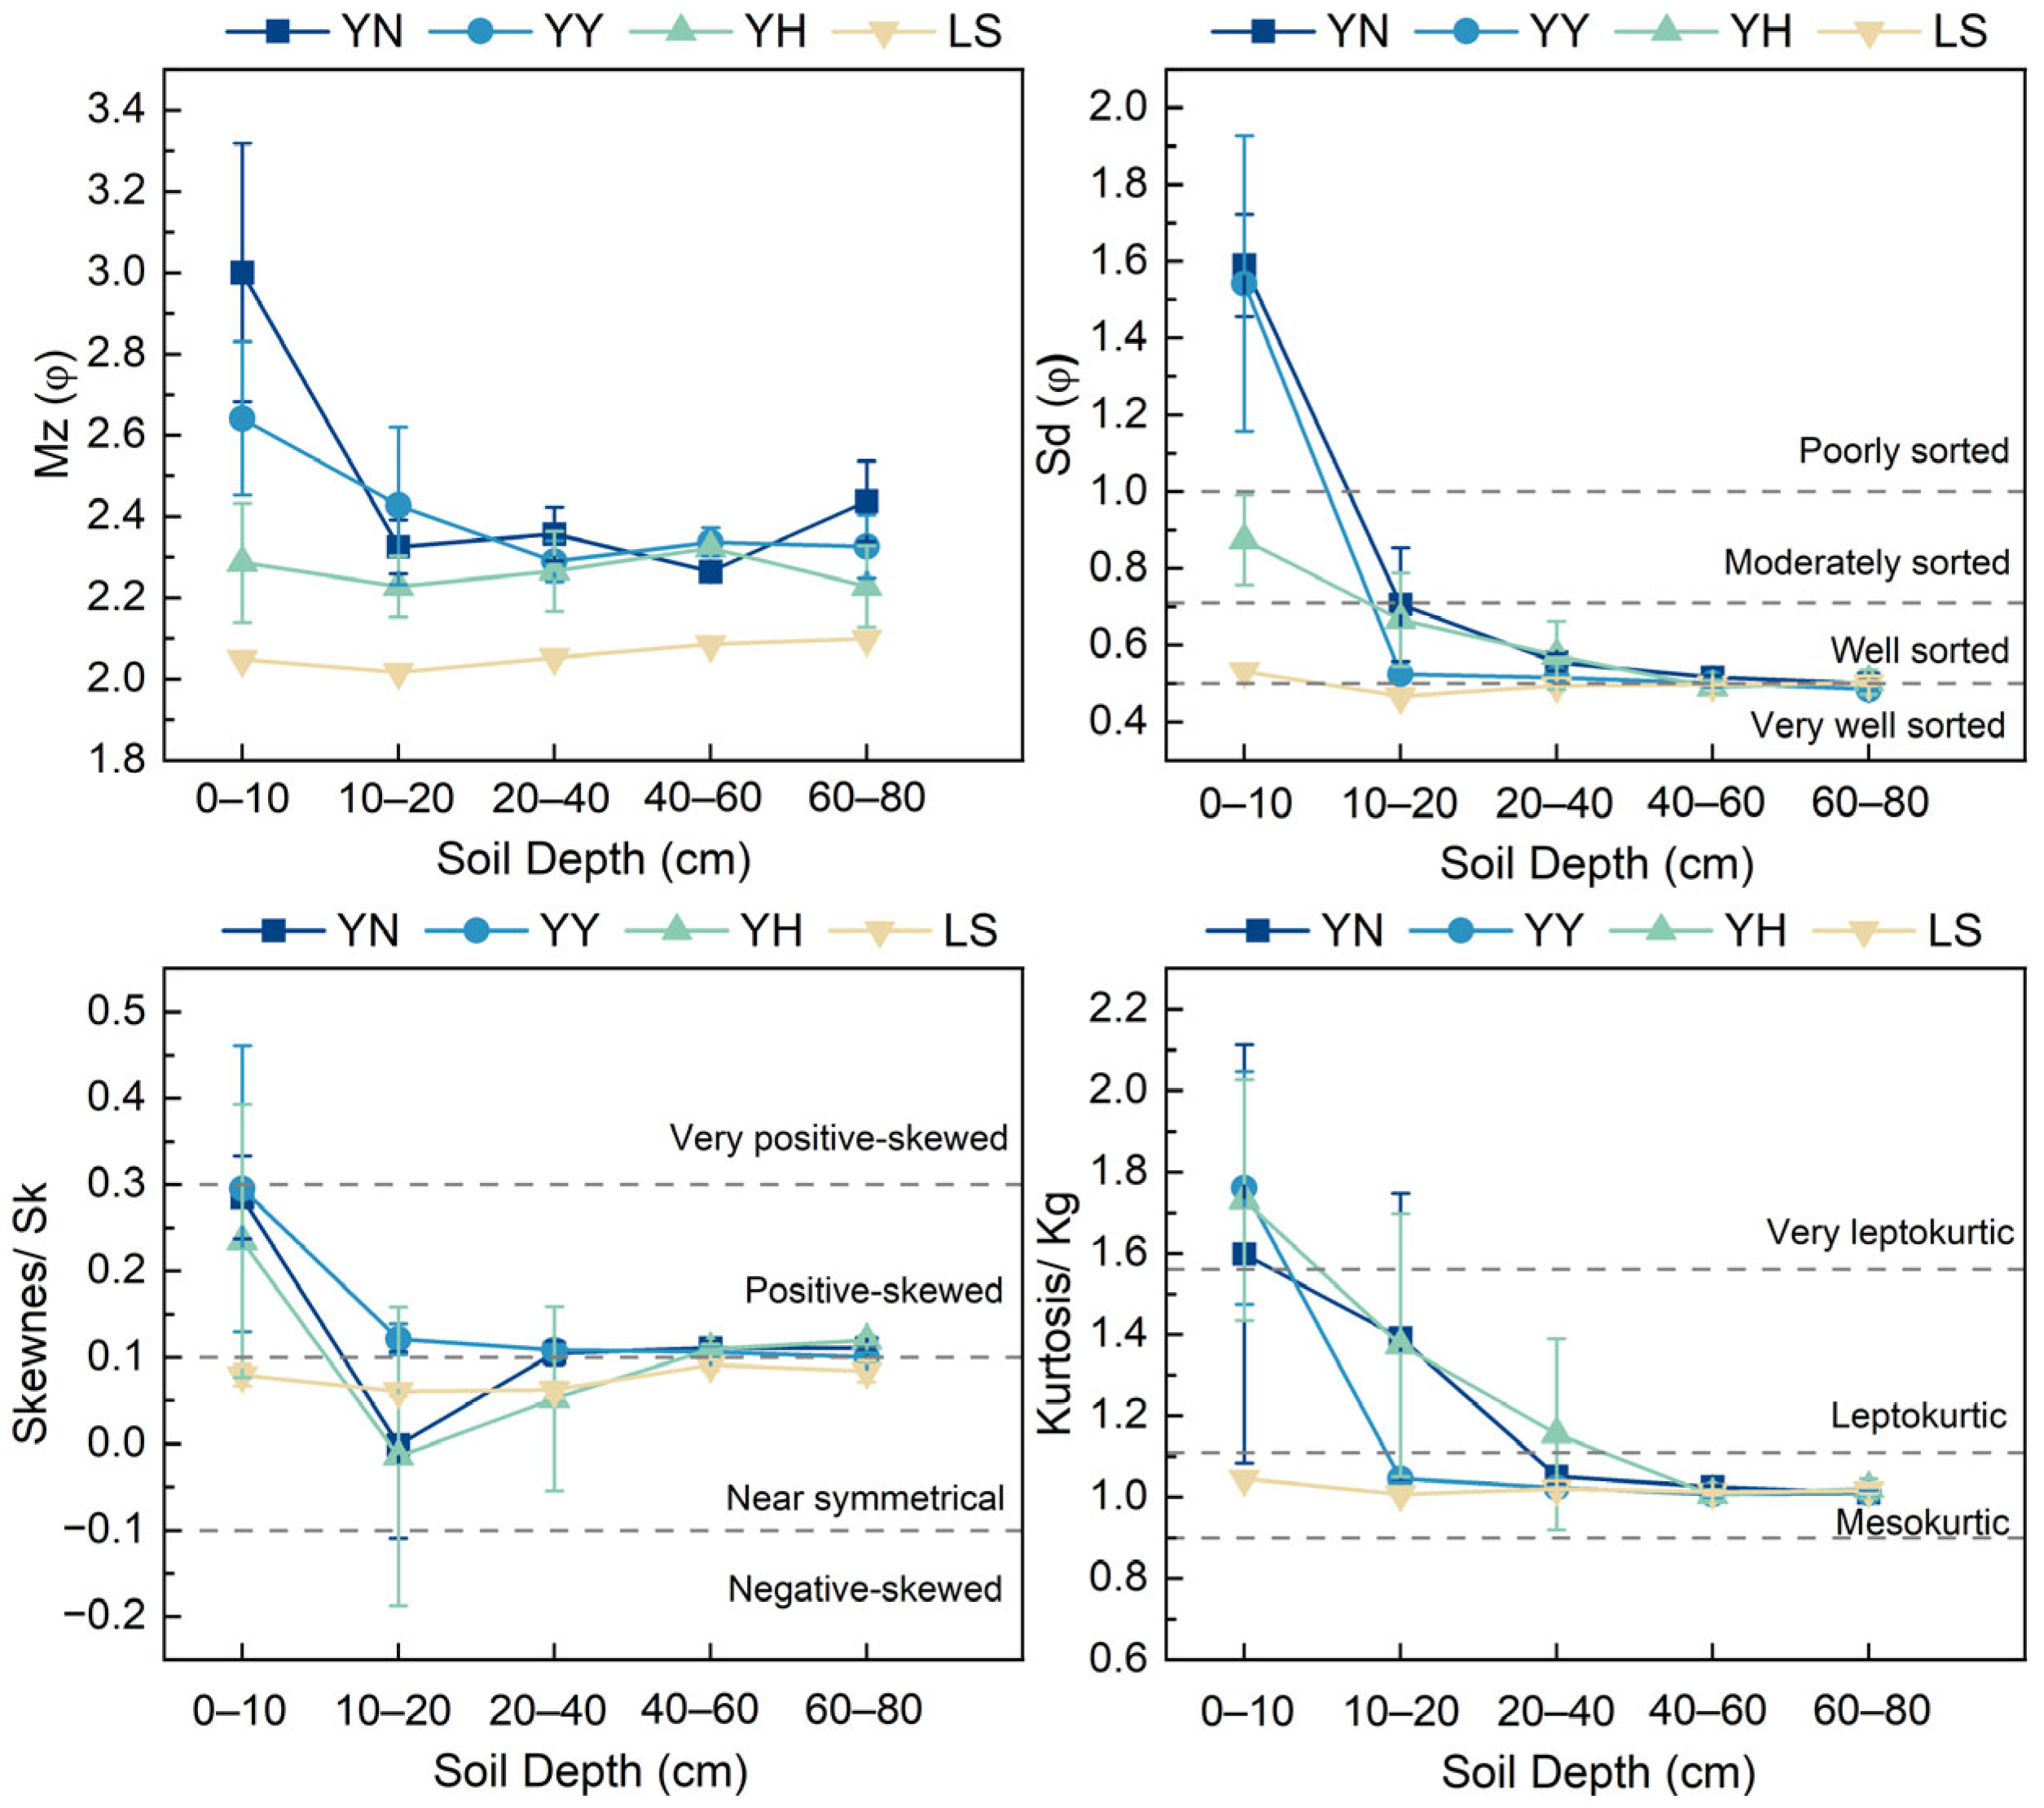
The different plantations effectively influenced the changes in the soil particle distributions. The distribution of the soil particles in the mobile sandy land is very well sorted, nearly symmetrical, and mesokurtic (Figure 3). The construction of the plantations promoted the refinement of the soil particles, with the Mz ranging from 2.25 to 3.38, from 2.22 to 2.91, and from 2.13 to 2.54 for the YN, YY, and YH plantations. In addition, the construction of the plantations caused the soil particles to develop from nearly symmetrical to positive-skewed, causing the development of the kurtosis from mesokurtic to leptokurtic or very leptokurtic. However, the plantations reduced the sorting of the soil particles. The particle size parameters showed different variabilities in the different soil layers. The Mz values of the YN, YY, and YH decreased gradually with the increasing soil depth. As the soil layer depth increased, the kurtoses of the YN, YY, and YH went from leptokurtic to mesokurtic, and the sorting went from poorly sorted to well sorted. Interestingly, we found that the different types of plantations caused variability in the characterization of the particle size parameters of the different soil layers. The YN, YY, and YH were more pronounced for the 0–20 cm soil layer.
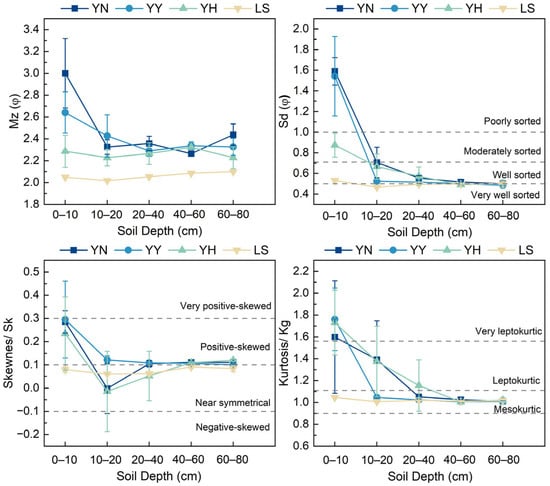
Figure 3.
Characteristics of soil particle size parameters in the 0–80 cm soil layer under different types of plantations. Abbreviations: YN: P. alba × C. korshinskii; YY: P. alba × H. leave; YH: P. alba × H. scoparium; LS: mobile sandy land; Mz: mean grain size; Sd: sorting; Kg: kurtosis; Sk: skewness.
3.3. Distribution of D Values and Multifractal Parameters under Different Types of Plantations
The distribution of the soil D values was broadly characterized by the distribution of the soil nutrients and soil fine particles (Table 3, Figure 2). The D value of the LS varied between 1.64 and 1.94 in the 0–80 cm soil layer. The different plantations had significantly increased D values relative to the LS (p < 0.05). The soil D values of the YN, YY, and YH ranged from 2.09 to 2.40, from 2.05 to 2.38, and from 1.99 to 2.21 in the 0–80 cm soil layer, respectively. The YN, YY, and YH differed significantly (p < 0.05) only between the 0–10 cm soil layers. In addition, the D values decrease with the increasing soil depth. This also means that the D can be used as a complementary indicator of the soil nutrients and soil fine particles.
Table 3.
Characteristics of D values and multifractal parameters under different types of plantations.
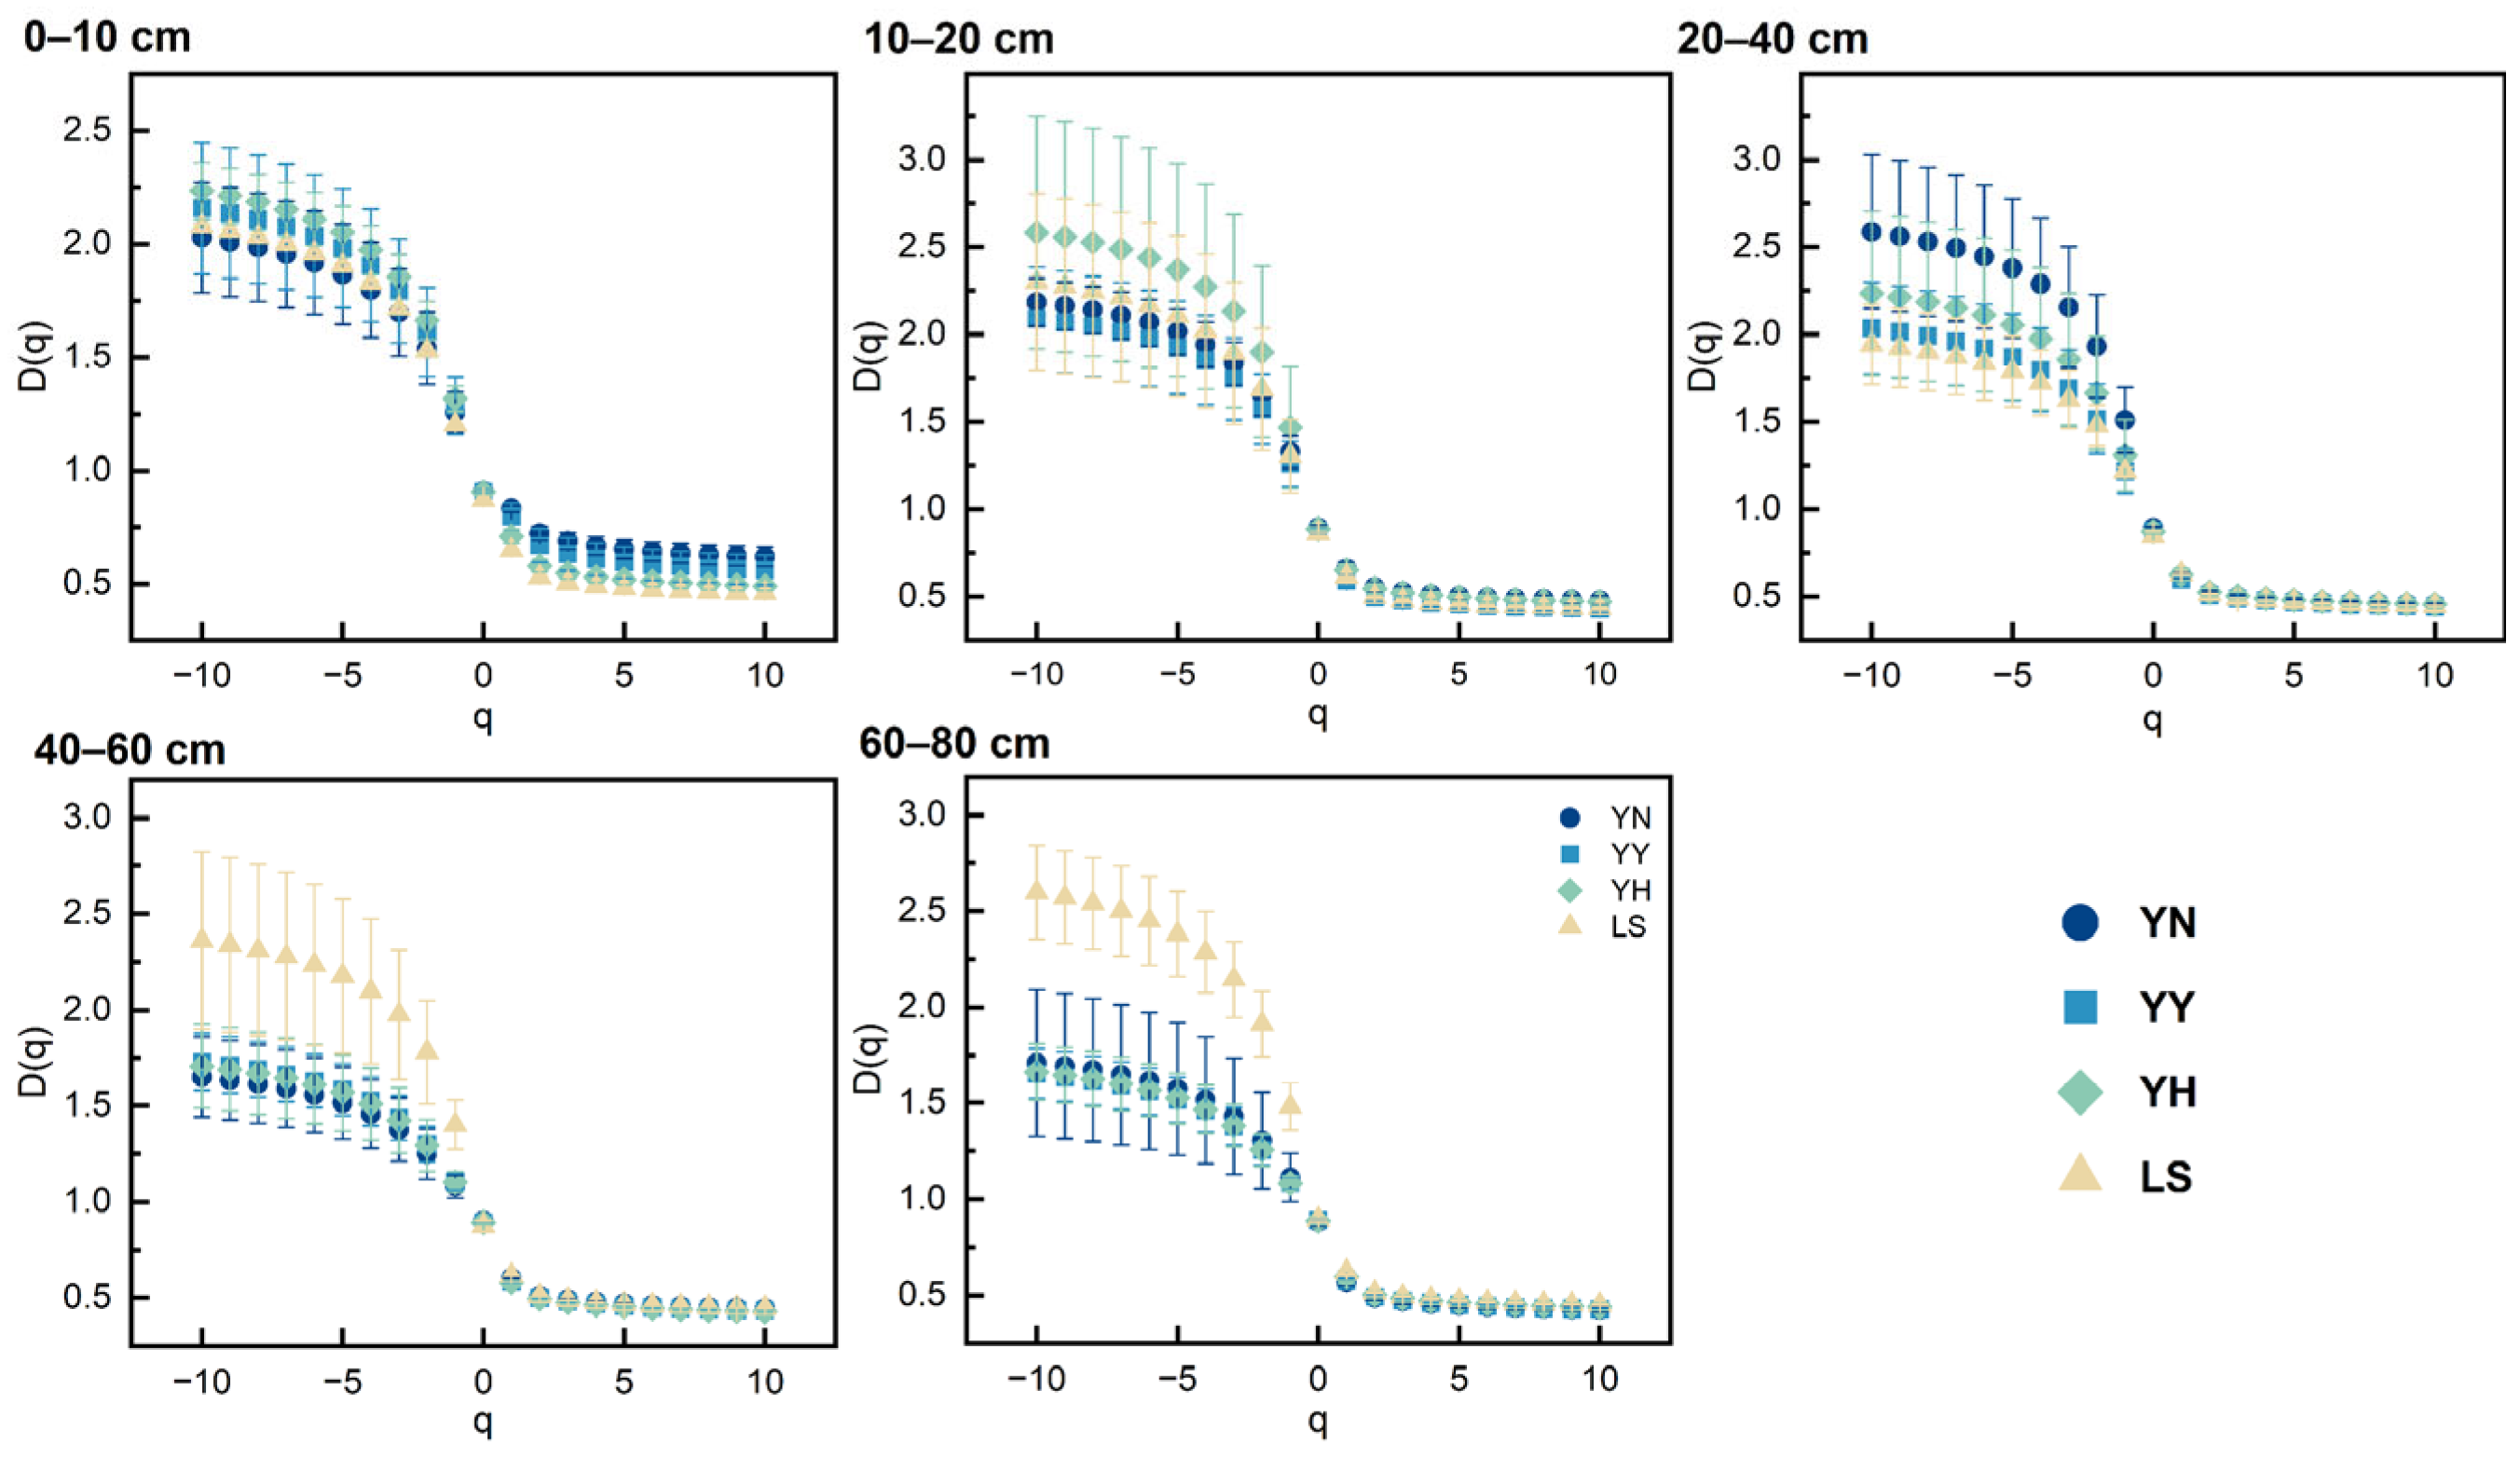
As shown in Figure 4, the generalized dimensional spectrum of the soil particle distribution was estimated in increments of one over a q range from −10 to 10. We observe that the line segments exhibit S-shaped curves in Figure 4. This implies that the soil particle distribution in the area exhibits multifractals. In Figure 4, we observe that the D(q) with the q from −10 to 0 exhibits a wider range of values relative to the q from 0 to 10. When the q was greater than 0, we found less variability between the different plantations and LS in the 10–80 cm soil layer. However, in the 0–10 cm soil layer, the YN, YY, and YH showed some variation from the LS. Thus, this demonstrates that the plantations make a difference in the homogeneity of the soil particle distribution. As shown in Table 3, we chose the D0, D1, D2, and D1/D0 to describe the multifractal structure of the soil particles in more detail. There are differences in the effects of the different plantations on the soil multifractal characteristics. The plantations promote soil particle refinement and the deposition of coarse particles. As a result, the YN, YY, and YH significantly increased the D0 relative to the LS (p < 0.05). This implies that constructing the plantations resulted in a wider range of soil particle distributions. The D1 was significantly increased relative to the LS for the YN, YY, and YH. This implies that the plantations promote the nonuniformity of the soil particle distribution. In addition, constructing the plantations resulted in a more concentrated and less heterogeneous soil particle distribution. There was variability in the multifractal structures of the soil particles in the different plantations. The YN had the fractal characteristics of a wider distribution range, a more heterogeneous distribution, and a more concentrated distribution of soil particles than the YY and YH.
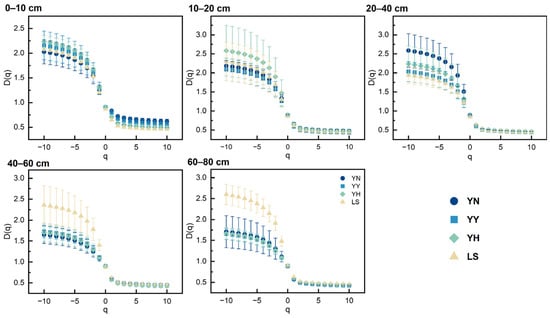
Figure 4.
Generalized dimensional spectra of soil particle distribution at 0–80 cm soil depth under different types of plantations. Abbreviations: YN: P. alba × C. korshinskii; YY: P. alba × H. leave; YH: P. alba × H. scoparium; LS: mobile sandy land.
We plotted the multifractal spectra based on the α(q) and ƒ(α) and found that the graphs were single-peaked, asymmetric parabolas (Figure 5). There are differences in the α(q) and ƒ(α) in the different soil depths for the different plantations. Δƒ > 0 for the different soil depths under different plantations, which indicates that large-diameter particles dominate the distribution pattern of the soil particles. There were differences in the Δα for the different soil depths on the different plantations. The differences in the Δα imply inhomogeneity in the distribution of the soil particles. Figure 5 provides further evidence of the inhomogeneity of the soil particle distribution at the different soil depths. Overall, coarse particles determine the general characteristics of the soil particle distribution in the region. As the depth of the soil layer increases, the distribution of the soil particles by vegetation changes from nonuniformity to uniformity relative to the LS.
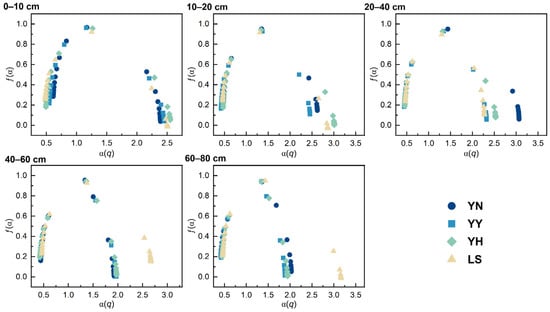
Figure 5.
Singularity spectra of 0–80 cm soil particle distributions under different types of plantations. Abbreviations: YN: P. alba × C. korshinskii; YY: P. alba × H. leave; YH: P. alba × H. scoparium; LS: mobile sandy land.
3.4. Relationships between D Values, Multifractal Parameters, Particle Size Parameters, and Environmental Factors
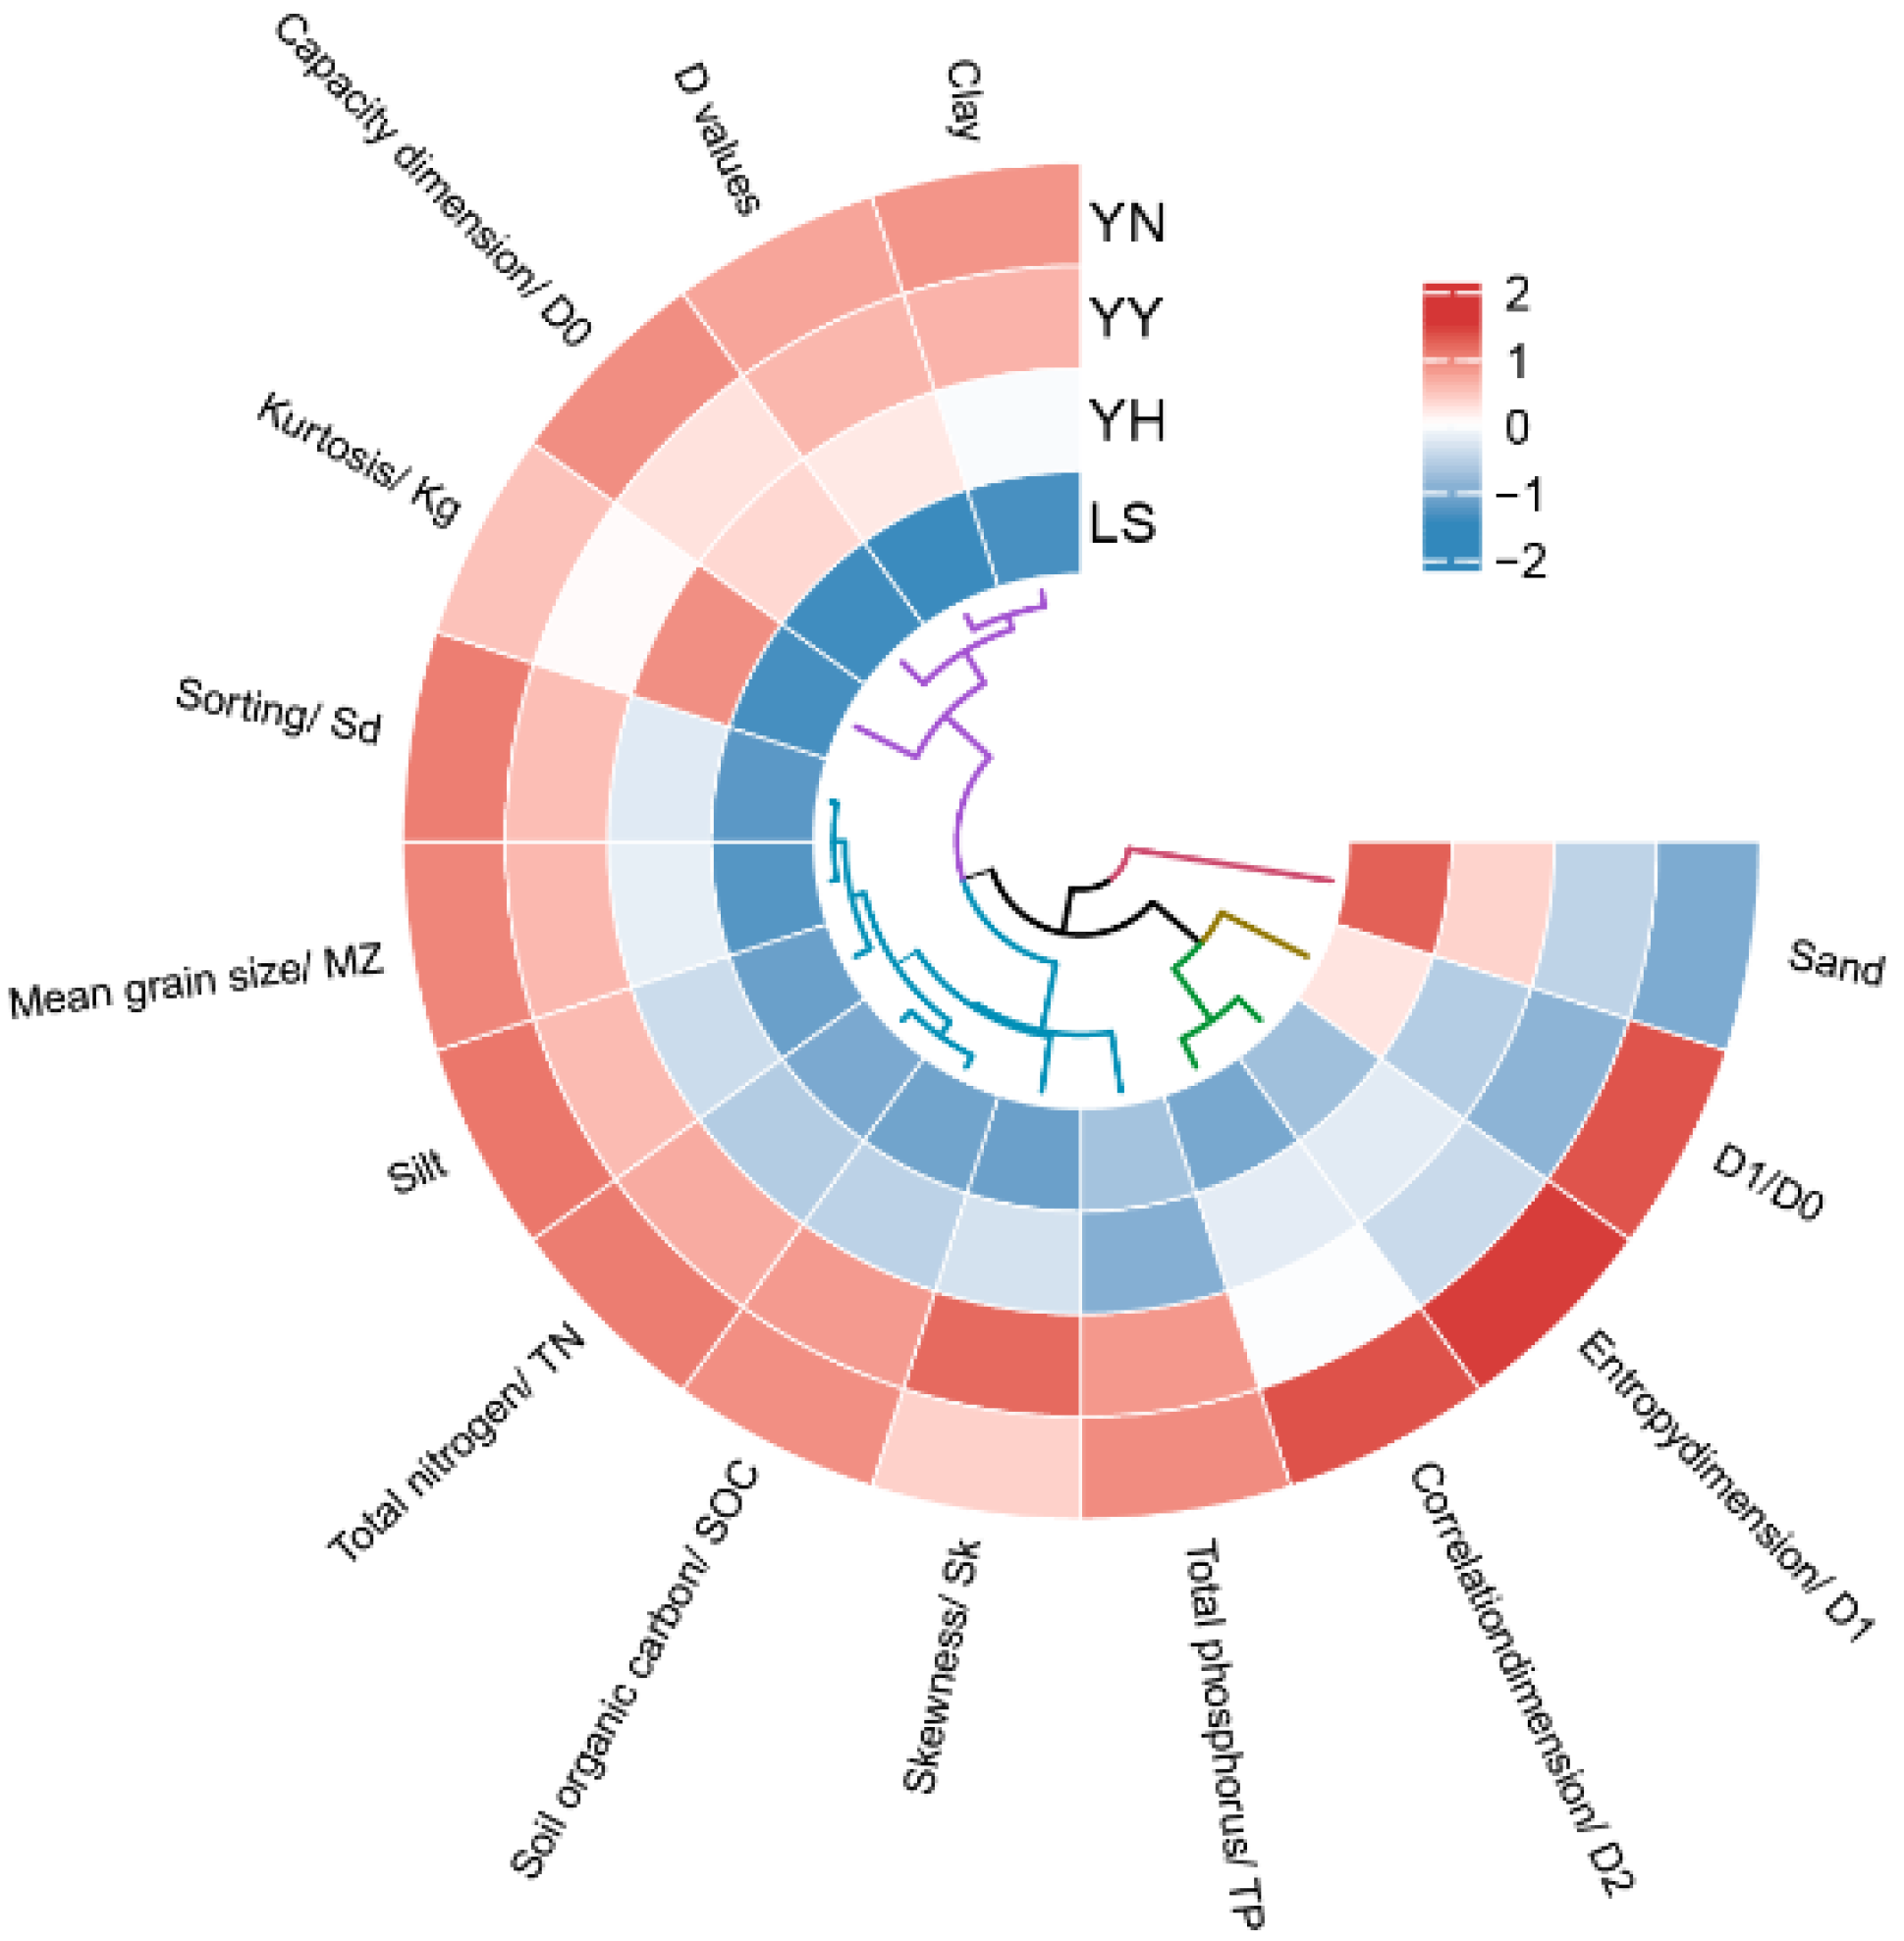
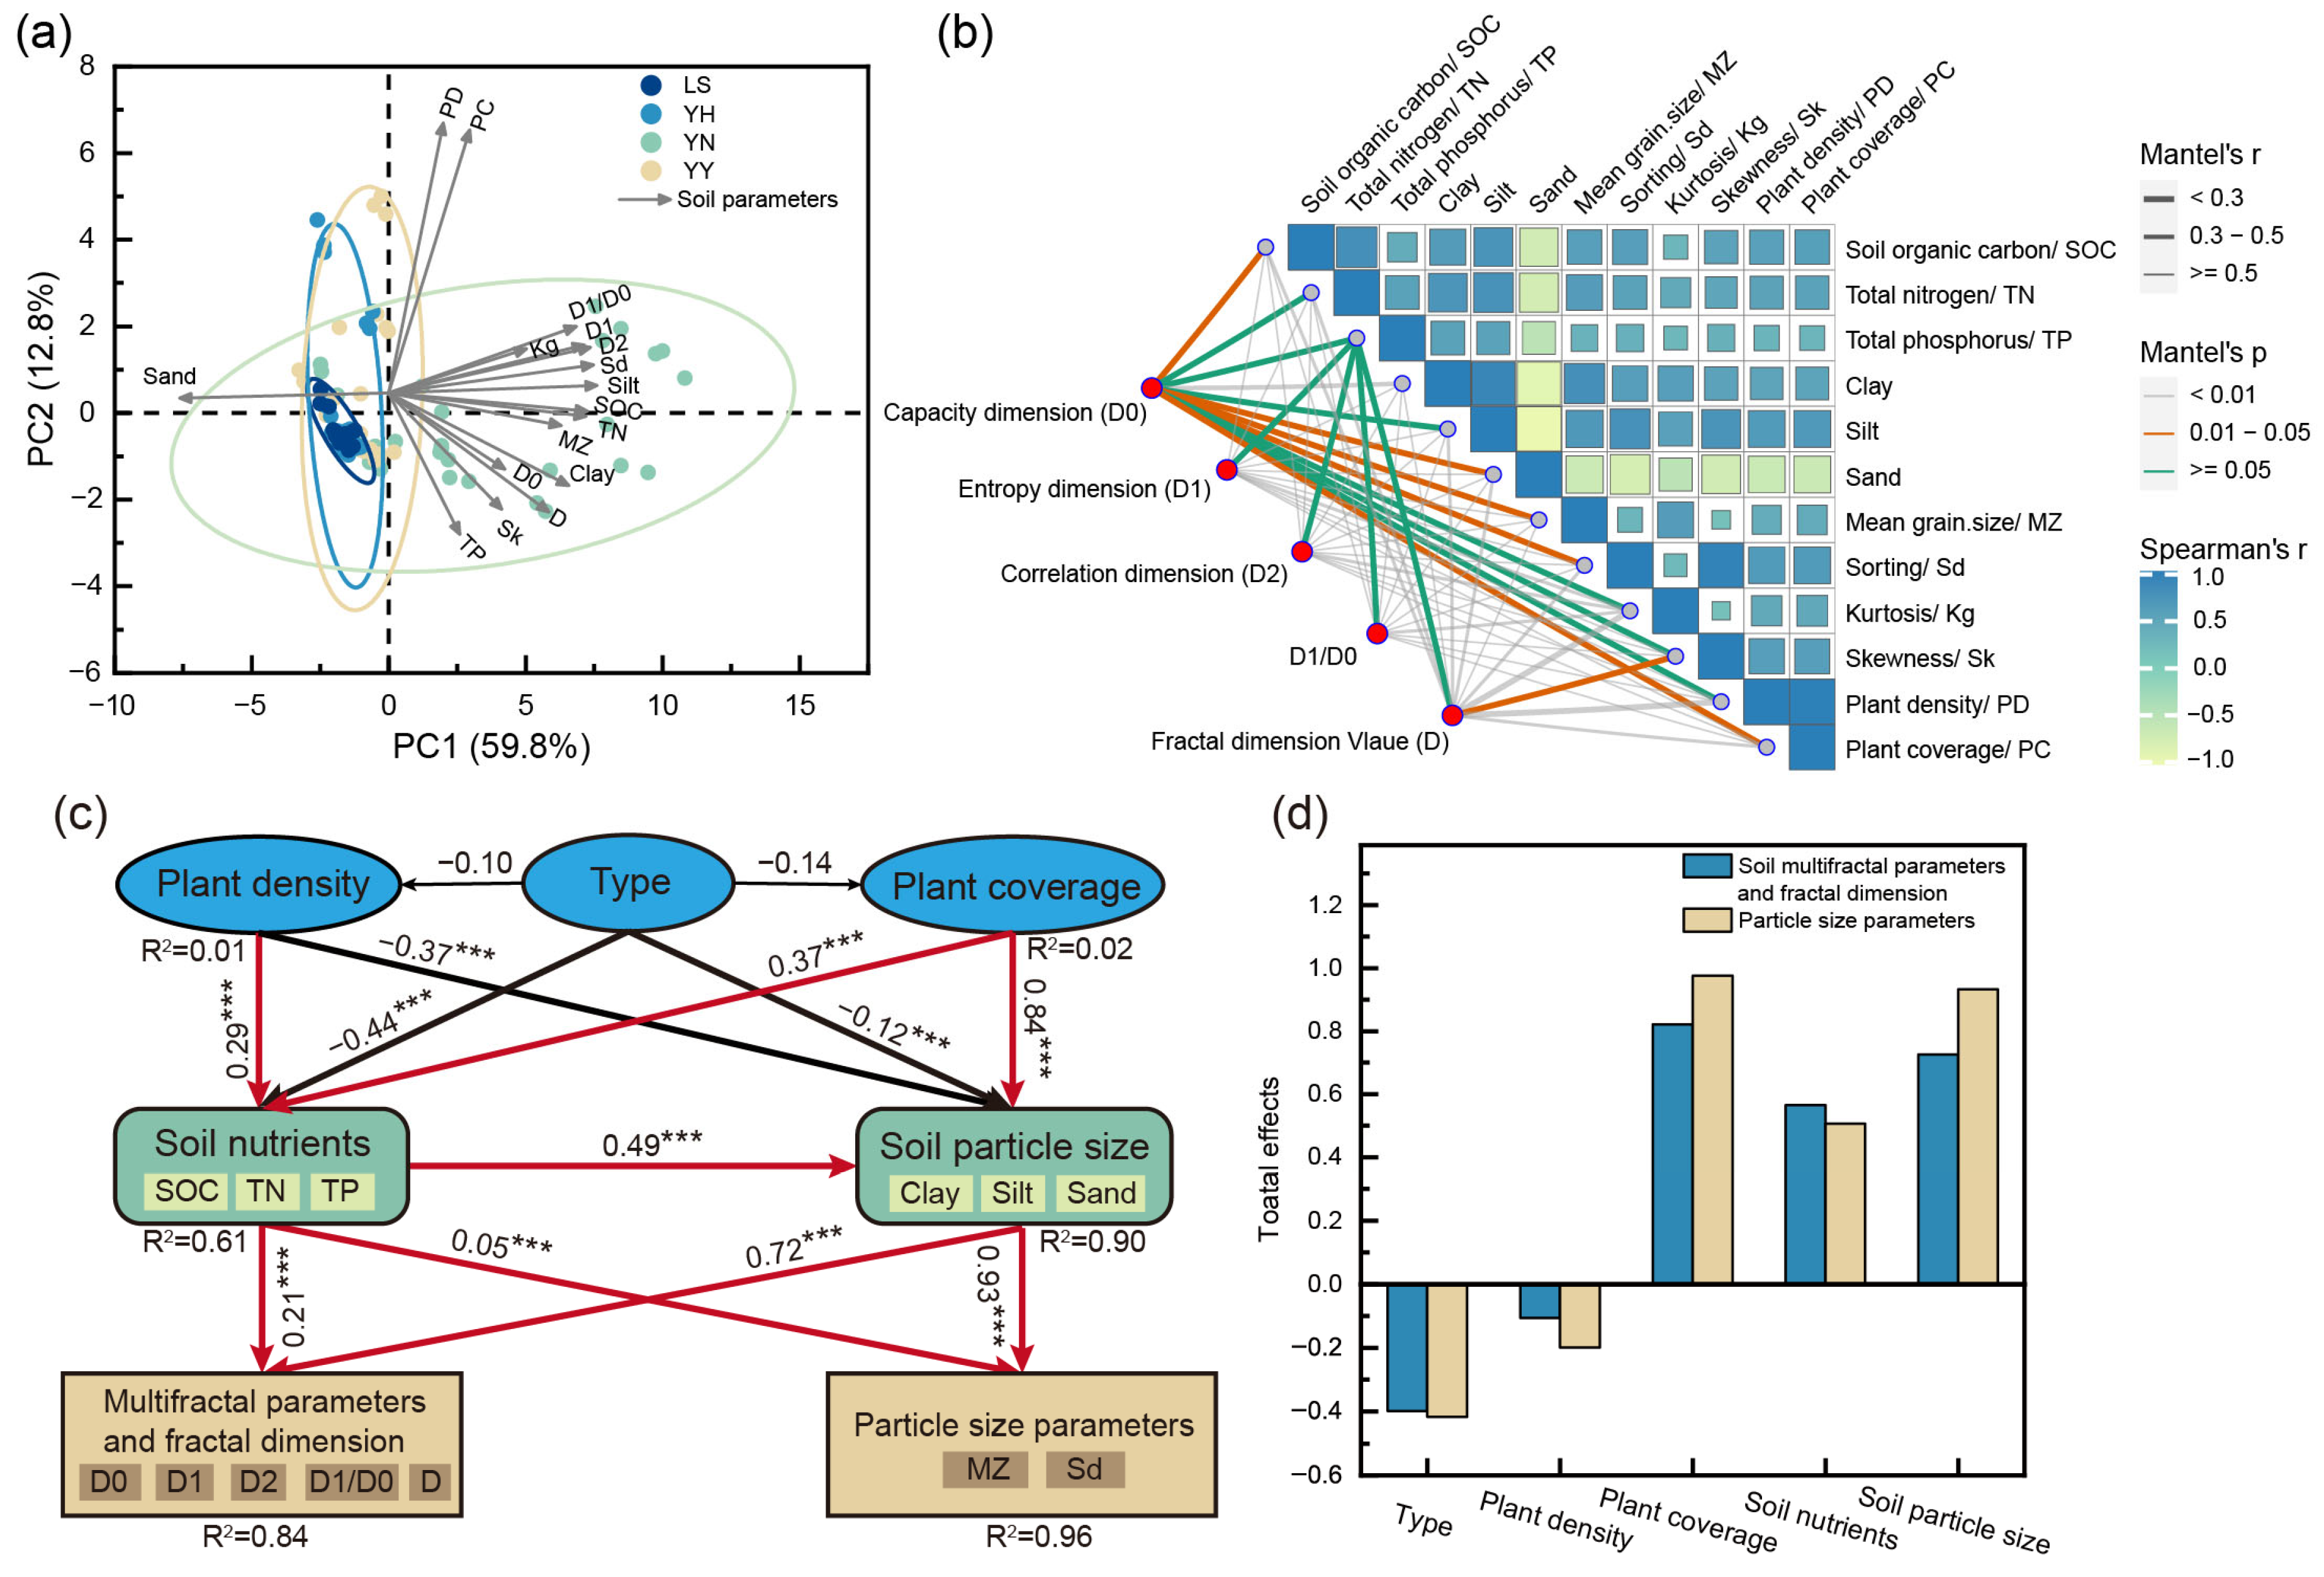
We analyzed the soil physicochemical properties, particle size parameters, D values, and multifractal parameters under the different plantations by hierarchical cluster analysis and cyclic thermograms (Figure 6). We found differences in the influences of the different plantations on the indicators we chose, with a YN, YY, and YH descending order of positive influence. The distribution of the 95% confidence intervals in the principal component analysis demonstrates the differences in the effects of the different plantations on the soil indicators (Figure 7a). The PC1 and PC2 explained 72.6% of the variation in the soil properties. An angle greater than 90° between the sand and the arrows of the other indicators implies a negative correlation. Whereas, the angles of the PD, PC with D1/D0, Kg, D1, D2, Sd, Silt, SOC, TN, Mz, and clay are less than 90°, implying that there is a positive correlation, and that the correlation decreases as the angle becomes larger. The structure of the PLS-PM-based structural equation modeling showed that the plantations (type), plant density (PD), plant coverage, soil nutrients, and soil particle composition directly and indirectly significantly influenced the D values, multifractal parameters, and particle size parameters (Figure 7c,d). In addition, the D values and multifractal parameters, as indicators of habitat improvement, can more fully complement information on the soil particle distribution. Therefore, we further demonstrated the relationship of the soil multifractal parameters with the soil nutrients, soil particle size, particle size parameters, PD, and PC by Mantel analysis. Except for the TP, the D1, D2, D1/D0, and D values were driven by our chosen metrics (p < 0.05). In addition, the D0 was affected by the SOC, clay, sand, and PC (p < 0.05).
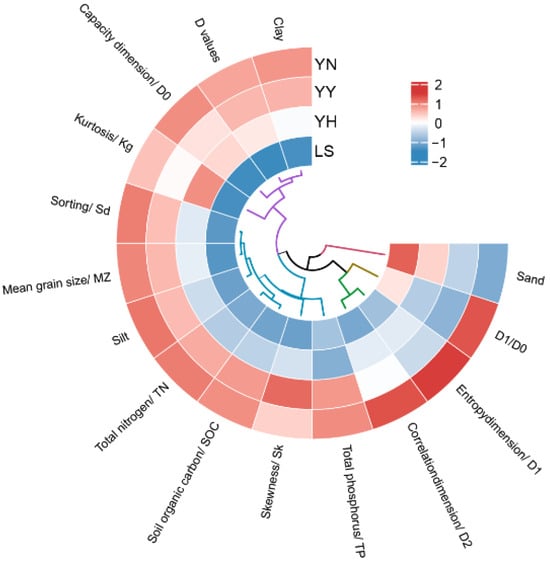
Figure 6.
Heat map of cyclic clustering of soil environmental factors and soil properties. Abbreviations: YN: P. alba × C. korshinskii; YY: P. alba × H. leave; YH: P. alba × H. scoparium; LS: mobile sandy land.
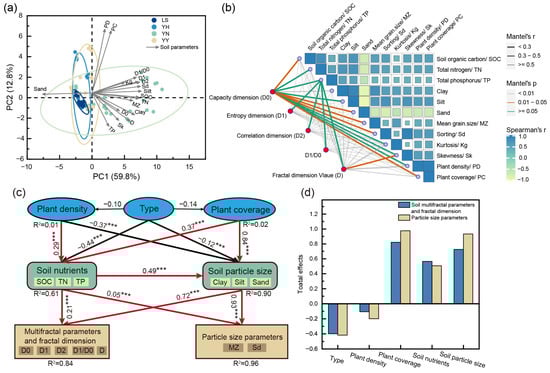
Figure 7.
Principal component analysis (a), Mantel analysis (b), and structural equation modeling (c,d) of fractal parameters and particle size parameters with environmental factors. Abbreviations: D0: capacity dimension value; D1: entropy dimension value; D2: correlation dimension value: D: fractal dimension value; PD: plant density; PC: plant coverage; SOC: soil organic carbon; TP: total phosphorus; TN: total nitrogen; Mz: mean grain size; Sd: sorting; Kg: kurtosis; Sk: skewness; YN: P. alba × C. korshinskii; YY: P. alba × H. leave; YH: P. alba × H. scoparium; LS: mobile sandy land.
4. Discussion
Desertification has attracted much attention as the most serious ecological problem in the world [1,47]. Vegetation promotes the turnover and accumulation of the available nutrients in the soil, and soil development is also essential for vegetation growth [48]. In our study, the plantations significantly promoted soil nutrient accumulation and soil particle refinement (p < 0.05). Compared with the LS, the YN, YY, and YH significantly increased the SOC, TN, and TP (p < 0.05), significantly increased the clay and silt (p < 0.05), and significantly decreased the sand (p < 0.05). This result also showed that the plantations were effective at improving the soil texture. In addition, plant coverage and plant density play a dominant role in increasing the benefits of wind breaking and sand fixing, and Zhang et al. (2022) reported a linear positive correlation between the surface roughness length and plant coverage and plant density [49]. In our study, differences in the PD and PC caused differences in the soil nutrient and soil particle distribution among the YN, YY, and YH. Significant differences existed between the different plantations for the soil nutrient and soil particle alterations, especially at the 0–10 cm soil depth. Frequent wind erosion is the leading cause of the soil quality degradation in the region [50]. The presence of vegetation increases the surface roughness length and reduces the wind shear stress [51], actions that play decisive roles in facilitating the deposition of nutrient-rich soil fines and limiting the resuspension of soil fines [9]. The soil nutrient and soil fine particle contents decreased with the increasing soil depth, which is consistent with the findings in [52]. In addition, the soil nutrients were more variable within the 0–40 cm soil layer. We believe that the phenomenon responsible for this difference may be due to differences in the root biomass, root secretion, and plant density [53]. For example, Douglas et al. (2010) reported a tendency for plants to decrease their root numbers and biomass with increasing soil depths [53]. Macromolecular polysaccharides in root secretions promote soil chemical element cycling [54]. C. korshinskii is a nitrogen-fixing plant species, and about 28% of the single genes with known functions currently belong to categories related to nitrogen metabolism [55], which are less sensitive to nitrogen limitation [10]. Increased nitrogen is a key component of the overall SOC stabilization in clay [56]. In addition, different plant densities under resource-limited conditions in mobile sandy land result in the heterogeneity of the soil water resources and available nutrient resource management [57].
Soil particle distribution depends on the depositional environment and mode of transportation [58]. Particle size parameters, D values, and multifractal parameters can provide more comprehensive information about the wind depositional environment in the region [59]. The distribution characteristics of the particle size parameters and D values of the YN, YY, and YH were consistent with the distribution characteristics of the soil nutrients, clay, and silt, which is in agreement with the results reported by Li et al. (2022b) [19]. The different plantations improve the soil texture, and the improved soil texture and vegetation presence limit sand transport by wind. As a result, the soil particle distributions of the YN, YY, and YH tend to be poorly sorted, very leptokurtic, and positive-skewed. The process of the deposition and accumulation of soil fine particles and the process of soil nutrient enrichment increase the width of the soil particle distribution, which becomes heterogeneous [46]. Thus, this implies that wider and heterogeneous soil particle distributions in the desert represent an improvement in the soil texture. We also demonstrated through principal component analysis, Mantel analysis, and structural equation modeling that the development of the multifractal parameters was significantly altered with the improvement in the soil texture. Many reports collectively validate this result. For example, Wang et al. (2022b) reported that there was a significant positive correlation between the width range of the soil particle distribution and the clay and silt in alpine desert grasslands, and that plant coverage positively affected the width and inhomogeneity of the soil particle distribution [60]. Sun et al. (2016) reported that the multifractal parameters of topsoil in the Loess Plateau were driven by the SOC and TN [20]. The D values and multifractal parameters of soil in deserts increased with the soil texture [22]. In the process of desertification management, fractal parameters and changes in the soil properties show a significant positive correlation with the improvement in the soil properties. However, Peng et al. (2014) found that the width of the soil particle distribution in the Yellow River wetland was not related to the variation in the sand and clay [61]. Therefore, we believe that the use of the D values and multifractal parameters in indicating environmental trends is debatable. In addition, it was found that the D values and multifractal parameters became smaller with the increasing soil depth in our study. Vertical variations in the soil D values and multifractal parameters showed a consistent phenomenon with the soil nutrient and soil particle distributions. Therefore, it is highly recommended that the soil D values and soil multifractal parameters be used as additional information on the soil properties in deserts, as well as to clarify the soil sampling information. We believe that the use of the D values and multifractal parameters for complementary information on the soil properties is more suitable for the forward restoration of habitats. Feng et al. (2019) reported that, as habitats degrade, there is no relationship between the fractal dimension and soil nutrients between different soil layers [21].
5. Conclusions
The establishment of plantations is essential for the modification of depositional environments and the restoration of the soil texture in deserts. Here, we quantitatively analyzed the soil physicochemical properties, particle size distributions, soil D values, and multifractal parameters under different types of plantations (i.e., Populus alba × Caragana korshinskii (YN); P. alba × Hedysarum leave (YY); and P. alba × Hedysarum scoparium (YH)). In addition, we assessed the relationship between the soil physicochemical properties on the depositional environments, D values, and multifractal parameters. We found that the P. alba plantation type significantly increased the soil nutrients, clay, and silt in the desert (p < 0.05), which decreased with the increasing soil depth. Vegetation restoration has promoted changes in the soil deposition environment of the desert, contributing to soil particle refinement and poor sorting properties. The soil particle distribution has developed from near symmetrical to positive-skewed and extremely positive-skewed, and from mesokurtic to leptokurtic or very leptokurtic. Vegetation restoration has increased the D value and promoted the range of the soil particle distribution. The capacity dimension (D0), entropy dimension (D1), and correlation dimension (D2) indicated the nonuniformity of the soil particle distribution and the wider and more heterogeneous distribution of the soil particles in the YN plantation compared to the YY and YH plantations. In addition, the depth of the soil layer affected the multiple fractal characteristics of the soil particle distribution, and the vegetation restoration showed a more homogeneous distribution of the soil particles relative to the LS. Mantel analysis and structural equation modeling indicated that the soil D values and multifractal parameters were primarily driven by the SOC, TN, soil particle size, particle size parameters, plant density, and plant coverage. Therefore, it is highly recommended that the soil D values and soil multifractal parameters be used as complementary information on the soil properties in deserts. This study bridges the gap in information on soil texture restoration in mixed forests in deserts and is instructive for restoring desert ecosystems.
Author Contributions
Writing—original draft, H.L.; investigation, H.L. and Z.M.; methodology, H.L.; formal analysis, X.R. and H.L.; data curation, Z.M. and X.C.; writing—review and editing, Z.M. and H.L.; supervision, Z.M. All authors have read and agreed to the published version of the manuscript.
Funding
This research was supported by the Technical Challenge Overcoming Project of Inner Mongolia Autonomous Region, No. 2021GG0073; the Basic Research Funds for Universities—Innovation Team Building—Desert Ecosystem Protection and Restoration Innovation Team, No. BR22-13-03; the Inner Mongolia Autonomous Region Science and Technology Program, No. 2022YFHH0076; the Major Science and Technology Project of Ordos City, No. 2022EEDSKJZDZX020-4;and the Major Project of Inner Mongolia Autonomous Region “Promoting Mongolia through science and technology”, No. KJXM-EED-2020006.
Data Availability Statement
The datasets generated and/or analyzed during the current study are available from the corresponding author upon reasonable request.
Conflicts of Interest
The authors declare that they have no competing interests.
References
- Jiang, Z.; Ni, X.; Xing, M. A Study on Spatial and Temporal Dynamic Changes of Desertification in Northern China from 2000 to 2020. Remote Sens. 2023, 15, 1368. [Google Scholar] [CrossRef]
- D’Odorico, P.; Bhattachan, A.; Davis, K.F.; Ravi, S.; Runyan, C.W. Global desertification: Drivers and feedbacks. Adv. Water Resour. 2013, 51, 326–344. [Google Scholar] [CrossRef]
- Ma, S.; Wang, H.-Y.; Wang, L.-J.; Jiang, J.; Gong, J.-W.; Wu, S.; Luo, G.-Y. Evaluation and simulation of landscape evolution and its ecological effects under vegetation restoration in the northern sand prevention belt, China. Catena 2022, 218, 106555. [Google Scholar] [CrossRef]
- Zhai, J.; Wang, L.; Liu, Y.; Wang, C.; Mao, X. Assessing the effects of China’s Three-North Shelter Forest Program over 40 years. Sci. Total Environ. 2023, 857, 159354. [Google Scholar] [CrossRef] [PubMed]
- Mirzabaev, A.; Sacande, M.; Motlagh, F.; Shyrokaya, A.; Martucci, A. Economic efficiency and targeting of the African Great Green Wall. Nat. Sustain. 2021, 5, 17–25. [Google Scholar] [CrossRef]
- Romero-Diaz, A.; Belmonte-Serrato, F.; Ruiz-Sinoga, J.D. The geomorphic impact of afforestations on soil erosion in Southeast Spain. Land Degrad. Dev. 2010, 21, 188–195. [Google Scholar] [CrossRef]
- Ren, M.; Chen, W.; Wang, H. Ecological Policies Dominated the Ecological Restoration over the Core Regions of Kubuqi Desert in Recent Decades. Remote Sens. 2022, 14, 5243. [Google Scholar] [CrossRef]
- Zhang, Z.; Huisingh, D. Combating desertification in China: Monitoring, control, management and revegetation. J. Clean. Prod. 2018, 182, 765–775. [Google Scholar] [CrossRef]
- Sankey, J.B.; Germino, M.J.; Benner, S.G.; Glenn, N.F.; Hoover, A.N. Transport of biologically important nutrients by wind in an eroding cold desert. Aeolian Res. 2012, 7, 17–27. [Google Scholar] [CrossRef]
- Ravi, S.; D’Odorico, P.; Okin, G.S. Hydrologic and aeolian controls on vegetation patterns in arid landscapes. Geophys. Res. Lett. 2007, 34, L24S23. [Google Scholar] [CrossRef]
- Gonzales, H.B.; Ravi, S.; Li, J.; Sankey, J.B. Ecohydrological implications of aeolian sediment trapping by sparse vegetation in drylands. Ecohydrology 2018, 11, e1986. [Google Scholar] [CrossRef]
- Gan, D.; Feng, J.; Han, M.; Zeng, H.; Zhu, B. Rhizosphere effects of woody plants on soil biogeochemical processes: A meta-analysis. Soil Biol. Biochem. 2021, 160, 108310. [Google Scholar] [CrossRef]
- Li, W.; Li, Y.; Lv, J.; He, X.; Wang, J.; Teng, D.; Jiang, L.; Wang, H.; Lv, G. Rhizosphere effect alters the soil microbiome composition and C, N transformation in an arid ecosystem. Appl. Soil Ecol. 2022, 170, 04296. [Google Scholar] [CrossRef]
- Wu, W.; Chen, G.; Meng, T.; Li, C.; Feng, H.; Si, B.; Siddique, K.H.M. Effect of different vegetation restoration on soil properties in the semi-arid Loess Plateau of China. Catena 2023, 220, 106630. [Google Scholar] [CrossRef]
- Zhang, J.; Zhang, C.; Zhou, N.; Ma, X. Spatial pattern of grain-size distribution in surface sediments as a result of variations in the aeolian environment in China’s Shapotou railway protective system. Aeolian Res. 2011, 3, 295–302. [Google Scholar] [CrossRef]
- Wadhawan, S.K.; Kumar, P. Depositional environment in Great Indian Desert using grain size parameters and its chemical characterization. J. Geol. Soc. India 2016, 88, 120–121. [Google Scholar] [CrossRef]
- Miri, A.; Webb, N.P. The impact of a multiple-row Tamarix windbreak on grain size parameters of aeolian sand flux. Soil Sci. Soc. Am. J. 2024, 88, 482–497. [Google Scholar] [CrossRef]
- Webb, N.P.; LeGrand, S.L.; Cooper, B.F.; Courtright, E.M.; Edwards, B.L.; Felt, C.; Van Zee, J.W.; Ziegler, N.P. Size Distribution of Mineral Dust Emissions from Sparsely Vegetated and Supply-Limited Dryland Soils. J. Geophys. Res. Atmos. 2021, 126, e2021JD035478. [Google Scholar] [CrossRef]
- Li, H.; Meng, Z.; Dang, X.; Yang, P. Soil Properties under Artificial Mixed Forests in the Desert-Yellow River Coastal Transition Zone, China. Forests 2022, 13, 1174. [Google Scholar] [CrossRef]
- Sun, C.; Liu, G.; Xue, S. Natural succession of grassland on the Loess Plateau of China affects multifractal characteristics of soil particle-size distribution and soil nutrients. Ecol. Res. 2016, 31, 891–902. [Google Scholar] [CrossRef]
- Feng, X.; Qu, J.; Tan, L.; Fan, Q.; Niu, Q. Fractal features of sandy soil particle-size distributions during the rangeland desertification process on the eastern Qinghai-Tibet Plateau. J. Soils Sediments 2019, 20, 472–485. [Google Scholar] [CrossRef]
- Li, H.; Dang, X.; Han, Y.; Qi, S.; Meng, Z. Sand-fixing measures improve soil particle distribution and promote soil nutrient accumulation for desert—Yellow River coastal ecotone, China. Ecol. Indic. 2023, 157, 111239. [Google Scholar] [CrossRef]
- Rouhi-Moghaddam, E.; Hosseini, S.M.; Ebrahimi, E.; Tabari, M.; Rahmani, A. Comparison of growth, nutrition and soil properties of pure stands of Quercus castaneifolia and mixed with Zelkova carpinifolia in the Hyrcanian forests of Iran. For. Ecol. Manag. 2008, 255, 1149–1160. [Google Scholar] [CrossRef]
- Yevtushenko, D.P.; Misra, S. Enhancing disease resistance in poplar through modification of its natural defense pathway. Plant Mol. Biol. 2019, 100, 481–494. [Google Scholar] [CrossRef] [PubMed]
- Zheng, Y.; Jiang, L.; Gao, Y.; Chen, X.; Luo, G.; Feng, X.; Yu, Y.; An, P.; Yu, Y.; Shimizu, H. Persistence of four dominant psammophyte species in central Inner Mongolia of China under continual drought. J. Arid Land 2013, 5, 331–339. [Google Scholar] [CrossRef]
- Pretzsch, H.; Bielak, K.; Block, J.; Bruchwald, A.; Dieler, J.; Ehrhart, H.-P.; Kohnle, U.; Nagel, J.; Spellmann, H.; Zasada, M.; et al. Productivity of mixed versus pure stands of oak (Quercus petraea (Matt.) Liebl. and Quercus robur L.) and European beech (Fagus sylvatica L.) along an ecological gradient. Eur. J. For. Res. 2013, 132, 263–280. [Google Scholar] [CrossRef]
- Dieler, J.; Pretzsch, H. Morphological plasticity of European beech (Fagus sylvatica L.) in pure and mixed-species stands. For. Ecol. Manag. 2013, 295, 97–108. [Google Scholar] [CrossRef]
- Lebourgeois, F.; Gomez, N.; Pinto, P.; Mérian, P. Mixed stands reduce Abies alba tree-ring sensitivity to summer drought in the Vosges mountains, western Europe. For. Ecol. Manag. 2013, 303, 61–71. [Google Scholar] [CrossRef]
- Forrester, D.I. The spatial and temporal dynamics of species interactions in mixed-species forests: From pattern to process. For. Ecol. Manag. 2014, 312, 282–292. [Google Scholar] [CrossRef]
- Eslaminejad, P.; Heydari, M.; Kakhki, F.V.; Mirab-balou, M.; Omidipour, R.; Muñoz-Rojas, M.; Lucas-Borja, M.E. Plant species and season influence soil physicochemical properties and microbial function in a semi-arid woodland ecosystem. Plant Soil 2020, 456, 43–59. [Google Scholar] [CrossRef]
- Moukoumi, J.; Farrell, R.E.; Van Rees, K.J.C.; Hynes, R.K.; Bélanger, N. Intercropping Caragana arborescens with Salix miyabeana to Satisfy Nitrogen Demand and Maximize Growth. BioEnergy Res. 2012, 5, 719–732. [Google Scholar] [CrossRef]
- Tang, G.-d.; Meng, Z.-j.; Gao, Y.; Dang, X.-h. Wind-sand movement characteristics and erosion mechanism of a solar photovoltaic array in the middle of the Hobq Desert, Northwestern China. J. Mt. Sci. 2021, 18, 1340–1351. [Google Scholar] [CrossRef]
- Dang, X.; Na, Y.; Chi, W.; Zhao, J.; Zhao, Y.; Wang, Y.; Wu, X.; Wang, Y. Spatio-Temporal Evolution of Sandy Land and its Impact on Soil Wind Erosion in the Kubuqi Desert in Recent 30 Years. Front. Environ. Sci. 2022, 10, 950196. [Google Scholar] [CrossRef]
- Vdović, N.; Pikelj, K.; Jurina, I.; Ivanić, M.; Dunato, N.; Štefan, A. The implications of sample preparation on the particle size distribution of soil. J. Plant Nutr. Soil Sci. 2019, 182, 277–285. [Google Scholar] [CrossRef]
- Wentworth, C.K. A Scale of Grade and Class Terms for Clastic Sediments. J. Geol. 1922, 30, 377–392. [Google Scholar] [CrossRef]
- Folk, R.L.; Ward, W.C. Brazos River bar [Texas]; a study in the significance of grain size parameters. J. Sediment. Res. 1957, 27, 3–26. [Google Scholar] [CrossRef]
- Friedman, G.M.; Sanders, J.E. Principles of Sedimentology; Wiley: New York, NY, USA, 1978. [Google Scholar]
- Ma, X.; Xiao, J.; Yao, Z. A comparative study on the three calculation methods of grain-size parameters for aeolian sediments. J. Desert Res. 2020, 40, 95–102. [Google Scholar] [CrossRef]
- Tyler, S.W.; Wheatcraft, S.W. Fractal Scaling of Soil Particle Size Distributions Analysis and Limitations. Soil Sci. Soc. Am. J. 1992, 56, 362–369. [Google Scholar] [CrossRef]
- Tyler, S.W.; Wheatcraft, S.W. Application of Fractal Mathematics to Soil Water Retention Estimation. Soil Sci. Soc. Am. J. 1989, 53, 987–996. [Google Scholar] [CrossRef]
- Chhabra, A.B.; Meneveau, C.; Jensen, R.V.; Sreenivasan, K.R. Direct determination of the f(α) singularity spectrum and its application to fully developed turbulence. Phys. Rev. A 1989, 40, 5284–5294. [Google Scholar] [CrossRef] [PubMed]
- Gao, Z.; Niu, F.; Lin, Z.; Luo, J. Fractal and multifractal analysis of soil particle-size distribution and correlation with soil hydrological properties in active layer of Qinghai–Tibet Plateau, China. Catena 2021, 203, 105373. [Google Scholar] [CrossRef]
- Rényi, A. On a new axiomatic theory of probability. Acta Math. Acad. Sci. Hung. 1955, 6, 285–335. [Google Scholar] [CrossRef]
- Liao, R.; Yu, H.; Yang, P. Multifractal analysis of soil particle size distribution to evaluate the effects of gypsum on the quality of sodic soils. Eur. J. Soil Sci. 2020, 72, 1726–1741. [Google Scholar] [CrossRef]
- Chhabra, A.; Jensen, R.V. Direct determination of the f(α) singularity spectrum. Phys. Rev. Lett. 1989, 62, 1327–1330. [Google Scholar] [CrossRef]
- Dai, Y.; Guo, J.; Li, Y.; Dong, Z.; Li, H. Soil physical and chemical properties affected by long-term grazing on the desert steppe of Inner Mongolia, China. Catena 2022, 211, 105996. [Google Scholar] [CrossRef]
- Wang, X.; Geng, X.; Liu, B.; Cai, D.; Li, D.; Xiao, F.; Zhu, B.; Hua, T.; Lu, R.; Liu, F. Desert ecosystems in China: Past, present, and future. Earth-Sci. Rev. 2022, 234, 104206. [Google Scholar] [CrossRef]
- Yu, W.; Zhang, Z.; Li, Q.; Zou, J.; Feng, Z.; Wen, T. Effects of Pinus sylvestris var. mongolica afforestation on soil physicochemical properties at the southern edge of the Mu Us Sandy Land, China. For. Ecol. Manag. 2023, 545, 121254. [Google Scholar] [CrossRef]
- Zhang, B.; Xiong, D.; Tang, Y.; Liu, L. Land surface roughness impacted by typical vegetation restoration projects on aeolian sandy lands in the Yarlung Zangbo River valley, southern Tibetan plateau. Int. Soil Water Conserv. Res. 2022, 10, 109–118. [Google Scholar] [CrossRef]
- Wang, X.; Lang, L.; Hua, T.; Li, H.; Zhang, C.; Ma, W. Effects of aeolian processes on soil nutrient loss in the Gonghe Basin, Qinghai–Tibet Plateau: An experimental study. J. Soils Sediments 2017, 18, 229–238. [Google Scholar] [CrossRef]
- Cao, X.; Jiao, J.; Li, J.; Qi, H.; Bai, L.; Wang, X.; Sun, X. Morphometric characteristics and sand intercepting capacity of dominant perennial plants in the Eastern Qaidam Basin: Implication for aeolian erosion control. Catena 2022, 210, 105939. [Google Scholar] [CrossRef]
- Yang, X.; Shao, M.; Li, T.; Zhang, Q.; Gan, M.; Chen, M.; Bai, X. Distribution of soil nutrients under typical artificial vegetation in the desert–loess transition zone. Catena 2021, 200, 105165. [Google Scholar] [CrossRef]
- Douglas, G.B.; McIvor, I.R.; Potter, J.F.; Foote, L.G. Root distribution of poplar at varying densities on pastoral hill country. Plant Soil 2010, 333, 147–161. [Google Scholar] [CrossRef]
- Wen, Z.; White, P.J.; Shen, J.; Lambers, H. Linking root exudation to belowground economic traits for resource acquisition. New Phytol. 2022, 233, 1620–1635. [Google Scholar] [CrossRef]
- Long, Y.; Liang, F.; Zhang, J.; Xue, M.; Zhang, T.; Pei, X. Identification of drought response genes by digital gene expression (DGE) analysis in Caragana korshinskii Kom. Gene 2020, 725, 144170. [Google Scholar] [CrossRef] [PubMed]
- Amorim, H.C.S.; Araujo, M.A.; Lal, R.; Zinn, Y.L. What C:N ratios in soil particle-size fractions really say: N is preferentially sorbed by clays over organic C. Catena 2023, 230, 107230. [Google Scholar] [CrossRef]
- Singh, A.K.; Jiang, X.-J.; Yang, B.; Wu, J.; Rai, A.; Chen, C.; Ahirwal, J.; Wang, P.; Liu, W.; Singh, N. Biological indicators affected by land use change, soil resource availability and seasonality in dry tropics. Ecol. Indic. 2020, 115, 106369. [Google Scholar] [CrossRef]
- Li, H.; Meng, Z.; Dang, X.; Yang, P. Checkerboard Barriers Attenuate Soil Particle Loss and Promote Nutrient Contents of Soil. Sustainability 2022, 14, 10492. [Google Scholar] [CrossRef]
- Fu, G.; Xu, X.; Qiu, X.; Xu, G.; Shang, W.; Yang, X.; Zhao, P.; Chai, C.; Hu, X.; Zhang, Y.; et al. Wind tunnel study of the effect of planting Haloxylon ammodendron on aeolian sediment transport. Biosyst. Eng. 2021, 208, 234–245. [Google Scholar] [CrossRef]
- Wang, X.; Sun, L.; Zhao, N.; Li, W.; Wei, X.; Niu, B. Multifractal dimensions of soil particle size distribution reveal the erodibility and fertility of alpine grassland soils in the Northern Tibet Plateau. J. Environ. Manag. 2022, 315, 115145. [Google Scholar] [CrossRef]
- Peng, G.; Xiang, N.; Lv, S.; Zhang, G. Fractal characterization of soil particle-size distribution under different land-use patterns in the Yellow River Delta Wetland in China. J. Soils Sediments 2014, 14, 1116–1122. [Google Scholar] [CrossRef]

Disclaimer/Publisher’s Note: The statements, opinions and data contained in all publications are solely those of the individual author(s) and contributor(s) and not of MDPI and/or the editor(s). MDPI and/or the editor(s) disclaim responsibility for any injury to people or property resulting from any ideas, methods, instructions or products referred to in the content. |
© 2024 by the authors. Licensee MDPI, Basel, Switzerland. This article is an open access article distributed under the terms and conditions of the Creative Commons Attribution (CC BY) license (https://creativecommons.org/licenses/by/4.0/).