Article

Fragmentation and Connectivity in dehesa Ecosystems Associated with Cerambyx spp. Dispersion and Control: A Graph-Theory Approach

by
Adrián Cidre-González
1,*,
Carlos A. Rivas
1,2 and
Rafael M. Navarro-Cerrillo
1
1
Department of Forest Engineering, Laboratory of Dendrochronology, Silviculture and Global Change—DendrodatLab—ERSAF, University of Cordoba, Campus de Rabanales, Crta. IV, Km. 396, 14071 Cordoba, Spain
2
Facultad de Ciencias Básicas, Universidad Técnica de Manabí, Avenida Urbina y Portoviejo, Portoviejo 130105, Ecuador
*
Author to whom correspondence should be addressed.
Forests 2024, 15(4), 648; https://doi.org/10.3390/f15040648
Submission received: 1 March 2024 / Revised: 28 March 2024 / Accepted: 29 March 2024 / Published: 2 April 2024
(This article belongs to the Special Issue Impact of Pests, Climate and Other Factors on Forest Health)

Abstract

:
Xylophagous insects play a crucial role in forest ecosystems, contributing to population dynamics. The “Cerambyx complex” (CC) constitutes an emerging pest in Mediterranean oak woodlands. We studied the fragmentation and connectivity of holm and cork oak stands in Andalusia (Spain), and the relationships with the current dispersion of CC, as well as the effect on the connectivity and dispersion patterns with the implementation of nests of a predator bird (Garrulus glandarius) to reduce insect populations in highly connected areas. The Kernel Density Estimation (KDE) was used to assess the spatial distribution of CC. Connectivity was assessed using graphs theory (Graphab 2.6) to characterize the importance of patches and linkages for contributing to dispersal. We selected the Eurasian jay (G. glandarius) as a reference bird species to generate “barriers” to the dispersion of the CC. We used the probability of connectivity (PC) and the flux (F) to compare the effect of the introduction of Eurasian jay nets. Results showed an increasing trend in the distribution and incidence of CC during the period 2001–2016, resulting in 7.3% and 13.1% mortality rates for Q. ilex and Q. suber, respectively. The connectivity model using only Q. ilex and Q. suber forests as reference habitats was not enough to explain the distribution of CC. The value of PC and F metrics decreased by 38.09% and 20.59% by introducing 300 nests of Eurasian jay. Our methodology provides a pest management tool using connectivity metrics, which can be integrated with other variables to control pest outbreaks and pest dispersion.

1. Introduction

Oak forests of the southwestern Iberian Peninsula are dominated by anthropological ecosystems characterized by savannah-like features (e.g., dehesa) [1]. Dehesas include different tree densities, species and ages within an area of agro-silvo-pastoral use, which are not only important to conserve and develop rural populations, but also because they harbour a wide range of biodiversity [2]. This ecosystem covers approximately 3.5–4 million hectares in Spain [2]. However, a multifactorial phenomenon in which biotic and abiotic factors interact to debilitate the trees has led the dehesas to mortality events [3]. This process involves a combination of primary factors (e.g., Phytophthora cinnamomi Rands or bark beetles) and secondary pests or pathogens [4].
In light of the above, in a climate change and, more specifically, global warming context, forests ecosystems are showing the increasing impacts of pest outbreaks [5], which are spreading to new habitats and forest types [6]. An example is the so-called “Cerambyx complex” (Coleoptera, Cerambycidae; hereinafter CC), including the xylophage insect species Cerambyx welensii Küster, Cerambyx cerdo L., and Prinobius myardi Mulsant [3]. Xylophage insects are crucial for ecological processes; namely nutrient recycling, wood degradation, and hollow formation, benefiting biodiversity in oak forests [7]. The principal hosts of CC belong to the genus Quercus, and more specifically, old individuals from Q. ilex and Q. suber with considerably large diameters for larvae development inside the stem [8]. Based on this, CC are oftentimes considered primary saproxylic beetles, but they can be detrimental when they colonize healthy trees. Insects included in the CC are considered emerging pests and major provoking factors of oak decline [9]. In Southern Spain, all species have a similar ecological niche, and they are often found living together at landscape, forest stand, or tree level [10]. Additionally, their dispersion is limited by the movement of populations from one stand to another stand. Among other factors, this dispersal capacity is conditioned by the characteristics of fragmentation and the connectivity of species habitat.
Fragmentation is the process in which a habitat subdivides into smaller, geometrically more complex and more isolated patches [11,12] and it should be measured at the landscape level [13,14]. At the landscape level, the most common effect of fragmentation is the formation of new edges or the modification of existing ones, which plays a fundamental role in the structure and functioning of ecosystems [15]. Fragmentation has been shown to affect the distribution, dynamics, movement, genetics, diversity, morphology, physiology, and interaction of populations or individuals, as well as affecting nutrient retention, productivity, and even microclimates [16]. As a complementary concept to fragmentation, connectivity is defined as the degree to which the territory facilitates the movement of species among different patches of resources [17], and it is particularly important to the functioning of pest systems because it can help forest pests to invade new patches. Xylophage insects will spread better if the connectivity with other suitable patches is higher. Other studies have used connectivity measures to predict the abundance and damage of pests [18], showing that pest populations that are highly connected have more prospects for receiving more individuals from external populations [19]. Conversely, isolated pest populations experiencing high mortality might undergo a local extinction, since they cannot receive more individuals [20].
Based on the need to study the relationship between fragmentation and connectivity with pest responses in forest ecosystems, we applied graphs theory to explore the flow of the CC across the dehesa complex habitat network. Graph-based approaches provide an effective method to assess functional connectivity through habitat networks [21,22]. A graph represents the landscape as a set of nodes (habitat patches), connected by edges that join pairs of nodes functionally (via dispersal) [23]. It has the advantage of addressing potential connectivity based on the dispersal biology of species [24], and the capacity of identifying the importance of the different patches and their contribution to the landscape connectivity as well as their potential to function as corridors for pests dispersal [18,25]. To do so, connectivity metrics can be computed at different levels [26].
Recent studies have predicted that the potential distribution of CC is far larger than the current distribution, and it might increase considerably in different climate change scenarios [3]. We hypothesized that current CC distribution and dispersion is following connectivity patterns, and it might be stopped or slowed down by increasing insect predation (e.g., avifauna pest regulation) in agroforestry mosaics. This hypothesis is supported by previous studies that show the effect of avifauna on insect control in dehesa systems [27,28], including xylophagous insect species [29,30]. A reduction in connectivity levels entails less individuals exchange, less colonization, and higher local isolation [31,32]. Therefore, in this research, we studied the fragmentation and connectivity of holm oak and cork oak stands in northern western Andalusia (Spain), and the relationships with the current dispersion of the CC, as well as the effect on the connectivity and dispersion patterns with the implementation of nests of a predator bird Garrulus glandarius L. (Euroasian Jay) to reduce insect populations in highly connected areas. The specific objectives of this study were: (1) to define the current fragmentation and connectivity of holm oak and cork oak stands in the study area; (2) to identify the damage and abundance of the CC in the study area; (3) to study the spatio-temporal changes of the CC in the selected zone and their role in the impact on the holm oak and cork oak stands; (4) to set up a landscape graph and select connectivity metrics that correctly reflect the current presence of the CC; and (5) to model the impact of avifauna pest regulation to reduce the connectivity through local connectivity metrics. Previous studies [3,9] have explored CC-related damage to Spanish dehesas, but none, to our knowledge, have used fragmentation and connectivity as ecological drivers. This approach can positively contribute to reducing the global pest impact on forests by diminishing the connectivity of the landscape, and it could be an alternative or a complement to other methods, such as mass trapping using attractive compounds, for an integrated pest management.

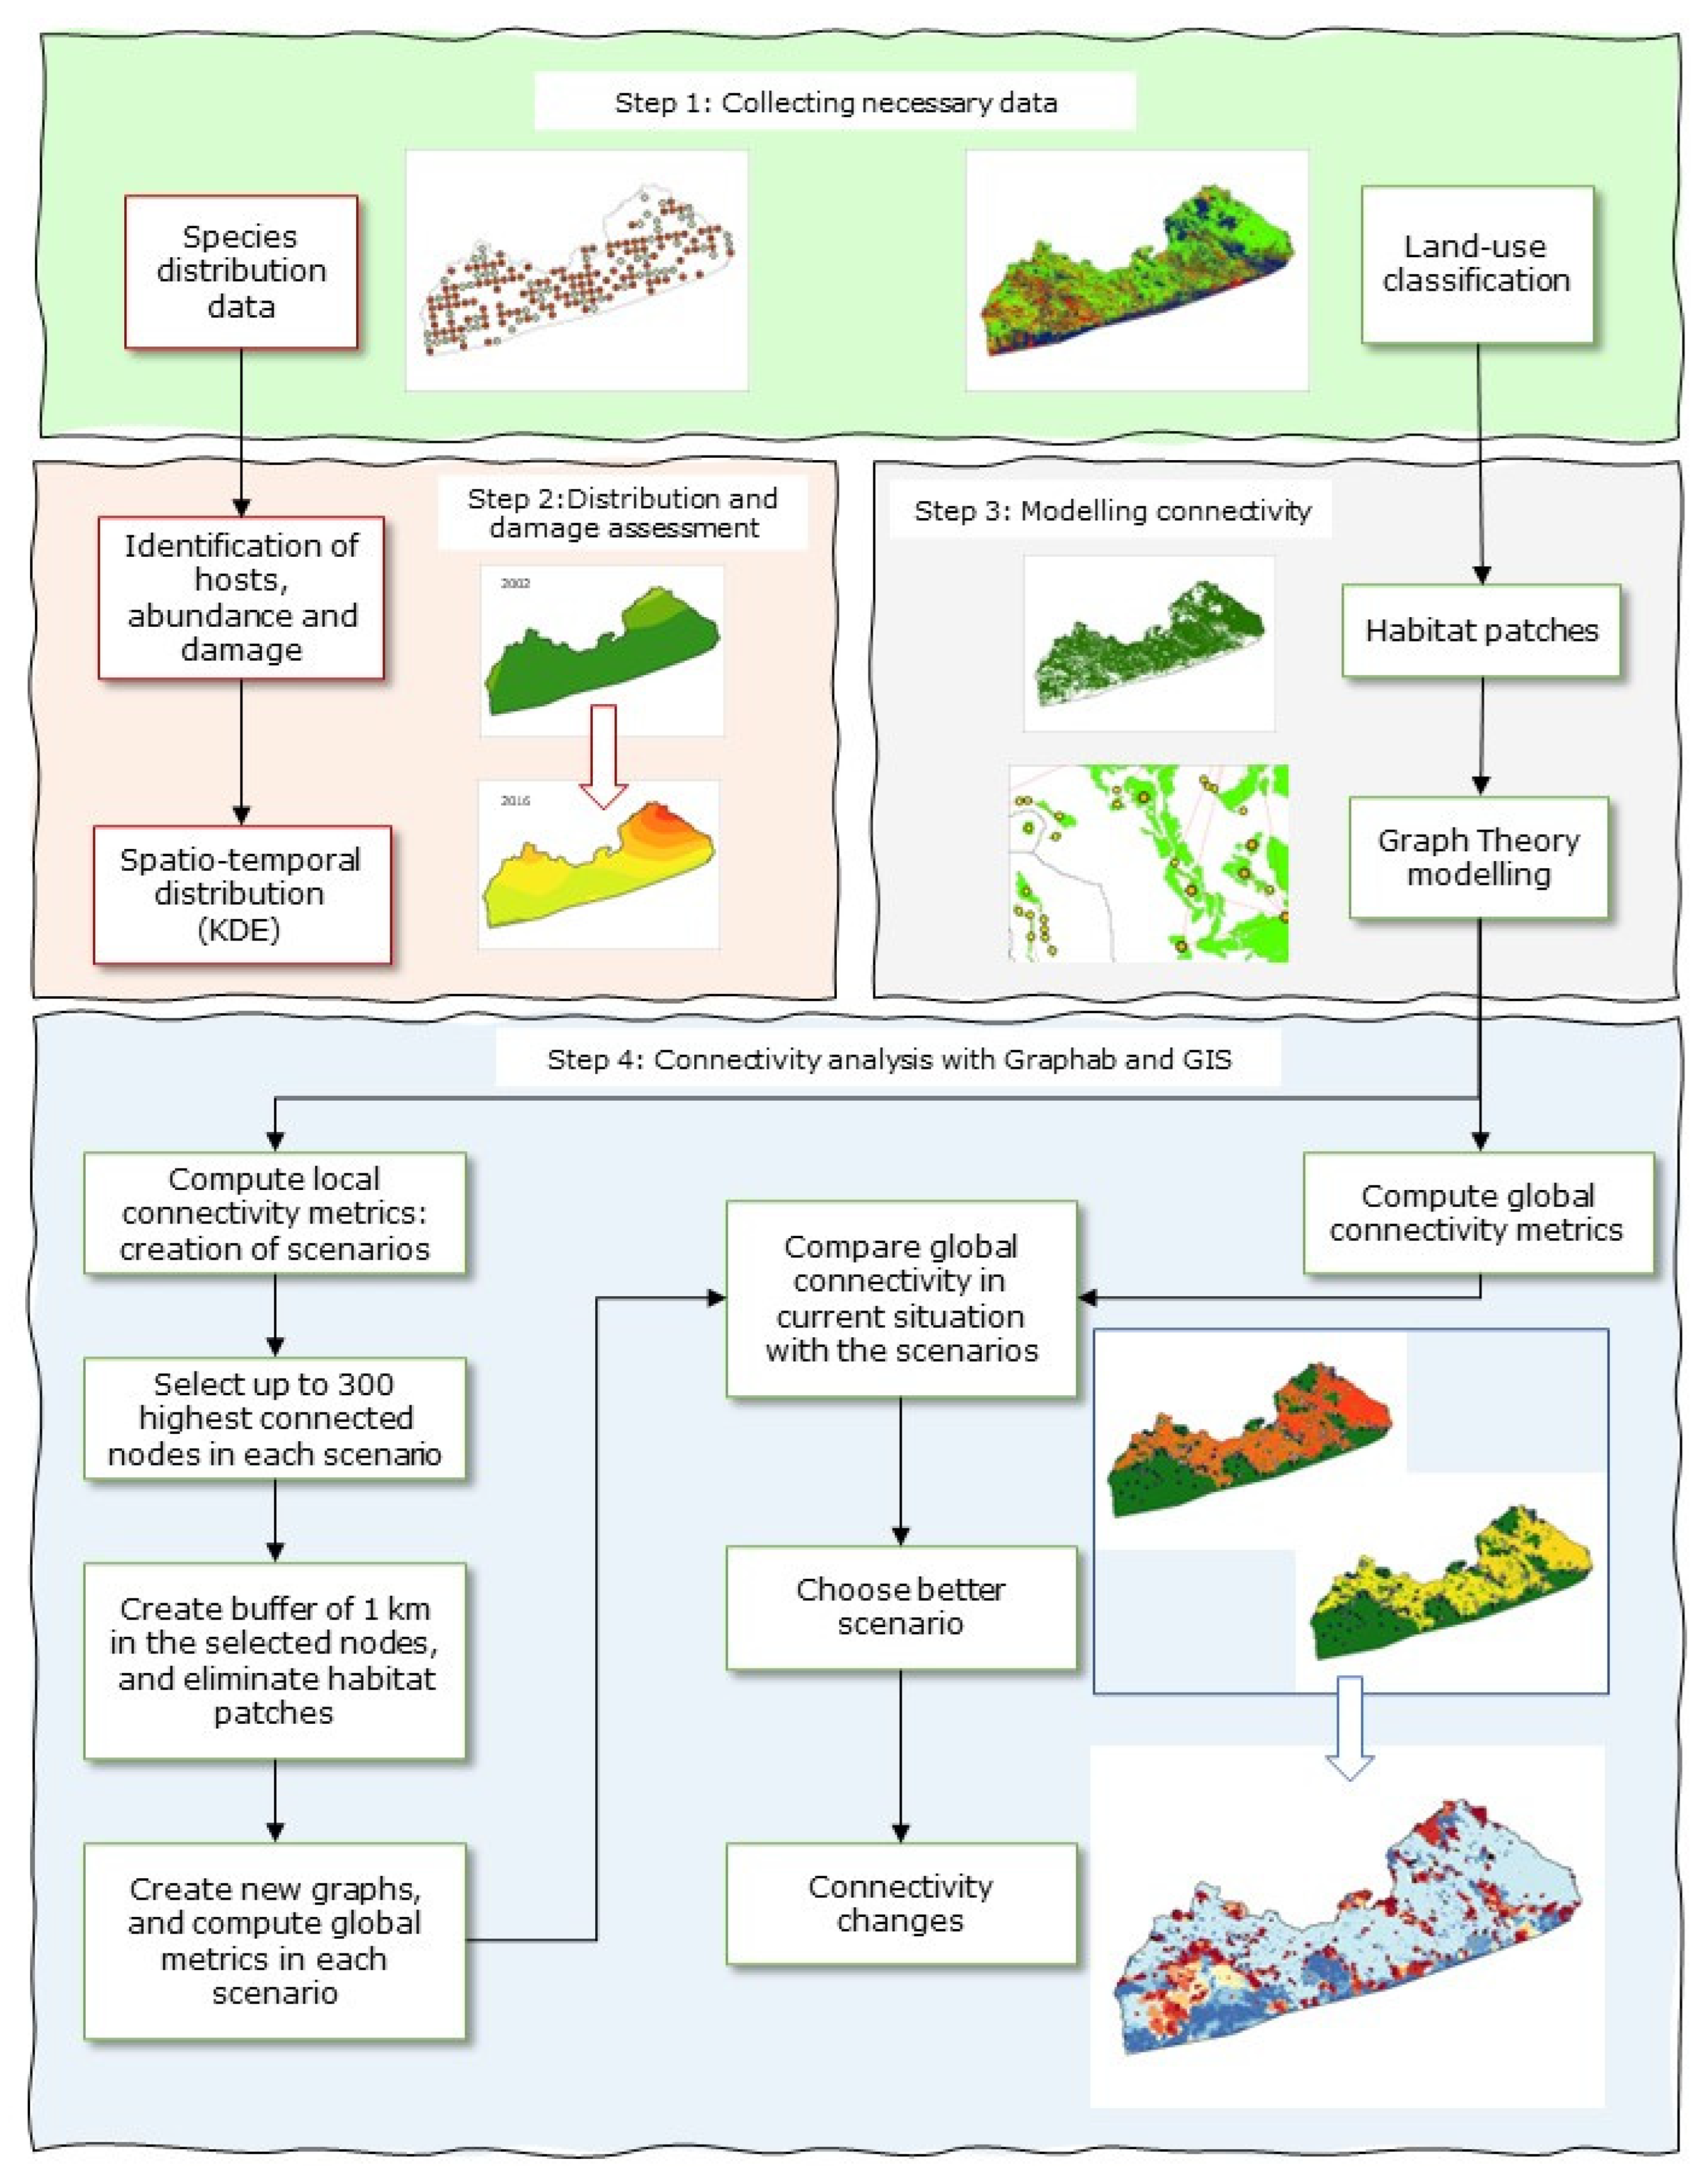
2. Materials and Methods
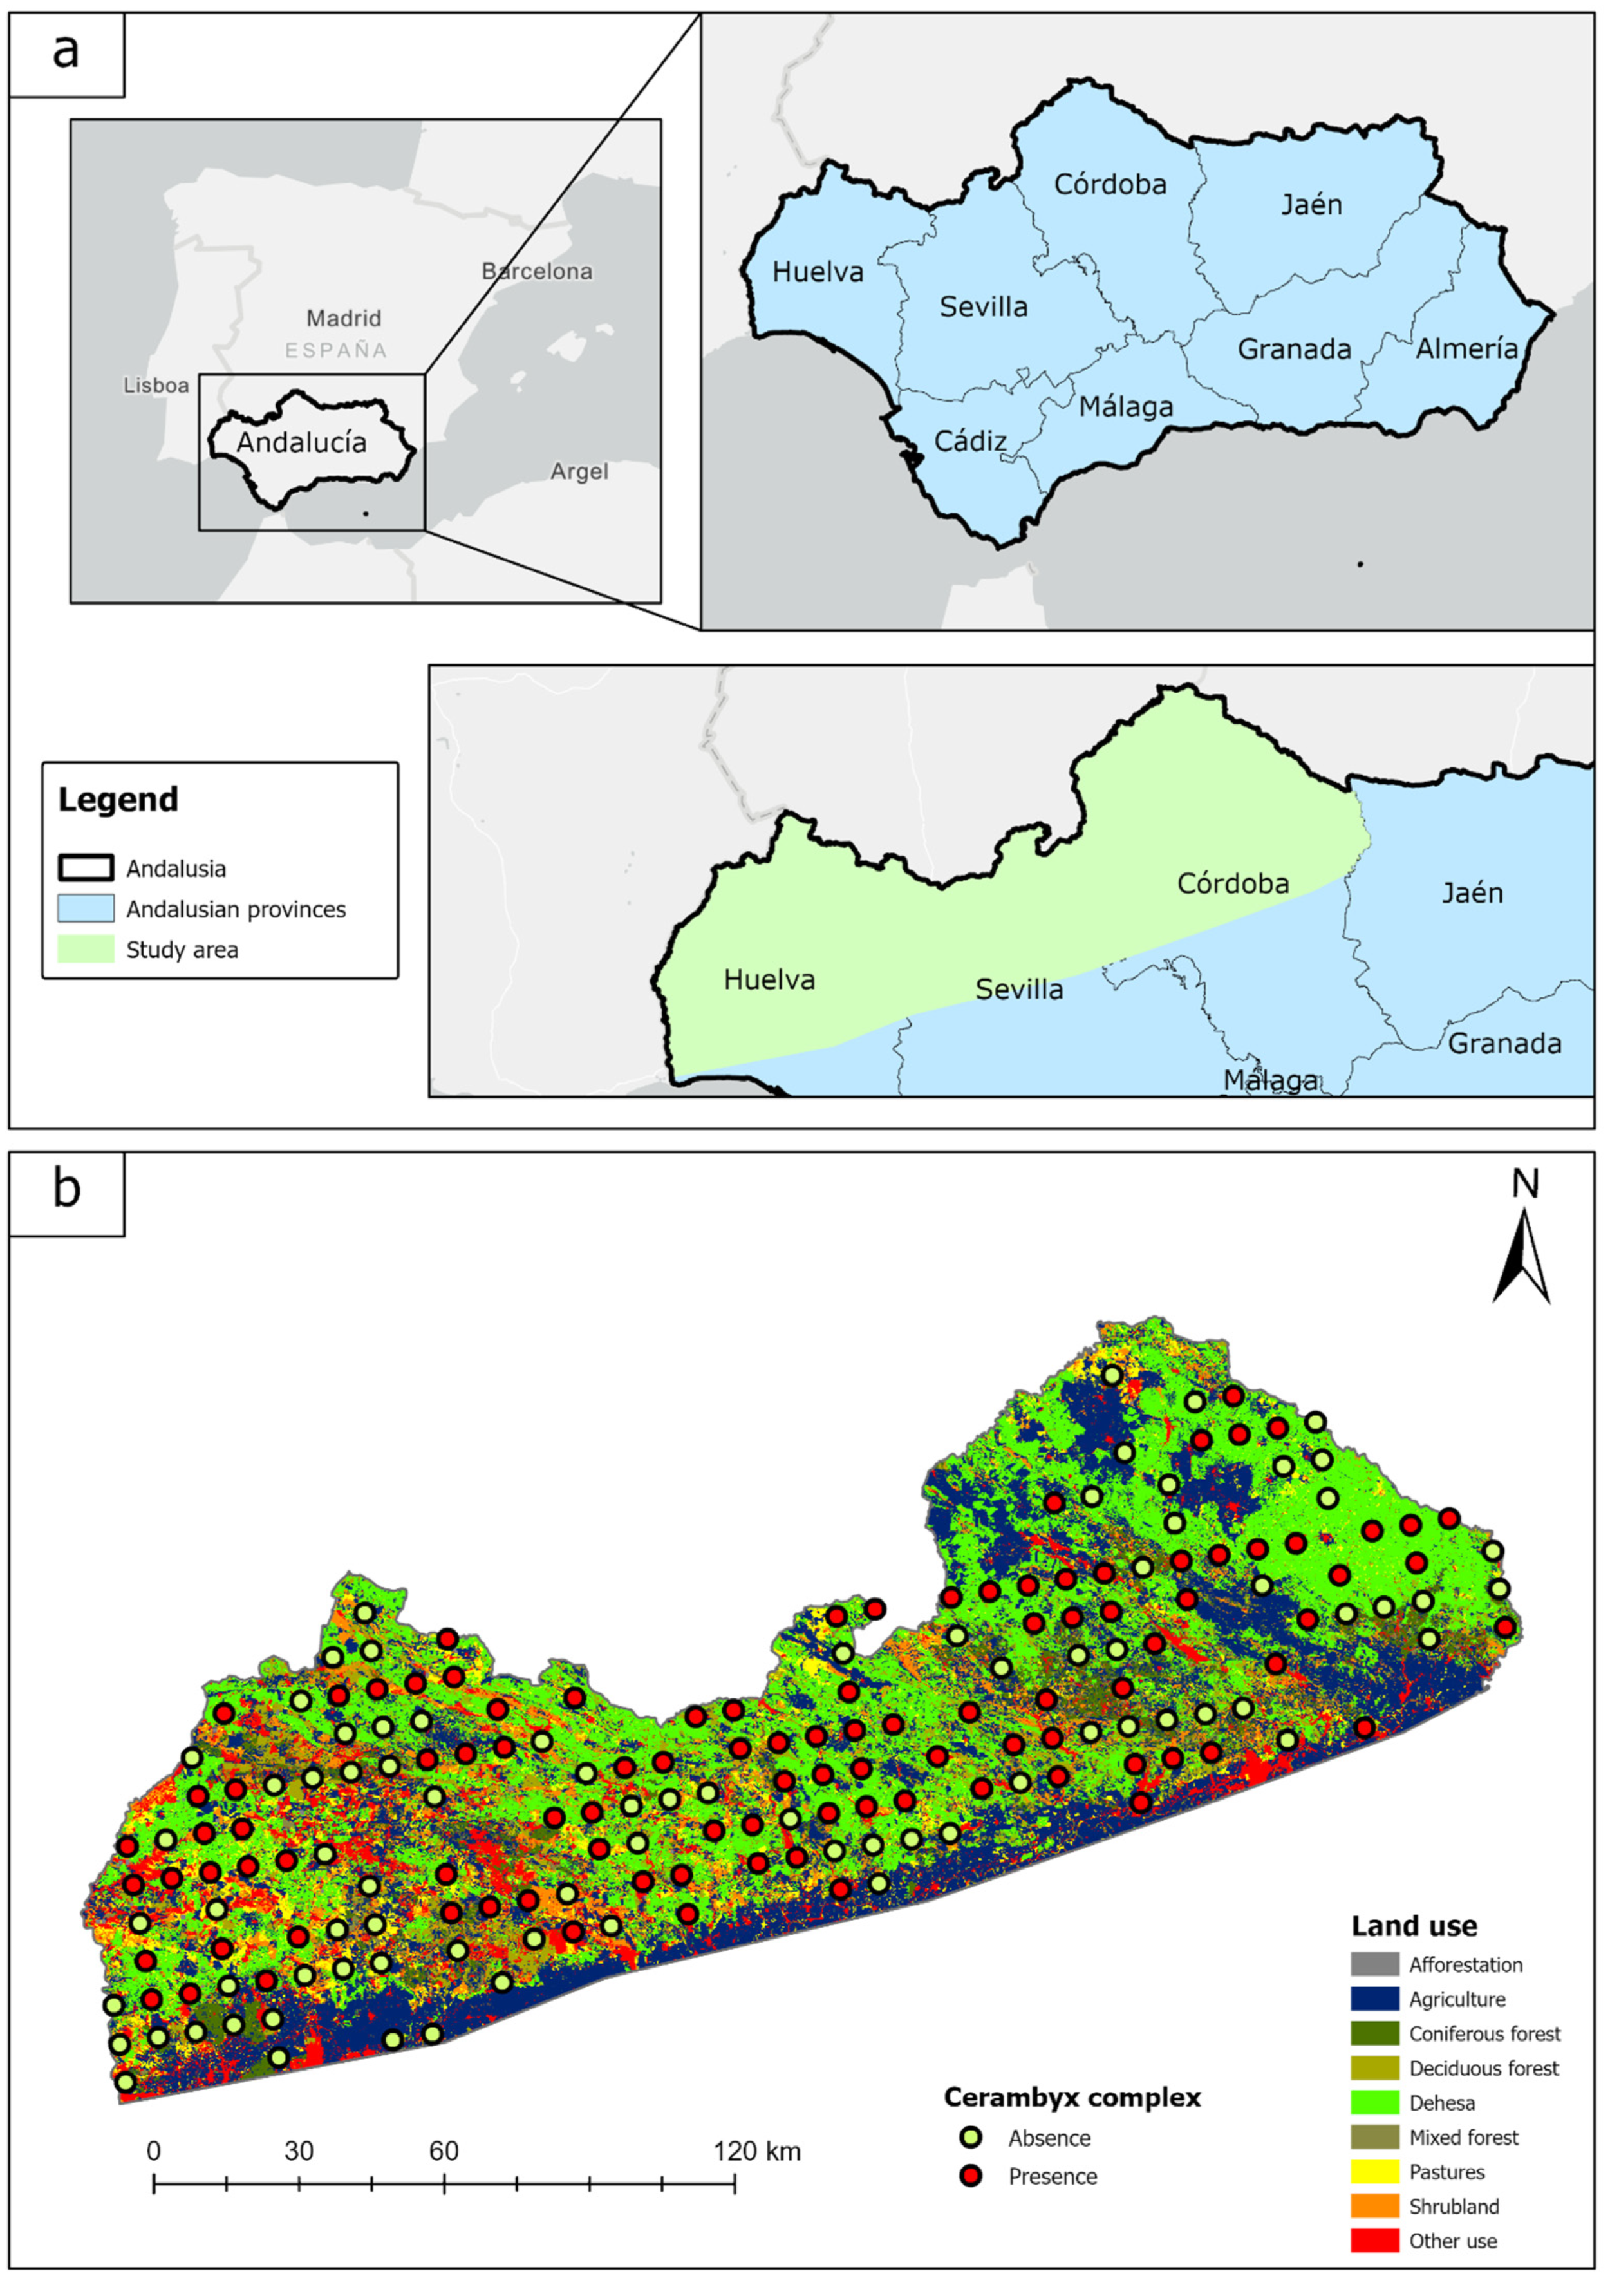
2.1. Study Area

The study area (Figure 1a) is located in Andalusia, Southern Spain, and encompasses the northern regions of Huelva, Seville, and Cordoba (7.62°–4.12° W, 37.2°–38.80° N). It has a biogeographic character and is home to the Sierra Morena Mountain Range, which hosts most of the dehesas in Andalusia. With an area of 21,193 km2, the study area has a temperate Mediterranean climate, characterized by hot and dry summers, mild winters, and irregular precipitation concentrated in the spring and fall [33]. The mean annual temperature ranges from 11 °C to 18 °C and the annual precipitation ranges from 600 mm to 1200 mm with a marked summer dryness. The elevation in the study area fluctuates from sea level to 1028 m.a.s.l. The primary land use in the study area is Mediterranean oaks woodlands (CC habitat) with a canopy cover of at least 5% Q. ilex and Q. suber, occupying 46.37% of the total area. Agricultural lands occupy 17% of the total area, and other forests 13%, whereas other land uses make up less than 10% (Table 1).

2.2. Data Acquisition and Processing

Figure 2 illustrates the research methodology conducted in this study, and it is explained in the following sections.

2.2.1. Land-Use Data

We used the cartography of Q. ilex and Q. suber at the scale of 1:10,000 elaborated by the Andalusian Environmental Information Network (REDIAM-Information System of Spanish Soil Occupation; [34]). This cartography was partially revised by photointerpretation using the reference orthophoto from 2016, and there is a current version from September 2021 (https://descargasrediam.cica.es, accessed on 16 February 2022). Given its accuracy, and with the specific purpose of studying the distribution of the holm oak and cork oak, we chose this land use map for undertaking our research (hereafter called CC habitat). We also added an afforestation land use layer including the afforestation on agricultural lands records for the period 1993–2008 [35]. For the rest of the land uses, we used the SIOSE layer at a scale of 1:10,000 from 2016, which is the most up-to-date available land-use layer for Andalusia (https://descargasrediam.cica.es, accessed on 16 February 2022). The legend of SIOSE was simplified to six different land cover classes plus afforestation and CC habitat (Table 1). We overlaid the layer in ArcGIS Pro 2.8, with the priority order of afforestation, CC habitat, and SIOSE. Lastly, we rasterized with a 30-m spatial resolution (Figure 1b, see Section 2.4). Note that in the text we sometimes use the term dehesa to refer to the CC habitat. This is because most of the CC habitat are dehesa-like systems (Figure S1 Supplementary Material).

2.2.2. Species Distribution Data

The data of presence of CC have been compiled from the “Red Andaluza de Seguimiento de Daños” (SEDA network), a network that assesses and monitors forest health of Andalusia (https://descargasrediam.cica.es, accessed on 20 October 2022). It consists of a systematic 8 × 8 kilometre grid (1 point per 64 km2) where every year the status of 24 trees per plot is assessed [36]. Several features are assessed at tree level, including the presence of pests and pathogens, their abundance, and their damage level [9].
We identified a total of 182 plots within the study area (5004 assessed trees) which were considered as presence plots when at least one tree in the plot had a registered infestation by CC during the period 2001–2016. The survey points are located at the vertexes of 8 × 8 km grids, laid out by the International Co-operative Programme on Assessment and Monitoring of Air Pollution Effects on Forests (CEE-ICP Forest). At each point, the same 24 trees were monitored each year, and the presence of xylophage insects (Cerambyx complex species) was evaluated at the tree level: colonized trees were identified by the presence of the typical oval exit holes on the trunk or thick branches [8,37]. Note that the SEDA Network assesses Cerambyx sp., and therefore, there might be more species in this bucket [3]. To handle this, we only considered Quercus ilex and Q. suber for the subsequent analysis. This resulted in a total of 101 presences and 81 absences (Figure 1b). When one tree had any registration of CC, that tree was considered as infested during the subsequent years. Tree damage was assessed using the ICP Manual-Level I [38] on a 0–3 scale (0 alive tree, no symptoms observed on any part of the tree; 1 alive tree, partial damage symptoms observed in the crown; 2 alive tree, severe damage symptoms observed in the crown and branches; 3 dead tree), and the abundance was reported using four classes based on the presence of the typical oval exit holes on the trunk or thick branches (0 fresh damage; 1 old damage that began before the last inventory; 2 fresh and old damage visible; 3 generalized damage along trunk and branches). To find any dependence between damage and abundance, a correspondence analysis was carried out. The data were analysed in an R environment [39] using the dplyr package [40], and the correspondence analysis was calculated and analysed with the ca package [41].

2.3. Temporal Distribution of CC

The Kernel Density Estimation (KDE) was used to determine how the spatial distribution of the CC changed over time. The KDE is a non-parametric estimator of univariate or multivariate densities [42]. We used the Gaussian kernel density function available in the stats package in R (R Core Team 2022), with a bandwidth of 10,000, and weighted by the number of trees infested by CC in the plot. Other R packages used were spatstat [43], terra [44], and tidyterra [45]. The changes were assessed every two years from 2002 to 2016, and to determine if the increase in infested trees was statistically significant, we used the non-parametric Friedman test. Subsequently, we applied the Nemenvi’s All-Pairs Comparisons Test to determine if the biennial changes in infested trees were significant. The package PMCMRplus was used for executing the post-hoc test [46].

2.4. Connectivity Analysis: Landscape Network of CC

Graphs theory has been used to represent the landscape of habitat patches as a set of nodes (points) connected to some extent by edges between nodes. An edge between two nodes implies there is some ecological flux between the nodes, such as via propagule dispersal or material flow [23]; so, all of the connected nodes and links form a component or sub-graph [47].
Connectivity was assessed using graphs theory with the software Graphab 2.6 [48] (see http://thema.univ-fcomte.fr/productions/graphab/ (accessed on 26 October 2021)), based on the land-use layer created with ArcGIS Pro, the current dispersion of the CC, and the cost values of the different land-uses. The cost is understood as a measure that interprets the permeability of the different land-uses as least-cost distances [48]. We proposed four cost classes based on the ability of the species to move across them: habitat (1), suitable (10), neutral (100), and unfavourable (1000) (Table 1). The maximum dispersal distance was extracted from existing literature on a mark-recapture experiment [10] (Figure S2, Supplementary Material). To illustrate the pest dispersion, we used the maximum dispersal distances of females, which are of 1722 m for C. cerdo and 581 m for C. welensii [7]. For this particular study, we considered an average maximum dispersal distance of 800 m, which was transformed to cost distance by fitting a logarithmic regression from the metric distances [49], giving a value of 2717 cost units. We ran a model in which only dehesa was considered habitat, and another model in which all forest woodlands were included as habitat as well. The parameter α, present in some of the equations (Table 2), represents the intensity of the distance effect [23], and it was calculated from the maximum dispersal distance (d = 2717) and a low probability of movement (p = 0.05).

2.5. Connectivity Metrics Selection

The evaluation of connectivity was addressed with connectivity metrics, which can be computed at different levels [57]. To characterize the importance of patches and linkages for contributing to dispersal, three local metrics were selected to assess which one performs better to reduce the connectivity (Table 2): interaction flux (IF), connectivity correlation (CCor), and current flow (CF). Additionally, two global metrics (probability of connectivity—PC, and flux—F) were measured to describe the functional connectivity of the landscape, because they are particularly useful to compare the effectiveness of actions in the landscape [58,59]. Other features, such as the number of links (NL), number of nodes (NN; equivalent to number of patches), or number of components (NC) were also calculated to compare the results.

2.6. Proposals to Reduce the Connectivity

The reduction in permeability in the landscape might reduce the connectivity of the dehesa for the CC. To reduce the permeability, we simulated the introduction of nests of predator birds in the patches with higher local connectivity values. In this sense, these patches would have a barrier effect to the spread of the CC. We selected the Eurasian jay as a reference bird species and its ecology to generate “barriers” to the dispersion of the CC. The Eurasian jay is a sedentary species whose diet relies on oak acorns, contributing to its dispersion, although in spring and summer it predates on insects such as beetles [60]. Its seed dispersal distance at the habitat scale is 1 km, and it has a home range between 1 and 5 km [61]. Moreover, this bird species needs at least an area of 4 ha of habitat to support its survival [62], which can be detrimentally affected by fragmentation and the amount of available habitat [63].
Therefore, three different proposals were created from three local connectivity metrics (IF for S1, Ccor for S2, and CF for S3). For each proposal, we selected, arbitrarily, 300 nodes with higher connectivity values, which represent the patches where the nests were theoretically implemented (approximately 1 nest per 30 km2 of habitat). Previously, to ensure the survival of the Eurasian jay, we eliminated the nodes with a capacity lower than 3.96 ha, giving a total of 3925 patches to choose from using the local metrics. After selecting the highest connected and suitable patches, we applied a buffer area of 1 km to the nodes representing the habitat range of the Eurasian jay, and the home range (1–5 km) was not included as predation area. The dehesa, coniferous forest, deciduous forest, and mixed forest patches within this buffer area were considered as predation patches with a neutral cost value (i.e., cost = 100) to reproduce the predation barrier effect. With this information, we built three graphs, and the global metrics were computed again to compare the effectiveness of the predation in each graph. The best graph was selected based on the highest reduction in global connectivity, and posterior statistical analysis was applied (see statistical analysis section). As the final step, we used the interpolation tool of Graphab to create a raster with a spatial generalization of the local metric of the best graph, using a decreasing weighting function from the edge of the patches. Interpolation functionality was applied to the current situation and to the situation with nests in the best graph. The two raster layers were normalized from the minimum and maximum values of the current situation layer. From those two raster layers, we created another raster applying the difference, illustrating the gain and loss of connectivity in the landscape after implementing the nests.

2.7. Statistical Analysis

The distribution of the local metric in the best graph was assessed for normality using the Lilliefors. In view of the results, we used the non-parametric Wilcoxon rank-sum test to evaluate the significance of the differences in local connectivity before and after the implementation of nests, therefore, assessing whether the nests are functionally effective in reducing the connectivity. All of the analyses were carried out in an R environment using the basic R package stats [39].

3. Results

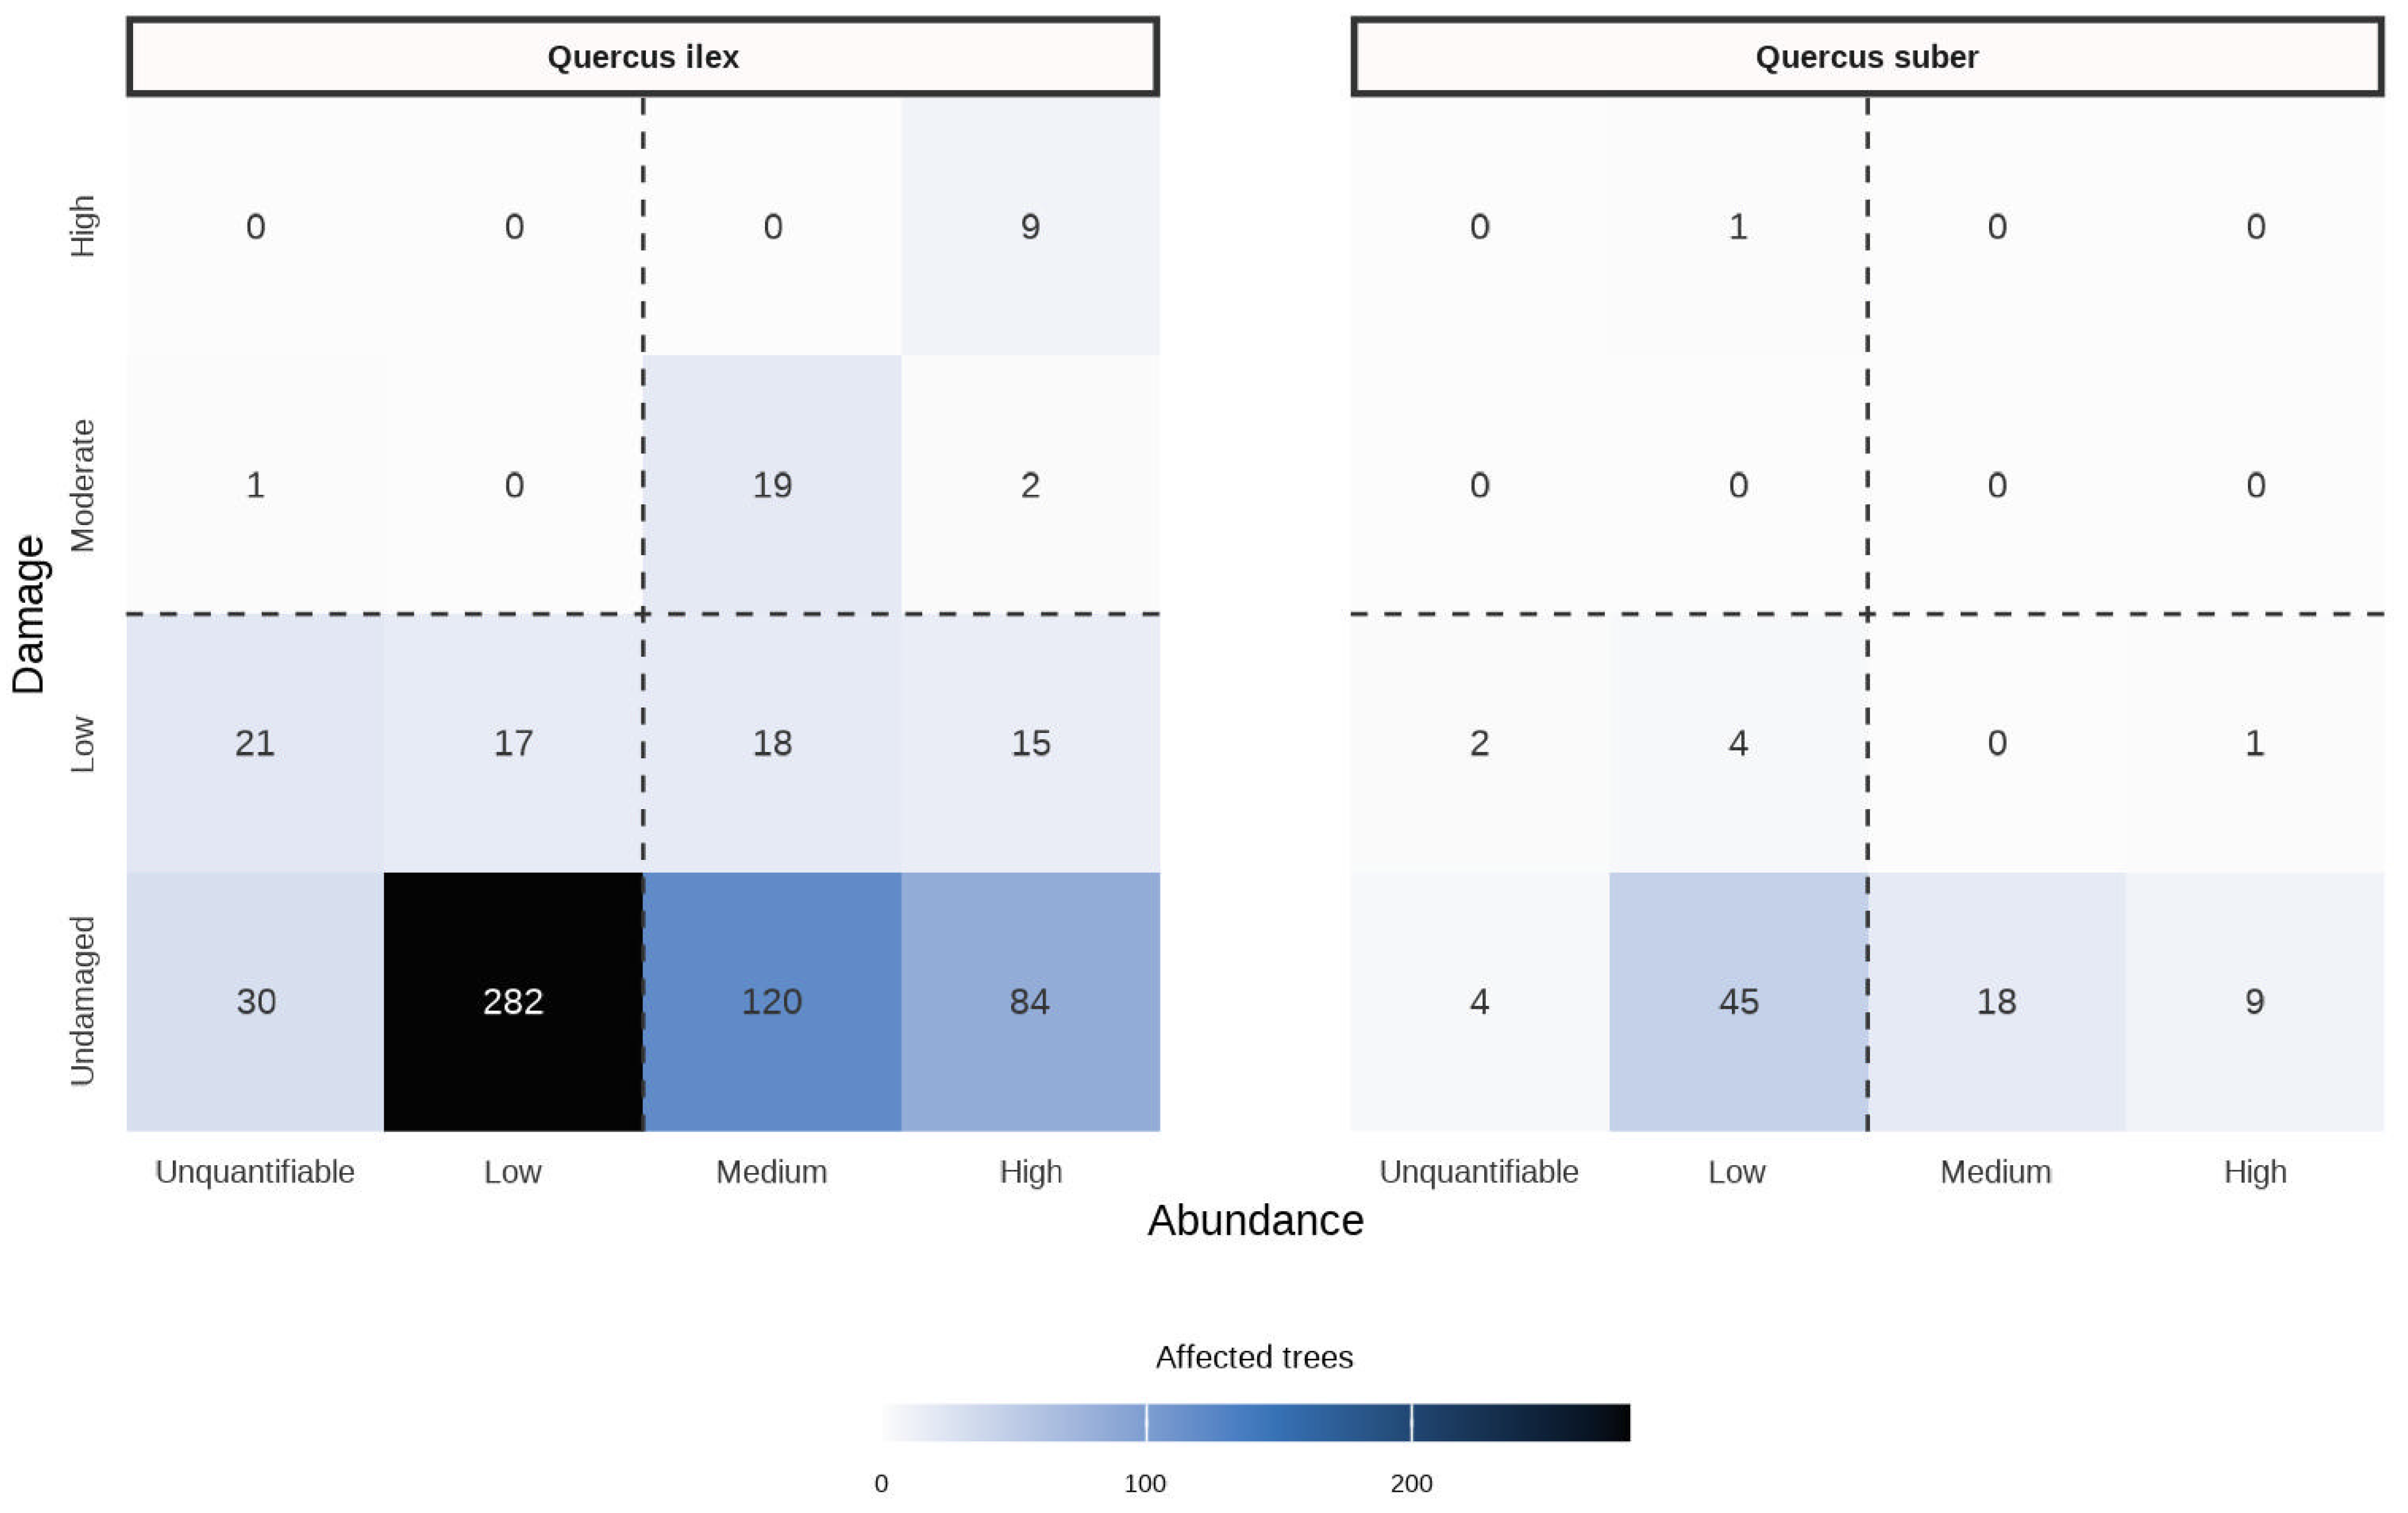
3.1. Abundance of and Damage by the CC

We identified 182 plots within the study area, of which 111 (Figure 1b) had a registered presence of the CC during the studied period (2001–2016). A total of 2798 holm oaks and 529 cork oaks were assessed. The great majority of infested trees (618; 88%) were holm oaks. The infestation rate for the assessed trees was 22% for holm oaks and almost 16% for cork oaks. A total of 45 holm oaks and 11 cork oaks died during the assessed period, resulting in 7.3% and 13.1% mortality rates, respectively (Table S1, Supplementary Material).
Most of the affected trees presented a low to high abundance of CC with no damages to the tree (Figure 3). Moderate and high damage were basically only found in holm oaks, and only when the abundance of CC was also high. The correspondence analysis, however, only showed an association between low abundance and undamaged, or unquantifiable and low damage. The same association was found when both species were analysed together or separately.

3.2. Spatial-Temporal Pattern Change

The evolution of the distribution of the CC showed different patterns from the first years of the time series (2002) to the last years (2016) (Figure 4). The eastern and north-eastern areas were the most negatively affected, and these correspond to the areas with the largest cover of dehesa woodlands. The first years of the time series showed that the CC started to colonize the dehesas of the study area from the northeast, and its dispersion and density kept growing every year. The north-western part of Sierra Morena had marginal populations of CC in the first years; however, in the last years of the series it had a considerable expansion. The Friedman test showed that the frequency of infested trees was significantly different among all of the biennium ( χ 2 = 602.94, p < 0.001). However, after running Nemenyi’s Test we found that significant differences happened from 2002 to 2008 (after six years; p < 0.05), and every four years afterwards. That is to say, the distribution of Cerambyx sp. in 2008 was not significantly different from 2010, but it was significantly different from 2012, and so forth.

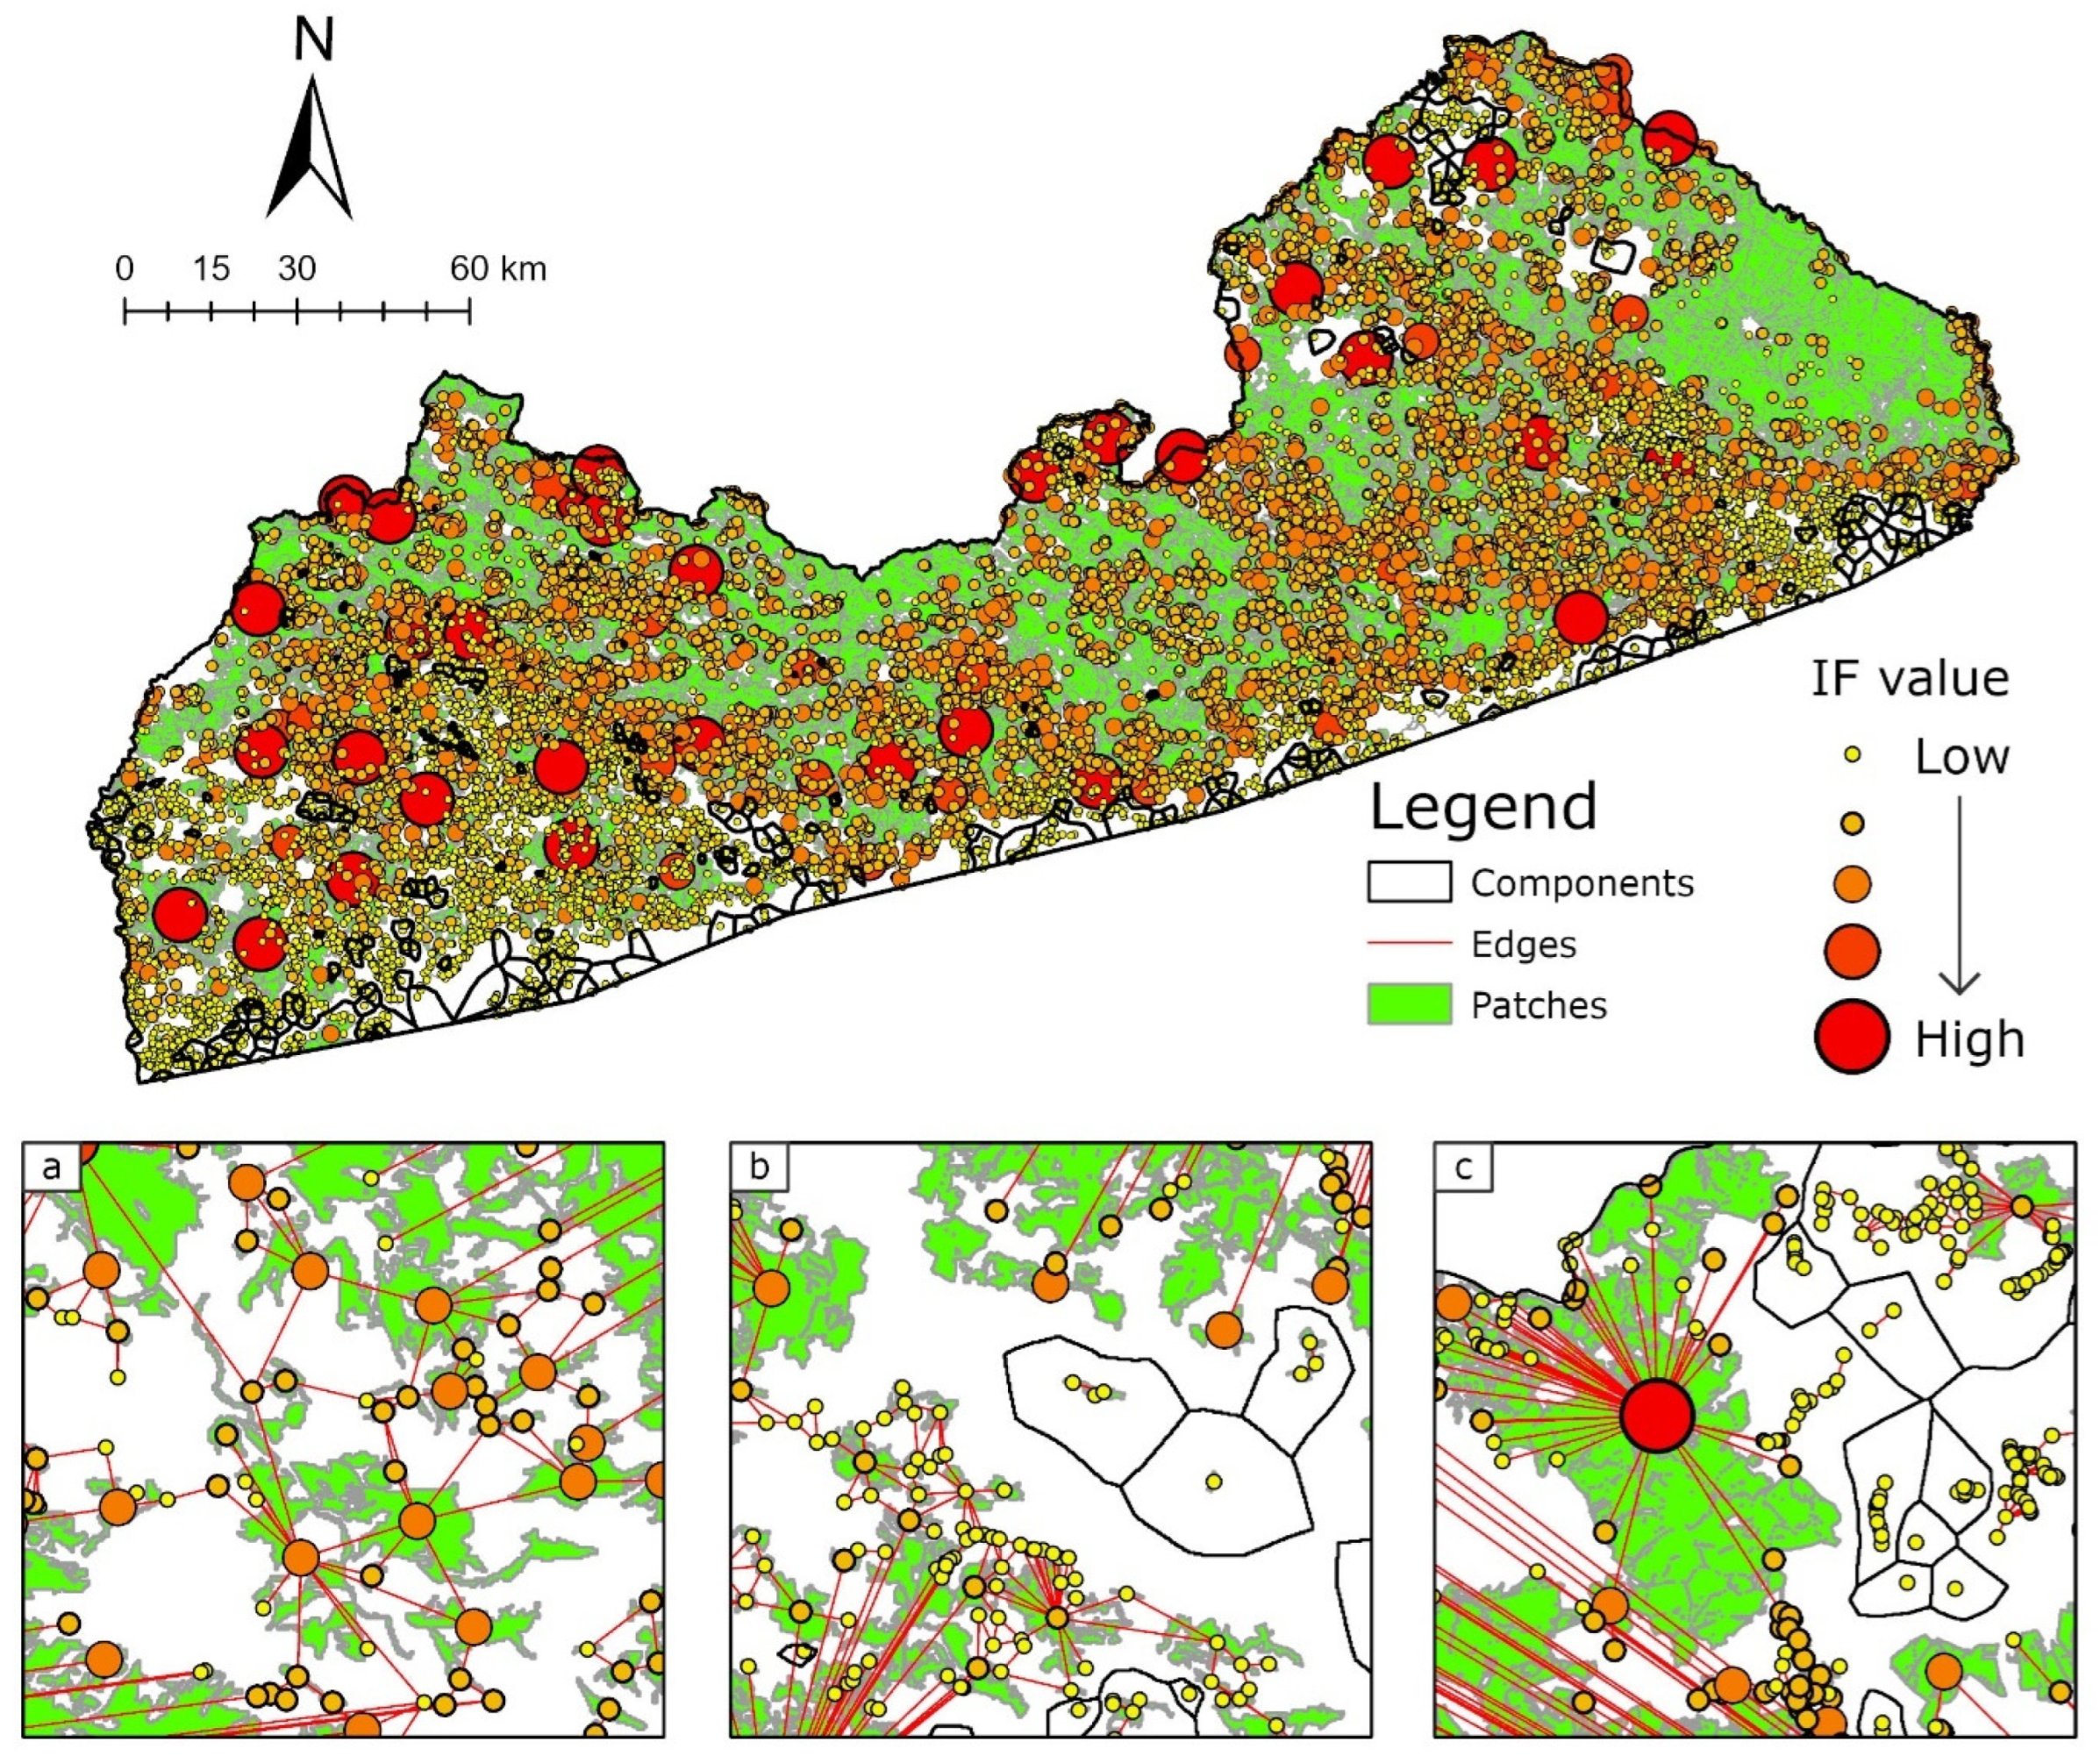
3.3. Impact of Graphs in Global Connectivity

The initial graph of the current situation including forest woodlands as habitat was composed of 16,300 nodes and 23,767 links (Figure 5). The connectivity model using only dehesa as a reference habitat was not enough to explain the distribution of the CC. However, the inclusion of other forest woodlands as habitat explained satisfactorily the current distribution. Regarding other land uses, generally, the study area was well-connected for the dispersion of the CC with a large component comprising the extent of Sierra Morena, and some isolated components mostly distributed in the southern and western areas, where agricultural lands and urban areas dominate over forest and dehesa woodlands. After computing the three local metrics in this graph, the three corresponding graphs were built (S1 for IF, S2 for Ccor, and S3 for CF). For each habitat patch, a connectivity value was calculated (Table 2). The metrics were designed for highlighting the connectivity through different procedures, and the highest connected patches are different in each graph. For a visual assessment of the highest connected patches consult Figure S3 (Supplementary Material).
The control graphs were composed of 300 nests chosen from 3925 possible places. Overall, the S1 and S2 graphs were composed of the largest patches (medianS1 = 119.40 ha, medianS2 = 84.6 ha), whereas S3 had generally smaller patches (medianS3 = 53.10 ha) (Table 3). Looking at the minimum patch size it is noticeable that S1 selected patches with high capacity (>25 ha), whereas S2 and S3 had highly connected patches with smaller capacity.
Notwithstanding the fact that the introduction of nests positively affected the reduction in the connectivity of the CC, the results showed different trends in the three proposed graphs (Table 4). The NL was reduced the most in S2, to 20,346 links (−14.4%), and the NN was reduced to 14,602 nodes (−10.4%); however, the reduction in global connectivity metrics was the lowest (PC: −3.1%; F: −8.4%). The greatest loss in connectivity occurred when the metric IF was used in S1 where PC dropped from 2.4116 × 10⁻² to 1.4931 × 10⁻² (−38.1%), and F decreased from 2.0949 × 10¹³ to 1.6635 × 10¹³ (20.6%), although S3 showed a comparable result (37.3% and 11% loss, respectively). The NC increased from 289 to 401 in S2 (+38.8%); therefore, this graph was less connected through the elimination of cut-nodes. Conversely, S1 was less efficient, fragmenting the habitat into more components, resulting in a total of 335 components (+15.9%).

3.4. Best Control Graph for CC

The best graph to control the CC pest was selected from the values of PC and F. Since S1 had the lowest values in both metrics, we selected this graph for posterior analysis. Figure 6 shows the interpolated maps before (Figure 6a) and after (Figure 6b) the settlement of nests. The reddish area in Figure 6a represents highly connected areas which correspond mainly to the dehesa distribution. The implementation of 300 nests had a positive effect in the most connected area. The positive effects are more noticeable in Figure 7, where the areas with implemented nests showed a marked decline in connectivity, generally higher than 70%. Also of note is the general decrease by 20%–40% in most of the area as the result of predation in highly connected patches. The Wilcoxon rank-sum test confirmed the existence of statistically lesser connectivity in the landscape after applying the nests barrier effect (p < 0.0001).

4. Discussion

Our study shows the distribution, damage, and abundance of the Cerambyx complex beetles in South Spain. We showed that the frequency and dispersion of the beetles increased significantly during the years of the study, and it might keep increasing during the following years in potentially suitable areas, with destructive effects in dehesa woodlands. This is in concordance with Duque-Lazo and Navarro-Cerrillo [3] who reported in 2017 that there is still a large suitable area for the CC which has not been infested yet. Moreover, we pointed out the importance of other forest lands with less common tree hosts functioning as stepping stones to other dehesa woodlands which otherwise would be unreachable given the dispersal distances of the CC. To tackle this issue, we proposed the settlement of avifauna in highly connected areas. Our approach showed positive results in diminishing the connectivity of the landscape, and it could be an alternative or a complement to other methods, such as mass trapping using attractive compounds, for an integrated pest management [64,65,66].

4.1. Cerambyx “Complex” Damage and Mortality

In this study we only assessed Q. ilex and Q. suber because these are the two species that are commonly hosts for the CC, and most of the studies identify the three species of the CC as the main wood borers in the dehesas of Andalusia, especially C. welensii [67,68]. However, some other species with limited presence may be included in the SEDA Network as “Cerambyx spp.”. Some examples of other wood borers are Dorcus parallelipipedus L., Xylotrechus antilope (Schönherr, 1817), or Platycerus caraboides L. [67].
The assessment of the abundance and damage showed that only high abundances of CC caused high damages to Q. ilex (Figure 3). Conversely, lower abundances were mainly reported as not harmful in Andalusian Forest health network [9]. We found that Q. suber had a slightly higher mortality (13.1%) than Q. ilex (7.3%), but the infestation rates were higher in Q. ilex (22.1% vs. 15.9%).

4.2. Spatial-Temporal Pattern Change

The distribution of the CC was assessed by the KDE method using the infested plots and the abundance of CC in those plots, i.e., the infested trees (Figure 4). Duque-Lazo and Navarro-Cerrillo [3] described the evolution of the population density and similar patterns were found in our study. The north-eastern area increased significantly over time both in the density and extent of CC populations. The western area also showed an increasing pattern, but it was slower than the north-eastern one. The current and future impacts of climate change threaten forest ecosystems with a greater and greater intensity of pest frequency and outbreaks [69]. The future scenarios [3] predict an increasing habitat availability and probability of the occurrence of CC, raising the concern for the dehesa woodlands. Our KDE approach shows the potential dispersal rates of the CC beetles. The first small population in the northeast of Sierra Morena (Figure 4, 2002) showed a rapid dispersion, which in the last year of the study revealed a great presence and a large habitat area gained (Figure 4, 2016). The second population entering from the northwest showed a similar pattern in 2006, but with slower growth in area and density. One of the reasons could be the lower availability and continuity of CC habitat (Figure 1b). This underlines the sedentary behaviour of the CC, and the typically low dispersal distances rather than long distances [10]. This sedentary behaviour was reported in previous works for C. cerdo [10], C. welensii [70], myardi [71], and even in other Cerambycids such as Semanotus japonicus Lacordaire, 1869 [72] or Anoplophora glabripennis Motschulsky, 1853 [73].

4.3. Connectivity Analysis

Graph-theory based methods combined with GIS analysis form a powerful tool to analyse connectivity [23,51]. In this study, we found a significant association between forest connectivity and the current distribution of the CC. This supports the hypothesis that the connectivity of forest ecosystems affects the distribution of the CC. Our first model, where only dehesa was considered as habitat, showed a poor association with the current CC distribution, and led us to consider other forest uses as habitat patches considering the host species not included in dehesa woodlands (Pinus spp. and Eucalyptus spp.) as well as mixed forests. These results showed how other forest woodlands could work as stepping stone habitats to reach dehesa patches that otherwise would not be reachable. One reason supporting this is that the sedentary behaviour of the insects and the typically short flights (especially of females) restrict the colonization of further areas without first colonizing contiguous areas.
To reduce CC populations, other researchers studied the responses of C. welensii and P. myardi to different compounds of Q. ilex and Q. suber, but they pointed out the lack of integrated pest measures for the CC beetles [64,65,66]. However, alternative approaches using the natural predators of insect pests have been proposed [74], even for Cerambyx spp. [75]. In this line, to slow down or stop the dispersion of the pest our approach is connectivity reduction and reduction trapping methods in areas where the damage requires a more urgent treatment. We chose the Eurasian jay as a representative bird, as this species feeds in a wide range of habitats (different types of seeds and insects) and behaves as an opportunist, with a relative inclusion of caterpillars, beetles, hymenopterans, and orthopterans in the diet during the spring and summer [60]. Also, their diet relies strongly on Quercus acorns, contributing to their dispersion; therefore, Eurasian jays contribute doubly (e.g., regeneration and pest predation) to fight against oak decline with the renewal of the ecosystem. Landscape features such as native habitat cover, landscape heterogeneity, increased habitat availability, and high connectivity are positively affect avifauna for pest control [76].

4.4. Effectiveness of Local Metrics to Reduce Global Connectivity

The global metrics were computed to describe the whole graph. To quantify the potential dispersion from the patches, we used the F. It features the dispersal away from the natal patch [23,77]. The PC is based on the availability of habitat and dispersal probabilities between habitat patches and graph structures, and it quantifies functional connectivity [52]. PC is defined as the probability that two animals randomly placed within the landscape fall into habitat areas that are reachable from each other [25]. Its value ranges from 0 to 1, reaching unity when the landscape is completely covered by one habitat type. The NC is another global metric whose value represents the number of independent connected areas. Patches within a component are connected between them, but they have no functional relationship with other components [23].
The IF is the local contribution of each patch to the global connectivity, and it is obtained by the sum of the products of the focal patch capacity with all the other patches, weighted by their interaction probability [55]. The CCor analyses the relation with a node’s degree and the degree of its neighbours, indicating the compartmentalisation or presence of subnetworks, which may reduce the spread of a cascading disturbance [21,26]. The CF uses the electrical circuit theory, and it sums the currents passing through the patch i. The current represents the probability of the movement of a random walker through the links and patches [42].
Our proposal of introducing up to 300 nests based in local metrics highlighted the good performance of the IF metric. This index provides the local contribution of each patch to the overall connectivity, considering both the capacity (i.e., area of the patch) and how it contributes to the overall interactions in the network [78]. Other proposed metrics (CCor and CF) do not consider this information, and therefore, the results are worse for the aim of our study (Table 3). In view of the results, graph S1 performed satisfactorily to reduce the global connectivity (PC and F), although with less patch isolation due to a smaller increment in the NC, and the smaller reduction in NP and NL. On the other hand, graph S2 did not reduce the connectivity very efficiently but the increase in the fragmentation and isolation was the highest. Finally, the graph S3 showed an intermediate response to the metrics.
Thus, the IF selected nodes with high connectivity for the CC and high capacity for the Eurasian jay, whereas the CCor and CF were not proper metrics to select patches with high capacity for the Eurasian jay. To measure the connectivity reduction in the three proposed graphs we selected the PC and F global metrics. A higher reduction in PC indicates less habitat availability and less dispersal probabilities [52], whereas the reduction in F illustrates a decline in dispersal individuals in the landscape [51]. The global connectivity reduction was higher in S1, with a reduction of 38.09% in PC and 20.59% in F. Additionally, IF interpolations showed the local barrier effect of the nests (Figure 6 and Figure 7). A visual assessment of Figure 6 showed that the introduction of 300 nests would reduce the habitat availability and dispersal probabilities throughout the area of study. Finally, the difference in connectivity at the local level (Figure 7) showed the strong effect of the predation barrier in concordance with similar studies [76,79]. The connectivity for CC populations in the area of influence of the barrier effect (1 km radius) experimented enormous reductions, with a positive effect in significantly reducing the connectivity throughout the landscape. Additionally, the high positive effect in regulating the CC populations can lead to other positive side effects for dehesas and other oak formations. An example is seed dispersal through jays’ acorn dispersal and burial [80,81]. Another example is the predation of other important pests in dehesa such as Curculio elephas Gyl., or caterpillars from the Lepidoptera order such as Cydia fagiglandana Zeller [82].

4.5. Practical Applications

Climate change is a major concern for forest ecologists and managers because pest responses include the expansion of pest distribution, increase in insect abundance, invasive species, and changes in insect communities with negative impacts on forest ecosystems [5,6]. These negative impacts of climate change in dehesa ecosystems are well-documented [9], and to counteract these effects, managers should focus on effective measures. Many different forest management measures have been applied to forest pests depending on their biology (e.g., mass trapping, insecticides, mechanical control, etc.). However, knowing where to implement each specific control measure is of the utmost importance. Our study shows how the graph-based models should be in the toolkit of forest managers to control forest pests. We performed a spatial model that successfully reduces the dispersion of CC beetles through connectivity reduction in Sierra Morena. The spatial models of Duque-Lazo and Navarro-Cerrillo [3] showed that the potential distribution of the CC will increase in the future. Therefore, this approach together with other measures might be an effective integrated pest management option to keep CC populations at a harmless level. The lack of regeneration and overgrazing by livestock and wildlife [83] must be addressed by the managers as a prevention and control measure. An increasingly older dehesa creates the appropriate scenario for the dispersion of the CC and other pests. To control the population of C. welensii, effective trap methods (cross-vane, single-funnel, and multiple-funnel) have been developed and tried successfully [64]. The responses to the tree volatiles of C. welensii [65] and P. myardi [66] have been studied and recommended for use in a scenario of declining Q. ilex and Q. suber woodlands within an integrated pest management plan. In this framework, we proposed an innovative procedure to control CC populations utilizing a technique of biologic control through avifauna with other positive side effects (e.g., acorn dispersion). The integration of all of the available methods is crucial for far-reaching success in the conservation of the dehesas in Sierra Morena.

5. Conclusions

This study showed an increasingly important role for the CC in the dehesas of Sierra Morena. The use of spatial tools to characterize the distribution of the CC has been proven to be a good option in previous studies. In this work, we presented a combination of diverse spatial tools to contribute to the control of pests through connectivity metrics. The use of local connectivity metrics is used to characterize the most important patches to contribute to the dispersion of a pest, and therefore, to choose the patches where measures should be carried out to block or slow down the dispersion of the target pest. To analyse the performance of the models, we compared the value of global connectivity metrics (F, PC, and NC) before and after the application of measures on the landscape, more specifically, on the most connected patches. Thus, we predicted the response of introducing 300 nests in Sierra Morena with predators of the CC with promising results. A reduction in connectivity might be an effective tool to control pests, and, especially, to control emergent pests. This is because the control measures applied in the most connected patches might substantially reduce the dispersion capacity of the pest to the rest of the habitat. In this approach, we used a biological control method which not only contributes to decreasing the dispersion of the CC, but also contributes to the conservation of the dehesas. To preserve the dehesa woodlands, other essential measures should be integrated to counteract the oak decline: better silvicultural practices, overgrazing control, and mass trapping methods.

Supplementary Materials

The following supporting information can be downloaded at: https://www.mdpi.com/article/10.3390/f15040648/s1, Table S1: Summary of results of infestation and mortality rates in the study area (182 plots); Figure S1. Dehesa ecosystems and Cerambyx cerdo. Figure S2: Flight length and maximum flight length of Cerambyx welensii and C. cerdo against wind speed and temperatures (obtained from Torres-Vila et al. 2017a); Figure S3: Spatial representation of nests in each scenario. Dots in each map represents the spatial location of the most connected patches for each scenario.

Author Contributions

R.M.N.-C., A.C.-G. and C.A.R. conceived and designed the experiments. A.C.-G., C.A.R. and R.M.N.-C. performed the experiments. A.C.-G. and C.A.R. analysed the data. A.C.-G., R.M.N.-C. and C.A.R. wrote the manuscript; all the authors provided editorial advice. All authors have read and agreed to the published version of the manuscript.

Funding

The authors thank the Ministerio de Ciencia, Innovación y Universidades (Spain), for providing the necessary financial support for this study through the SilvAdapt RED2018 102719T projects.

Data Availability Statement

Data available upon request to the authors.

Acknowledgments

We would like to thank Angel Carrasco Gotarredona, José Manuel Ruiz Navarro, and Sixto Rodriguez as well as the SEDA Network team (Consejería de Agricultura, Pesca y Desarrollo Sostenible, Andalusia Govt.) for their assistance in field work and other contributions to this study. We also acknowledge the institutional support of the Campus de Excelencia CeIA3. We acknowledge support given by SILVADAPT.NET (RED2018-102719-T), EVIDENCE (2822/2021), and the Mediterranean Forest Global Change Observatory through the project “Scientific Infrastructures for Global Change Monitoring and Adaptation in Andalusia (INDALO)—LIFEWATCH-2019-04-AMA-01”, co-financed with FEDER funds corresponding to the Pluriregional Operational Programme of Spain 2014–2020.

Conflicts of Interest

The authors declare no conflicts of interest.

References

  1. Moreno, G.; Pulido, F.J. The Functioning, Management and Persistence of Dehesas. Agrofor. Eur. 2008, 6, 127–160. [Google Scholar] [CrossRef]
  2. Ramírez-Hernández, A.; Micó, E.; Marcos-García, M.d.l.Á.; Brustel, H.; Galante, E. The “Dehesa”, a Key Ecosystem in Maintaining the Diversity of Mediterranean Saproxylic Insects (Coleoptera and Diptera: Syrphidae). Biodivers. Conserv. 2014, 23, 2069–2086. [Google Scholar] [CrossRef]
  3. Duque-Lazo, J.; Navarro-Cerrillo, R.M. What to Save, the Host or the Pest? The Spatial Distribution of Xylophage Insects within the Mediterranean Oak Woodlands of Southwestern Spain. For. Ecol. Manag. 2017, 392, 90–104. [Google Scholar] [CrossRef]
  4. Hernández-Lambraño, R.E.; de la Cruz, D.R.; Sánchez-Agudo, J.Á. Spatial Oak Decline Models to Inform Conservation Planning in the Central-Western Iberian Peninsula. For. Ecol. Manag. 2019, 441, 115–126. [Google Scholar] [CrossRef]
  5. Pureswaran, D.S.; Roques, A.; Battisti, A. Forest Insects and Climate Change. Curr. For. Rep. 2018, 4, 35–50. [Google Scholar] [CrossRef]
  6. Logan, J.A.; Régnière, J.; Powell, J.A. Assessing the Impacts of Global Warming on Forest Pest Dynamics. Front. Ecol. Environ. 2003, 1, 130–137. [Google Scholar] [CrossRef]
  7. Torres-Vila, L.M.; Zugasti-Martínez, C.; Mendiola-Díaz, F.J.; De-Juan-Murillo, J.M.; Sánchez-González, Á.; Conejo-Rodríguez, Y.; Ponce-Escudero, F.; Fernández-Moreno, F. Larval Assemblages of Large Saproxylic Cerambycids in Iberian Oak Forests: Wood Quality and Host Preference Shape Resource Partitioning. Popul. Ecol. 2017, 59, 315–328. [Google Scholar] [CrossRef]
  8. Calle, C.V. Evaluación del Grado de Afectación por Larvas de “Cerambyx Welensii” Küster 1846 (Col., Cerambycidae) Del Arbolado de Las Dehesas (“Quercus Suber”, L. y “Q. Rotundifolia”, Lam.) En Extremadura y Su Relación Con Algunas Variables Importantes Del Ecosistema. Ph.D. Thesis, Universidad de Extremadura, Badajoz, Spain, 2013. [Google Scholar]
  9. Sánchez-Cuesta, R.; Ruiz-Gómez, F.J.; Duque-Lazo, J.; González-Moreno, P.; Navarro-Cerrillo, R.M. The Environmental Drivers Influencing Spatio-Temporal Dynamics of Oak Defoliation and Mortality in Dehesas of Southern Spain. For. Ecol. Manag. 2021, 485, 118946. [Google Scholar] [CrossRef]
  10. Torres-Vila, L.M.; Mendiola-Diaz, F.J.; Sánchez-González, Á. Dispersal Differences of a Pest and a Protected Cerambyx Species (Coleoptera: Cerambycidae) in Oak Open Woodlands: A Mark–Recapture Comparative Study. Ecol. Entomol. 2017, 42, 18–32. [Google Scholar] [CrossRef]
  11. McGarigal, K.; Marks, B.J. Spatial Pattern Analysis Program for Quantifying Landscape Structure; Department of Agriculture, Forest Service, Pacific NorthWest Research Station: Portland, OR, USA, 1995.
  12. Rivas, C.A.; Guerrero-Casado, J.; Navarro-Cerrillo, R.M. Deforestation and Fragmentation Trends of Seasonal Dry Tropical Forest in Ecuador: Impact on Conservation. For. Ecosyst. 2021, 8, 46. [Google Scholar] [CrossRef]
  13. Fahrig, L.; Arroyo-Rodríguez, V.; Bennett, J.R.; Boucher-Lalonde, V.; Cazetta, E.; Currie, D.J.; Eigenbrod, F.; Ford, A.T.; Harrison, S.P.; Jaeger, J.A.G.; et al. Is Habitat Fragmentation Bad for Biodiversity? Biol. Conserv. 2019, 230, 179–186. [Google Scholar] [CrossRef]
  14. Hermosilla, T.; Wulder, M.; White, J.C.; Bolton, D. Impact of Time on Interpretations of Forest Fragmentation: Three-Decades of Fragmentation Dynamics over Canada. Remote Sens. Environ. 2018, 222, 65–77. [Google Scholar] [CrossRef]
  15. Asbjornsen, H.; Ashton, M.S.; Vogt, D.J.; Palacios, S. Effects of Habitat Fragmentation on the Buffering Capacity of Edge Environments in a Seasonally Dry Tropical Oak Forest Ecosystem in Oaxaca, Mexico. Agric. Ecosyst. Environ. 2004, 103, 481–495. [Google Scholar] [CrossRef]
  16. Haddad, N.M.; Gonzalez, A.; Brudvig, L.A.; Burt, M.A.; Levey, D.J.; Department, E.I.D. Experimental Evidence Does Not Support the Habitat Amount Hypothesis. Ecography 2015, 40, 48–55. [Google Scholar] [CrossRef]
  17. Taylor, P.D.; Fahrig, L.; Henein, K.; Merriam, G. Connectivity Is a Vital Element of Landscape Structure. Oikos 1993, 68, 571–573. [Google Scholar] [CrossRef]
  18. Koh, I.; Rowe, H.I.; Holland, J.D. Graph and Circuit Theory Connectivity Models of Conservation Biological Control Agents. Ecol. Appl. 2013, 23, 1554–1573. [Google Scholar] [CrossRef]
  19. Hamilton, G.S.; Mather, P.B.; Wilson, J.C. Habitat Heterogeneity Influences Connectivity in a Spatially Structured Pest Population. J. Appl. Ecol. 2006, 43, 219–226. [Google Scholar] [CrossRef]
  20. Brown, J.H.; Kodric-Brown, A. Turnover Rates in Insular Biogeography: Effect of Immigration on Extinction. Ecology 1977, 58, 445–449. [Google Scholar] [CrossRef]
  21. Minor, E.S.; Urban, D.L. A Graph-Theory Framework for Evaluating Landscape Connectivity and Conservation Planning. Conserv. Biol. 2008, 22, 297–307. [Google Scholar] [CrossRef]
  22. Pascual-Hortal, L.; Saura, S. Comparison and Development of New Graph-Based Landscape Connectivity Indices: Towards the Priorization of Habitat Patches and Corridors for Conservation. Landsc. Ecol. 2006, 21, 959–967. [Google Scholar] [CrossRef]
  23. Urban, D.; Keitt, T. Landscape Connectivity: A Graph-Theoretic Perspective. Ecology 2001, 82, 1205–1218. [Google Scholar] [CrossRef]
  24. Calabrese, J.M.; Fagan, W.F. A Comparison-Shopper ’ s Guide to Connectivity Metrics. Front. Ecol. Environ. 2004, 2, 529–536. [Google Scholar] [CrossRef]
  25. Bodin, Ö.; Saura, S. Ranking Individual Habitat Patches as Connectivity Providers: Integrating Network Analysis and Patch Removal Experiments. Ecol. Modell. 2010, 221, 2393–2405. [Google Scholar] [CrossRef]
  26. Rayfield, B.; Fortin, M.J.; Fall, A. Connectivity for Conservation: A Framework to Classify Network Measures. Ecology 2011, 92, 847–858. [Google Scholar] [CrossRef]
  27. Ceia, R.S.; Ramos, J.A. Birds as predators of cork and holm oak pests. Agrofor. Syst. 2016, 90, 159–176. [Google Scholar] [CrossRef]
  28. Kenis, M.; Hilszczanski, J. Natural enemies of Cerambycidae and Buprestidae infesting living trees. In Bark and Wood Boring Insects in Living Trees in Europe, a Synthesis; Lieutier, F., Day, K.R., Battisti, A., Grégoire, J.C., Evans, H.F., Eds.; Springer: Dordrecht, The Netherlands, 2004; pp. 475–498. [Google Scholar]
  29. Sanz, J.J. Experimentally increased insectivorous bird density results in a reduction of caterpillar density and leaf damage to Pyrenean oak. Ecol. Res. 2001, 16, 387–394. [Google Scholar] [CrossRef]
  30. East, M.L.; Perrins, C.M. The effect of nestboxes on breeding populations of birds in broadleaved temperate woodlands. Ibis 1988, 130, 393–401. [Google Scholar] [CrossRef]
  31. Gurrutxaga, M.; Lozano, P.J. Efectos de La Fragmentación de Hábitats y Pérdida de Conectividad Ecológica Dentro de La Dinámica Territorial. Rev. Geogr. 2006, 16, 35–54. [Google Scholar]
  32. Bereczki, K.; Ódor, P.; Csóka, G.; Mag, Z.; Báldi, A. Effects of forest heterogeneity on the efficiency of caterpillar control service provided by birds in temperate oak forests. For. Ecol. Manag. 2014, 327, 96–105. [Google Scholar] [CrossRef]
  33. Gómez-Zotano, J.; Alcántara-Manzanares, J.; Olmedo-Cobo, J.A.; Martínez-Ibarra, E. La Sistematización Del Clima Mediterráneo: Identificación, Clasificación y Caracterización Climática de Andalucía (España). Rev. Geogr. Norte Gd. 2015, 61, 161–180. [Google Scholar] [CrossRef]
  34. Junta de Andalucía. Sistema de Información de Ocupación Del Suelo de España En Andalucía; Junta de Andalucía: Sevilla, Spain, 2018. [Google Scholar]
  35. Duque-Lazo, J.; Navarro-Cerrillo, R.M.; Ruíz-Gómez, F.J. Assessment of the Future Stability of Cork Oak (Quercus Suber L.) Afforestation under Climate Change Scenarios in Southwest Spain. For. Ecol. Manag. 2018, 409, 444–456. [Google Scholar] [CrossRef]
  36. Junta de Andalucía. Manual Para El Establecimiento y La Evaluación de Las Parcelas de RED SEDA y La RED DE PINSAPO, Consejería de Medio Ambiente y Ordenación del Territorio, 2014.
  37. Tiberi, R.; Branco, M.; Bracalini, M.; Croci, F.; Panzavolta, T. Cork oak pests: A review of insect damage and management. Ann. For. Sci. 2016, 73, 219–232. [Google Scholar] [CrossRef]
  38. International Co-operative Programme on Assessment, & Monitoring of Air Pollution Effects on Forests. Manual on Methods and Criteria for Harmonized Sampling, Assessment, Monitoring and Analysis of the Effects of Air Pollution on Forests; Federal Research Centre for Forestry and Forest Products, 1988. [Google Scholar]
  39. R Core Team. R: A Language and Environment for Statistical Computing; R Core Team: Vienna, Austria, 2022. [Google Scholar]
  40. Wickham, H.; François, R.; Henry, L.; Müller, K. Dplyr: A Grammar of Data Manipulation, R Package Version 1.0.10. 2022. Available online: https://cran.r-project.org/src/contrib/Archive/dplyr/dplyr_1.0.10.tar.gz (accessed on 29 February 2024).
  41. Nenadic, O.; Greenacre, M. Correspondence Analysis in R, with Two- and Three-Dimensional Graphics: The ca Package. J. Stat. Softw. 2007, 20, 1–13. [Google Scholar]
  42. Silverman, B.W. Density Estimation for Statistics and Data Analysis; Routledge: New York, NY, USA, 1986. [Google Scholar]
  43. Baddeley, A.; Rubak, E.; Turner, R. Spatial Point Patterns: Methodology and Applications with R; Chapman and Hall/CRC Press: London, UK, 2015. [Google Scholar]
  44. Hijmans, R.J. Terra: Spatial Data Analysis, R Package Version 1.7-3. 2023. Available online: https://www.rdocumentation.org/packages/terra/versions/1.7-3 (accessed on 29 February 2024).
  45. Hernangómez, D. Tidyterra: Tidyverse Methods and Ggplot2 Helpers for Terra Objects, Version 0.3.1. 2023. Available online: https://dieghernan.github.io/tidyterra/news/index.html (accessed on 29 February 2024).
  46. Pohlert, T. PMCMRplus: Calculate Pairwise Multiple Comparisons of Mean Rank Sums Extended, R Package Version 1.9.6. 2022. Available online: https://CRAN.R-project.org/package=PMCMRplus (accessed on 30 August 2023).
  47. Foltête, J.C.; Vuidel, G.; Savary, P.; Clauzel, C.; Sahraoui, Y.; Girardet, X.; Bourgeois, M. Graphab: An Application for Modeling and Managing Ecological Habitat Networks. Softw. Impacts 2021, 8, 100065. [Google Scholar] [CrossRef]
  48. Foltête, J.C.; Clauzel, C.; Vuidel, G. A Software Tool Dedicated to the Modelling of Landscape Networks. Environ. Model. Softw. 2012, 38, 316–327. [Google Scholar] [CrossRef]
  49. Foltête, J.C.; Clauzel, C.; Vuidel, G.; Tournant, P. Integrating Graph-Based Connectivity Metrics into Species Distribution Models. Landsc. Ecol. 2012, 27, 557–569. [Google Scholar] [CrossRef]
  50. Clauzel, C.; Foltête, J.-C.; Girardet, X.; Vuidel, G. User Manual Graphab 2.6. 2020. Available online: https://sourcesup.renater.fr/www/graphab/download/manual-2.6-en.pdf (accessed on 29 February 2024).
  51. Minor, E.S.; Urban, D.L. Graph Theory as a Proxy for Spatially Explicit Population Models in Conservation Planning. Ecol. Appl. 2007, 17, 1771–1782. [Google Scholar] [CrossRef]
  52. Saura, S.; Pascual-Hortal, L. A New Habitat Availability Index to Integrate Connectivity in Landscape Conservation Planning: Comparison with Existing Indices and Application to a Case Study. Landsc. Urban Plan. 2007, 83, 91–103. [Google Scholar] [CrossRef]
  53. Girardet, X.; Conruyt-Rogeon, G.; Foltête, J.C. Does Regional Landscape Connectivity Influence the Location of Roe Deer Roadkill Hotspots? Eur. J. Wildl. Res. 2015, 61, 731–742. [Google Scholar] [CrossRef]
  54. McRae, B.H.; Dickson, B.G.; Keitt, T.H.; Shah, V.B. Using Circuit Theory to Model Connectivity in Ecology, Evolution, and Conservation. Ecology 2008, 89, 2712–2724. [Google Scholar] [CrossRef]
  55. Foltête, J.C.; Girardet, X.; Clauzel, C. A Methodological Framework for the Use of Landscape Graphs in Land-Use Planning. Landsc. Urban Plan. 2014, 124, 140–150. [Google Scholar] [CrossRef]
  56. Sahraoui, Y.; Foltête, J.C.; Clauzel, C. A Multi-Species Approach for a Assessing the Impact of Land-Cover Changes on Landscape Connectivity. Landsc. Ecol. 2017, 32, 1819–1835. [Google Scholar] [CrossRef]
  57. Keeley, A.T.; Beier, P.; Jenness, J.S. Connectivity Metrics for Conservation Planning and Monitoring. Biol. Conserv. 2021, 255, 109008. [Google Scholar] [CrossRef]
  58. Tarabon, S.; Bergès, L.; Dutoit, T.; Isselin-Nondebeu, F. Environmental Impact Assessment of Development Projects Improved by Merging Species Distribution and Habitat Connectivity Modelling. J. Environ. Manag. 2019, 241, 439–449. [Google Scholar] [CrossRef] [PubMed]
  59. Mimet, A.; Clauzel, C.; Foltête, J.C. Locating Wildlife Crossings for Multispecies Connectivity across Linear Infrastructures. Landsc. Ecol. 2016, 31, 1955–1973. [Google Scholar] [CrossRef]
  60. Alonso, C.L. Arrendajo—Garrulus Glandarius (Linnaeus, 1758). In Enciclopedia Virtual de los Vertebrados Españoles; Salvador, A., Morales, M.B., Eds.; Museo Nacional de Ciencias Naturales: Madrid, Spain, 2016; Available online: http://www.vertebradosibericos.org/ (accessed on 15 January 2022).
  61. Han, Q.; Keeffe, G. Mapping the Flow of Forest Migration through the City under Climate Change. Urban Plan. 2019, 4, 139–151. [Google Scholar] [CrossRef]
  62. Han, Q.; Keeffe, G. Stepping Stones: Assessing the Permeability of Urban Greenspaces to Climate-Driven Migration of Trees. Smart Sustain. Built Environ. 2020, 9, 246–257. [Google Scholar] [CrossRef]
  63. Sekercioglu, C.H. Forest Fragmentation Hits Insectivorous Birds Hard. Dir. Sci. 2002, 1, 62–64. [Google Scholar] [CrossRef]
  64. Sánchez-Osorio, I.; López-Pantoja, G.; Paramio, A.M.; Lencina, J.L.; Gallego, D.; Domínguez, L. Field Attraction of Cerambyx Welensii to Fermentation Odors and Host Monoterpenes. J. Pest Sci. 2016, 89, 59–68. [Google Scholar] [CrossRef]
  65. Sánchez-Osorio, I.; Tapias, R.; Domínguez, L.; López-Pantoja, G.; González, M.D.M. Electroantennographic Responses of Cerambyx Welensii Küster to Host-Related Volatiles. Forests 2021, 12, 1168. [Google Scholar] [CrossRef]
  66. Sánchez-Osorio, I.; Domínguez, L.; López-Pantoja, G.; Tapias, R. Antennal Response of Prinobius Myardi to Synthetic Tree Volatiles. Silva Fenn. 2015, 49, 1–8. [Google Scholar] [CrossRef]
  67. López-Pantoja, G.; Sánchez-Osorio, I.; Dominguez, L. Cerambícidos Xilófagos de Encinas y Alcornoques: Estudio Bioecológico y Control de Poblaciones. CIDEU 2006, 39–44. [Google Scholar]
  68. Domínguez, L.; López-Pantoja, G.; Cremades, D.; Paramio, A.; Hidalgo, P.J.; Sánchez-Osorio, I. Incidence of Large Wood Borers in the Conservation of Dehesa Islands Forests in Southwestern Spain. Forests 2022, 13, 413. [Google Scholar] [CrossRef]
  69. Tubé, A.; Jana, U.; de Toni, A.; Woodward, S.; Schopf, A.; Netherer, S.; Angelstam, P.; Mudgal, S.; Sonigo, P. Disturbances of EU Forests Caused by Biotic Agents; European Commision: 2012. Available online: https://www.researchgate.net/publication/363892531_Disturbances_of_EU_forests_caused_by_biotic_agents (accessed on 29 February 2024).
  70. López-Pantoja, G.; Nevado, L.D.; Sánchez-Osorio, I. Mark-Recapture Estimates of the Survival and Recapture Rates of Cerambyx Welensii Küster (Coleoptera Cerambycidae) in a Cork Oak Dehesa in Huelva (Spain). Cent. Eur. J. Biol. 2008, 3, 431–441. [Google Scholar] [CrossRef]
  71. López-Pantoja, G.; Dominguez, L.; Sánchez-Osorio, I. Analysis of Prinobius Myardi Mulsant Population Dynamics in a Mediterranean Cork Oak Stand. Ann. Société Entomol. Fr. 2011, 47, 260–268. [Google Scholar] [CrossRef]
  72. Shibata, E. Adult Populations of the Sugi Bark Borer, Semanotus Japonicus Lacordaire (Coleoptera: Cerambycidae), in Japanese Cedar Stands: Population Parameters, Dispersal, and Spatial Distribution. Res. Popul. Ecol. 1986, 28, 253–266. [Google Scholar] [CrossRef]
  73. Williams, D.; Li, G.; Gao, R. Tracking Movements of Individual Anoplophora Glabripennis (Coleoptera: Cerambycidae) Adults: Application of Harmonic Radar. Environ. Entomol. 2004, 33, 644–649. [Google Scholar] [CrossRef]
  74. Kenis, M.; Hurley, B.P.; Colombari, F.; Lawson, S.; Sun, J.; Wilcken, C.; Weeks, C.; Sathyapala, S. Guide to the Classical Biological Control of Insect Pests in Planted and Natural Forests; Bulletin: FAO Forestry Paper; No.182; FAO: Rome, Italy, 2019. [Google Scholar]
  75. Iwona, M.; Marek, P.; Katarzyna, W.; Edward, B.; Julia, S. Use of a Genetically Informed Population Viability Analysis to Evaluate Management Options Por Polish Populations of Endangered Beetle Cerambyx Cerdo L.(1758)(Coleoptera, Cerambycidae). J. Insect Conserv. 2018, 22, 69–83. [Google Scholar] [CrossRef]
  76. Boesing, A.L.; Nichols, E.; Metzger, J.P. Effects of Landscape Structure on Avian-Mediated Insect Pest Control Services: A Review. Landsc. Ecol. 2017, 32, 931–944. [Google Scholar] [CrossRef]
  77. Saura, S.; Lidón, R. A Common Currency for the Different Ways in Which Patches and Links Can Contribute to Habitat Availability and Connectivity in the Landscape. Ecography 2010, 33, 523–537. [Google Scholar] [CrossRef]
  78. Préau, C.; Grandjean, F.; Sellier, Y.; Gailledrat, M.; Bertrand, R.; Isselin-Nondedeu, F. Habitat Patches for Newts in the Face of Climate Change: Local Scale Assessment Combining Niche Modelling and Graph Theory. Sci. Rep. 2020, 10, 3570. [Google Scholar] [CrossRef]
  79. Railsback, S.F.; Johnson, M.D. Effects of Land Use on Bird Populations and Pest Control Services on Coffee Farms. Proc. Natl. Acad. Sci. USA 2014, 111, 6109–6114. [Google Scholar] [CrossRef]
  80. Morán-López, T.; Alonso, C.L.; Díaz, M. Landscape Effects on Jay Foraging Behavior Decrease Acorn Dispersal Services in Dehesas. Acta Oecol. 2015, 69, 52–64. [Google Scholar] [CrossRef]
  81. Kurek, P.; Dobrowolska, D.; Wiatrowska, B. Dispersal Distance and Burial Mode of Acorns in Eurasian Jays Garrulus Glandarius in European Temperate Forests. Acta Ornithol. 2019, 53, 155–162. [Google Scholar] [CrossRef]
  82. Canelo, T.; Gaytán, Á.; Pérez-Izquierdo, C.; Bonal, R. Effects of Longer Droughts on Holm Oak Quercus Ilex l. Acorn Pests: Consequences for Infestation Rates, Seed Biomass and Embryo Survival. Diversity 2021, 13, 110. [Google Scholar] [CrossRef]
  83. López-Sánchez, A.; Perea, R.; Dirzo, R.; Roig, S. Livestock vs. Wild Ungulate Management in the Conservation of Mediterranean Dehesas: Implications for Oak Regeneration. For. Ecol. Manag. 2016, 362, 99–106. [Google Scholar] [CrossRef]
Figure 1. Location of the study area in the southern Spain, and the land use classification. (a) Location of Andalusia within Spain, and representation of the study area inside Andalusia. (b) Land use classification of the study area with presence (red dots) and absence (green dots) of data on the “Cerambyx complex”.
Forests 15 00648 g001
Figure 2. Schematic diagram of the workflow and methods used in this study.
Forests 15 00648 g002
Figure 3. Comparison of CC abundance (x) versus damage (y) per host tree species. Unquantifiable represents trees when the damage of the CC was detected, but their abundance was impossible to assess.
Forests 15 00648 g003
Figure 4. Biennial kernel density estimation. Estimation of the evolution of infested trees from 2002 to 2016. Reddish colours indicate higher infestation rates.
Forests 15 00648 g004
Figure 5. Representation of the initial graph. The colour intensity and size represent nodes with higher local connectivity measured by IF. Edges were supressed from the main map to better understand the other features. (a) Segment of the landscape with connected patches. (b) Representation of isolated components. Patches in a component are not reachable from another component. (c) A highly connected patch (bigger red dot) with large area and connected to many other patches.
Forests 15 00648 g005
Figure 6. Landscape connectivity before (a) and after (b) implementing nests resulting from interpolation of IF metric. (a) The current local connectivity. (b) The local connectivity value after applying the nests barrier effect. The circles around the nests indicate the predation area of the Eurasian jay in 1 km radius.
Forests 15 00648 g006
Figure 7. Difference in local connectivity before and after implementation of nests from S1 (in percentage). This is the result of the difference between the interpolation in Figure 6a,b after normalization of the values.
Forests 15 00648 g007
Table 1. Land cover definition, area, and cost of movement proposed.
Land UseDefinitionArea (ha)%Area TotalCostType
CC habitatForest formations with at least 5% of Quercus ilex or Quercus suber982,81546.371Habitat
Other dehesasSavana-like ecosystem characterized by the presence of scattered trees (Q. ilex and Q. suber not included here)90,1504.2510Suitable
Other forestOther forest structures including deciduous, coniferous, and mixed forests284,87313.4410Suitable
AfforestationAnthropically established forest by plantation in previous agricultural lands36690.17100Neutral
ShrublandForestry land formed by bushes and shrubs in absence of trees131,3456.20100Neutral
PasturesIncludes all herbaceous grazing formations110,9925.24100Neutral
AgricultureLand under cultivation for aliments production (citrus plants, herbaceous crops, vineyards, etc.)359,12916.94100Neutral
Other useIncludes urban uses, water bodies, bare soil, roads, and other anthropogenic uses156,2647.371000Unfavourable
Table 2. Description of connectivity metrics used in this work, along with their computing level, description, formula, and ecological significance [50].
Connectivity MetricComputing LevelDescriptionFormulaEcological Significance
Flux (F) [23,51]GlobalGlobal: sum of potential dispersions from all patches S # F = i = 1 n j = 1 n a j β e d i j
j i
A high flux between patches indicates a large number of dispersing individuals
Number of Components (NC) [23]GlobalNumber of components in the graph N C = n c Comparing the number of components in different situations
Probability of Connectivity (PC) [52]GlobalSum of products of capacity of all pairs of patches weighted by their interaction probability, divided by the square of the area of the study zone P C = 1 A 2 i = 1 n j = 1 n a i a j e a d i j Indicates the probability that two animals randomly placed within the landscape fall into habitat areas that are reachable from each other (interconnected) given a set of N habitat patches and the weighted connections among them
Connectivity Correlation (Ccor) [21]LocalRatio between the degree of the node i and the degree of its neighbouring patches j C C o r i = | N i | 2 j N i | N j | Indicates compartmentalization or presence of sub-networks which may reduce the spread of the potentially cascading effects of a disturbance
Current Flow (CF) [53,54]LocalSum of currents passing through the focal patch C F i = j n c i j Indicates patches with higher probability of movement for a random walker
Interaction Flux (IF) [55,56]LocalSum of products of the focal patch capacity with all the other patches, weighted by their interaction probability I F i = j = i n a i β a j β p i j Indicates the potential accessibility of any habitat point (i.e., pixel) to the overall network
Where: N: number of patches. nc: Number of components. nk: Number of patches in the component k. Ni: All parches close to the patch i. ai: Capacity of the patch i (generally the surface area). ack: Capacity of the component k (sum of the capacity of the patches comprising k). A: Area of the study zone dij: Distance between the patches i and j (generally the least-cost distance between them). e –αdij: Probability of movement between the patches i and j. α= Brake on movement distance. β= Exponent to weight more or less capacity.
Table 3. Basic statistics of the patches for the nests in three graphs. All the statistics are calculated only for the patches where nests are placed.
S1S2S3
Local metricIFCcorCF
Min patch size25.903.963.96
Max patch size375,115375,115375,115
Mean patch size3034.402949.502977
Median patch size119.4084.649.10
Std. Dev29,228.6229,231.7029,234
Table 4. Characteristics of all the habitat patches in the different graphs. Highlighted in bold are the highest decreases in connectivity indexes.
Graph CharacteristicCurrentVariation
S1S2S3
NL23,76722,635
(−4.8%)
20,346
(−14.4%)
22,420
(−5.7%)
NN16,30015,924
(−2.3%)
14,602
(−10.4%)
15,734
(−3.5%)
NC289335
(+15.9%)
401
(+38.7%)
383
(+35.5%)
Largest Patch Index17.7016.93
(−4.3%)
17.58
(−0.7%)
17.63
(−0.4%)
Total habitat area (km2)10,156.209410.08
(−7.3%)
9614.61
(−5.3%)
9611.51
(−5.4%)
PC2.4116 × 10−21.4931 × 10⁻²
(−38.1%)
2.3375 × 10⁻²
(−3.1%)
1.5124 × 10⁻²
(−37.3%)
F2.0949 × 10131.6635 × 1013
(−20.6%)
1.9179 × 10¹³
(−8.4%)
1.8643 × 10¹³
(−11%)
Disclaimer/Publisher’s Note: The statements, opinions and data contained in all publications are solely those of the individual author(s) and contributor(s) and not of MDPI and/or the editor(s). MDPI and/or the editor(s) disclaim responsibility for any injury to people or property resulting from any ideas, methods, instructions or products referred to in the content.

