Article

Detection of Pine-Wilt-Disease-Affected Trees Based on Improved YOLO v7

1
College of Forestry, Beijing Forestry University, Beijing 100083, China
2
Beijing Key Laboratory of Precision Forestry, Beijing Forestry University, Beijing 100083, China
3
Beijing Ocean Forestry Technology Co., Ltd., Beijing 100083, China
*
Author to whom correspondence should be addressed.
Forests 2024, 15(4), 691; https://doi.org/10.3390/f15040691
Submission received: 6 February 2024 / Revised: 4 April 2024 / Accepted: 10 April 2024 / Published: 11 April 2024
(This article belongs to the Special Issue Computer Application and Deep Learning in Forestry)

Abstract

:
Pine wilt disease (PWD) poses a significant threat to global pine resources because of its rapid spread and management challenges. This study uses high-resolution helicopter imagery and the deep learning model You Only Look Once version 7 (YOLO v7) to detect symptomatic trees in forests. Attention mechanism technology from artificial intelligence is integrated into the model to enhance accuracy. Comparative analysis indicates that the YOLO v7-SE model exhibited the best performance, with a precision rate of 0.9281, a recall rate of 0.8958, and an F1 score of 0.9117. This study demonstrates efficient and precise automatic detection of symptomatic trees in forest areas, providing reliable support for prevention and control efforts, and emphasizes the importance of attention mechanisms in improving detection performance.

1. Introduction

The pine wood nematode (Bursaphelenchus xylophilus (SteineretBuhrer), PWN) was first described in East Asia in the early 20th century and has since been identified as the causal agent of pine wilt disease (PWD), a major threat to pine forests. The primary targets of PWN are pine trees, and its devastating impact on pine forest resources poses a serious threat to global forest resources and ecological security [1]. Once PWD occurs, the epidemic can rapidly spread within a short period if prompt and effective prevention and control measures are not implemented [2]. Therefore, in the early stages of the epidemic, comprehensive cleanup of symptomatic trees is the focus of PWN management. Deep learning techniques, which use deep neural networks to learn complex data patterns and features by mimicking the way the human brain processes information, can potentially hasten the identification of potential epidemic foci of PWD.
Both manual trekking and satellite remote sensing face limitations in detecting trees affected by PWD [3]. Manual trekking is costly, time-consuming, inefficient, and presents challenges for large-area detection. Meanwhile, satellite remote sensing is largely affected by factors such as resolution, revisit cycle, and weather conditions. Aerial remote sensing images offer advantages, including real-time capability, flexibility, wide coverage, low cost, and high spatial resolution, rendering them suitable for conducting PWD epidemic censuses. Unmanned Aerial Vehicles (UAVs) can quickly capture images of target areas; as such, they are ideal for rapid forest surveys. Compared with data images collected using multispectral and radar sensors, data images captured via optical RGB (Red, Green, Blue) cameras are easier to process and analyze. In addition, the latter can be mounted on UAVs for large-scale image collection.
Initial stages of remote sensing image recognition have relied on traditional machine learning algorithms to extract artificial design features from images and training models. The Random Forest classifier has been used to detect and classify symptomatic trees, achieving an accuracy higher than 0.91 on both high spatial resolution multispectral and hyperspectral images [4]. Integrating a multiscale segmentation algorithm with an object-oriented approach has optimized the feature space of segmentation results, enabling accurate and rapid identification and classification of symptomatic trees [5]. Support vector machine (SVM) classifiers have exhibited overall accuracies of 94.13% and 86.59% in two areas of study in PWD detection, with an average overall accuracy of 90.36% [6]. Threshold segmentation can reduce the adverse effects of interference factors such as buildings, rocks, and soil on density estimation, resulting in enhanced density maps for counting symptomatic trees [7]. Artificial Neural Network (ANN) models have also improved the detection of symptomatic trees [8,9]. However, using traditional machine learning algorithms entails difficulties in extracting high-level semantic features, such as high time complexity, dependence on artificial design features, and lack of robustness.
The emergence of deep learning has effectively addressed various concerns, including computational duplication and inefficiency, as well as the constraint of solely focusing on low-level features, which are commonly encountered in traditional machine learning. Deep learning, exhibiting high-precision recognition capabilities, has been widely applied in monitoring symptomatic trees [10].
The Multiscale Spatial-Supervised Convolutional Network (MSSCN) is used to identify complex scenes based on aerial images in a wide range, maintaining high accuracy [11]. After data enhancement, multispectral aerial images are used for target detection in training and testing based on a multichannel Convolutional Neural Network (CNN), with mean average precision (mAP) reaching 86.63% [12]. The Spatial–Context–Attention Network (SCANet) introduces a spatial information retention module to reduce the loss of spatial information, retain the shallow features of PWD, expand and enhance the receptive field, and extract deep features through the context information module. Accuracy and recall rates are approximately 0.86 and 0.91, respectively [13]. In a study comparing the detection effects of different semantic segmentation models on symptomatic trees, DeepLab V3+ (ResNet50) exhibited the highest f1 score (0.742) and the highest recall rate (0.727). With the acquisition of future learning data, the detection accuracy is expected to improve [14]. The target detection model is widely used in the detection of symptomatic trees. The same model can achieve various detection results by using different backbone networks. In Faster Region Convolutional Neural Networks (Faster R-CNNs), the performance of ResNet101 as the backbone network exceeds that of VGG16 [15]. Among target detection models, the YOLO series target detection models exhibit superior efficiency in the detection of symptomatic trees [16].
The attention mechanism is an algorithm designed to simulate the allocation of human attention. This mechanism enables the model to automatically prioritize and focus on essential components of the input data [17]. It has been widely used in several research areas since its introduction in 2017 by Vaswani et al. in the transformer model [18]. The attention mechanism is also commonly used in tasks such as target detection and image classification to enhance the interpretation and accuracy of the model [19]. In a study on the detection of symptomatic trees, the incorporation of the coordinate attention mechanism and the convolutional block attention module in the YOLO v5s model improved its detection. A precision of 98.1% and a recall rate of 97.3% were achieved [20]. Ge et al. added attention mechanism to the backbone feature extraction network of YOLO v3, and added bottom-up feature pyramid structure on the basis of the original feature pyramid, which improved the detection accuracy of the original model [21]. The evaluation index increased, and the detection efficiency was enhanced.
In the current study, high-resolution images acquired via helicopter served as the dataset, and the YOLO v7 model in deep learning [22] was used to detect symptomatic trees in the target forest area. Attention mechanisms were incorporated to improve detection accuracy and a comparative analysis of the effect of different attention mechanisms on detection accuracy was conducted. This study primarily aimed to efficiently detect trees affected by PWD and provide reliable support for the prevention and control of pine wilt epidemics in forest areas.

2. Materials and Methods

2.1. Data Collection

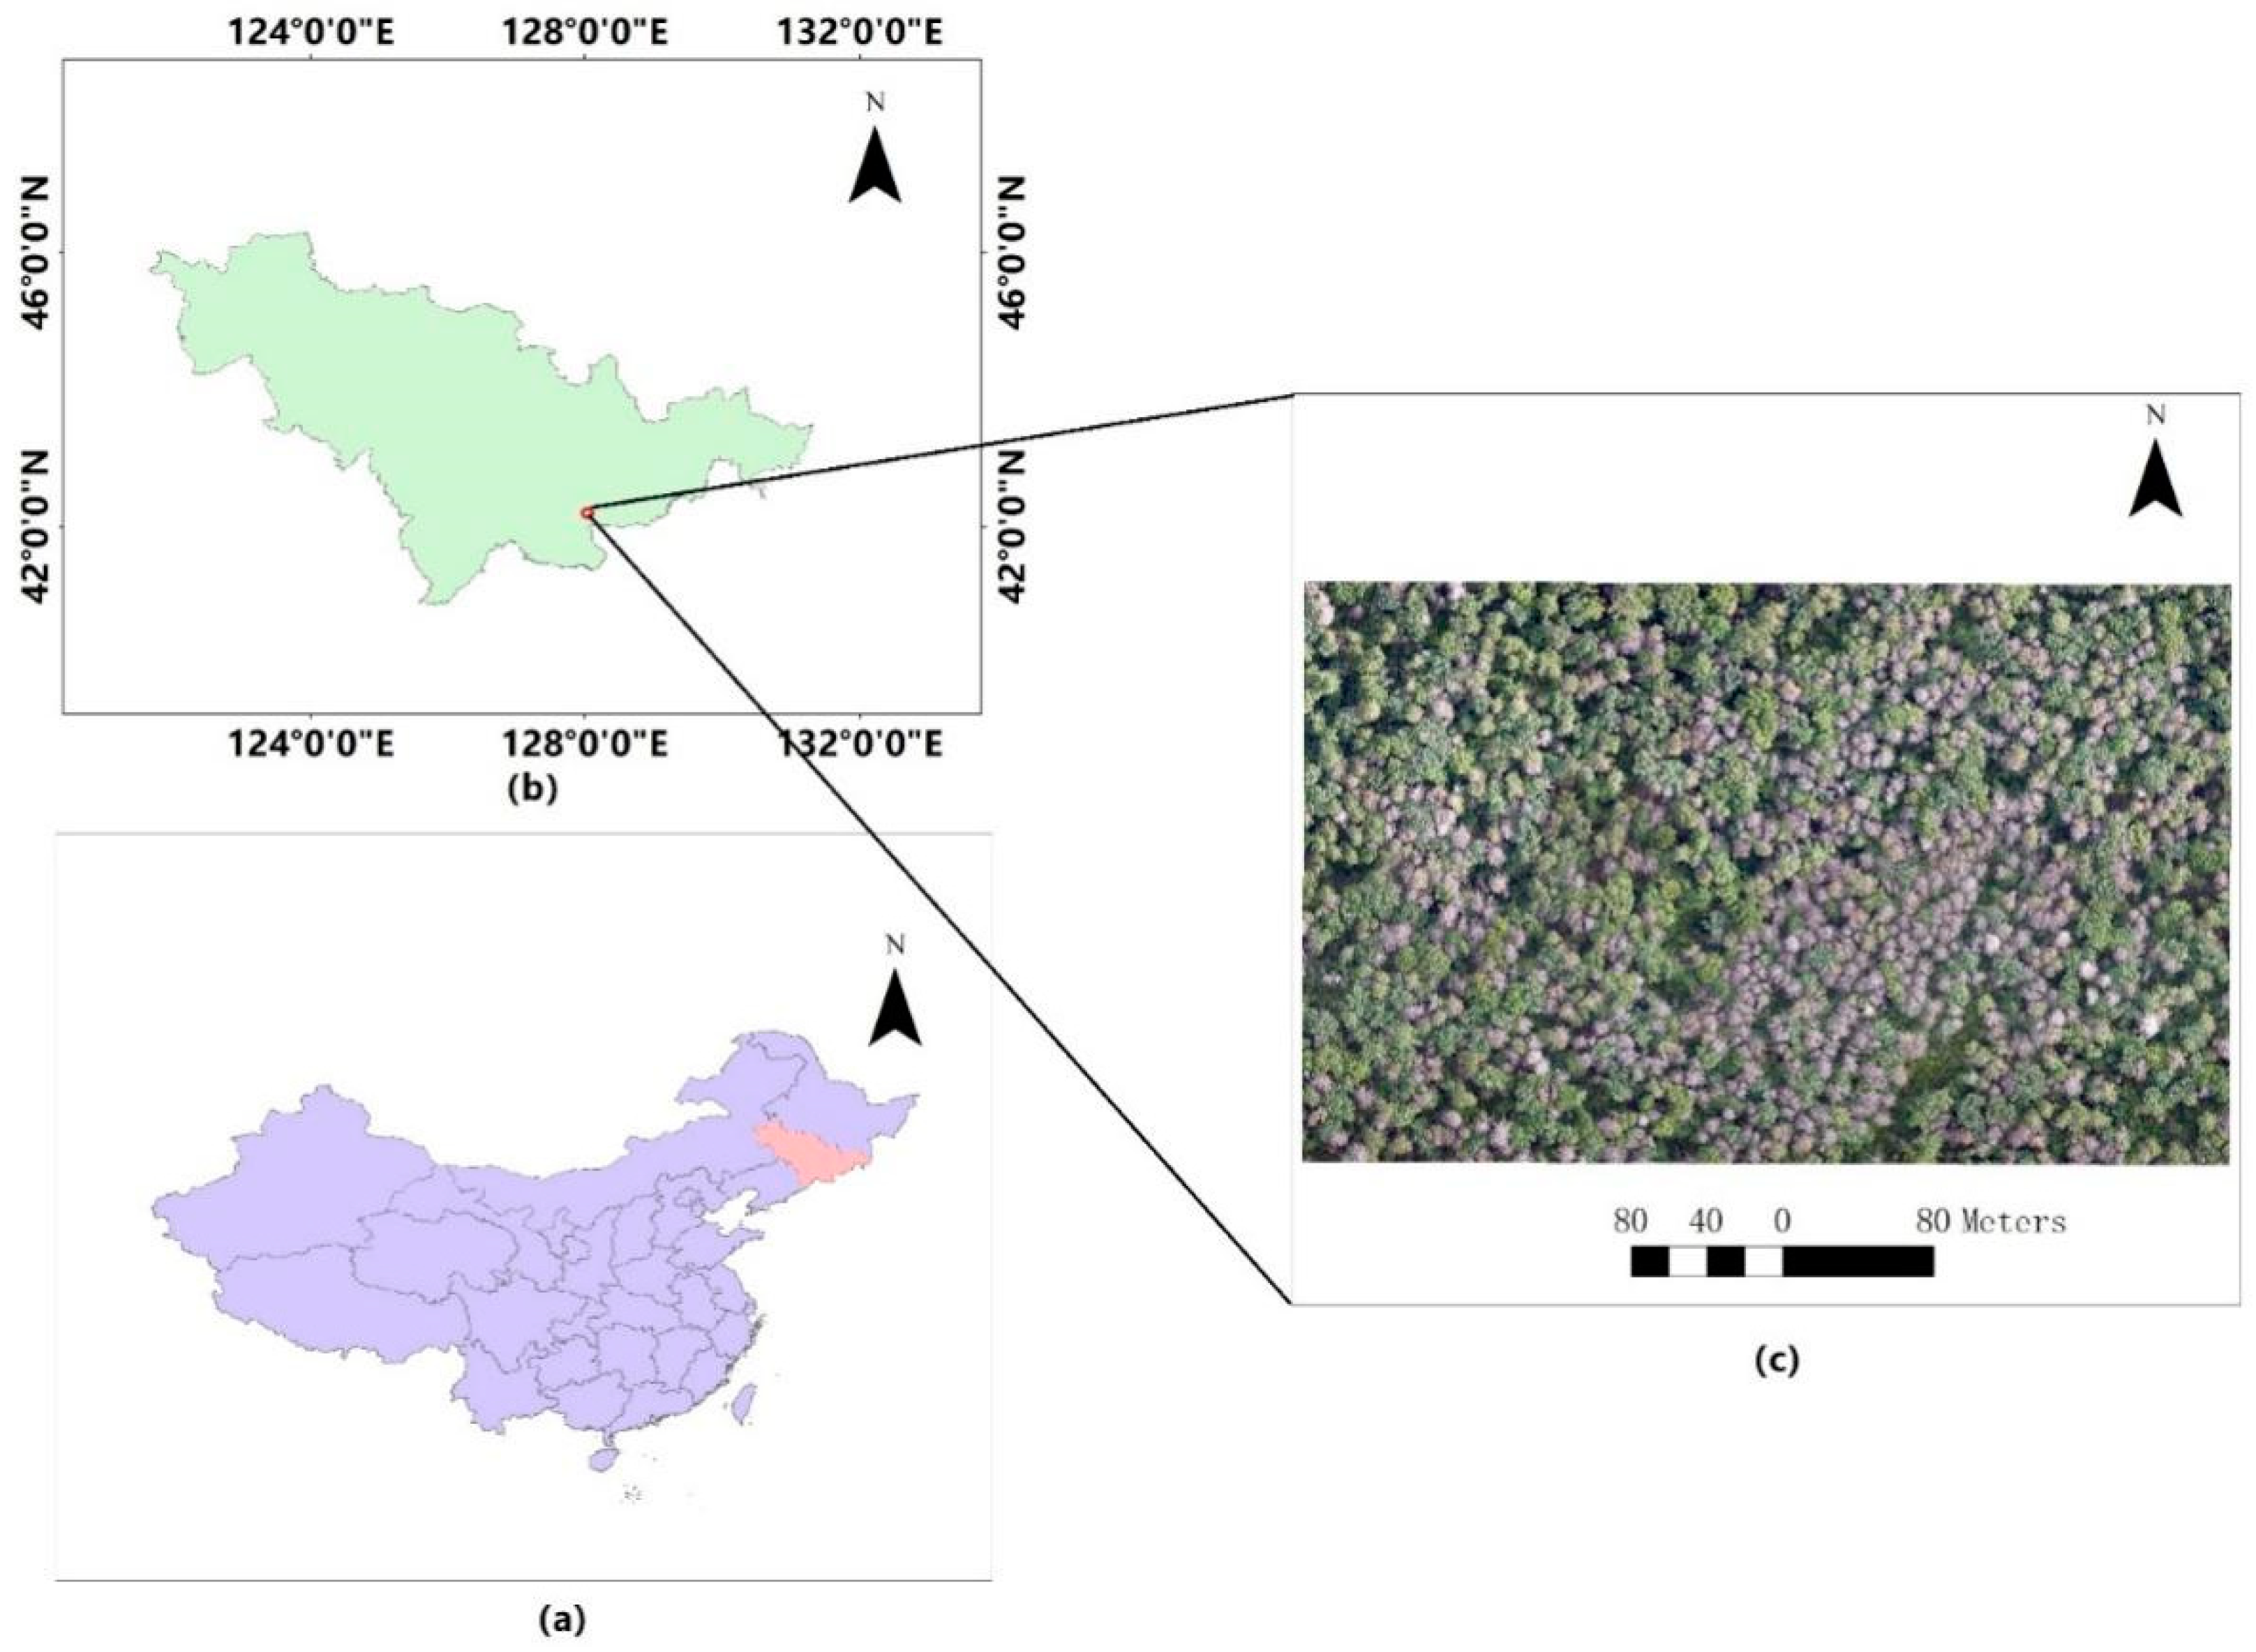
2.1.1. Overview of the Study Area

Changbai Mountain has well-preserved virgin forests consisting of international A-class nature reserves, including Changbai Pine Nature Reserve. This reserve harbors Changbai Pine (Pinus sylvestris var. sylvestriformis (Takenouchi) Cheng et C. D. Chu), a unique tree species on Changbai Mountain, and hosts the largest primitive community of red pine in China. Situated at an altitude of 1600–2000 m, Changbai Mountain teems with rare plants and alpine flowers. The experimental site, Baihe Protection and Management Station, is located in the eastern part of the Changbai Mountain National Nature Reserve. The eastern part of the area is bordered by Baihe Forestry Bureau with a boundary of 28 km. The area predominantly consists of mixed red pine, broad-leaved forest. The core area falls within the temperate monsoon climate zone, which is conducive to the propagation and outbreak of PWN. The geographical location of the study area is shown in Figure 1.

2.1.2. Data Acquisition

In this study, data collection was conducted using a Bell 206 L4 helicopter as the aerial platform. The Bell 206 L4 helicopter is manufactured by Bell Textron Inc., headquartered in Fort Worth, TX, USA. The conditions during the aerial image were optimal, characterized by clear skies, abundant sunlight, and calm winds, ensuring ideal conditions for helicopter operations. At the lowest point within the survey area, the captured detail had to attain an image resolution of 0.03 m to meet project requirements. At the highest point within the survey area, an adequate angle and overlap of images had to be maintained to ensure data integrity for accurate depth perception and three-dimensional modeling. Three flight strips were established based on aircraft performance specifications and the aerial digital camera system. Flight parameters specified a flight altitude of 400 m, lateral overlap of approximately 45%, and longitudinal overlap of 65%.
The imaging equipment onboard the helicopter included a Feith camera with a resolution of 100 million pixels across visible spectrum: red, green, and blue. Feith camera is manufactured by Feith Systems and Software, based in Madison, WI, USA. This setup facilitated the capture of 2956 images, each measuring 11,608 pixels by 8708 pixels. The spectral bands were finely tuned, with central wavelengths set at 660 nm for red, 550 nm for green, and 440 nm for blue. The images acquired from this high-resolution airborne setup had a resolution of 0.03 m, covering the red, green, and blue spectral bands. The comprehensive coverage of the study area amounted to 11.8 square kilometers, with a cumulative data volume for the imagery reaching 37.4 gigabytes.

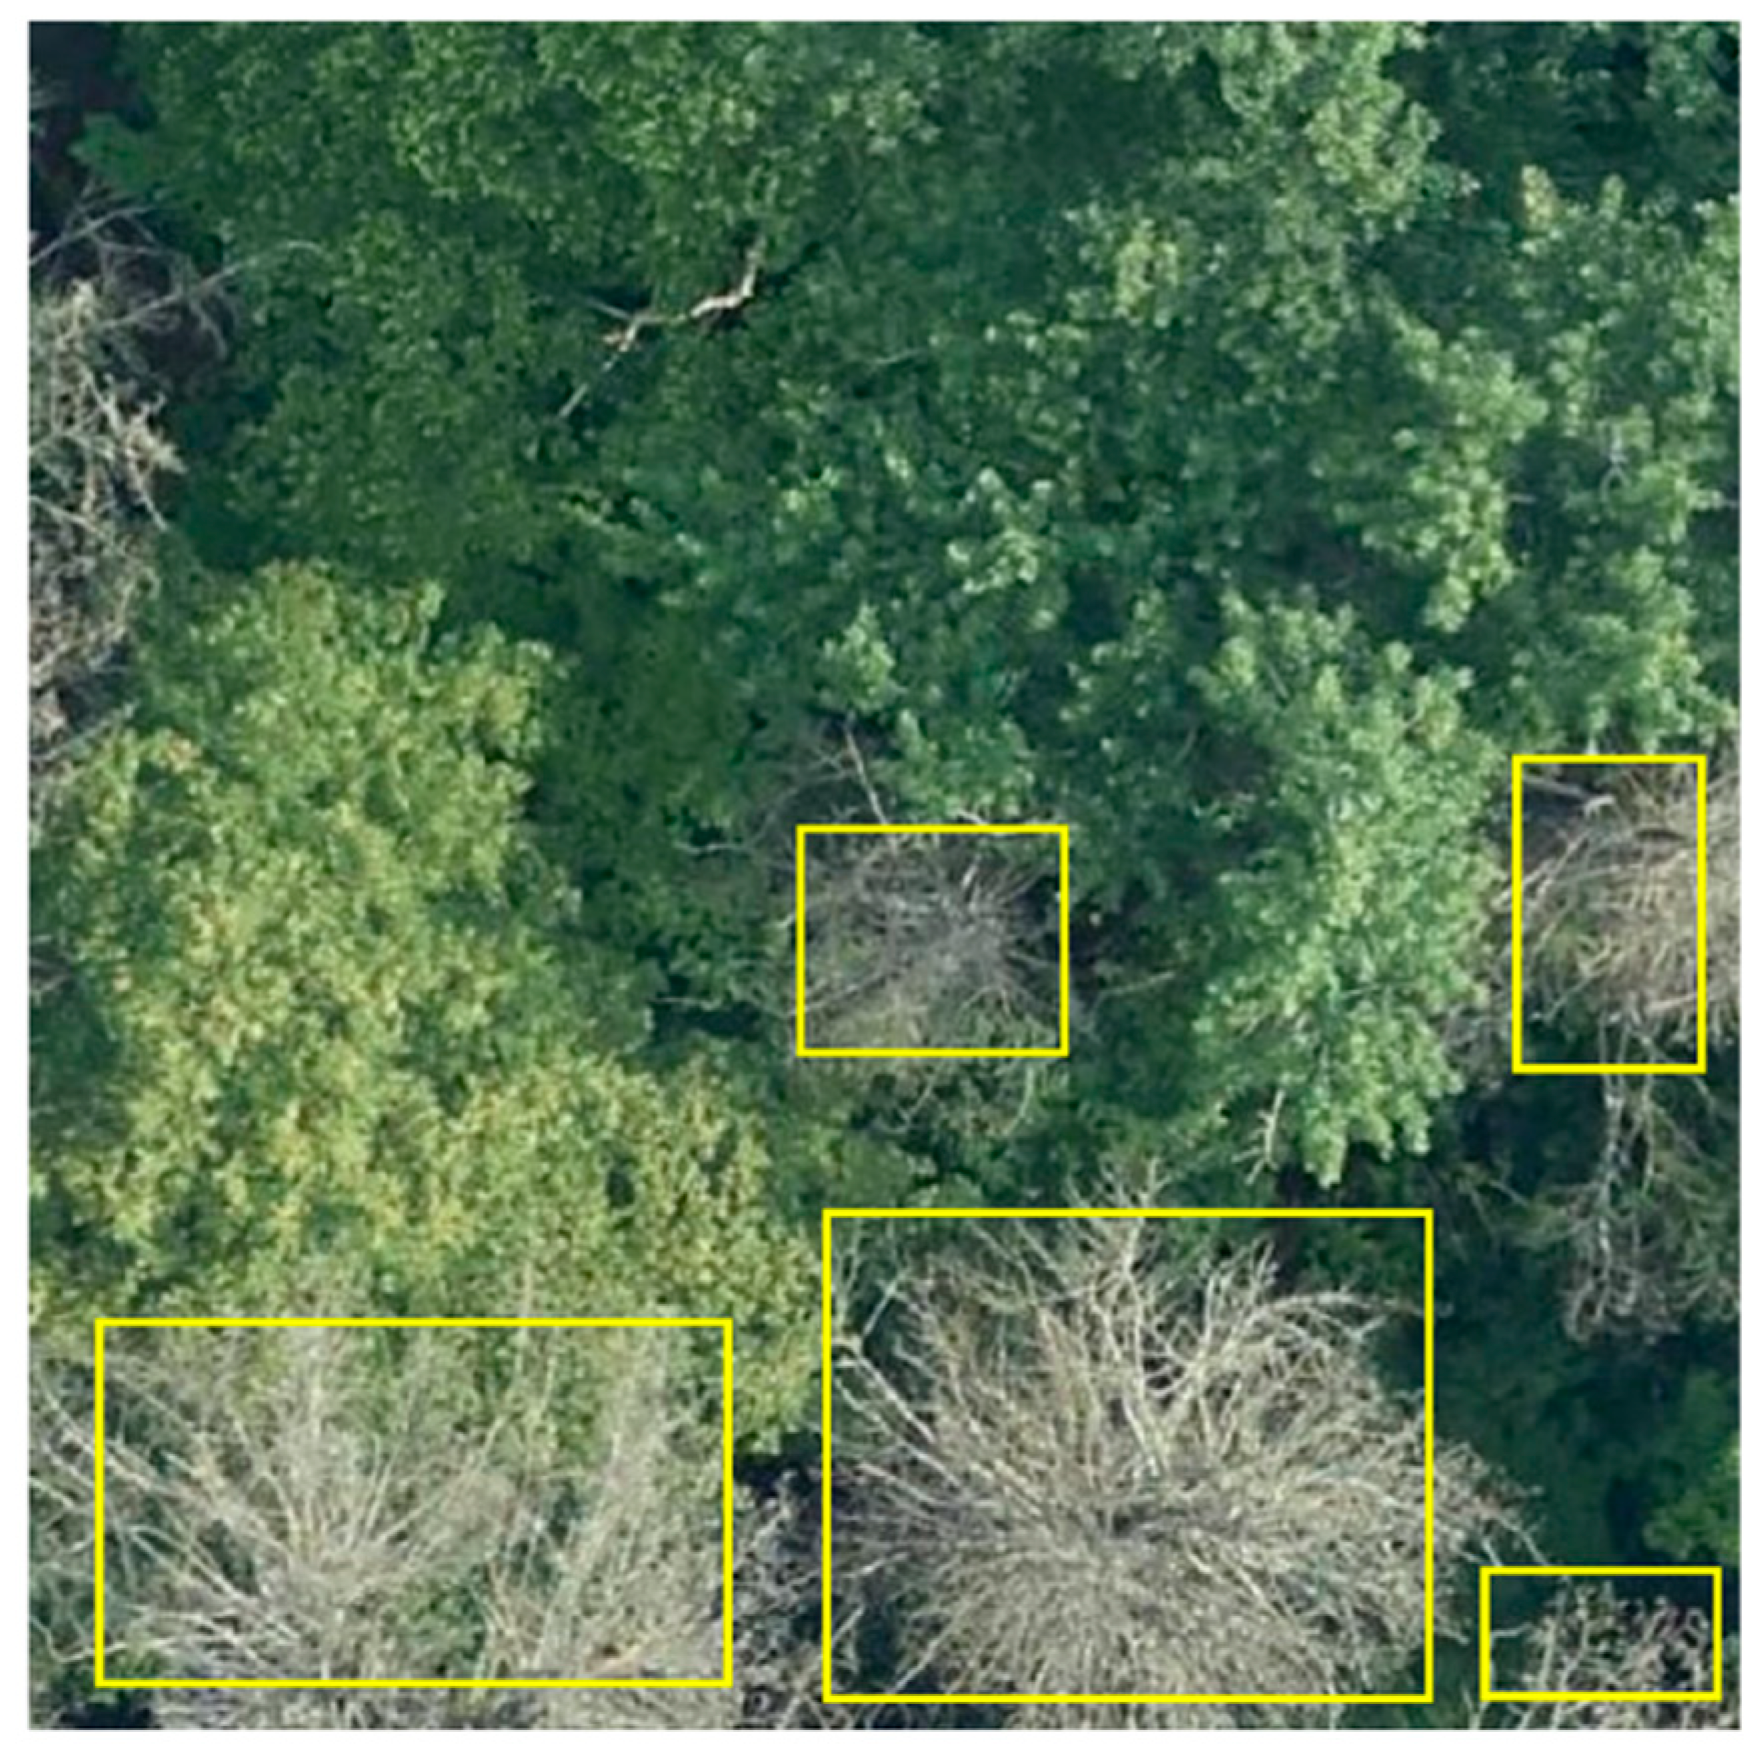
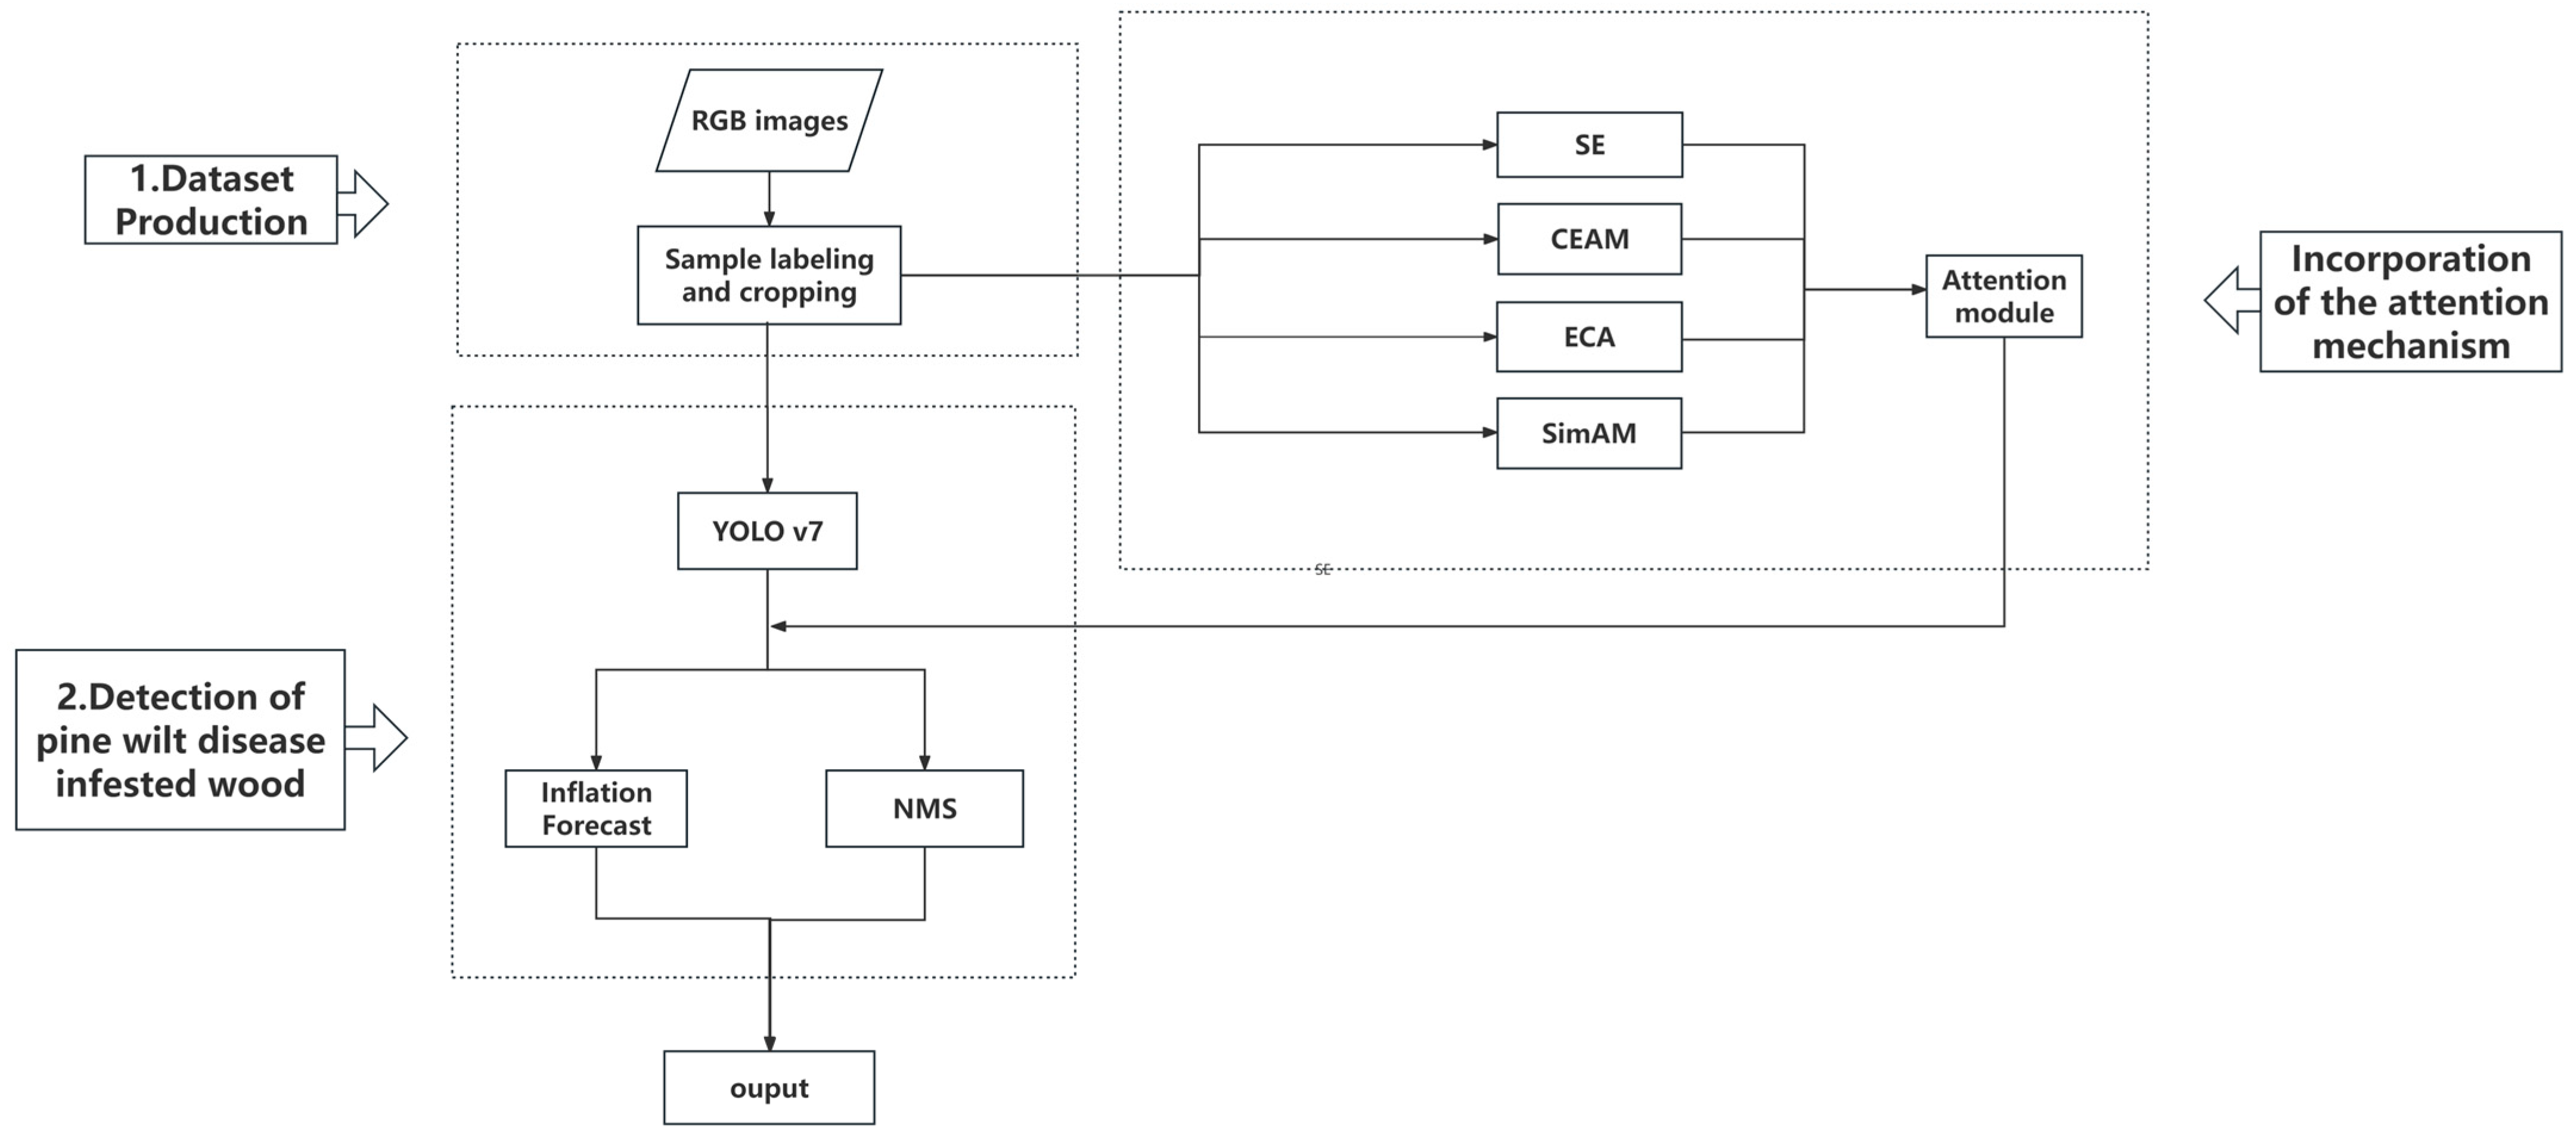
2.1.3. Dataset Production

In the conducted research, high-resolution imagery captured from a helicopter, showing red, green, and blue bands, was used to generate multiple Joint Photographic Experts Group (JPG) images to map high-lighting areas of PWD-affected trees. These images were used to generate datasets for a target detection model and a recognition classification model. Specifically, 884 images were compiled, measuring 640 pixels by 640 pixels. These images were distributed across training, validation, and test sets in an 8:1:1 ratio, resulting in 707, 89, and 88 images allocated to each category, respectively. The training dataset was subsequently expanded to 2828 images through augmentation techniques such as flipping, scaling, and color dithering. In contrast, the validation and test datasets remained unaltered to ensure the reliability of the performance evaluation. After augmentation, the dataset increased to include 3005 images, collectively marked with 10,145 instances of PWD-affected trees. The sample labeling process for the target detection model is depicted in Figure 2. The yellow box indicates information about the location and size of the symptomatic trees.

2.2. Methods

2.2.1. Experiment Content

In this study, high-resolution images acquired via helicopter were used as the database for detecting symptomatic trees in the images of target forest areas. The roadmap is shown in Figure 3 and described as follows.
Dataset production. The target detection model dataset—the training, validation, and test sets—was produced by utilizing the high-resolution images taken via helicopter.
Detection of symptomatic trees. Detection of pine trees affected by PWN in the forest image was conducted using the trained YOLO v7 model. The affected trees were selected by the detection box with confidence information to show the location of the affected trees more intuitively. In target detection, two strategies were employed: inflation prediction and non-maximum suppression (NMS). These approaches led to enhanced recall and accuracy of the target detection results.
An attention mechanism was added to the YOLO v7 model, which then improved the detection accuracy of the affected trees. The detection efficiencies of several commonly used attention mechanisms are also compared. The attention mechanisms used in the study include Self-Attention (SE), the Compact Efficient Attention Model (CEAM), Efficient Channel Attention (ECA), and the Similarity Attention Module (SimAM).

2.2.2. Target Detection Model

Introduction to YOLO v7

Proposed by Chien-Yao and Alexey et al., YOLO v7 [23] outperforms most target detection networks in accuracy and detection speed (range: 5–160 FPS (frames per second)). The network model consists of three parts: input, backbone, and head.
The input image first undergoes preprocessing steps, such as data enhancement, before being fed into the backbone network for feature extraction. The extracted features are then processed through the neck layer to generate three layers of feature maps with varying different sizes. The feature maps are ultimately detected and out-putted at the head to obtain results. The backbone module consists of CBS, ELAN, and MP modules.
The CBS module uses the batch normalization layer, conv, and silu activation functions to extract the multiscale information from the image. The ELAN module with multibranch convolution improves the learning ability of the network without destroying its structure. The head incorporates the Spatial Pyramid Pooling (SPP) structure into the Cross Stage Partial Network (CSP) structure, adding residual connections to facilitate optimization and feature extraction. The RepConv module with heavily parameterized convolution enriches training resources and improves network inference speed. Moreover, adaptive multi-sample matching accelerates the training efficiency of the model. An enhancement to YOLO v7 entails adding an attention mechanism after the three ELANs in the backbone. The specific model structure is depicted in Figure 4. Different colors represent different functional modules, where dark blue represents the added attention mechanism module.

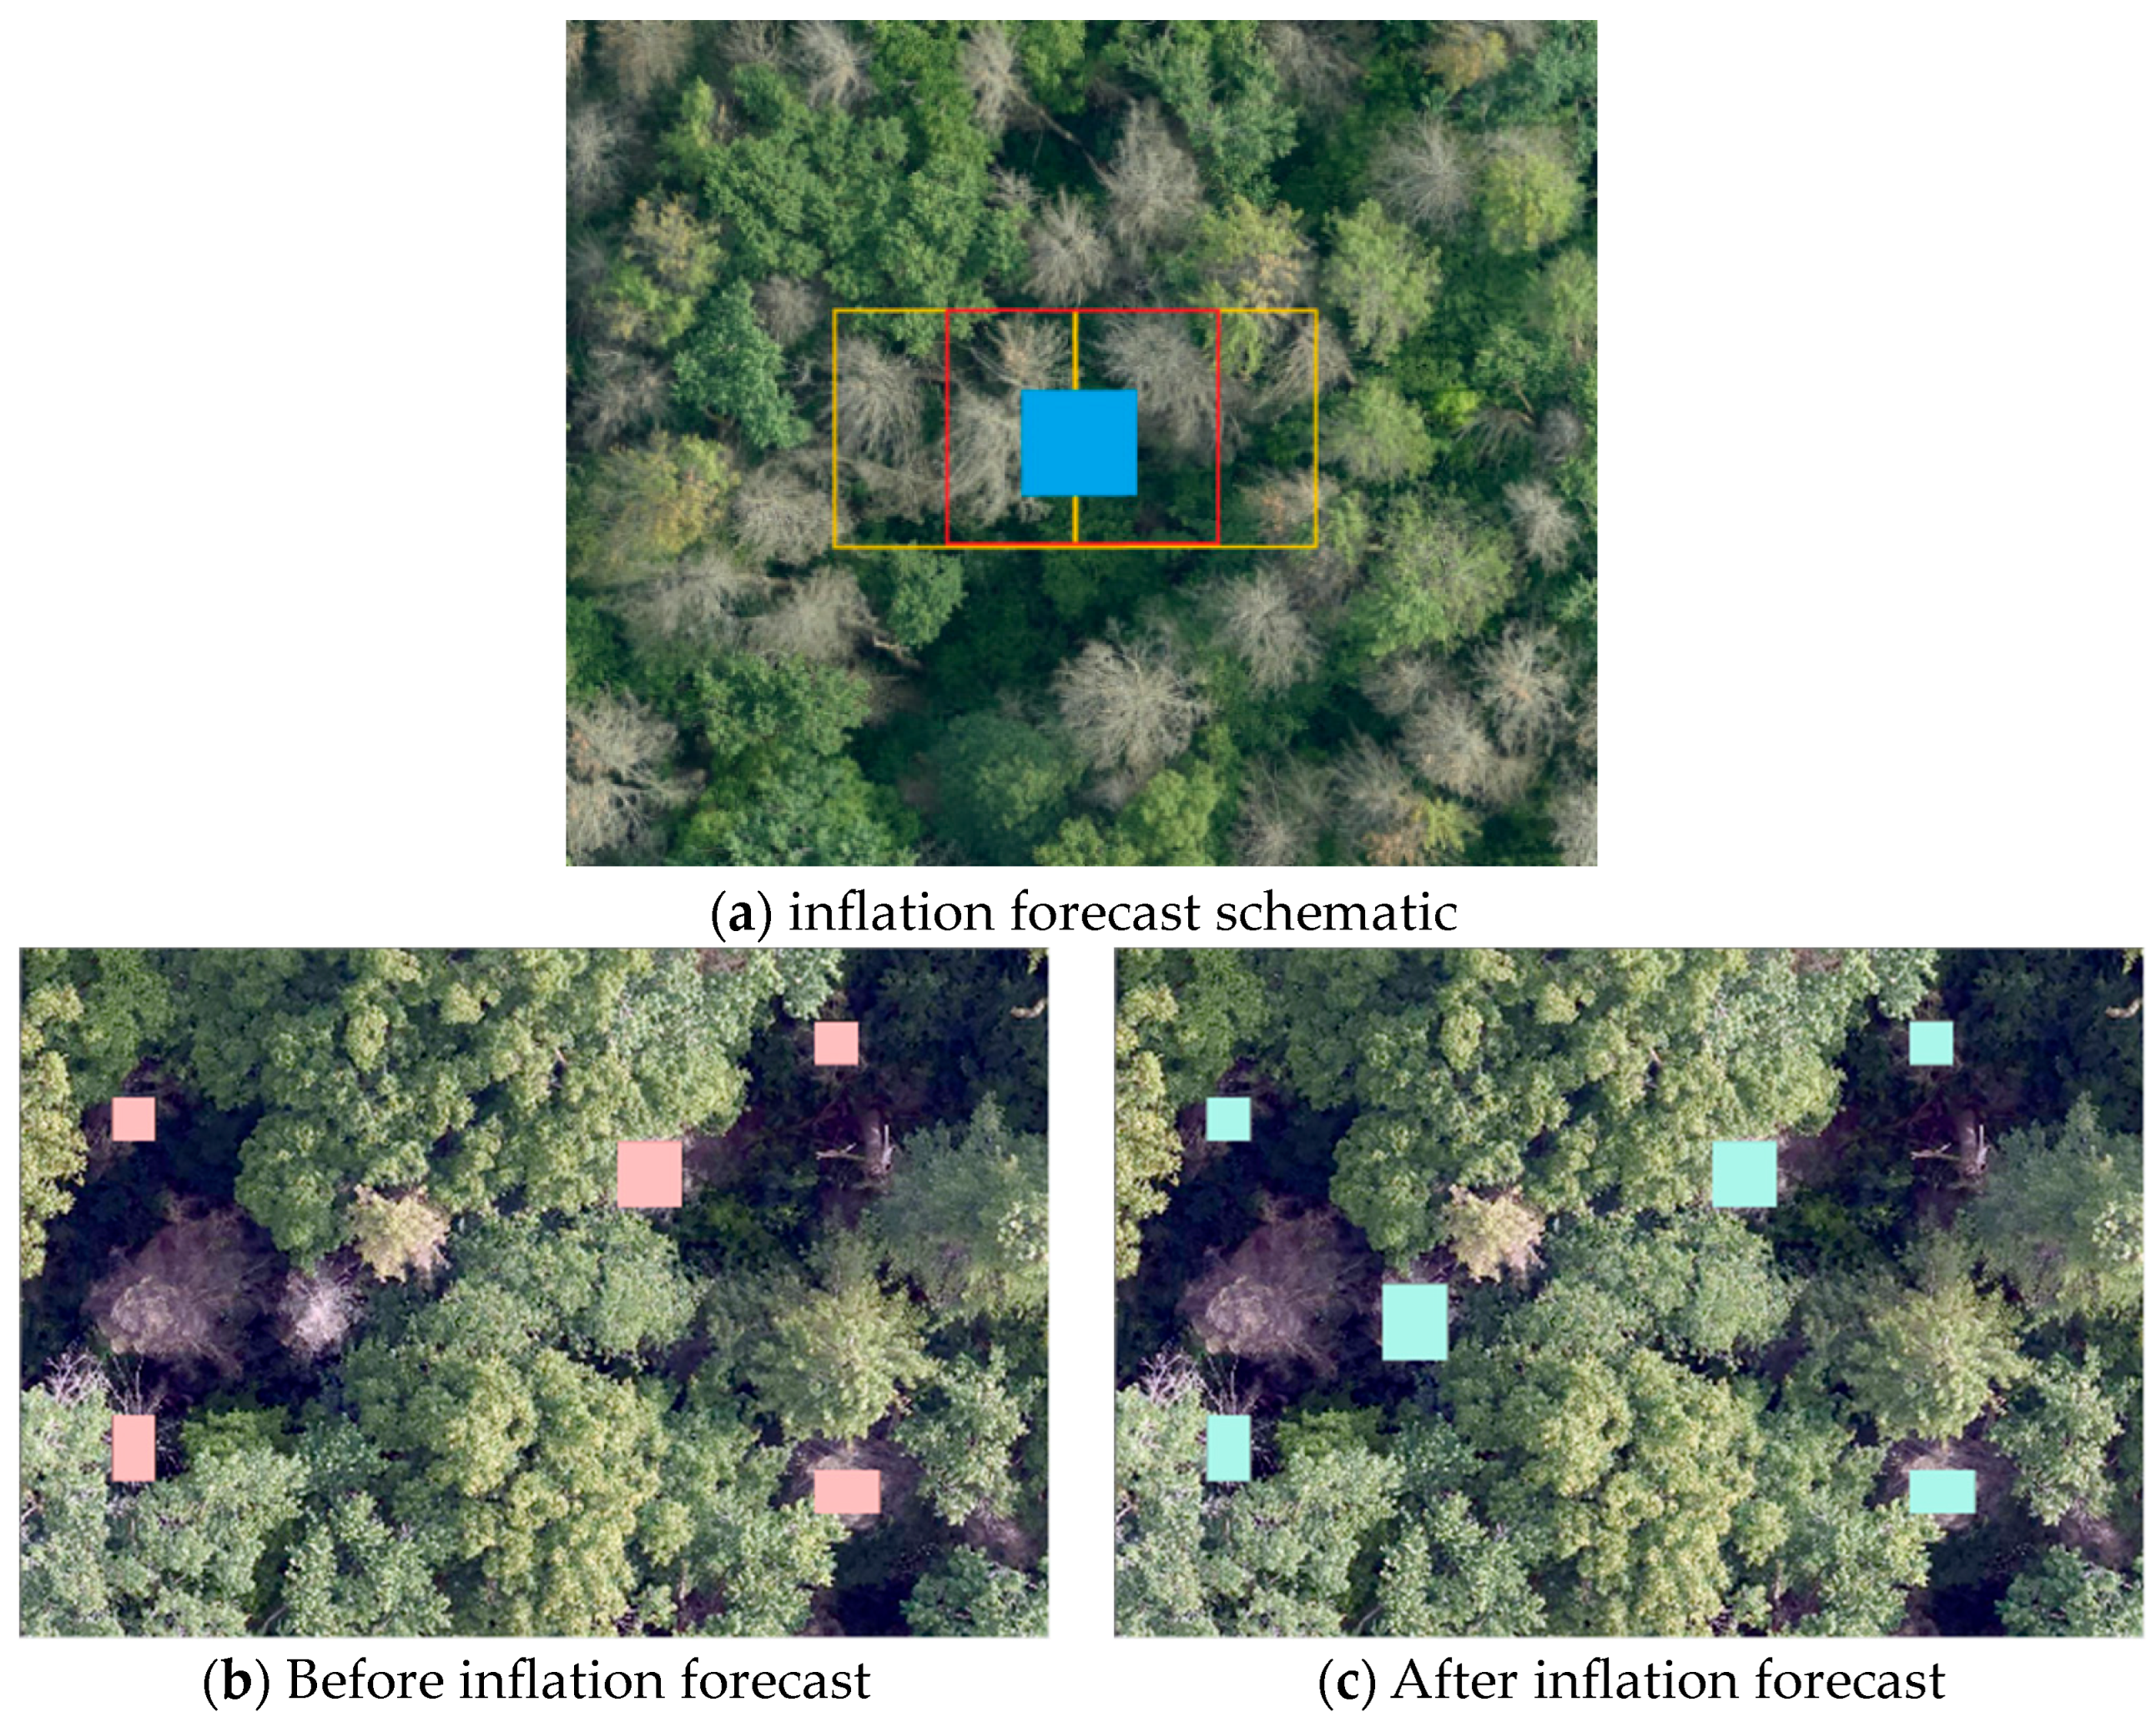
Target Detection Optimization Strategy

To address the challenge of detecting targets within large-scale images, we employed the sliding window technique. The direct application of this method to the entire image compromised the detection of discolored, PWD-affected trees near the edges, as cropping reduces contextual details at the periphery of each segmented image block. This problem is addressed by adopting an expansion prediction strategy during detection. The sliding window had dimensions of 640 pixels by 640 pixels, with a step size of 320 pixels for each movement. During each detection cycle, only results from the central area with 320 pixels by 320 pixels were considered valid; meanwhile, the surrounding area served as the central portion for subsequent windows. As illustrated in the inflation forecast schematic (Figure 5), the yellow detection box moves a step size (320) to the position of the red detection box. For the red detection box, only results from the central area, denoted by the blue square, are retained. Subsequently, it moves another step size to the position indicated by the next yellow detection box, keeping only the detection results of the central area. This method avoids inaccuracies in identifying symptomatic trees at the edges, stemming from challenges in feature extraction. The pink box in Figure 5b presents the detection results before inflation prediction, and the green boxes in Figure 5c shows the detection results after inflation prediction. As observed, dilation prediction reduces the missed detection rate of PWD.
During target detection, a substantial number of redundant detectors are generated. These excess detectors are efficiently pruned using the NMS technique in which the highest-scoring bounding boxes are iteratively selected. Those with an overlap exceeding a predefined threshold (0.25, the overlap ratio between detection boxes) are then eliminated. Figure 6 illustrates the enhancements resulting from the application of the NMS technique, revealing the pre- and post-application scenarios. The green box in Figure 6a presents the detection results before NMS, and the blue box in Figure 5b shows the detection results after NMS.

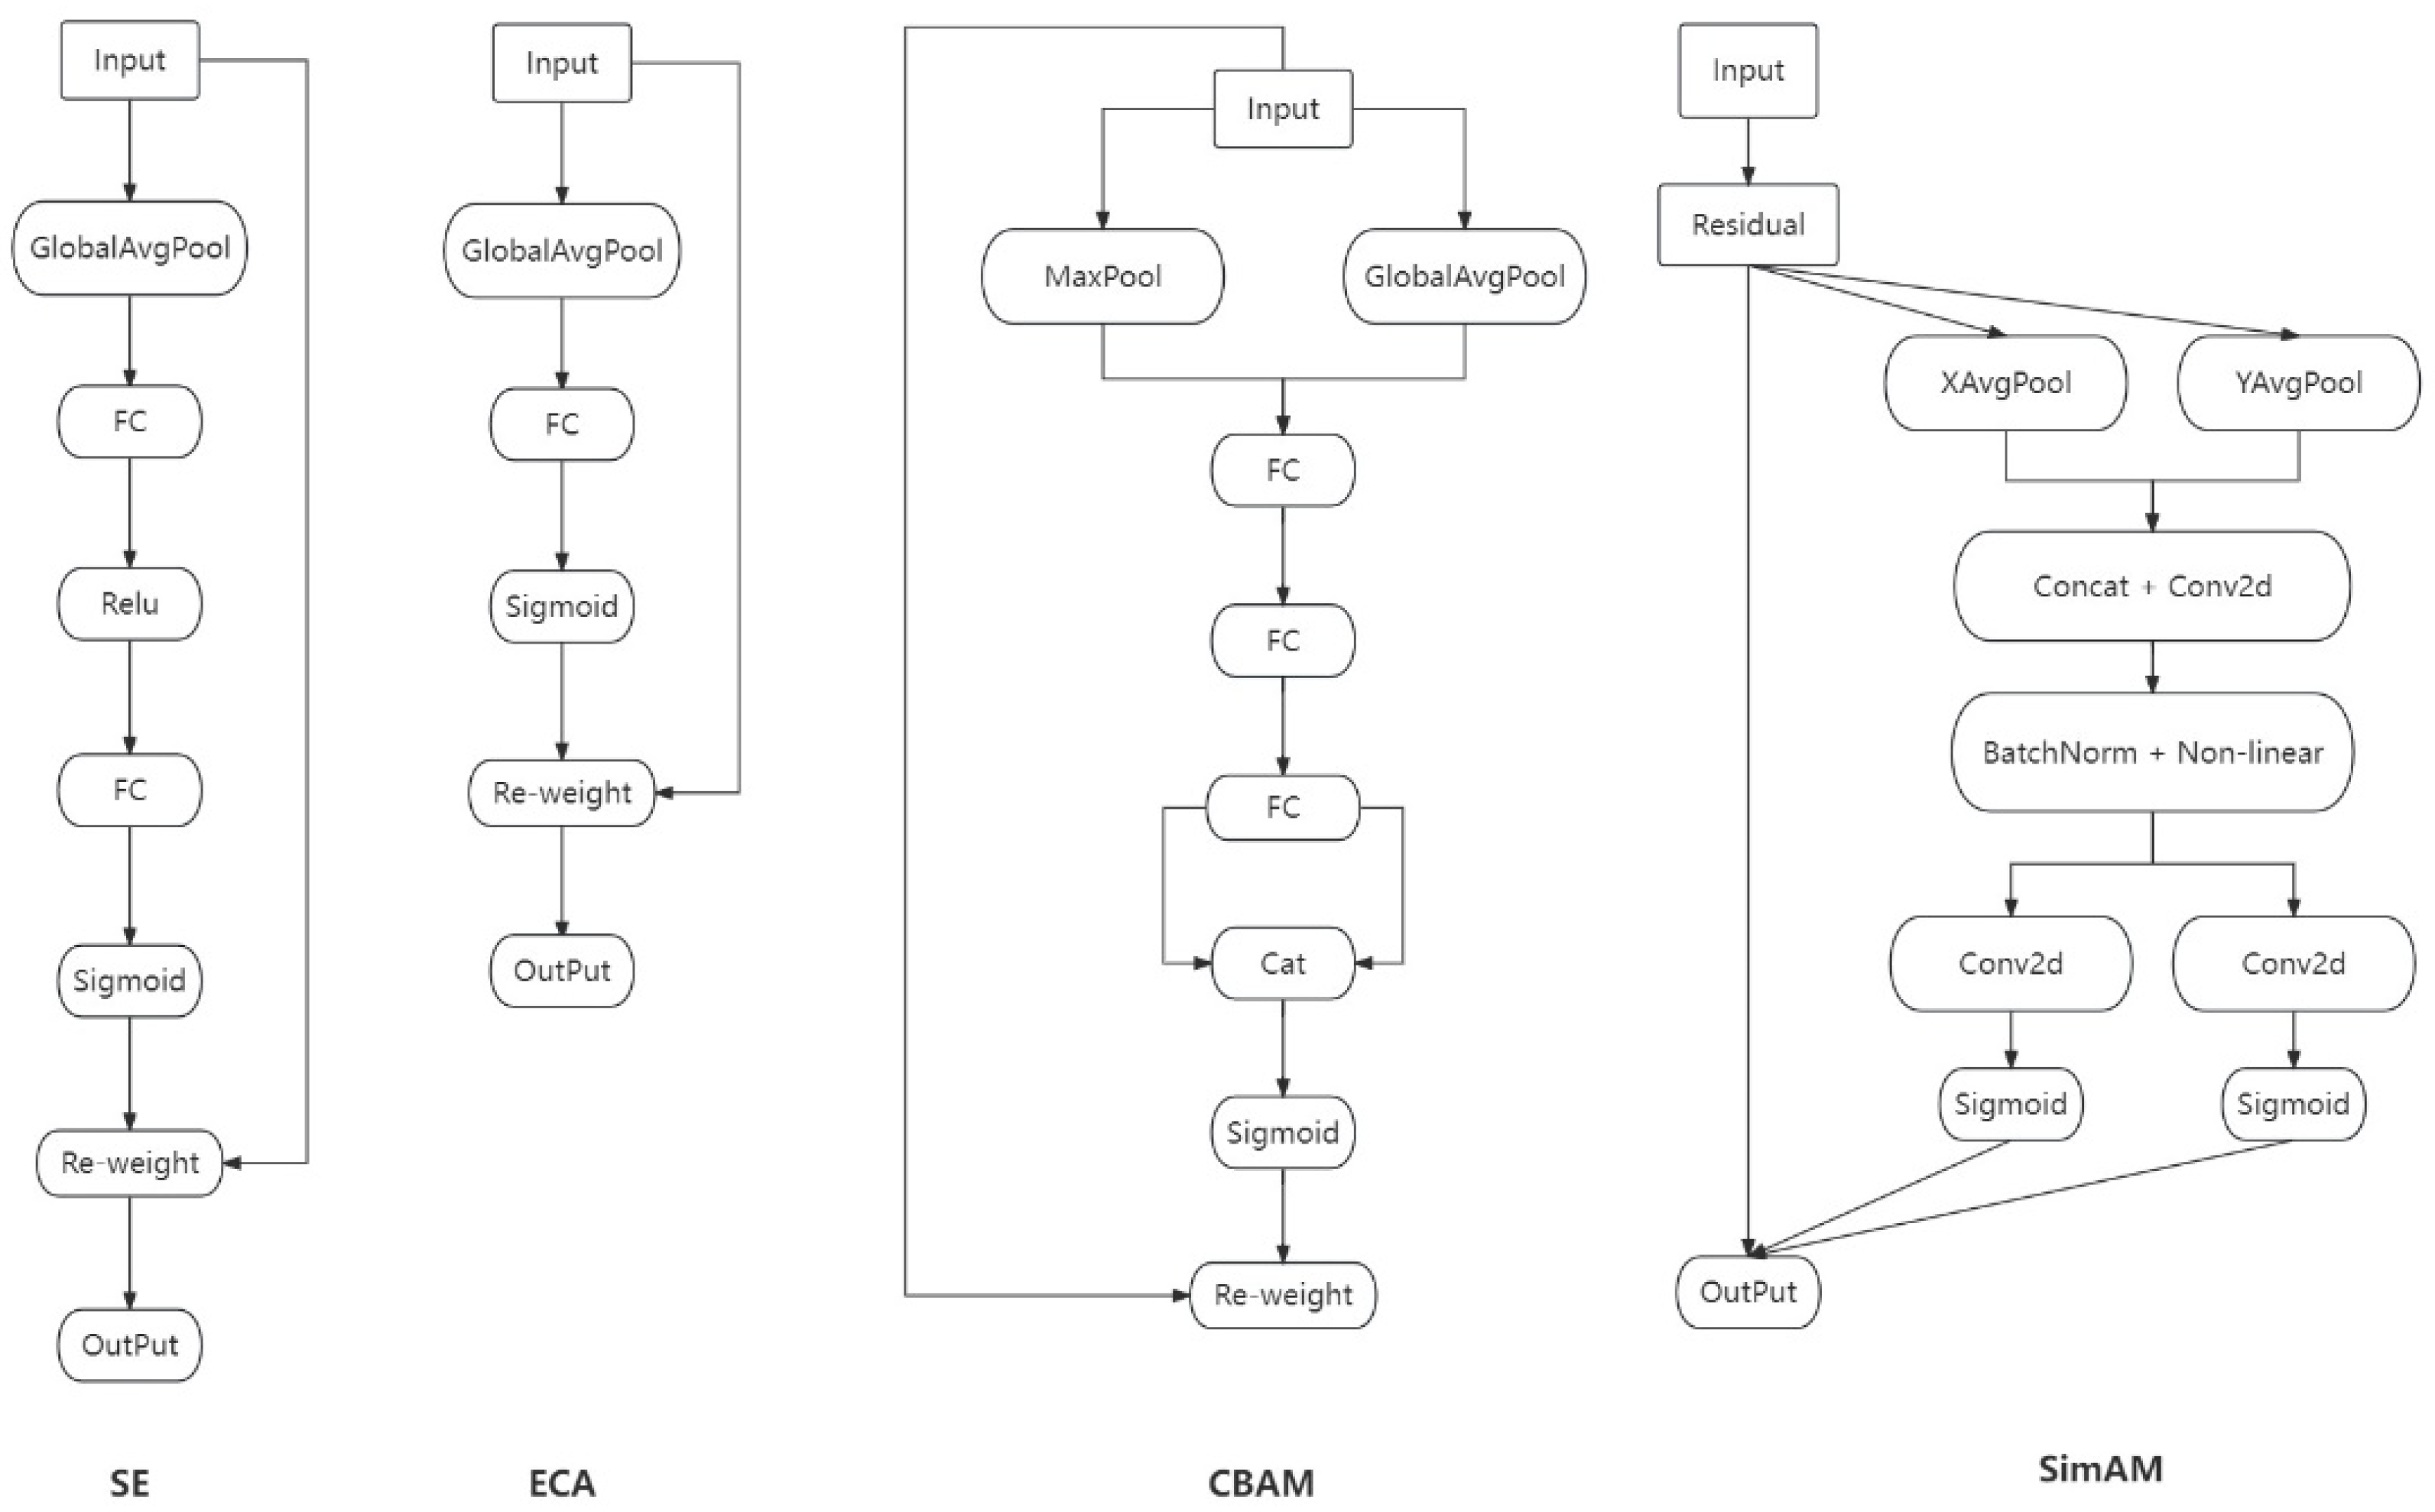
2.2.3. Introduction to the Attention Mechanisms Module

Attention mechanisms play a significant role in enhancing the focus of a network on specific detection targets. Modules such as SE (Hu et al., 2019), ECA (Wang et al., 2020), CBAM (Woo et al., 2018), and SimAM (Yang et al., 2021) have been instrumental in promoting model recognition capabilities [24,25,26,27]. The CBAM module prioritizes learning the significance of the features associated with each channel by employing a shared multilayer perceptron and sigmoid activation to ascertain channel weights, followed by a convolutional approach alongside a sigmoid function to determine spatial feature weights. By contrast, the SE module captures spatial feature weights via a dual-layer, fully connected network, followed by a sigmoid function for channel weight assessment. This process is simplified using ECA by substituting fully connected layers with one-dimensional convolution, efficiently gathering channel weight information after sigmoid activation to enhance cross-channel information assimilation. SimAM distinguishes itself by adaptively learning feature similarity metrics, enabling precise weight allocation to features based on their relevance to the detection task, thus sharpening the focus on crucial detection features. The architecture of these attention modules is outlined in Figure 7, illustrating their roles in improving network attentiveness to the detection target.

2.2.4. Test Environment and Parameter Settings

This research used the PyTorch framework for deep learning, conducted on a system with the following specifications: AMD Ryzen 7 5800H CPU with Radeon Graphics, coupled with an NVIDIA GeForce RTX 3060 Laptop GPU (6GB); LENOVO motherboard; and 16 GB RAM. The AMD Ryzen 7 5800H CPU is manufactured by Advanced Micro Devices, Inc. (AMD), headquartered in Santa Clara, CA, USA. The NVIDIA GeForce RTX 3060 Laptop GPU (6GB) is manufactured by NVIDIA Corporation, headquartered in Santa Clara, CA, USA. The manufacturer of LENOVO motherboards is Lenovo Group Limited, headquartered in Beijing, China. The deep learning setup was configured using PyTorch version 1.11.0, Python 3.8, and CUDA 11.3. An initial learning rate of 0.01 was established, with dynamic adjustments using a cosine annealing strategy. For optimization, Stochastic Gradient Descent with Momentum (SGDM) was employed, with the momentum set at 0.937. The dataset was segmented into multiple batches for training and validation, with a batch size of 4 and the model running for 200 epochs.

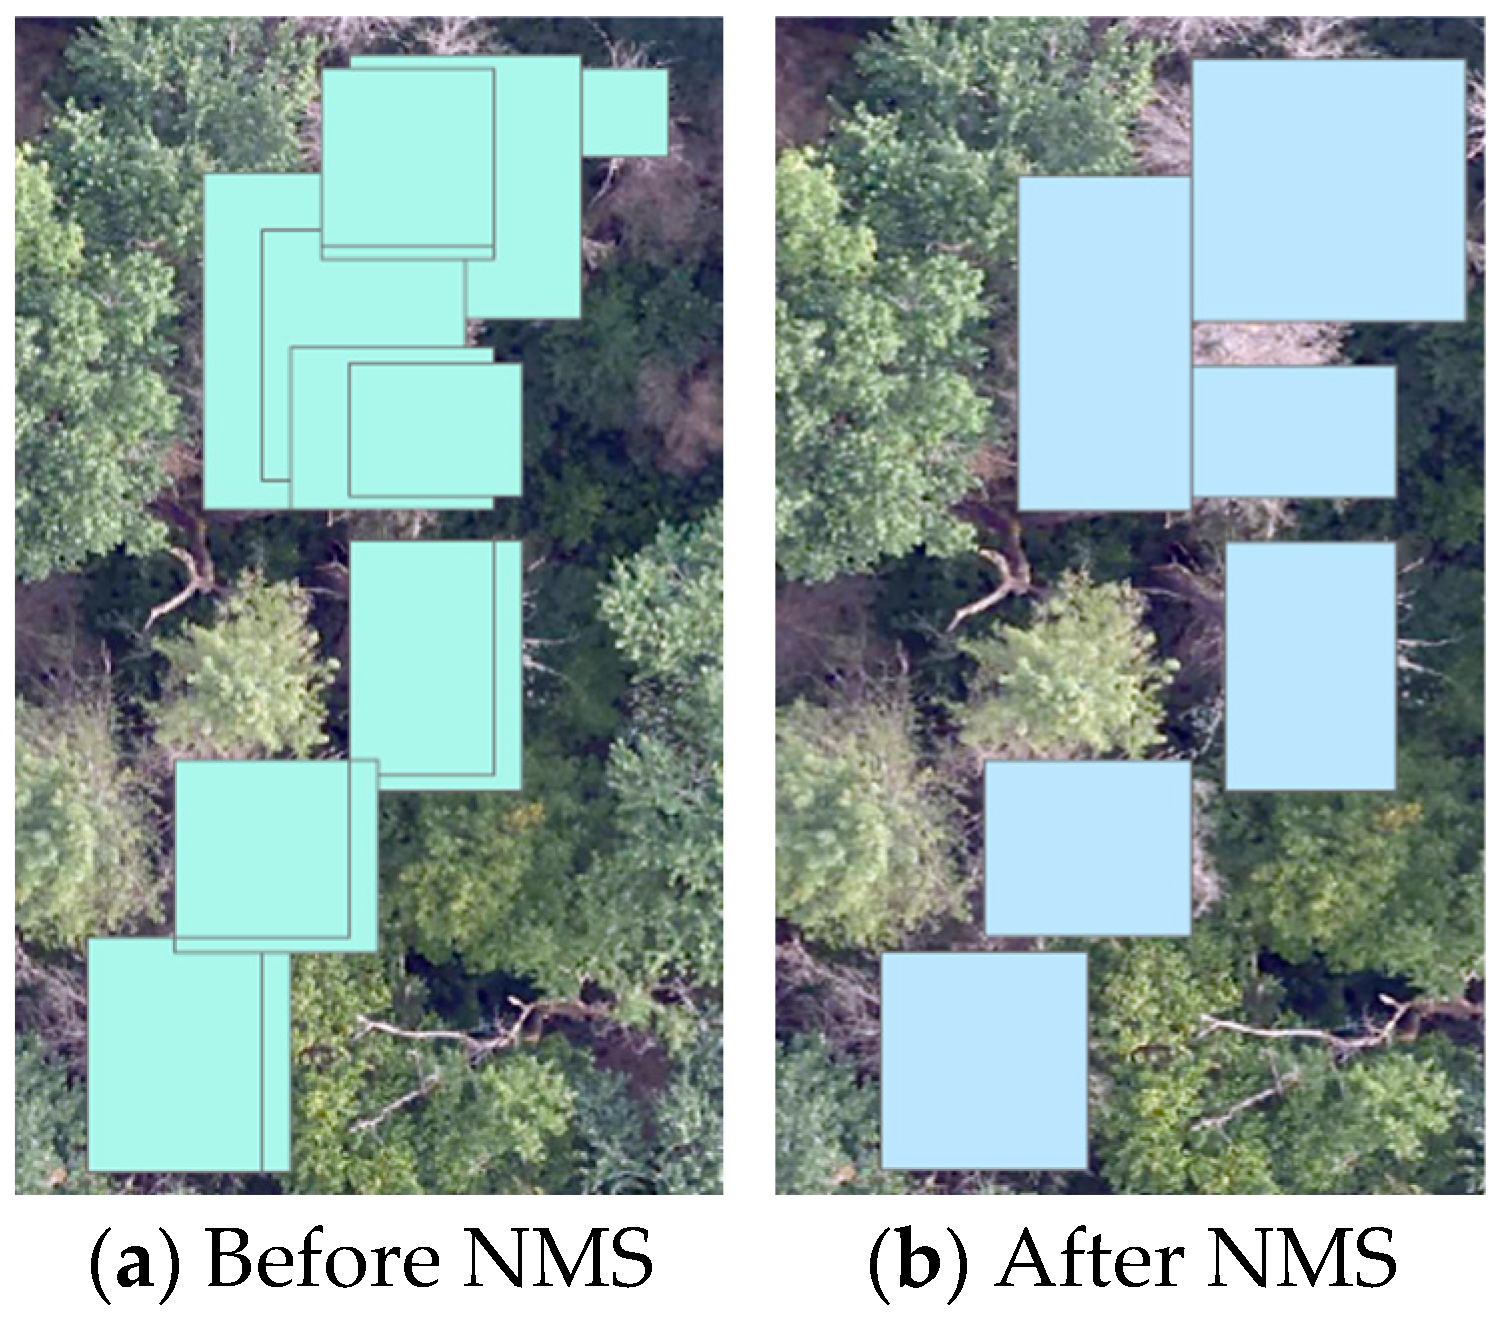
2.2.5. Accuracy Inspection

To assess the precision of the detection, test images were annotated via meticulous visual inspection to identify signs of PWN infestation. These annotated images were used as a reference to compare against the results generated using the target detection algorithm, ensuring the validity of the detection accuracy. Evaluation metrics included precision (P), recall (R), and the F1 score. Precision (P) measures the accuracy of the model in identifying symptomatic trees, representing the rate of correct detections. Recall assesses the ability of the model to comprehensively identify all instances of affected pine trees, reflecting the detection coverage. The F1 score offers a balanced average of both precision and recall, providing a comprehensive view of the performance of the model in recognizing symptomatic trees.
P r e c i s i o n = T P T P + F P
R e c a l l = T P T P + F N
where TP represents symptomatic trees correctly identified, FP denotes other features incorrectly identified, and FN stands for symptomatic trees incorrectly identified as having other features.
F1 scores, used to assess the accuracy of binary classification models, incorporate both precision and recall rates to provide a comprehensive evaluation metric [28]. In the current study, this metric, represented as the harmonic mean of precision and recall in Equation (3), was used as a critical indicator for evaluating the performance of the target detection model, also referred to as detection accuracy. The statistical significance of this measure underscores its importance in the analysis.
F 1 = 2 × P r e c i s i o n × R e c a l l P r e c i s i o n + R e c a l l

3. Results

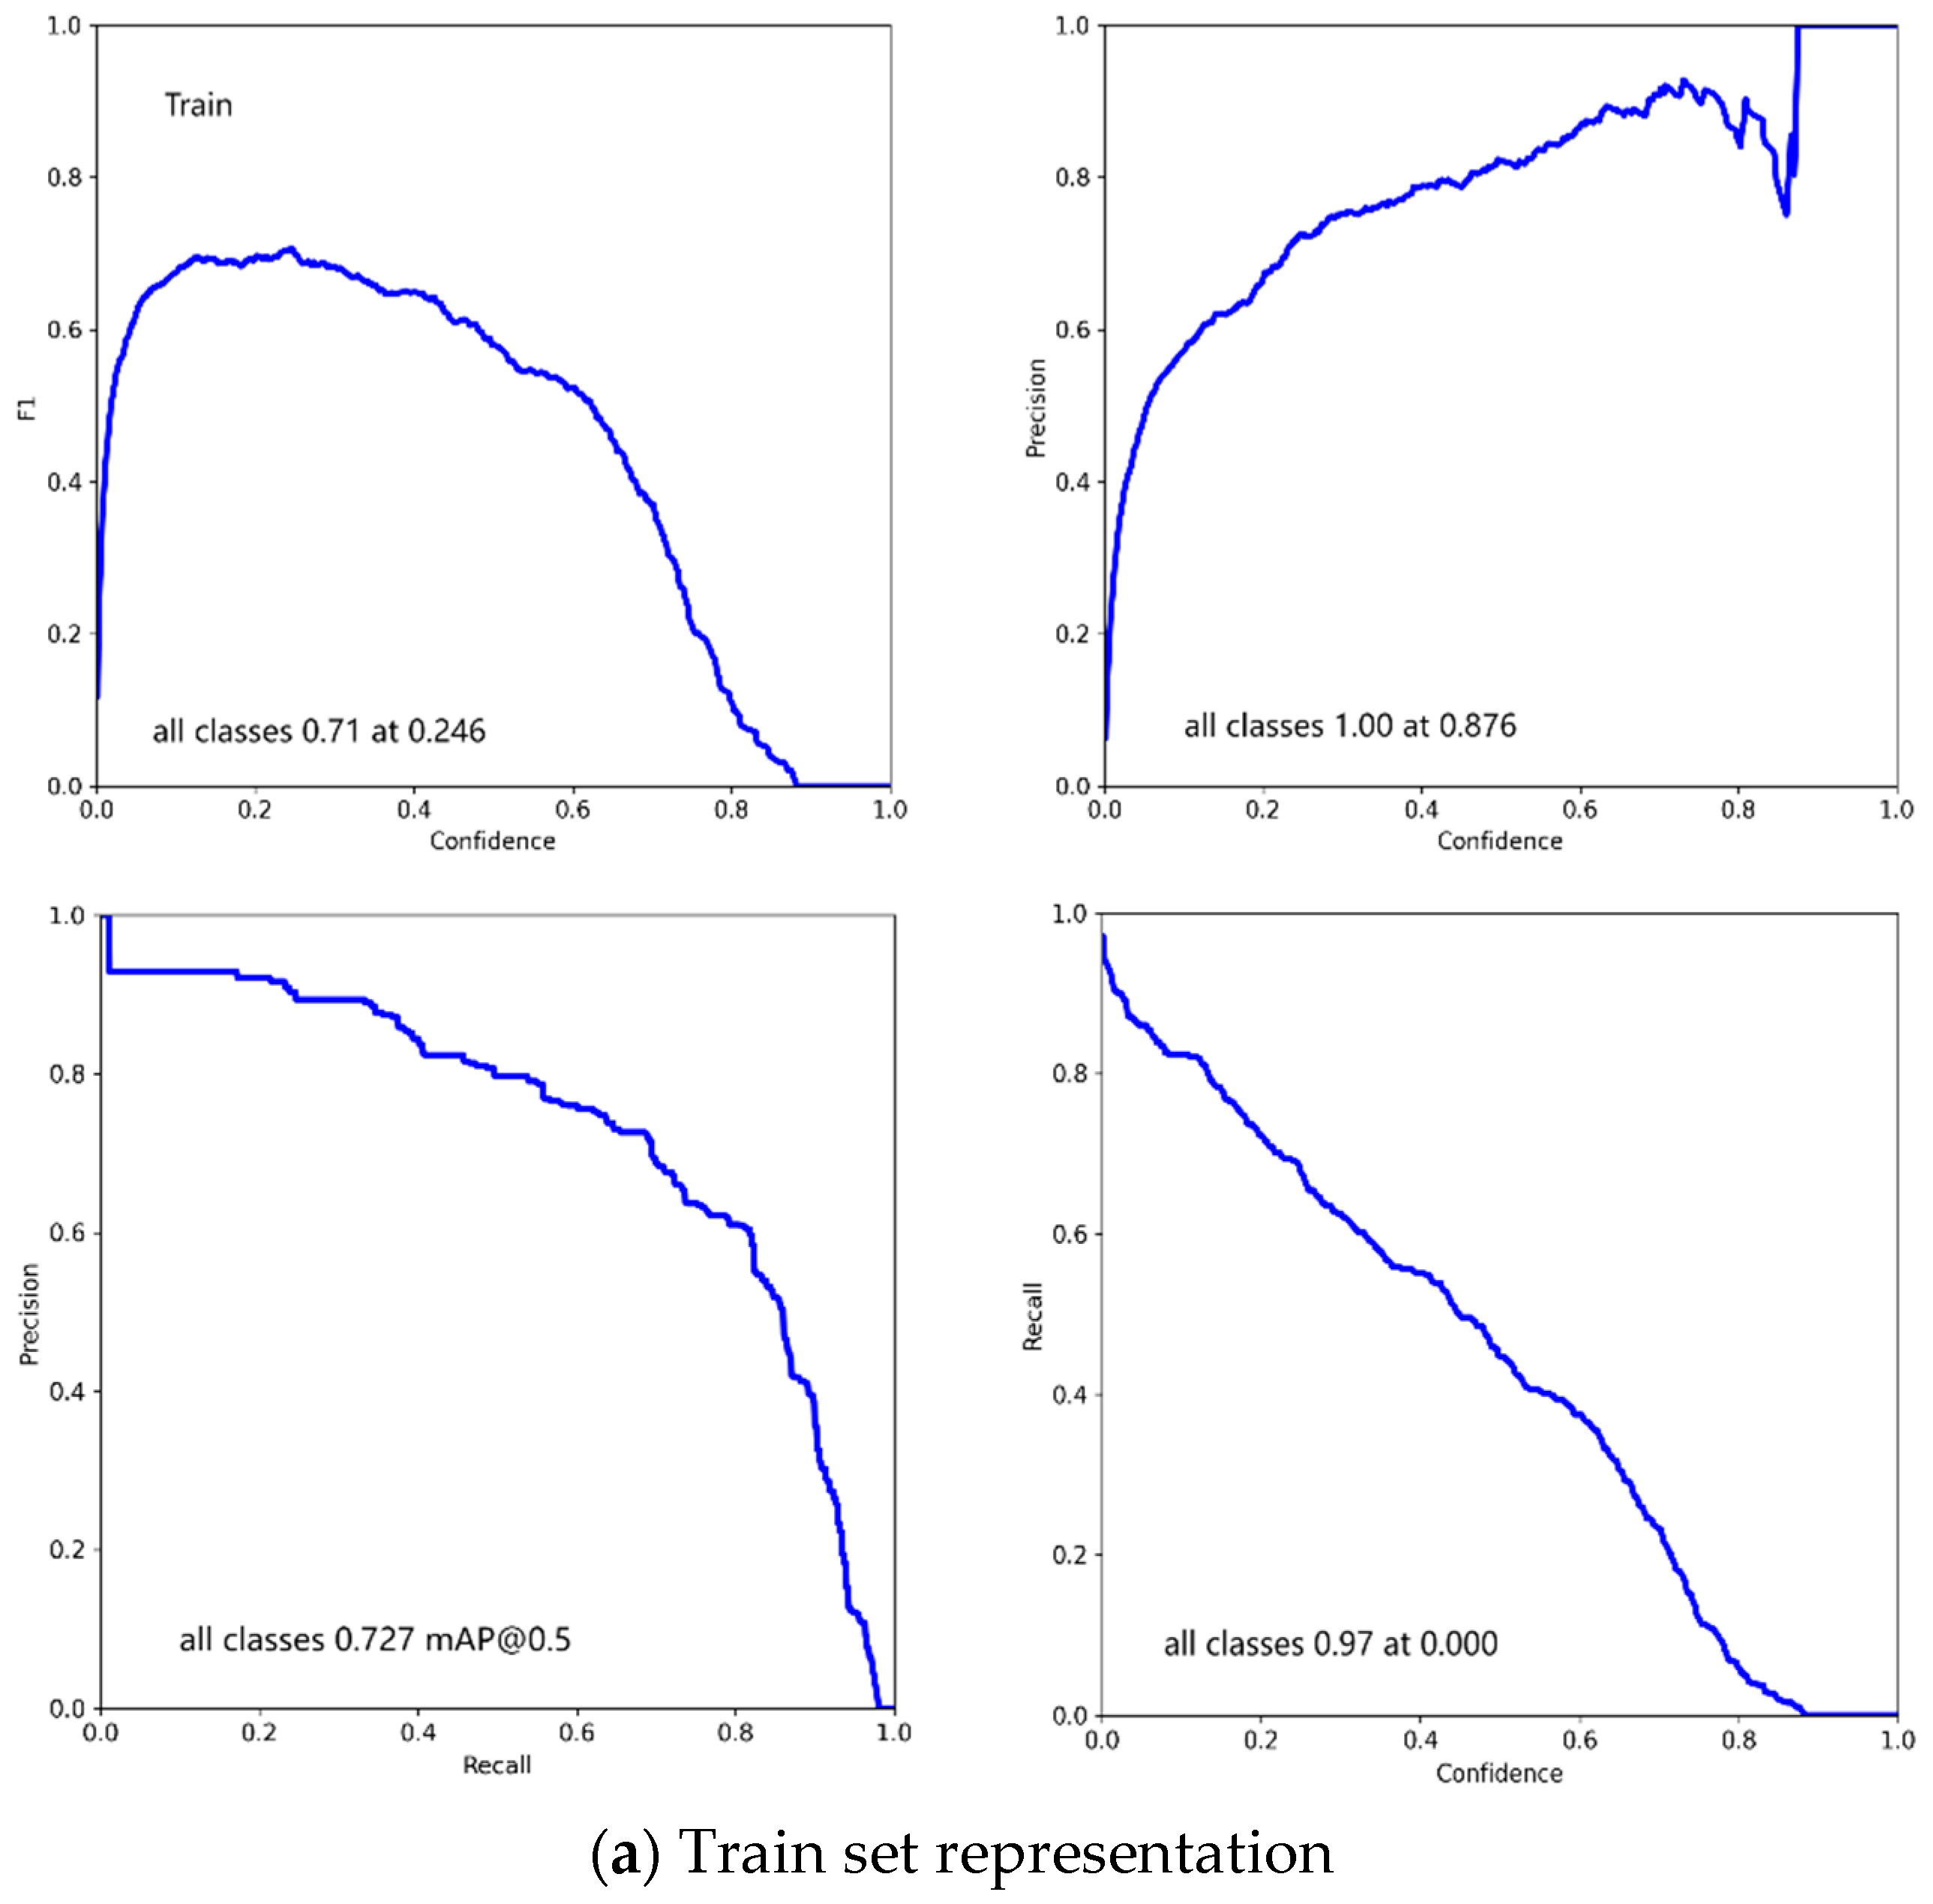
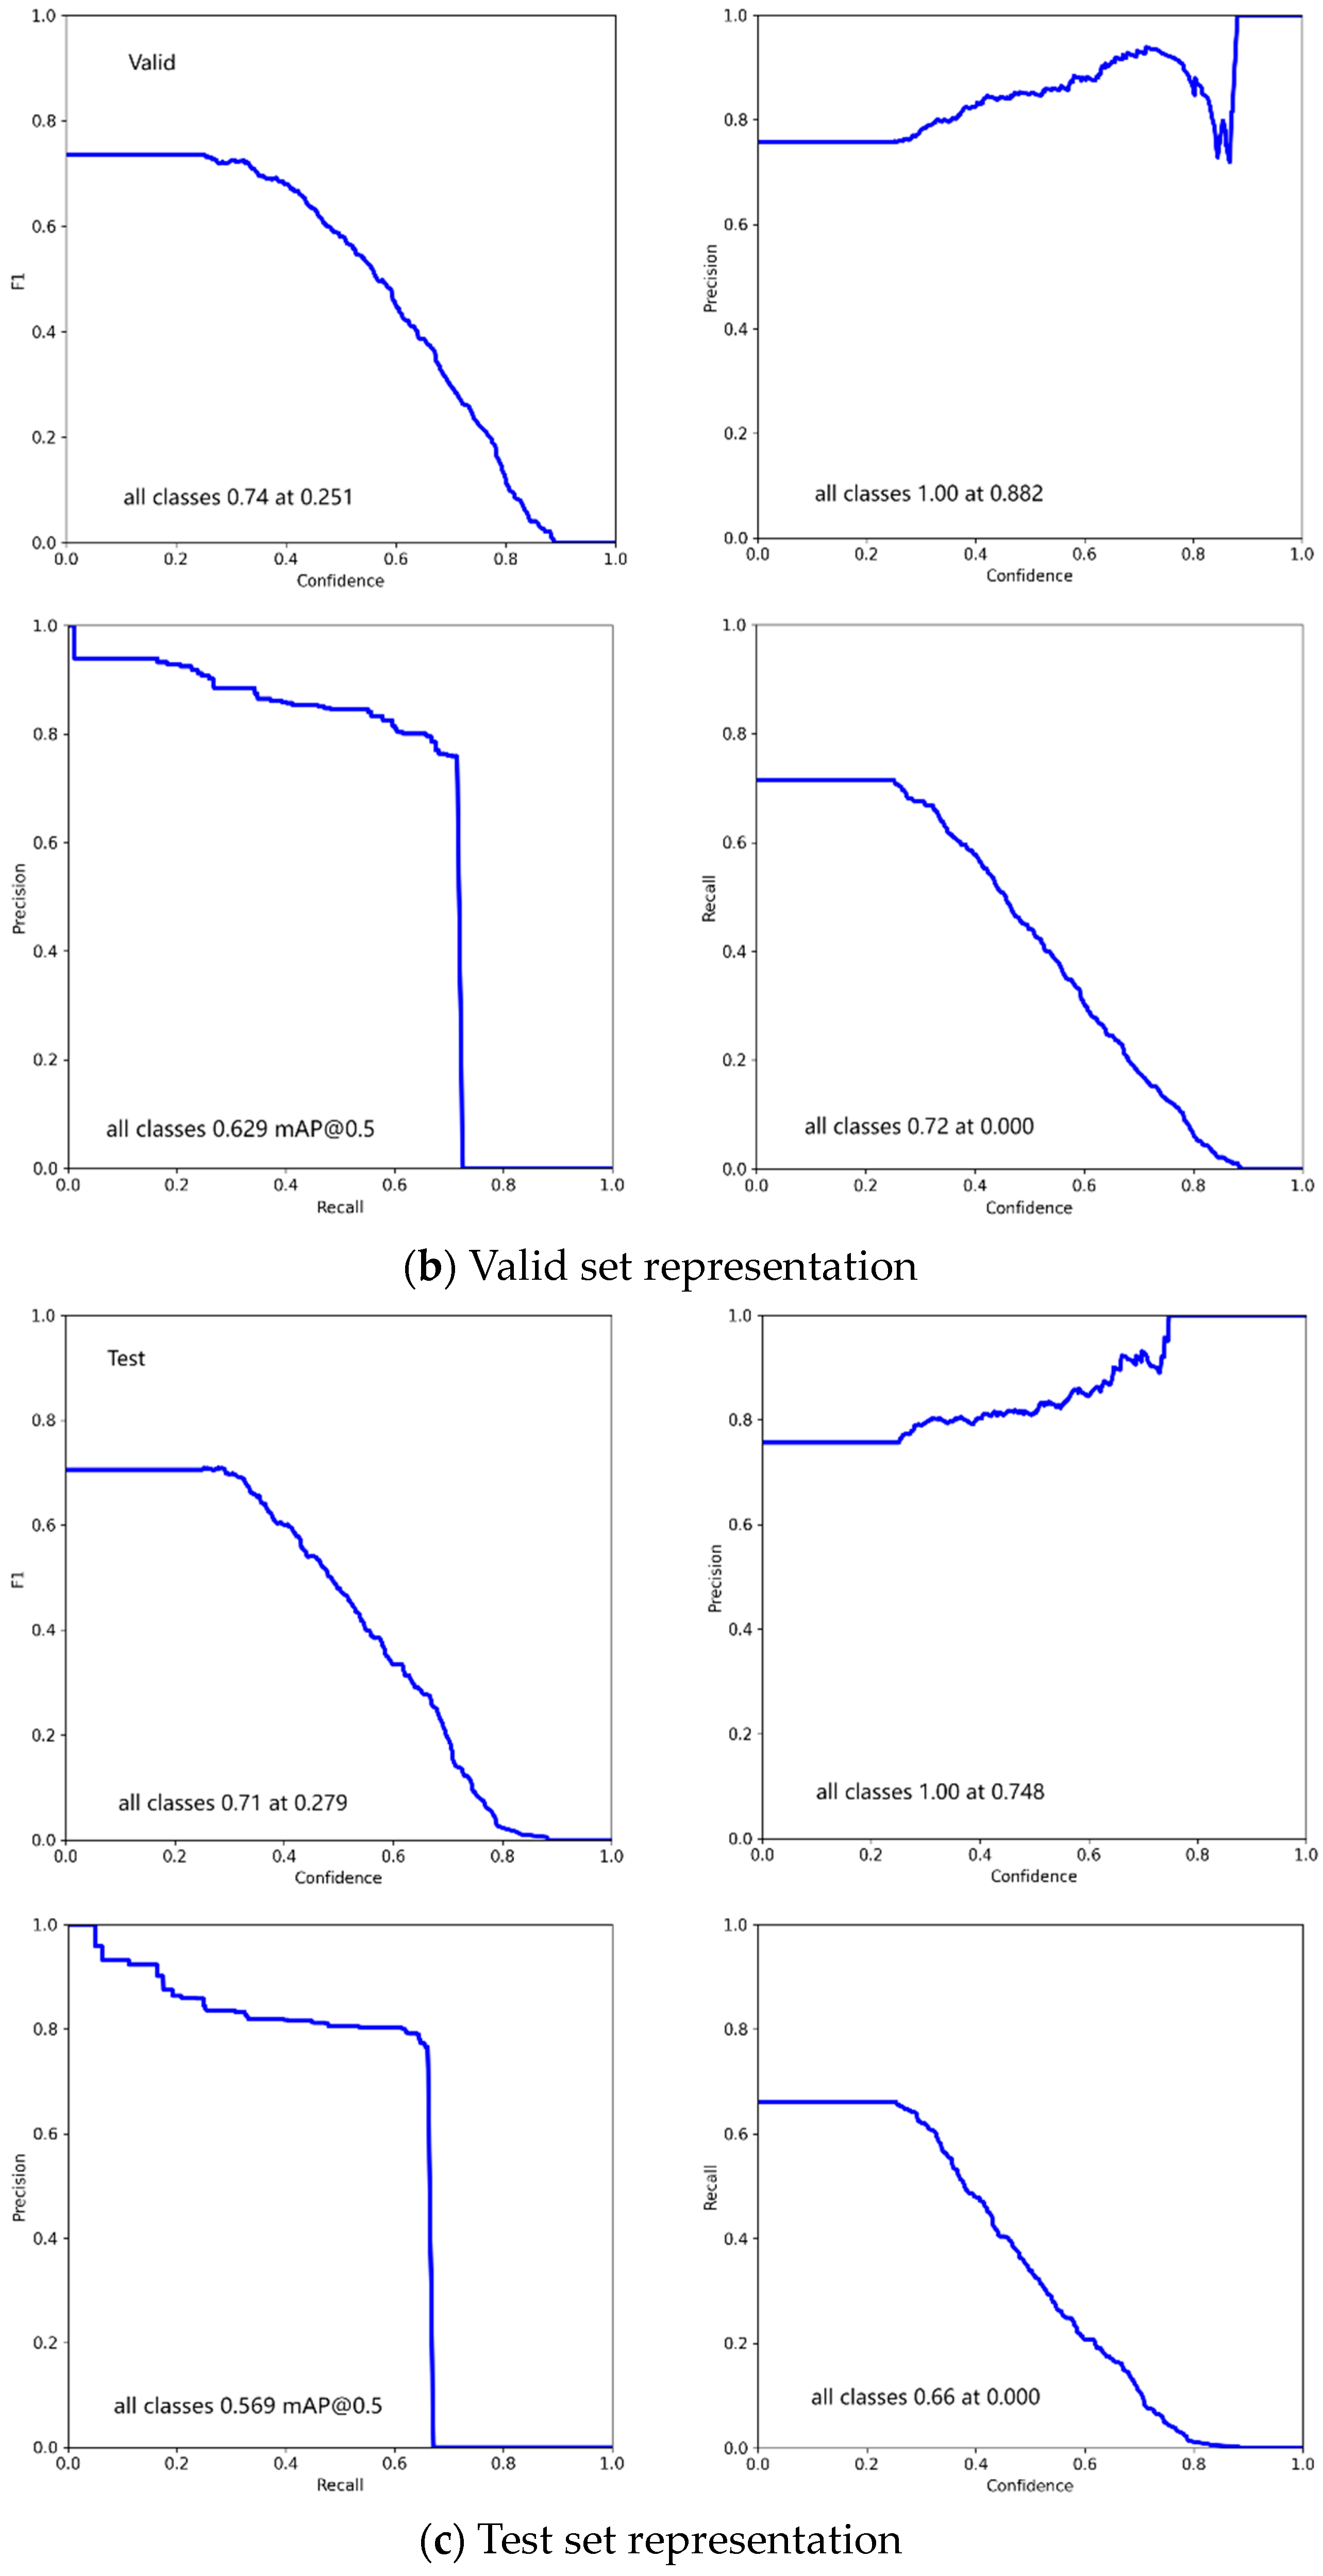
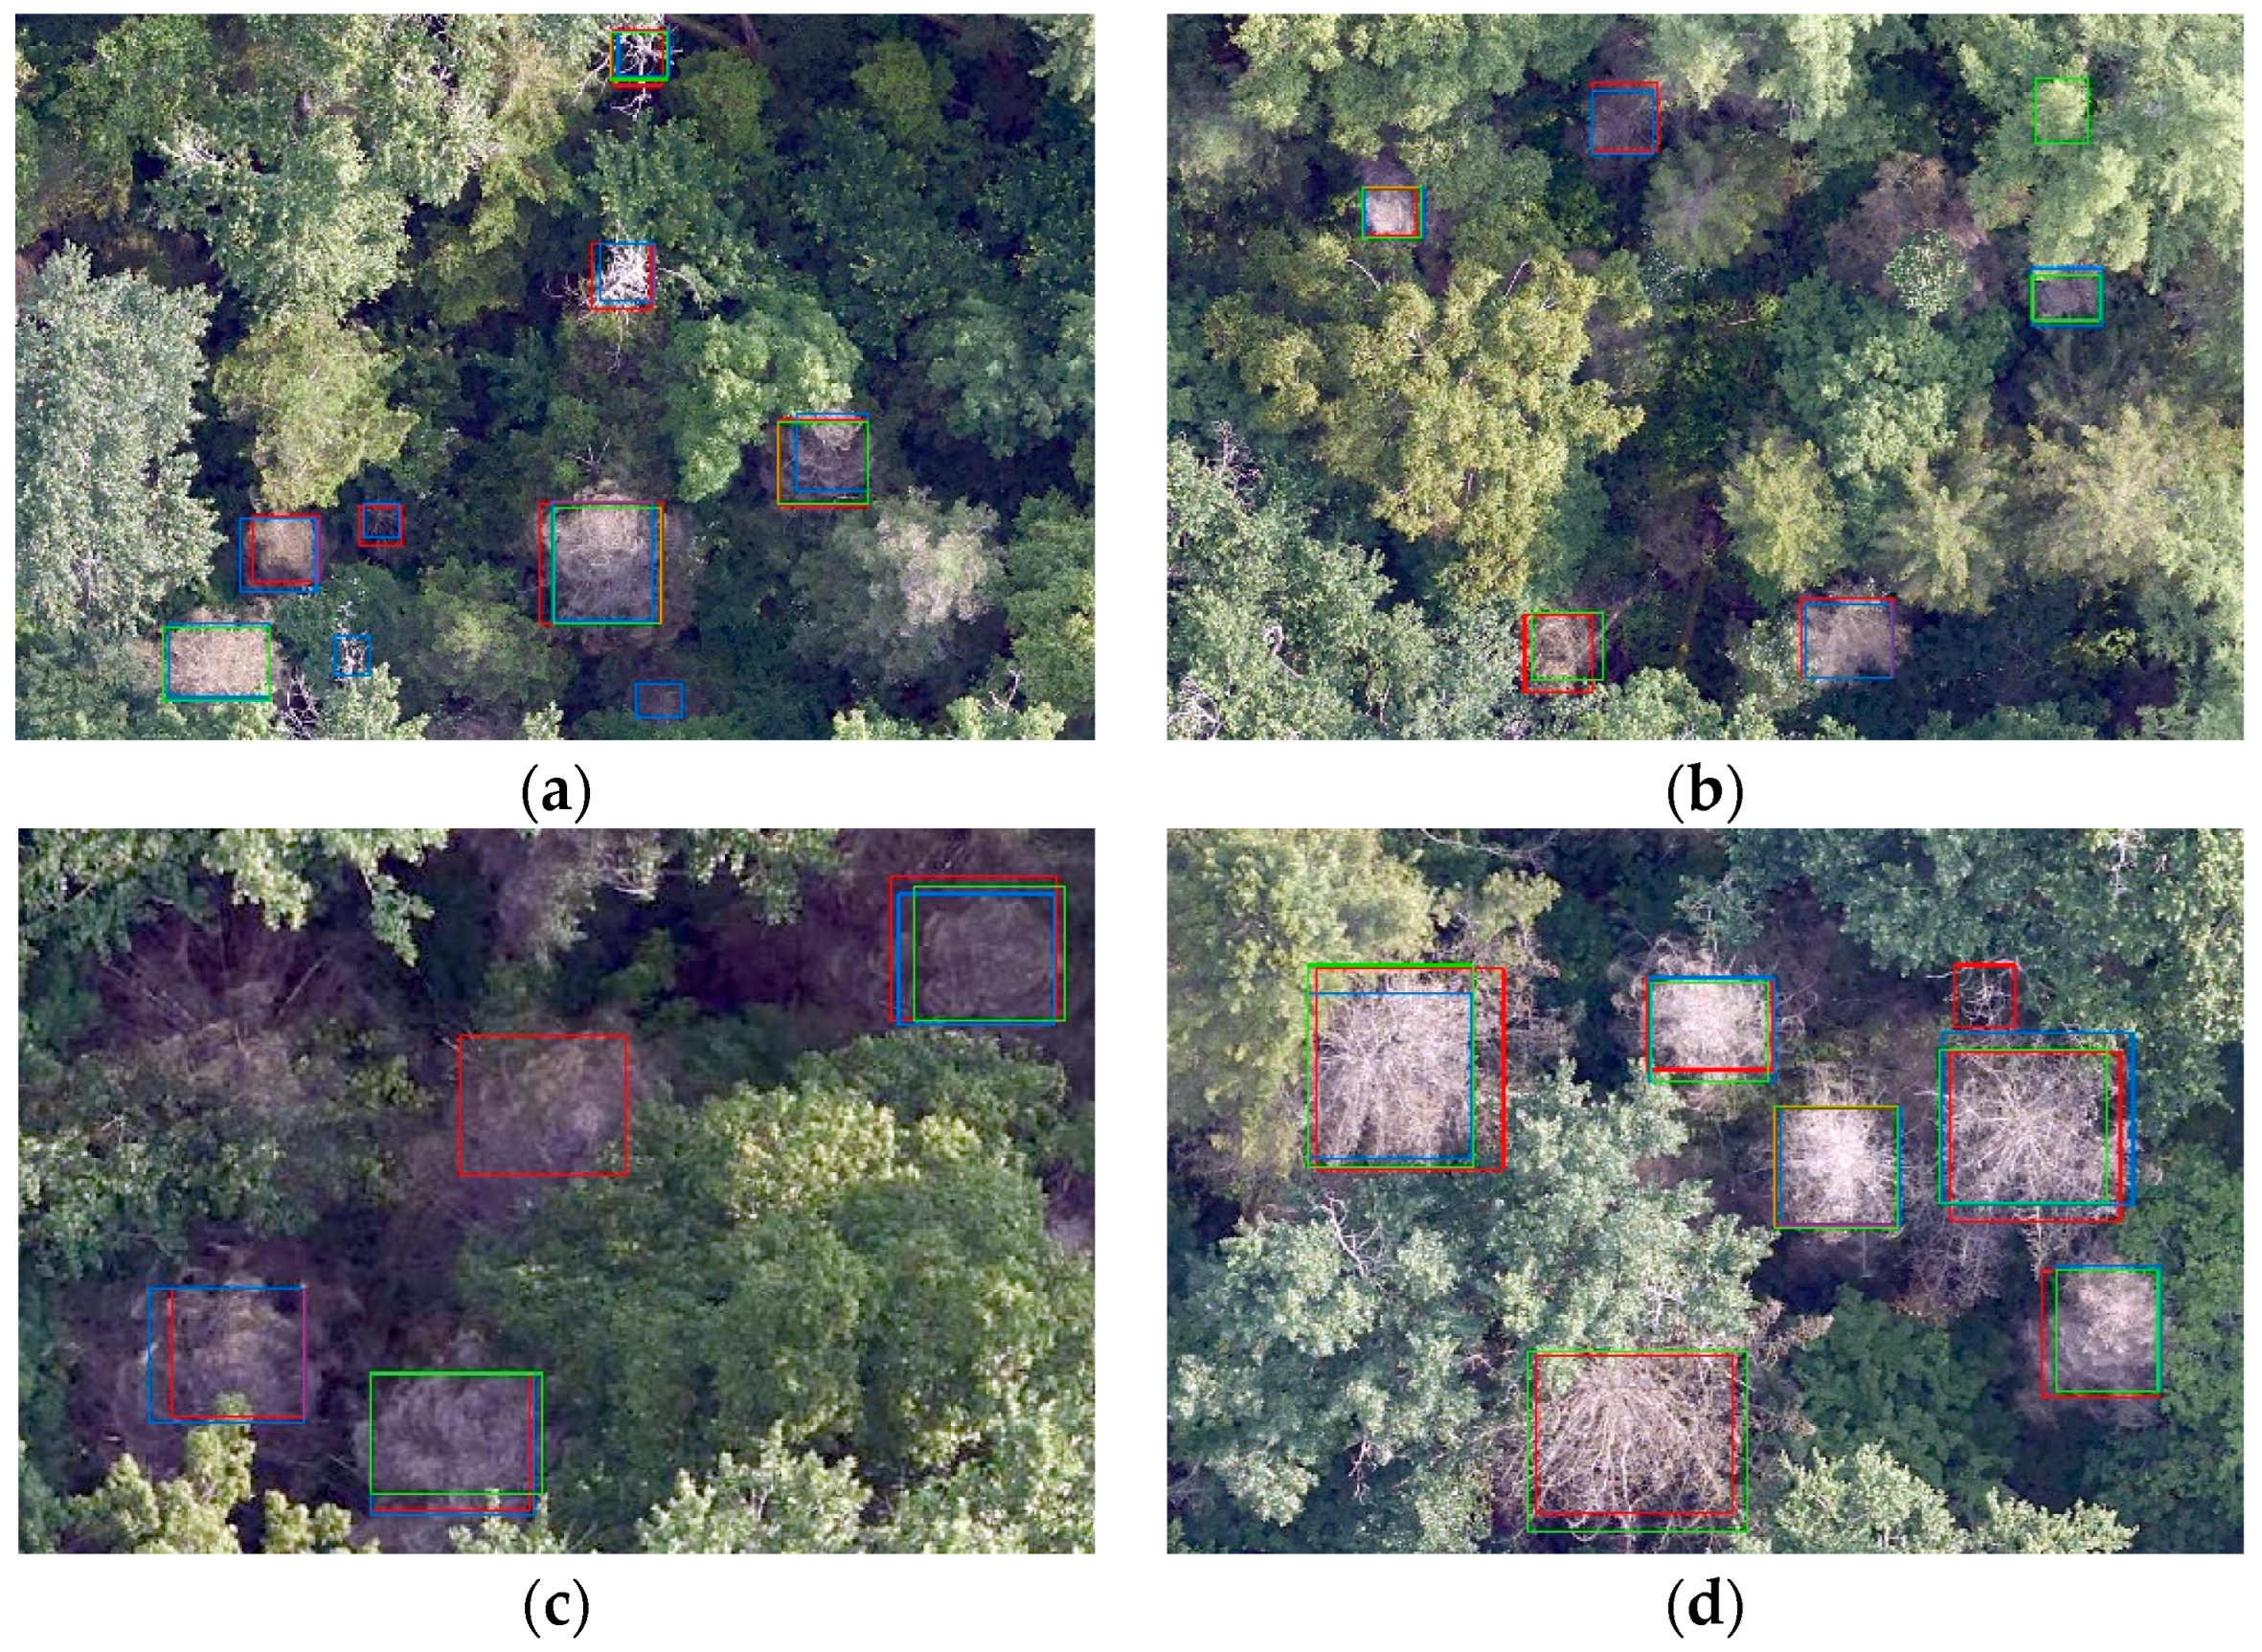
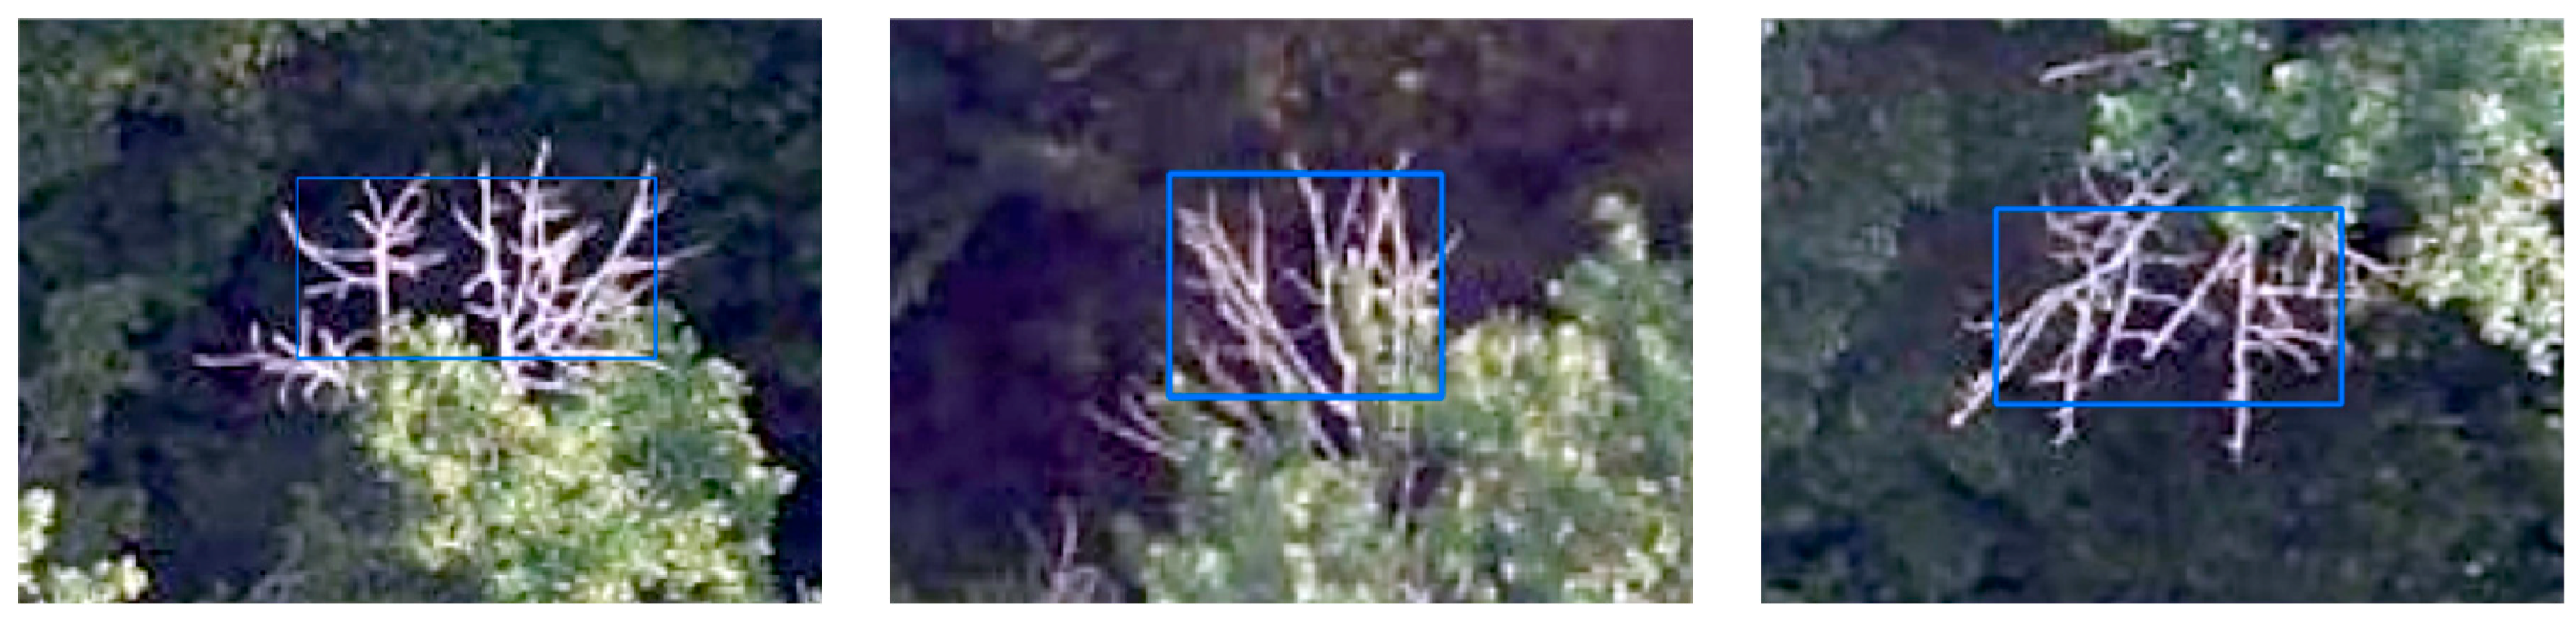
3.1. Target Detection Model Performance Analysis

Figure 8 depicts the performance evaluation of various target detection models, indicating a gradual decrease in loss function values of the model as training progresses. After surpassing 150 training iterations, the loss curves of the models exhibit a trend toward convergence and stabilization. Notably, among the five models analyzed, YOLO v7-SE demonstrates the best performance, exhibiting the lowest training loss of 0.4223.

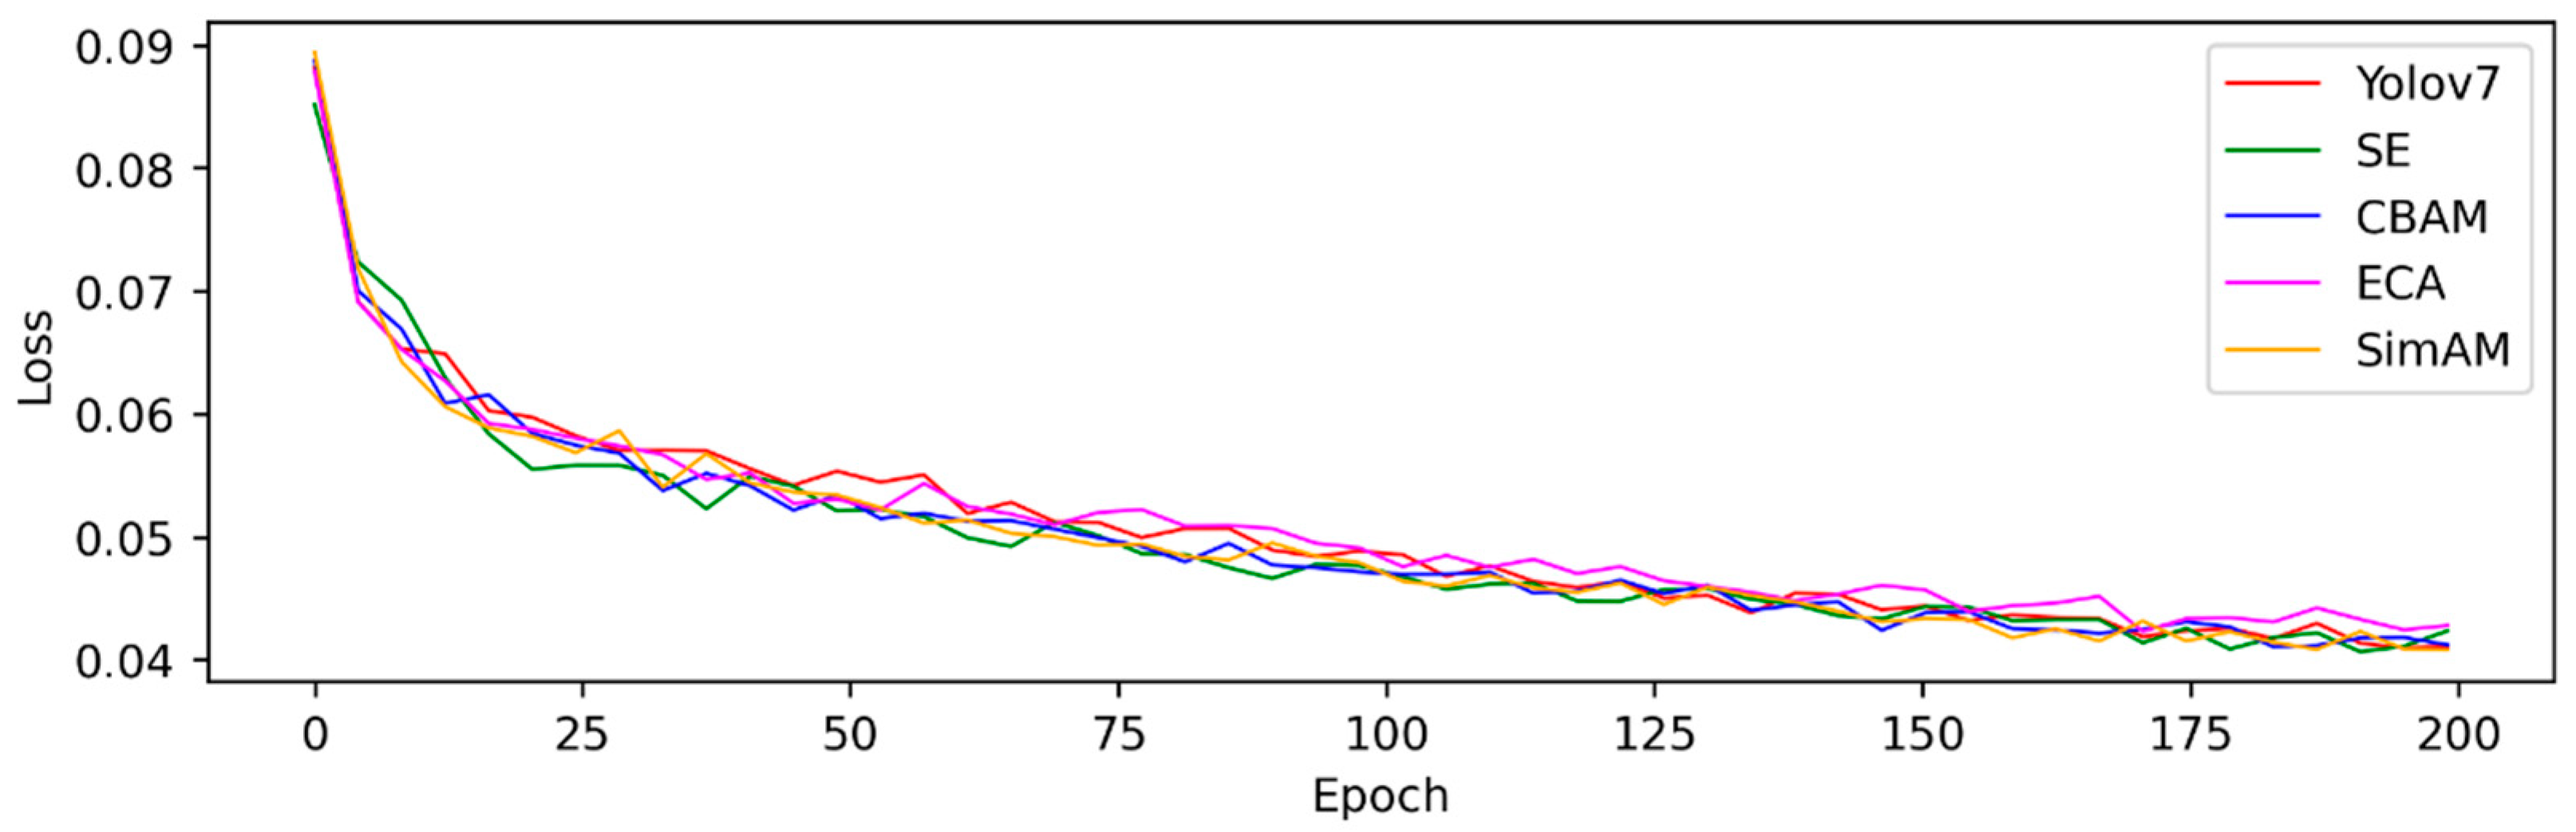
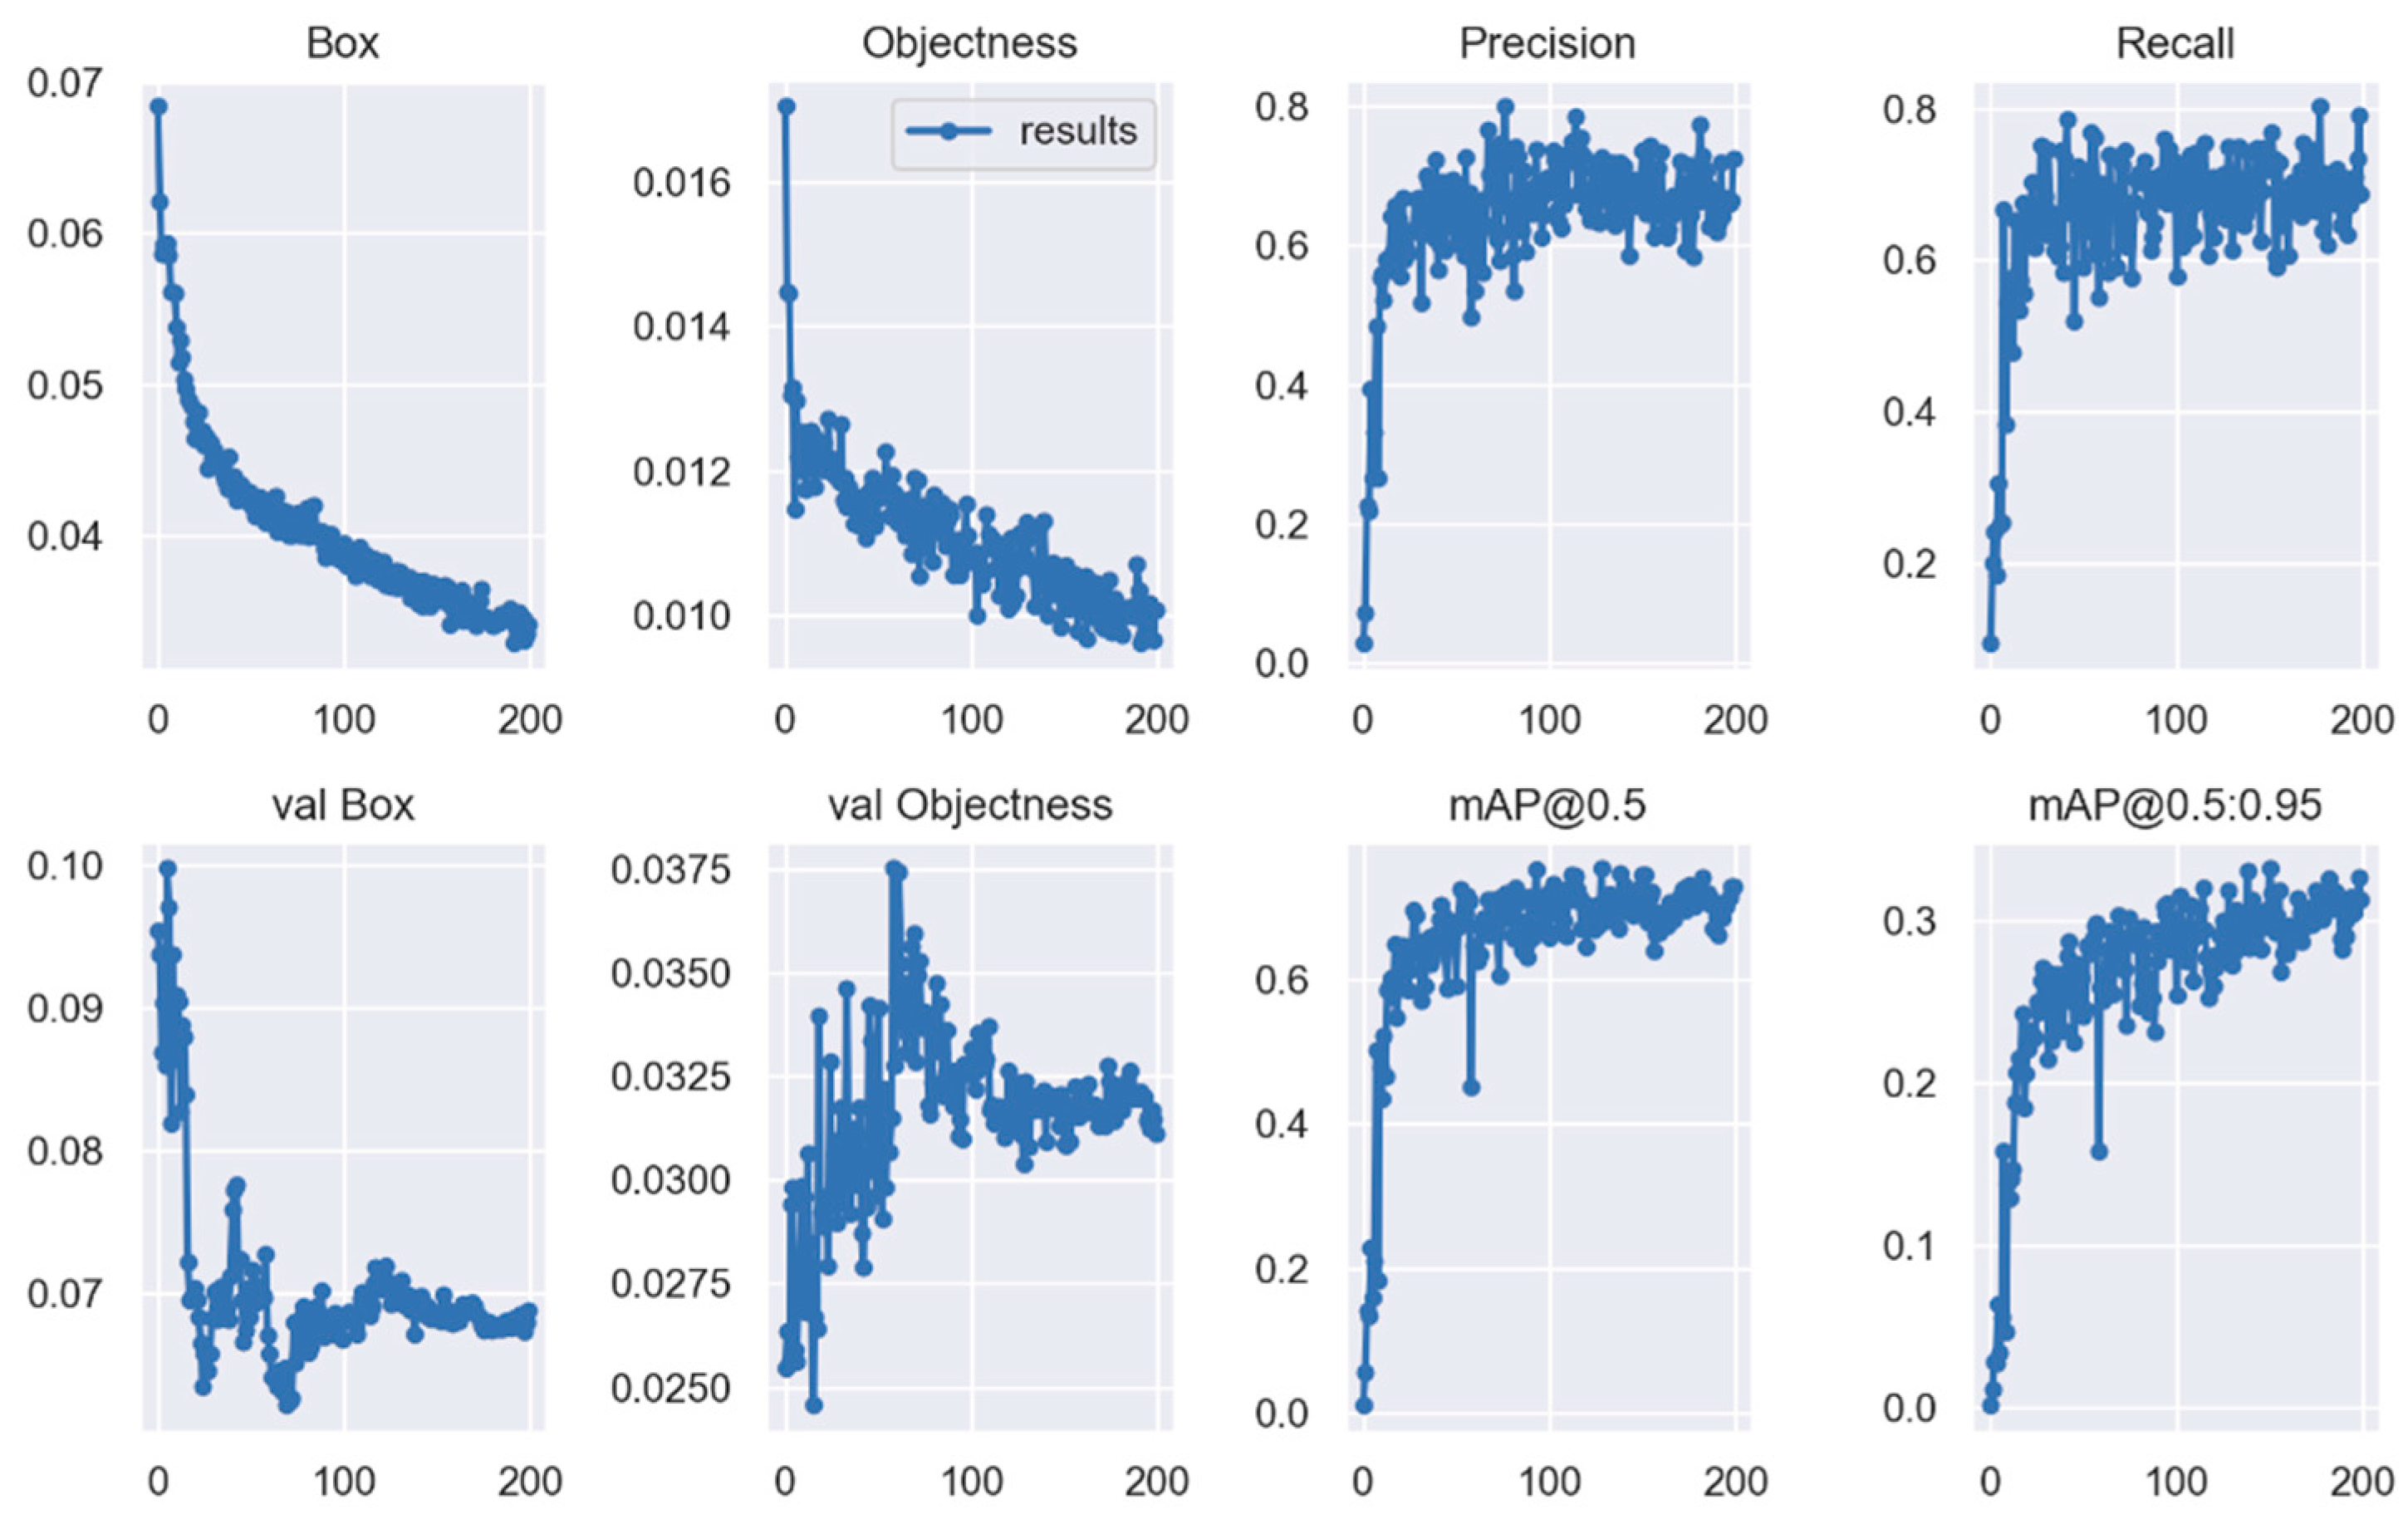
3.2. Comparative Analysis of Training Accuracy of Target Detection Model

Table 1 lists the performance metrics of the different models in accuracy, recall, and F1 scores on the test set. Among all models, YOLO v7-SE exhibits the highest accuracy, with 0.6934, surpassing YOLO v7 with 0.6739. YOLO v7-SimAM shows the highest recall rate of 0.8443, followed by YOLO v7-SE, YOLO v7-CBAM, YOLO v7, and YOLO v 7-ECA with recall rates of 0.8179, 0.8098, 0.8072, and 0.8047, respectively. Except for YOLO v7-ECA, all attention mechanism models have a recall rate exceeding that of YOLO v7. Meanwhile, only YOLO v7-SE shows a higher F1 score than that of YOLO v7 (0.7505 vs. 0.7346). Ranking third is YOLO v7-CBAM at 0.7326. Given the combined aforementioned data, we conclude that YOLO v7-SE exhibits the best performance on the test set.
Figure 9 clearly demonstrates the performance progression of YOLO v7-SE, notable for its superior F1 score, during training. The figure also includes four critical performance trajectories: F1 score versus confidence, precision versus confidence, the precision–recall relationship, and recall versus confidence. Each trajectory reveals the dynamic interaction between various performance metrics and the confidence level of the model across the training, validation, and testing stages. The model exhibits high accuracy and recall capabilities, attaining a markedly high F1 score of 0.74 during validation. However, the F1 scores slightly decrease to 0.71 during training and testing. The accuracy–confidence trajectory emphasized the high accuracy of the model at increased confidence levels; however, it exhibited a slight decrease at reduced confidence levels. Similarly, the precision–recall curve emphasizes the proficiency of the model in identifying a substantial portion of true positives, indicating a high recall rate. The recall–confidence trajectory further confirms the proficiency of the model in recognizing true positives even at decreased confidence thresholds, in spite of a slight reduction in recall rate at these thresholds. Collectively, these findings underscore a commendably consistent performance across the training set, with a marginal decrease in efficacy on the verification and test sets. The performance of the model on the validation set slightly surpasses that observed in the training and testing sets, verifying its overall effectiveness.
Figure 10 illustrates the performance metrics of YOLO v7-SE during training. The “Box” metric represents the average Generalized Intersection over Union (GIoU) loss, with lower values indicating more precise target detection. “Object-ness” refers to the average object detection loss, with smaller figures signifying higher detection accuracy. “Val BOX” denotes the loss of bounding boxes in the validation set, and “Val Object-ness” reflects the average loss of objects detected in the validation set. MAP is calculated from the area under the curve generated by plotting precision against recall, with “m” indicating the mean and the numbers following “@” specifying the Intersection over Union (IoU) thresholds used to distinguish between positive and negative samples. The range “@0.5:0.95” signifies the mean value calculated over IoU thresholds from 0.5 to 0.95 in increments of 0.05. The data presented in Figure 10 confirm that YOLO v7-SE achieves commendable results during training.

3.3. Target Detection Model Performance Analysis

Influenced by factors such as dataset labeling and limited quantity, among others, the accuracy verification results of the test set have certain limitations. To overcome these limitations, we selected a sample plot with a specific area and a specific number of PWD-affected trees in the original image for target detection. Accuracy validation of the detection results was also performed, with the results listed in Table 2 and a visual representation shown in Figure 11.
The analysis in Table 2 indicates that the SE, CBAM, and SimAM attention modules improve the detection efficiency of YOLO v7 to a certain extent. Among these modules, the SE and CBAM modules exhibit the greatest improvement effect and vary in their effects on precision and recall rates. YOLO v7-SE attains a higher precision rate (0.9281) and F1 score (0.9117) but a lower recall rate (0.8958) than those of YOLO v7-CBAM. Overall, YOLO v7-SE has a higher detection efficiency than that of YOLO v7-CBAM. The test results are shown in Figure 12. The blue box in Figure 12b shows the location and size of the detection results.
Given the aforementioned results, we selected two models with satisfactory performance—SE and CBAM—and compared them with some detection images of the original model, YOLO v7. The comparison is presented in Figure 13: the detection boxes in different colors represent the detection results of the models, with YOLO V7-SE, YOLO v7, and YOLO V7-CBAM represented by red, green, and blue boxes, respectively. Figure 13a–d of Figure 13 show the comparison of the effectiveness of the three models in detecting symptomatic trees in four different scenarios, respectively. As shown in Figure 13a,c, more instances of missed detection are found in the green detection box than in the red and blue detection boxes. In Figure 13b, misdetection occurs in the green detection box, where healthy trees are erroneously identified as symptomatic trees. As seen in Figure 13d, compared with the blue and green detection boxes, the red detection box has more accurate and comprehensive results. Thus, the YOLO v7-SE model, denoted by the red detection box, demonstrates the most effective detection.
In addition, in detecting symptomatic trees, YOLO v7-CBAM has a low detection precision rate owing to its incorrect identification of the exposed trunks of healthy trees, which share similar color characteristics with those of affected trees. A schematic is shown in Figure 14. The blue box in Figure 14 shows the error detection results of YOLO v7-CBAM. Therefore, YOLO v7-SE exhibits the highest detection efficiency.

4. Discussion

PWD has considerably harmed forests worldwide, emphasizing the urgent need for accurate identification of symptomatic trees. Conventional detection techniques encounter challenges, such as labor-intensive processes, inefficiency, subjectivity, and limited scalability. These hindrances can be addressed by adopting deep learning technologies that can automate the identification of symptomatic trees with the use of high-resolution imagery. In addition, the effectiveness of these detection processes can be enhanced by incorporating attention mechanisms.
In this study, forest helicopter aerial survey images with a spatial resolution of 0.03 m served as the dataset. Symptomatic trees in the images were identified using the YOLO v7 model combined with attention mechanisms. Ultimately, YOLO v7-SE exhibited the best performance, achieving an F1 score of 0.9117, a recall rate of 0.8958, and detection accuracy of 0.9281. These results exceed the accuracy achieved using the RF (Random Forest) method (0.91) [4] and the average accuracy achieved using the SVM (Support Vector Machine) method (0.9036) [6]. Moreover, the F1 score (0.79) obtained from detection outcomes using the SCANet recognition network introduced by Qin et al. [13] underscores the superior effectiveness of our research results. In comparison and analysis with other studies using the YOLO series of networks to detect PWD, for the method integrating semi-supervised samples into the YOLOV7 object detection network [28], our accuracy rate is higher, but the recall rate is slightly behind. In addition, the F1 score achieved in this study (0.9117) is higher than that of the YOLO v5 model improved using Simplified Spatial Pyramid Pooling Fast (SimSPPF) (0.883) [29].
Despite the encouraging results, certain limitations were identified. The method requires an improvement in balancing recall and accuracy. Although YOLO v7-SE has a higher F1 score and accuracy than those of YOLO v7-CBAM, its recall rate is lower than that of YOLO v7-SE. These findings indicate that the SE and CBAM attention mechanisms exert different enhancing effects on the accuracy and recall rate of YOLO v7. The complementary strengths of these models can be integrated into different parts of the model as a hybrid mechanism to enhance the overall performance of the model.
Another significant limitation to note is that, while the model demonstrates proficiency in detecting trees symptomatic of PWD, it does so by identifying characteristics such as color changes. However, it is unable to definitively ascertain if the trees exhibiting these symptoms are indeed affected by PWN based solely on these observable traits, due to their nonspecific nature. Consequently, ground-based sample collection and subsequent analysis by trained professionals in a nematology laboratory are imperative for the confirmation of PWN presence.
In conclusion, integrating attention mechanism technology with deep learning models for object detection, as investigated in the present study, holds significant potential for identifying trees with PWD symptoms. This approach could lead to more efficient and effective strategies for managing and controlling the spread of PWN in forests.

5. Conclusions

In this study, high-resolution images of a forest area served as the dataset. Detection of PWD-symptomatic trees in the area was conducted using deep learning technology and attention mechanisms. Results indicate that the original model, YOLO v7, attained a detection F1 score of 0.8288, with improved accuracy upon the integration of the attention mechanism. YOLO v7-SE exhibited the highest detection F1 score (0.9117), a detection accuracy of 0.9281, and a recall rate of 0.8958. Efficient and accurate automatic detection of diseased pine trees in forest images was realized, providing reliable assistance for disease prevention and control in forested areas. In addition, the SE and CBAM attention mechanisms exerted distinct effects on improving the precision rate and recall of YOLO v7. To leverage their complementary strengths, we will consider incorporating both mechanisms into different parts of the model as a hybrid attention mechanism for further model enhancement.

Author Contributions

Conceptualization, X.Z. and R.W.; methodology, X.Z.; software, X.Z.; validation, X.Z., X.L., Y.R., W.S. and S.X.; writing—original draft preparation, X.Z.; writing—review and editing, X.Z.; visualization, X.Z.; supervision, X.Z. and X.W.; project administration, R.W.; funding acquisition, R.W. All authors have read and agreed to the published version of the manuscript.

Funding

National Natural Science Foundation of China ‘biomass precision estimation model research for large-scale region based on multi-view heterogeneous stereographic image pair of forest’ (41971376). The project was funded by National Natural Science Foundation of China (NSFC).

Data Availability Statement

The data presented in this study are available on request from the corresponding author.

Conflicts of Interest

Author Wei Shi was employed by the company Beijing Ocean Forestry Technology Co., Ltd. The remaining authors declare that the research was conducted in the absence of any commercial or financial relationships that could be construed as a potential conflict of interest. The Beijing Ocean Forestry Technology Co., Ltd. had no role in the design of the study; in the collection, analyses, or interpretation of data; in the writing of the manuscript, or in the decision to publish the results.

References

  1. Proença, D.N.; Grass, G.; Morais, P.V. Understanding Pine Wilt Disease: Roles of the Pine Endophytic Bacteria and of the Bacteria Carried by the Disease-causing Pine wood Nematode. MicrobiologyOpen 2017, 6, e00415. [Google Scholar] [CrossRef] [PubMed]
  2. Li, M.; Li, H.; Ding, X.; Wang, L.; Wang, X.; Chen, F.J.I.J.o.M.S. The detection of pine wilt disease: A literature review. Int. J. Mol. Sci. 2022, 23, 10797. [Google Scholar] [CrossRef] [PubMed]
  3. Mota, M.; Ribeiro, B.; Carrasquinho, I.; Ribeiro, P.; Evaristo, I.; Costa, R.; Vieira, P.; Vasconcelos, M. Pine Wilt Disease and the Pine Wood Nematode: A Threat to Mediterranean Pine Forests; Universidade de Évora: Évora, Portugal, 2011. [Google Scholar]
  4. Iordache, M.-D.; Mantas, V.; Baltazar, E.; Lewyckyj, N.; Souverijns, N. Application of Random Forest Classification to Detect the Pine Wilt Disease from High Resolution Spectral Images. In Proceedings of the IGARSS 2020—2020 IEEE International Geoscience and Remote Sensing Symposium, Waikoloa, HI, USA, 26 September–2 October 2020; pp. 4489–4492. [Google Scholar] [CrossRef]
  5. Sun, Z.; Wang, Y.; Pan, L.; Xie, Y.; Zhang, B.; Liang, R.; Sun, Y. Pine wilt disease detection in high-resolution UAV images using object-oriented classification. J. For. Res. 2022, 33, 1377–1389. [Google Scholar] [CrossRef]
  6. Syifa, M.; Park, S.J.; Lee, C.W. Detection of the pine wilt disease tree candidates for drone remote sensing using artificial intelligence techniques. Engineering 2020, 6, 919–926. [Google Scholar] [CrossRef]
  7. Yu, B.; Liu, Y.; Zhao, T. Counting of pine trees nematode disease trees based on threshold segmentation. In Journal of Physics: Conference Series; IOP Publishing: Bristol, UK, 2021; Volume 1961, No. 1. [Google Scholar]
  8. Lee, S.; Park, S.J.; Baek, G.; Kim, H.; Lee, C.W. Detection of damaged pine tree by the pine wilt disease using UAV Image. Korean J. Remote Sens. 2019, 35, 359–373. [Google Scholar]
  9. Zhang, Y.; Dian, Y.; Zhou, J.; Peng, S.; Hu, Y.; Hu, L.; Han, Z.; Fang, X.; Cui, H. Characterizing spatial patterns of pine trees nematode outbreaks in subtropical zone in China. Remote Sens. 2021, 13, 4682. [Google Scholar] [CrossRef]
  10. Hu, W.; Huang, Y.; Wei, L.; Zhang, F.; Li, H. Deep Convolutional Neural Networks for Hyperspectral Image Classification. J. Sens. 2015, 2015, 258619. [Google Scholar] [CrossRef]
  11. Han, Z.; Hu, W.; Peng, S.; Lin, H.; Zhang, J.; Zhou, J.; Wang, P.; Dian, Y. Detection of Standing Dead Trees after Pine Wilt Disease Outbreak with Airborne Remote Sensing Imagery by Multi-Scale Spatial Attention Deep Learning and Gaussian Kernel Approach. Remote Sens. 2022, 14, 3075. [Google Scholar] [CrossRef]
  12. Park, H.G.; Yun, J.P.; Kim, M.Y.; Jeong, S.H. Multichannel Object Detection for Detecting Suspected Trees with Pine Wilt Disease Using Multispectral Drone Imagery. IEEE J. Sel. Top. Appl. Earth Obs. Remote Sens. 2021, 14, 8350–8358. [Google Scholar] [CrossRef]
  13. Qin, J.; Wang, B.; Wu, Y.; Lu, Q.; Zhu, H. Identifying Pine Trees Nematode Disease Using UAV Images and Deep Learning Algorithms. Remote Sens. 2021, 13, 162. [Google Scholar] [CrossRef]
  14. Hu, X.; Ban, Y.; Nascetti, A. Uni-Temporal Multispectral Imagery for Burned Area Mapping with Deep Learning. Remote Sens. 2021, 13, 1509. [Google Scholar] [CrossRef]
  15. Deng, X.; Tong, Z.; Lan, Y.; Huang, Z. Detection and Location of Dead Trees with Pine Wilt Disease Based on Deep Learning and UAV Remote Sensing. AgriEngineering 2020, 2, 294–307. [Google Scholar] [CrossRef]
  16. Sun, Z.; Ibrayim, M.; Hamdulla, A. Detection of Pine Wilt Nematode from Drone Images Using UAV. Sensors 2022, 22, 4704. [Google Scholar] [CrossRef] [PubMed]
  17. Fukui, H.; Hirakawa, T.; Yamashita, T.; Fujiyoshi, H. Attention Branch Network: Learning of Attention Mechanism for Visual Explanation. In Proceedings of the 2019 IEEE/CVF Conference on Computer Vision and Pattern Recognition (CVPR), Long Beach, CA, USA, 10–15 June 2019; IEEE: Piscataway, NJ, USA, 2019; pp. 10697–10706. [Google Scholar]
  18. Zhu, X.; Cheng, D.; Zhang, Z.; Lin, S.; Dai, J. An Empirical Study of Spatial Attention Mechanisms in Deep Networks. In Proceedings of the 2019 IEEE/CVF International Conference on Computer Vision (ICCV), Seoul, Republic of Korea, 27 October–2 November 2019; IEEE: Piscataway, NJ, USA, 2019; pp. 6687–6696. [Google Scholar]
  19. Lieskovská, E.; Jakubec, M.; Jarina, R.; Chmulík, M. A Review on Speech Emotion Recognition Using Deep Learning and Attention Mechanism. Electronics 2021, 10, 1163. [Google Scholar] [CrossRef]
  20. Qin, B.; Sun, F.; Shen, W.; Dong, B.; Ma, S.; Huo, X.; Lan, P. Deep Learning-Based Pine Nematode Trees’ Identification Using Multispectral and Visible UAV Imagery. Drones 2023, 7, 183. [Google Scholar] [CrossRef]
  21. Ge, C.; Li, F.; Sun, F.; Wang, Z.; Lan, P. A Monitoring Scheme for Pine Wood Nematode Disease Tree Based on Deep Learning and Ground Monitoring. In Signal and Information Processing, Networking and Computers; Springer: Singapore, 2023; pp. 1268–1275. [Google Scholar]
  22. Wang, C.-Y.; Bochkovskiy, A.; Liao, H.-Y.M. YOLOv7: Trainable Bag-of-Freebies Sets New State-of-the-Art for Real-Time Object Detectors. In Proceedings of the IEEE/CVF Conference on Computer Vision and Pattern Recognition, Vancouver, BC, Canada, 17–24 June 2023. [Google Scholar]
  23. Bochkovskiy, A.; Wang, C.-Y.; Liao, H.-Y.M. YOLOv4: Optimal Speed and Accuracy of Object Detection. arXiv 2020, arXiv:2004.10934. [Google Scholar]
  24. Hu, J.; Shen, L.; Albanie, S.; Sun, G.; Wu, E. Squeeze-and-Excitation Networks. arXiv 2019, arXiv:1709.01507. [Google Scholar]
  25. Wang, Q.; Wu, B.; Zhu, P.; Li, P.; Zuo, W.; Hu, Q. ECA-Net: Efficient Channel Attention for Deep Convolutional Neural Networks. arXiv 2020, arXiv:1910.03151. [Google Scholar]
  26. Woo, S.; Park, J.; Lee, J.-Y.; Kweon, I.S. CBAM: Convolutional Block Attention Module. arXiv 2018, arXiv:1807.06521. [Google Scholar]
  27. Yang, L.; Zhang, R.Y.; Li, L.; Xie, X. Simam: A simple, parameter-free attention module for convolutional neural networks. In Proceedings of the International Conference on Machine Learning, Virtual Event, 18–24 July 2021; PMLR. Volume 139, pp. 11863–11874. [Google Scholar]
  28. Huang, X.; Gang, W.; Li, J.; Wang, Z.; Wang, Q.; Liang, Y. Extraction of pine wilt disease based on a two-stage unmanned aerial vehicle deep learning method. J. Appl. Remote Sens. 2024, 18, 014503. [Google Scholar] [CrossRef]
  29. Ye, X.; Pan, J.; Shao, F.; Liu, G.; Lin, J.; Xu, D.; Liu, J. Exploring the potential of visual tracking and counting for trees infected with pine wilt disease based on improved YOLOv5 and StrongSORT algorithm. Comput. Electron. Agric. 2024, 218, 108671. [Google Scholar] [CrossRef]
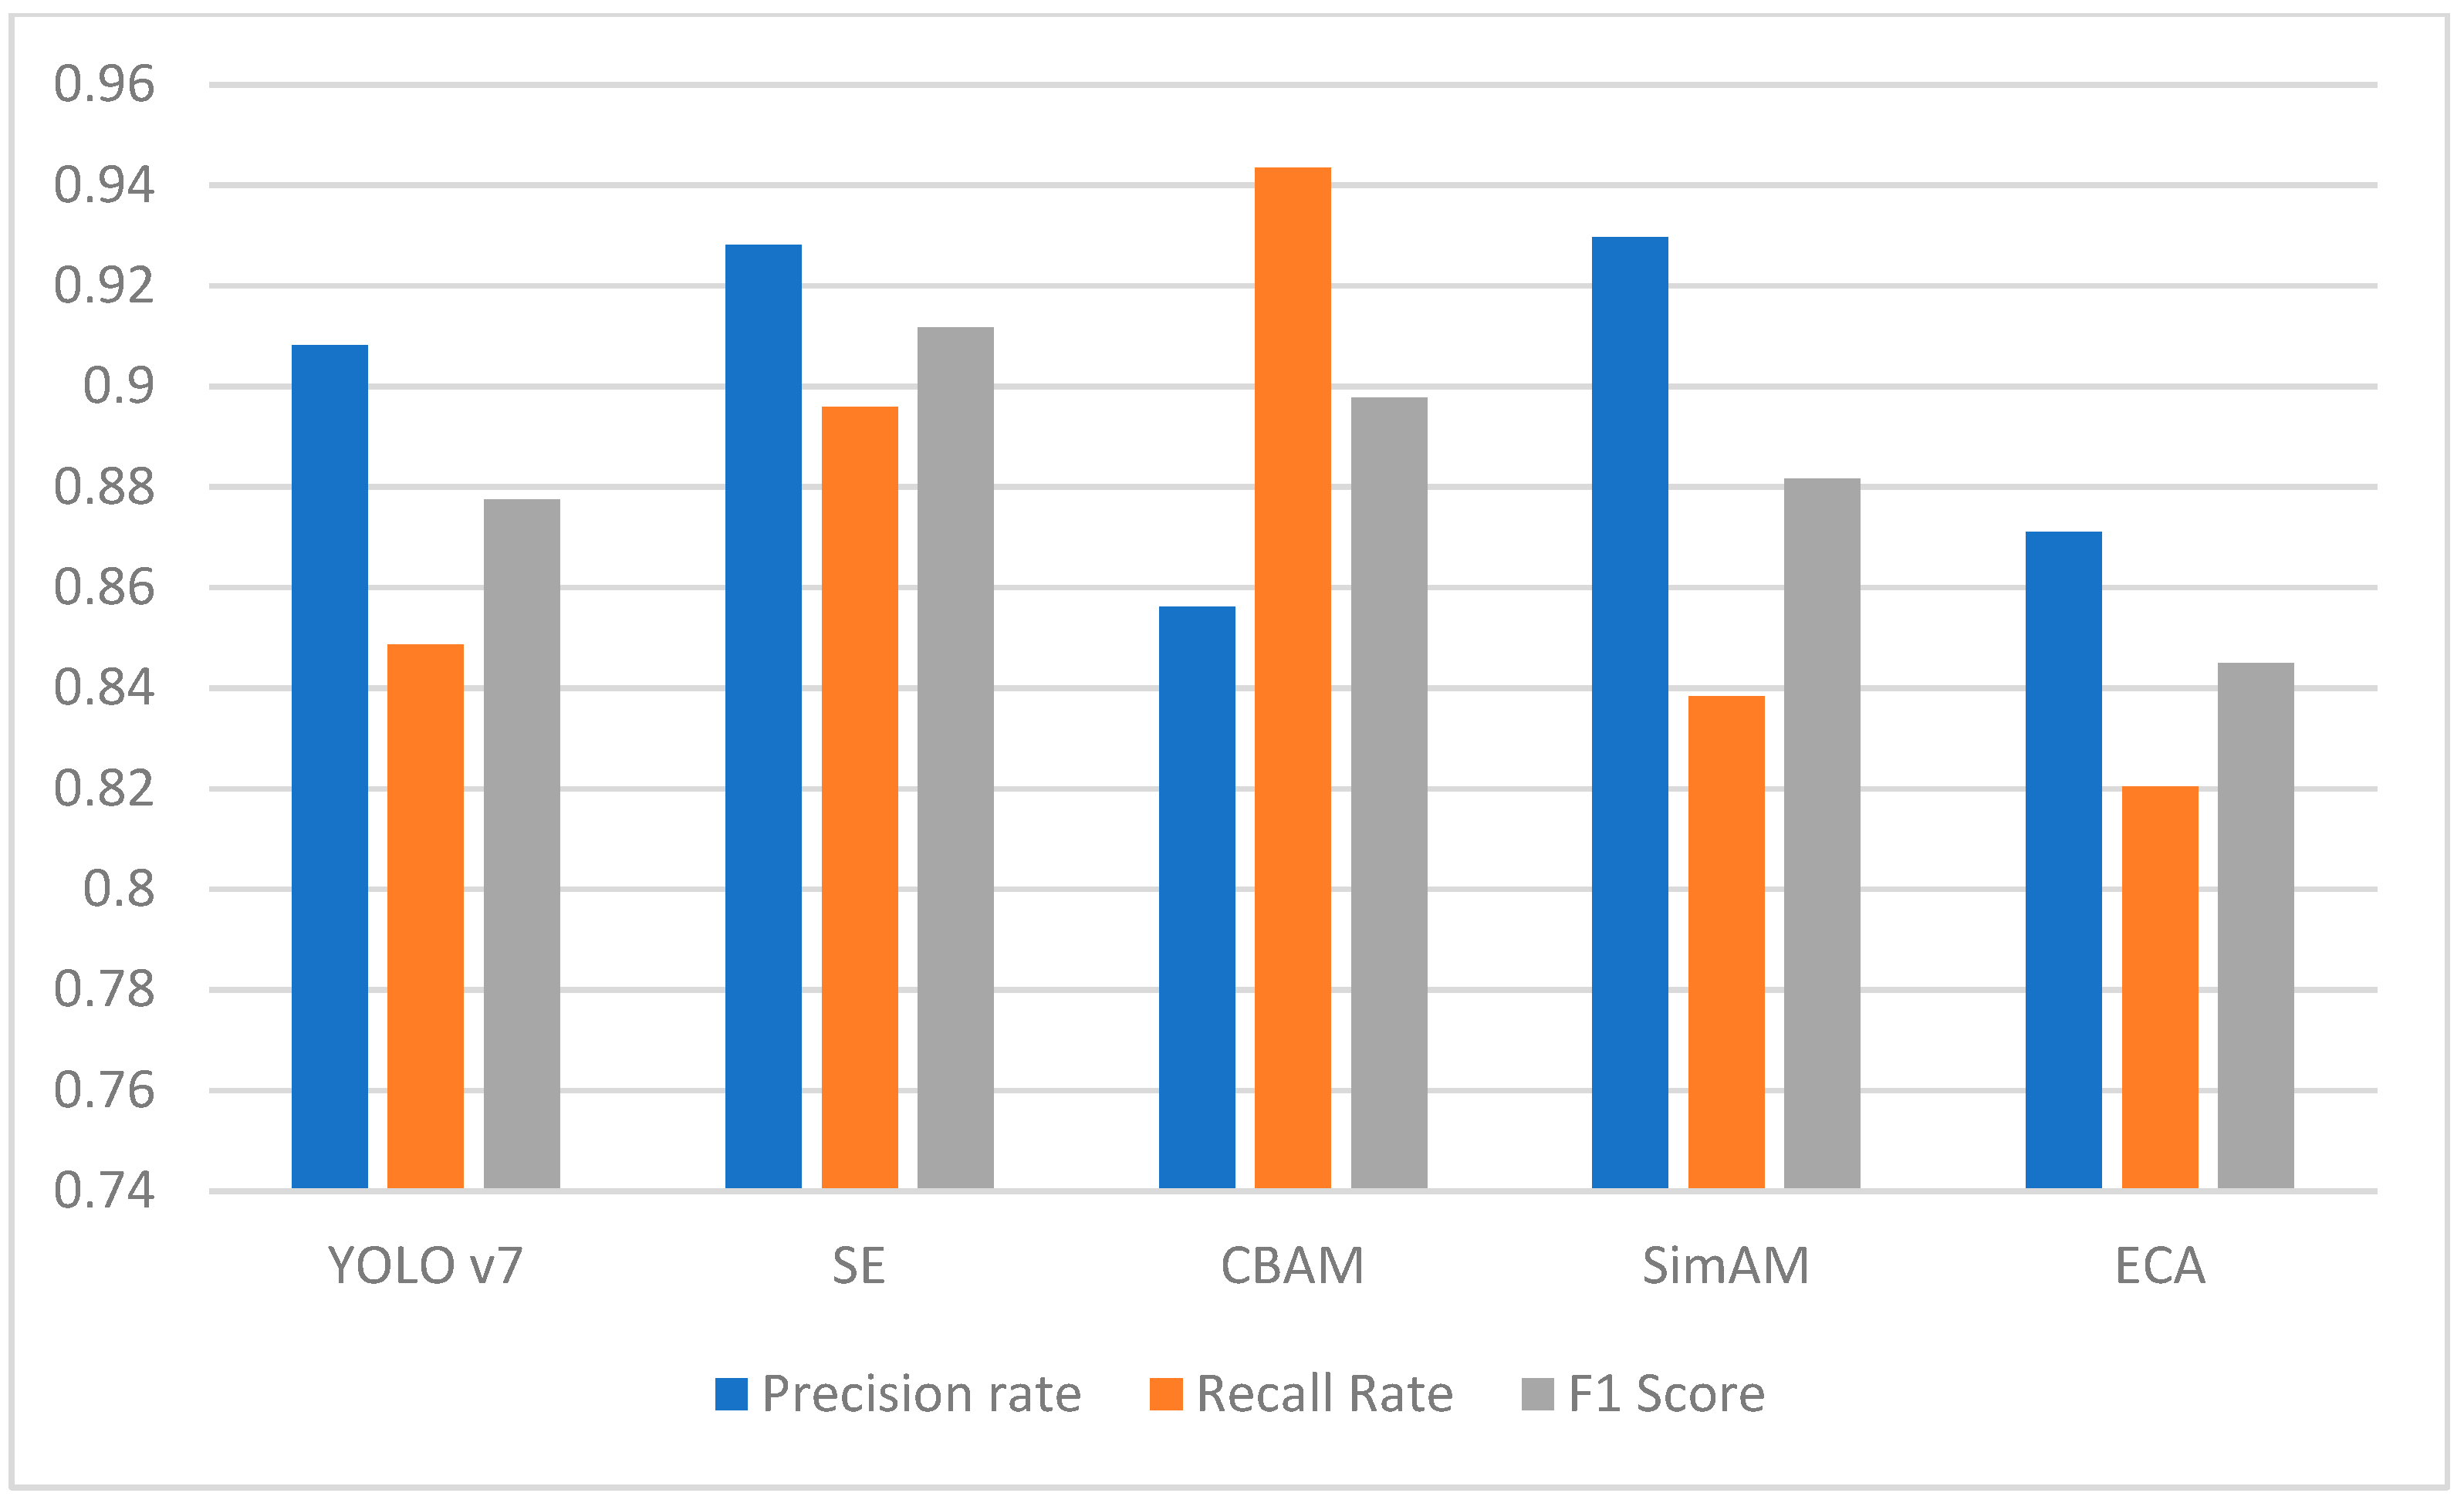
Figure 1. Location of the study area. (a) Jilin Province is represented in red color on the map of China; (b) The location of the Baihe Administration Station is indicated by a red circle on the map of Jilin Province; (c) Natural color image of the study area obtained via helicopter.
Forests 15 00691 g001
Figure 2. Sample annotation schematic of the target detection model dataset. With the yellow box indicating information about the location and size of the symptomatic trees.
Forests 15 00691 g002
Figure 3. Graphical representation of proposed model.
Forests 15 00691 g003
Figure 4. Improved YOLO v7 model structure diagram. With different colors representing different functional modules, where dark blue is the added attention mechanism module.
Forests 15 00691 g004
Figure 5. Inflation forecast diagram and comparison of optimization effect before and after. With the pink box in (b) presenting the detection results before inflation prediction, and the green box in (c) showing the detection results after inflation prediction.
Forests 15 00691 g005
Figure 6. Non-maximum suppression (NMS) optimization effect comparison chart. With the green box in (a) presenting the detection results before NMS, and the blue box in (b) showing the detection results after NMS.
Forests 15 00691 g006
Figure 7. Attention mechanism module: SE: Squeeze-and-Excitation, ECA: Efficient Channel Attention, CBAM: Convolutional Block Attention Module, SimAM: Simplified Attention Module.
Forests 15 00691 g007
Figure 8. Performance comparison of object detection.
Forests 15 00691 g008
Figure 9. YOLO v7-SE model performance demonstration.
Forests 15 00691 g009aForests 15 00691 g009b
Figure 10. YOLO v7-SE training results.
Forests 15 00691 g010
Figure 11. Comparison table of target detection model performance.
Forests 15 00691 g011
Figure 12. Target detection results graph. With the blue box in (b) showing the location and size of the detection results.
Forests 15 00691 g012
Figure 13. Comparison of detection results of YOLO v7, YOLO v 7-SE, and YOLO v 7-CBAM. (ad) show the comparison of the effectiveness of the three models in detecting symptomatic trees in four different scenarios, respectively, with green representing YOLO v7, red representing YOLO v 7-SE, and blue representing YOLO v7-CBAM.
Forests 15 00691 g013
Figure 14. YOLO v7-CBAM error detection schematic. With the blue box showing the error detection results of YOLO v7-CBAM.
Forests 15 00691 g014
Table 1. Evaluation table of the performance indicators of the model on the test set.
PrecisionRecallF1
YOLO v70.67390.80720.7346
SE0.69340.81790.7505
CBAM0.66880.80980.7326
SimAM0.63670.84430.7259
ECA0.64870.80470.7183
Table 2. Comparison table of target detection model performance.
YOLO v7SECBAMSimAMECA
Manual detection of
symptomatic trees
18431843184318431843
Model detection of
symptomatic trees
17221779203116621736
Correct detection of
symptomatic trees
15641651173915451512
Precision rate0.90820.92810.85620.92960.8710
Recall rate0.84860.89580.94350.83830.8204
F1 score0.87740.91170.89770.88160.8449
Disclaimer/Publisher’s Note: The statements, opinions and data contained in all publications are solely those of the individual author(s) and contributor(s) and not of MDPI and/or the editor(s). MDPI and/or the editor(s) disclaim responsibility for any injury to people or property resulting from any ideas, methods, instructions or products referred to in the content.

