Abstract
The situation of rocky desertification in the southwestern part of China is very serious and has been included as one of three major ecological problems. In this study, using Landsat images as the data sources, we estimated the fractional vegetation coverage (FVC) in the Mengdong River Basin in the Hunan Province over the past 40 years, analyzed its spatio-temporal variation characteristics, and explored the driving mechanism (climate and anthropogenic) using the Mann–Kendall, Hurst index, and partial correlation methods. Specifically, the impact of ecological engineering on the recovery of vegetation cover in rocky desertification areas was analyzed and discussed in this study. The results demonstrate the following: (1) The changes in FVC in the study area before and after the rocky desertification management ecological project differed significantly, with a very small change in the rate of change in the mean value of FVC between 1987 and 1999 (<0.1%), while the FVC had a significant linear growth trend between 2000 and 2022 (>0.9%). (2) The Hurst index of FVC ranged from −0.233 to 2.476, with an average value of 0.864. The area with an H value greater than 0.75 accounted for 80.12%, indicating that the future trend in the vast majority of regions will develop in accordance with the current change trend. (3) The average partial correlation coefficients between FVC and precipitation and between FVC and temperature were −0.02 and 0.27, respectively, showing that FVC is more sensitive to temperature than precipitation. The combination of climate change and human activities is the main cause of FVC change. The contributions of climate change (precipitation and temperature) and human activities to FVC variation are about 30% and 70%, respectively. Ecological restoration projects have a significant positive effect on the recovery of vegetation in rocky desertification areas. The results of this study are intended to provide a scientific basis for analyzing the characteristics of vegetation restoration in existing rocky desertification areas and ecological management in future rocky desertification areas.
1. Introduction
Karst rocky desertification is one of the main types of land desertification. It is caused by disturbance and destruction due to unreasonable social and economic activities in the fragile ecological environment, causing serious soil erosion, large areas of bedrock exposure, a marked decline in land productivity, and a desert-like land degradation process on the surface [1]. Southwest China is the key area of karst desertification, and the double impact of natural factors and human activities led to the deterioration of the ecological environment in the region at the end of the last century, as well as the intensification of soil and water erosion, resulting in an ever-expanding area of rocky desertification.
Since the beginning of the 21st century, the Chinese government has attached great importance to the management of desertification. After more than a decade of comprehensive management of rocky desertification and the construction of ecological projects such as returning farmland to forests in the early stage, the area of rocky desertification in China’s karst areas dropped from 129,600 km2 in 2005 to 100,700 km2 by the end of 2016. Comprehensive vegetation coverage increased from 53.5% in 2005 to 61.4% at the end of 2016, with the degree of rocky desertification continuing to be reduced and the severe and extremely severe degrees decreasing significantly [2]. As ecological restoration is a long-term dynamic process, it is not only important to grasp the current recovery status, recovery degree, development direction, and other information, but it is also an important means by which to provide feedback information for ecological restoration and further adjust and improve the restoration plan [3]. Therefore, mastering the characteristics of vegetation restoration and its influencing factors in rocky desertification areas can provide a scientific basis for the future ecological management of rocky desertification areas.
Early monitoring of rocky desertification is generally carried out through a combination of aerial photography and ground surveys. Aerial photography is usually limited by fuel cost and camera unit load, and its temporal and spectral resolutions are seriously restricted. A detailed ground survey is generally only suitable for a small-scale ground feature survey, which is time-consuming and inefficient. It is also difficult to carry out large-scale and long time-series land cover monitoring in mountainous and hilly areas. Remote sensing technology provides a long-term, stable, large area, multi-band means of Earth observation, which can be a basic and scientific data source for the long-term monitoring of rocky desertification.
The spatio-temporal evolution of rocky desertification in karst areas of Southwest China has been discussed by different scholars from various perspectives using remote sensing imagery. Long et al. constructed a rocky desertification interpretation model and a biodiversity composite index based on MODIS data to analyze the spatio-temporal evolution patterns of rocky desertification and biodiversity in Southwest China during the period of 2000–2020 [4]. Guo et al. established a rock desertification monitoring model to clarify the spatial-temporal change pattern of rock desertification in Bijie, Guizhou, from 1985 to 2020 and found that land use is the main factor leading to rock desertification [5]. Xu et al. found that human activities have both positive and negative effects on the distribution and evolution of rocky desertification in Changshun County, Qiannan, Guizhou, by means of standardized coefficients (SOI) [6]. Xu et al. analyzed the spatio-temporal evolution of rocky desertification and driving factors from 1990 to 2020 based on the Google Earth Engine (GEE) and GeoDetector [7]. In the process of rocky desertification formation, vegetation and soil layers show different spectral characteristics in remote sensing images. Therefore, the changes in vegetation and soil (including bare rock) are important characteristics of different rocky desertification degrees, and the degree of rock desertification can be characterized by extracting the changes in vegetation and soil in remote sensing images. In rocky desertification areas, ecological indicators such as vegetation coverage and rock exposure rates are commonly used to characterize the degree of rocky desertification. The normalized vegetation index (NDVI), as an important feature of rocky desertification identification, is used to calculate the vegetation cover (FVC) in a particular area through the pixel binary model; the more severe the rocky desertification, the lower the vegetation coverage, and vice versa. Therefore, different degrees of rocky desertification can be obtained by setting the threshold of vegetation coverage [8]. Although the remote sensing indicators (NDVI, EVI, FVC, and other comprehensive vegetation indices, etc.) used in the above studies can, to a certain degree, show the changes in the vegetation cover in the rocky desertification areas. However, FVC can more accurately describe the recovery of vegetation in a rocky desertification area by emphasizing the change in vegetation per unit area. In rocky desertification field survey and monitoring indicators, which include the rate of bedrock exposure, vegetation cover, vegetation type, and soil thickness, the remaining three indicators are relatively stable, except for vegetation cover, which is highly variable. Therefore, changes in vegetation cover basically reflect the evolution of rocky desertification. Therefore, this study used FVC to analyze the spatio-temporal evolution characteristics of vegetation and its driving mechanism in rocky desertification areas.
In the evaluation of vegetation restoration, the fractional vegetation coverage (FVC) index of the inverse performance of the empirical model is often used for evaluation [9]. The empirical model extracts vegetation parameters by modeling the relationship between remotely sensed vegetation indices and measured vegetation structure indicators; this is simple and easy to implement and can achieve a high accuracy in a small spatial range [10,11]. Recent studies have shown that the “greenness” of vegetation in the southwest karst region has increased dramatically in the context of ecological engineering [12,13,14] and that the southwest karst region is one of the fastest-growing regions in the world in terms of vegetation cover and above-ground vegetation biomass. This region could make a great contribution to mitigating global climate change [15] and strengthening the health of ecosystems [16]. Some studies suggest that the ecological project in respect of the comprehensive control of rocky desertification is one of the important driving forces of vegetation increase from 2001 to 2016, accounting for 60.9% [17].
To explore the interannual change trend in vegetation, the trend is often determined via the one-way linear regression method or multiple linear regression analysis, using the slope of the regression equation (slope) to define the trend rate of annual change in the vegetation index combined with the F-test to evaluate its significance [18]. However, when the amount of observed data is small, the evaluation results may be affected by the seasonal change characteristics of the vegetation. A combination of the Sen slope and the Mann–Kendall test is often used to analyze the trend in vegetation change over time, which can show the extent of a continuous increase or decrease in the vegetation index, coverage, or productivity. The Hurst index is used to predict future trends in vegetation [19,20,21,22,23,24,25,26]. In the study of vegetation restoration driving forces and factor contribution rates, climate factors (temperature, precipitation) and human factors (ecological management project, traffic, population) are mainly taken into account, and the methods adopted include multiple residual regression analysis, spatio-temporal weighted regression analysis, and geographical detection [27,28,29,30,31].
Although a considerable amount of research has been carried out on rocky desertification, such as the extraction of information on rocky desertification, its spatio-temporal evolutionary patterns, and its driving mechanisms, the analysis and discussion of the spatio-temporal evolution of rock desertification and its driving factors are still comparatively limited, especially regarding the impacts of human activities (e.g., ecological restoration projects) on rock desertification. The changes in vegetation restoration in rocky desertification areas before and after ecological restoration projects deserve to be analyzed thoroughly. The karst area in the Hunan Province is more widely distributed than other karst areas, and, in this context, rocky desertification is critical. The karst areas of the province comprise 5.4946 million hectares, accounting for 25.94% of the total land area in the country, of which rocky desertification land comprises 1.258 million hectares, ranking fourth in the country, and there are 83 counties and urban areas in the province with continuous scale distribution. However, the current research on rocky desertification in the Hunan Province is relatively poor, mainly focusing on soil physicochemical properties and vegetation restoration in rocky desertification areas, and there are few reports on the characteristics of vegetation change and its future evolution before and after the implementation of rocky desertification restoration projects [32]. Based on these observations, in this study, we take the Mengdong River Basin in the Xiangxi Autonomous Prefecture, Hunan Province, China, as an example (a typical rocky desertification area) and use FVC as an evaluation index to comprehensively analyze the vegetation change characteristics before and after the implementation of ecological projects by the Mann–Kendall method. In addition, the factors (climate and anthropogenic) influencing vegetation change characteristics are discussed by partial correlation, and the future trend in vegetation change is predicted by the Hurst index. The results of this research are intended to provide technical and data support for ecosystem monitoring and vegetation restoration analysis in desertification areas.
2. Study Area and Data
2.1. Study Area
The Mangdong River Basin is located in the Yongshun and Longshan County, Xiangxi Autonomous Prefecture, which belongs to the Wuling Mountain Region (Figure 1). The study area covers 2092.82 km2, and the Yongshun section of the Mengdong River Basin covers 1692.39 km2, accounting for 80.87% of the study area. The soil in the study area mainly developed from parent rocks such as limestone (including dolomite), slate shale, purple sand shale, and river impacts. The soil mainly consists of red soil (46.69%), limestone (rock) soil (22.82%), yellow soil (21.34%), etc. The soil has a slightly acidic-to-weakly alkaline reaction, with a high fertility, and is adapted to a wide range of plant growth [33].
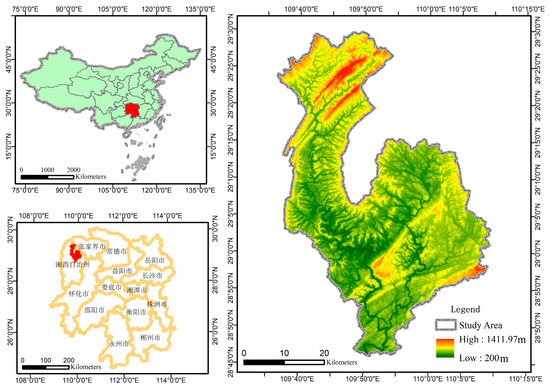
Figure 1.
Study area.
2.2. Data and Preprocessing
The remote sensing images used in this study were obtained from the Google Earth Engine cloud platform; the Landsat5 TM images, Landsat 7 ETM+, and Landsat8 OLI images were obtained from 1987 to 2011, 2012, and 2013 to 2022, respectively, and all the Landsat images have a spatial resolution of 30 m. The image data were pre-processed using radiometric calibration, atmospheric correction, geometric correction, image enhancement, and so on. The processing of the Landsat images in this study mainly included de-clouding, median synthesis, and clipping. In addition, the Landsat 7 ETM+ image was gap-filled due to quality issues.
The precipitation and temperature data were obtained from the National Data Center for the Tibetan Plateau (https://data.tpdc.ac.cn/ (accessed on 12 November 2023)), with a spatial resolution of 1 km and a time span from 2000 to 2022. The FVC data were resampled to 1 km to match the meteorological data scale. The temperature and precipitation datasets were generated by the Delta spatial downscaling program in the Chinese region based on the global 0.5° climate dataset released by CRU and the global high-resolution climate dataset released by WorldClim. The validation was carried out using data from 496 independent meteorological observation points, and the results were verified to be credible.
According to the third rocky desertification monitoring dataset, the monitoring area of the Mengdong River Basin (Yongshun section) is 837.3297 km2; it is mainly distributed in the south and southeast of the study area and the northern section of the Mengdong River and Shouche River junction (from the third rocky desertification monitoring dataset of Yongshun County) [34]. The desertification in this region is dominated by the potential rocky desertification type, which accounts for 52.35% of the monitored area, followed by the rocky desertification type, which accounts for 25.96% of the monitored area. The degree of rocky desertification is dominated by medium and light degrees, and the area of the non-rocky desertification type accounts for 21.69% of the monitored area (Figure 2, left).
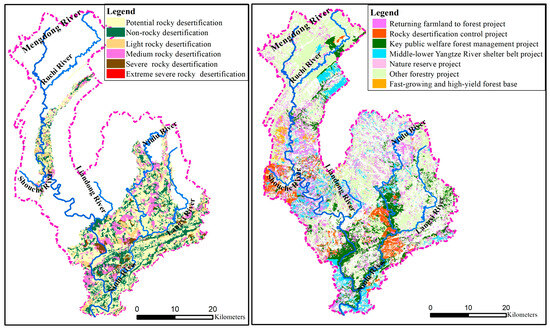
Figure 2.
Mengdong River Basin (Yongshun section). Distribution map of rocky desertification (left). Distribution map of ecological engineering (right).
According to the survey data of forest resources in Yongshun County, there are mainly ecological projects such as other forestry projects, returning farmland to forest projects, and rocky desertification control projects in Yongshun County (Figure 2, right). The project involving returning farmland to forest is mainly concentrated in the rocky desertification monitoring area in the middle reaches of the Mengdong River and the upper reaches of the Niulu River in the northeast of the research area. The rocky desertification control projects are mainly concentrated in the south and north of the Shoughe River and the confluence of the Niulu River and Langxi River in the south. The key public welfare forest projects are mainly concentrated in the middle and upper reaches of the Ruchi River, the south of the county, and the middle reaches of the Niulu River, as well as the confluence of the Langxi River. The other forestry projects are mainly concentrated in the upper reaches of the Langxi River, Ruchi River, Liandong River, and Mengdong River. The nature reserve project is mainly located in the downstream section of the confluence of the Ruchi River and Mengdong River.
3. Research Methods
3.1. Calculation of Vegetation Coverage
Fractional vegetation coverage (FVC) is the ratio of the vertical projected area of leaves, stems, and branches of the vegetation community on the surface to the surface area in a unit area. It reflects the sparseness and growth of vegetation communities covering the surface, and it is an important indicator of changes in the ecological environment, such as changes in surface vegetation, soil erosion, and land rocky desertification [35]. The mixed-pixel dichotomy model based on the vegetation index is widely used in the remote sensing estimation of vegetation coverage, and the most commonly used method for estimating vegetation coverage is based on the normalized difference vegetation index (NDVI). Based on the NDVI, the pixel binary model was used to estimate the FVC of the study area over the last 40 years [36]. However, FVC performs well in areas with an average vegetation cover but has reduced sensitivity in areas with a high vegetation cover. Therefore, to avoid this problem, all regions with an FVC greater than 0.7 are divided into a class in this paper.
The derived FVCs were validated using the 2019 Forestry Class II small group survey data. Since the Forestry Class II survey data only has the field of depression (depression refers to the total projected area of tree crowns on the ground in direct sunlight in a forest (canopy) versus the total area of this forested land (stand)), only forested land was extracted for the validation of the FVC. The 2019 FVC raster data were transposed to points, and then the average of the number of FVC points within the extracted plot range for the forested land polygon was used as the vegetation cover for that polygon for an accuracy comparison with depression.
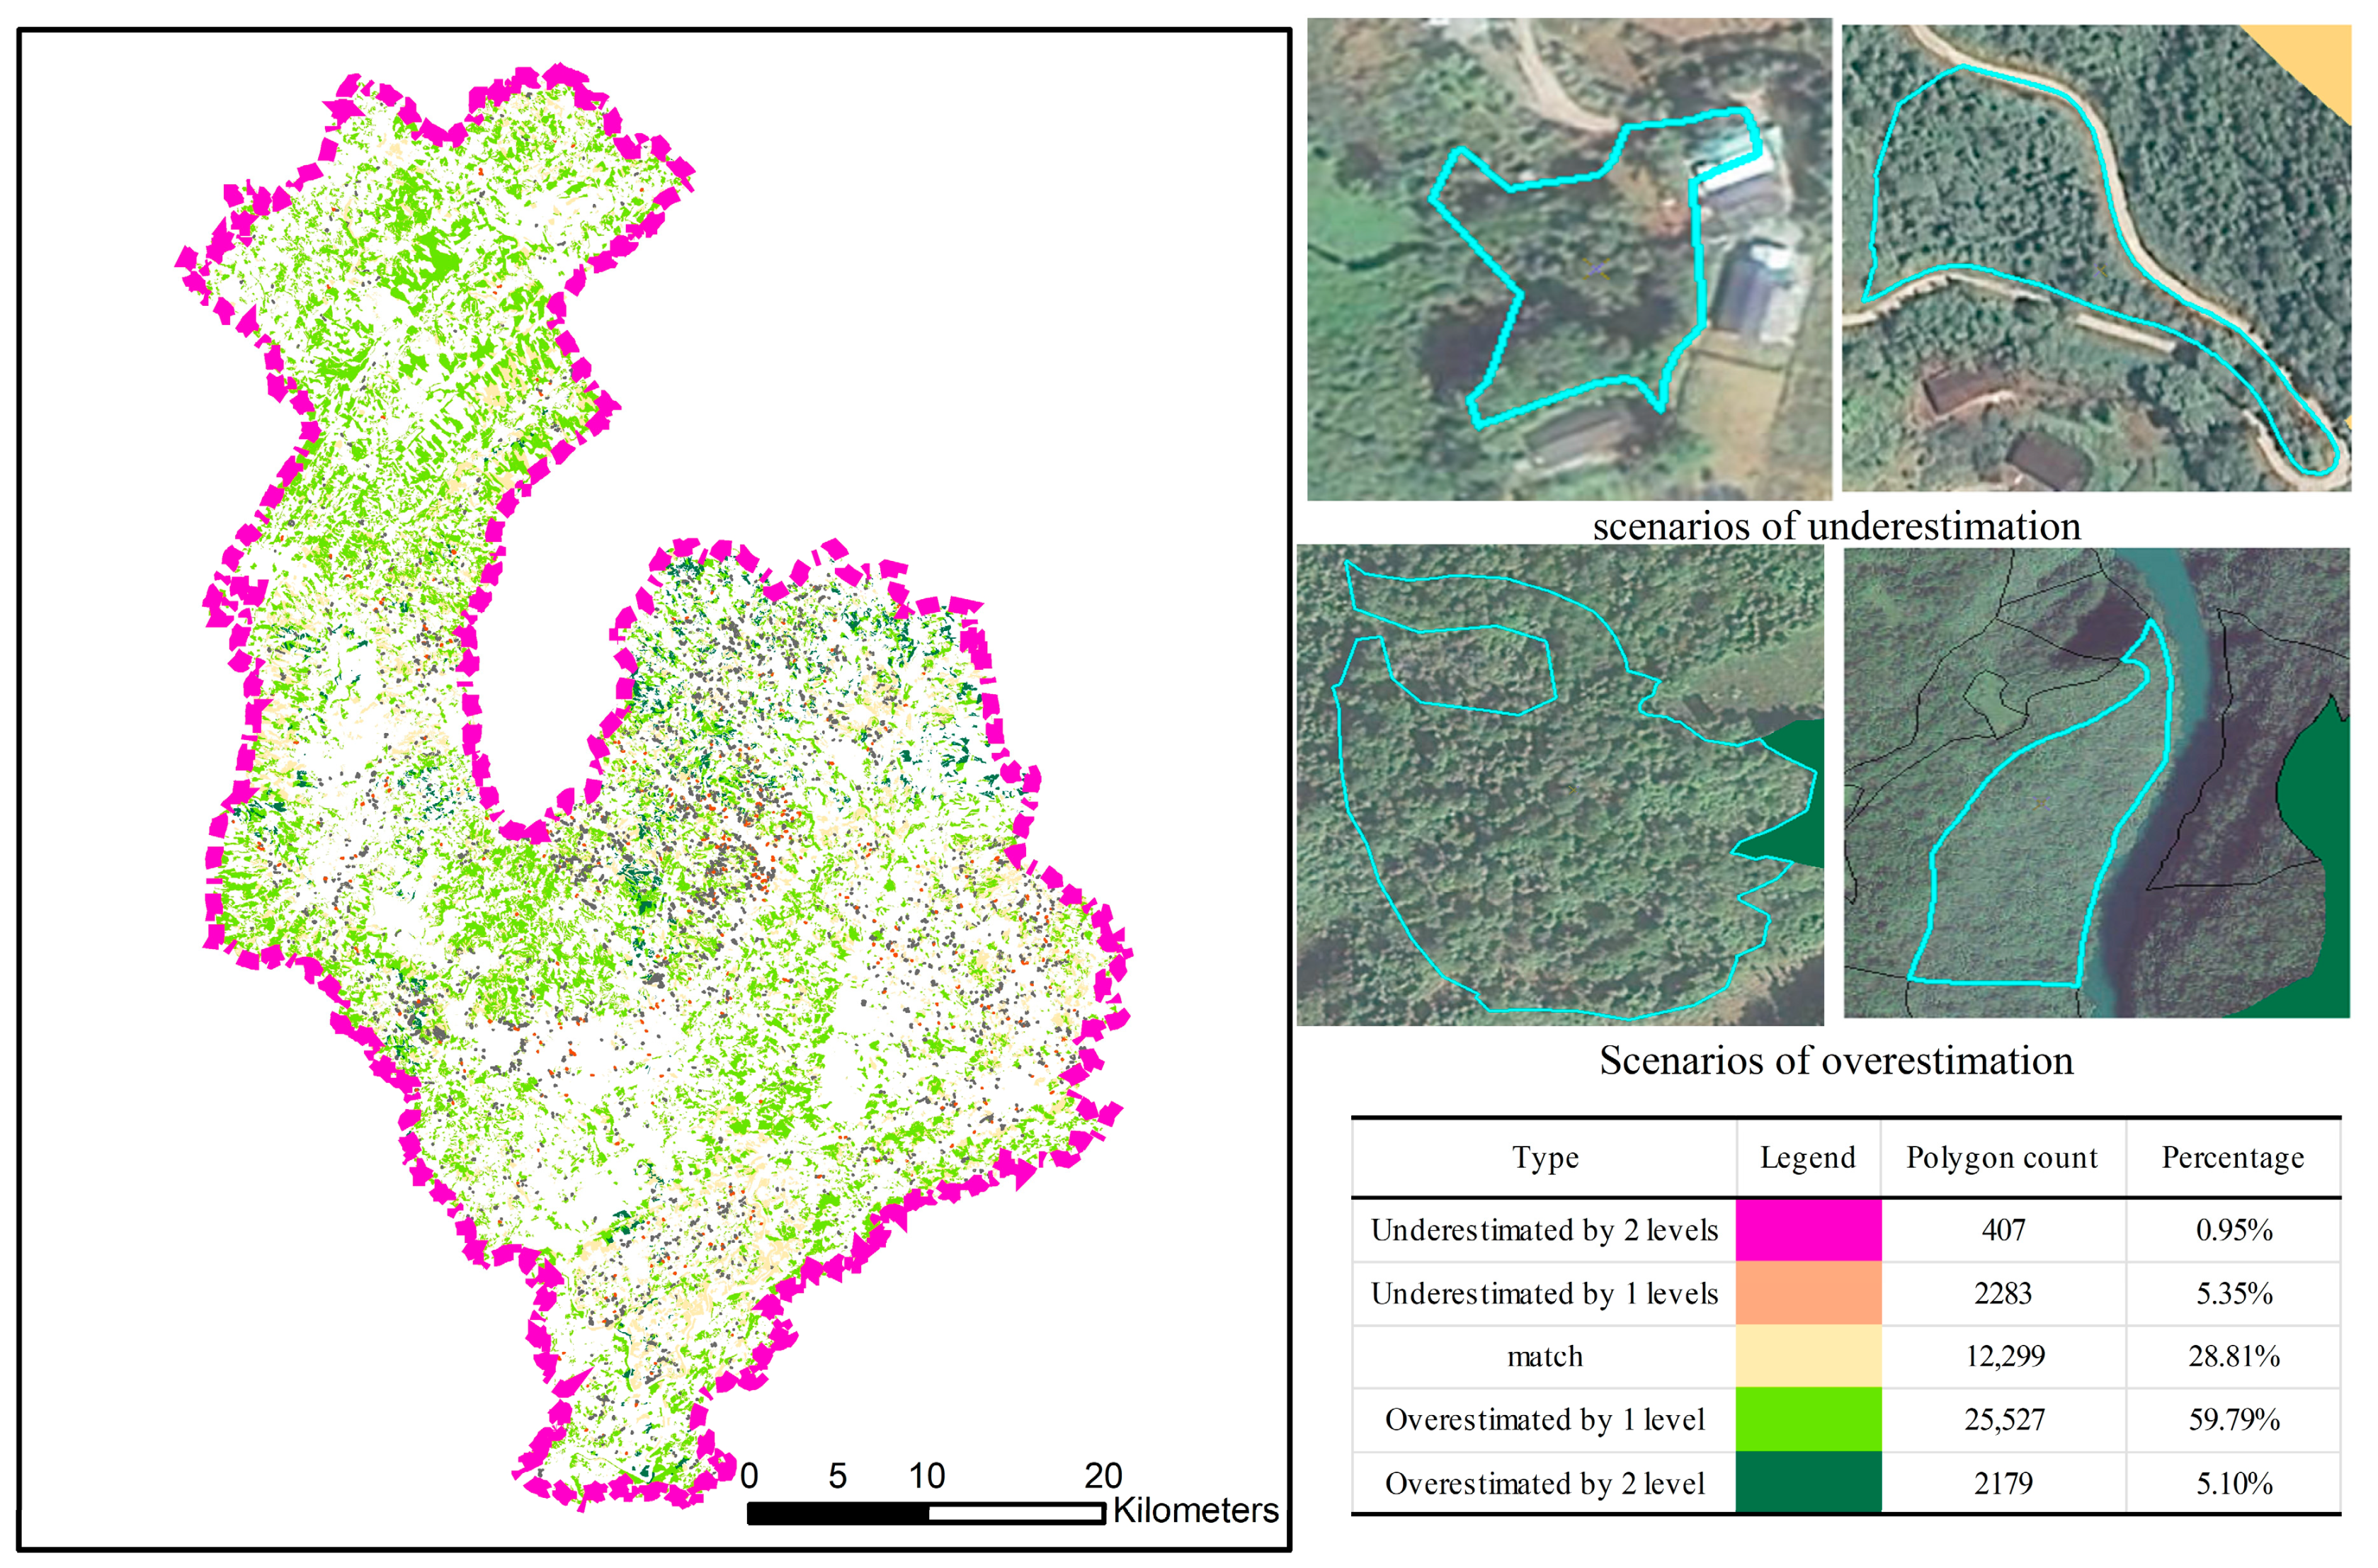
The specific comparison method is to grade the depression of the small class of forested land and the extracted FVC, and the results are categorized into five types: underestimation of two grades, underestimation of one grade, grade matching, overestimation of one grade, and overestimation of two grades, and the results are shown in Figure 3. The percentage of overestimating 1 level is 59.79%, and, since the definition of FVC is wider than the definition of depression, this study considers overestimating 1 level to be a matching status. The percentage of overestimation of 2 levels is 5.10%. Visual observation of the polygons with 2 levels of overestimation through the sky map image reveals that the depressivity of the polygons with 2 levels of overestimation is basically 0.4, which is categorized as level 3, but, from the image features, the FVC can at least reach more than level 4, and it can be considered that the extraction of the FVC matches the accuracy of this study. Overall, the validation accuracy of FVC reaches 88.60%.

Figure 3.
FVC accuracy validation distribution map.
3.2. Trend Check
- (1)
- Mann–Kendall (MK) test
The Mann–Kendall test is a non-parametric statistical test method, which was first proposed by Mann in 1945 and further improved by Kendall and Sneyers. Its advantages are that the measured values do not need to follow a certain distribution, and they are not affected by missing values and outliers. It also has a high quantification degree, a wide detection range, and convenient calculation, and it has been widely used in the trend significance testing of long time-series data [37].
The original assumption H0 is that the time-series data () comprise n independent samples with the same distribution of random variables; the alternative hypothesis H1 involves a two-sided test. For all i, j ≤ n and i ≠ j, the distributions of xi and xj are not identical. We define the test statistic S as follows [38]:
where and are the observed values corresponding to time-series i and j, and i < j,n is the number of data points. sign() is a symbolic function.
The MK statistic is asymptotically normal for a suitably large sample. Assuming that the sample is sufficiently large and uncorrelated, the mean of the MK test statistic S is zero, that is, E(S) = 0; the variance is as follows:
The meaning of the equation behind the subtraction is that the observed data are grouped according to the same elements, g is the number of groups, is the number of elements in each group, and the sum is calculated separately. It can be seen from the formula that, if each element in the sequence occurs only once, the sum part of the result is 0. The variance formula can be simplified as follows:
The standardized test statistic is calculated as follows:
In a bilateral trend test, for a given significance level α, if , then the original hypothesis H0 is unacceptable; that is, there is a significant trend change in the time-series data at confidence level α (significance test level). A positive indicates an increasing trend, while a negative value indicates a decreasing trend. is the value corresponding to the standard normal function distribution table at the confidence level α. When the absolute value of is greater than 1.645, 1.96, and 2.576, this means that the trend passes the significance test with a confidence level of 90%, 95%, and 99%, respectively.
The p-value of the statistic (the probability that such an extreme value is observed, i.e., the probability that the null hypothesis is rejected) is given as follows:
where erf is the error function of the standard normal distribution function, also known as the Gaussian error function.
For a bilateral test of whether there is any trend (positive or negative) at the 95% confidence level, the p-value is compared to 0.975. Alternatively, we compare the z statistic to Z*, where Z* is the inverse distribution function of 0.975.
- (2)
- Sen slope estimation
The Theil–Sen median method, also known as Sen slope estimation, is a robust non-parametric statistical trend calculation method with high computational efficiency and insensitivity to measurement errors and outlier data. It is often used in the trend analysis of long-term time-series data and is an indicator used to measure the size of the trend [39].
where and are the values at times j and i; and the median denotes the median value. β > 0 denotes an upward trend in the time-series, and β < 0 denotes a downward trend in the time-series (Table 1).

Table 1.
Criteria for classifying the significance of changes.
Sen slopes are often used in conjunction with the MK non-parametric test, where the Sen trend value is calculated and then the MK method is used to determine the significance of the trend.
3.3. Hurst Index
The Hurst index was originally developed by Harold Edwin Hurst (1900–1978), a British hydrologist, who found that biased random wandering (fractional Brownian motion) could successfully describe the long-term storage capacity of reservoirs when he was studying the relationship between the water flow and storage capacity of Nile River reservoirs [40]. Based on this, he proposed the Hurst index by using the rescaled polarity (R/S) analysis method as an indicator to determine whether the time-series data followed a random wandering or a biased random wandering process [41].
Let Xi = X1, …Xm be m consecutive values of a time-series, taken logarithmically and differenced once into a logarithmic difference sequence of length N = m − 1.
The sequence of length N is then equally divided into A subsets a, so that the length of each subset is n = N/A. We calculate the mean for each sub-interval as follows:
Within each subset a, the cumulative deviation of each point relative to the mean of that subset is calculated as follows:
The cumulative deviation is relative to the mean of the subset; that is, there is a de-averaging process, so the next calculated fluctuation range is also de-averaging. In Hurst’s study, he uses the dispersion and band range after de-homogenization, which can eliminate the effect of the long-term trend of the sequence on the correlation between the increments [42].
We calculate the fluctuation range within each subset a, and the range within the group is as follows:
We calculate the standard deviation within each subset as follows:
For each subset, the range of fluctuations is normalized using its standard deviation to obtain the rescaled polar deviation . There are a total of A subsets and, hence, A-rescaled extreme deviations. We take their mean as the rescaled range of the original logarithm sequence over a time span of length n, denoted as .
By increasing the value of n and repeating the previous steps, the rescaling range on a time-series with a different length of n is obtained.
According to the definition of the Hurst index H, it describes the proportional relationship between and as follows:
Therefore, if we perform a double log regression on n and , that is, we use log (n) to perform a linear regression on log (), the intercept of the regression equation is the constant C, and the slope is the Hurst exponent H.
H = 0.5 indicates that the time-series can be described by a random walk (Brownian motion); that is, the time change series is random, and there is no long-term correlation.
A value of 0 < H < 0.5 indicates the weakening of memory (anti-persistence), which is the mean recovery process and represents the anti-persistence of the time change series.
A value of 0.5 < H < 1 indicates memory enhancement (persistence), which means that the time change sequence is persistent, indicating that the future change is consistent with the past change trend. The closer H is to 1, the stronger the trend of the time-series. In this paper, the H-value of this level is further subdivided into two levels, 0.5–0.75 and 0.75–1.0, representing weak and strong sustainability trends, respectively.
The Hurst index is combined with the Sen slope and MK trend test values to categorize the future trend categories of each vegetation indicator into nine categories, as shown in Table 2.
Table 2.
Classification of future trends using the Hurst index.
3.4. Partial Correlation Analysis
Partial correlation analysis, also known as net correlation analysis, analyzes the linear correlation between two variables while controlling for the linear influence of other variables. In multiple variables, after excluding the influence of one or several control variables, the correlation degree between the two variables is directly calculated [43]. The main function of partial correlation analysis is to determine which explanatory variable has the greatest influence on the response variable among all the variables, which is more helpful for accurately understanding the mutual influence and interaction relationship between variables. The tool used is the partial correlation coefficient [44].
Among the three variables, the partial correlation coefficient of any two variables is calculated after excluding the influence of the other variable, and the formula is as follows:
where is the simple correlation coefficient between variables y and j, is the simple correlation coefficient between variables y and k, and is the simple correlation coefficient between variables j and k.
The partial correlation coefficient test often uses a T-test. The null hypothesis is that the partial correlation coefficient of the two variables in the population is 0. The formula is as follows:
where r is the corresponding partial correlation coefficient, n is the sample size, k is the number of controllable variables, and n – k − 2 is the degree of freedom. When t > t 0.05 (n – p − 1) or p < 0.05, the null hypothesis is rejected (Table 3).
Table 3.
Correlation significance classification criteria.
We consider a partial correlation of the annual precipitation and average temperature on the FVC.
3.5. Multivariate Residual Analysis
Changes in vegetation cover are affected by both climate change and human activities. We use the multiple regression residuals analysis method to examine the effects and relative contributions of climate change and human activities to FVC changes.
This method involves establishing a binary linear regression model of FVC and temperature and precipitation, calculating various parameters in the model, and then predicting the FVC (). This is used to express the influence of simple climate factors on the FVC and calculates the difference between the observed FVC and the predicted FVC, namely, the FVC residual (), which is used to represent the impact of human activities on the FVC. The formula is as follows:
and P represent the average annual temperature and annual precipitation, respectively. indicates the actual value of the FVC. a, b, and c are the coefficients of the regression equation.
We performed a trend analysis on , , and to obtain the corresponding slopes, i.e., , , and , respectively. As shown in Table 4, we distinguished the main driving factors causing FVC changes and calculated the relative contributions of climate change and human activities to FVC changes.
Table 4.
Determination of FVC drivers and calculation of driver contribution rates.
4. Result Analysis and Discussion
4.1. Characteristics and Spatial Distribution of Interannual Mean Value of FVC
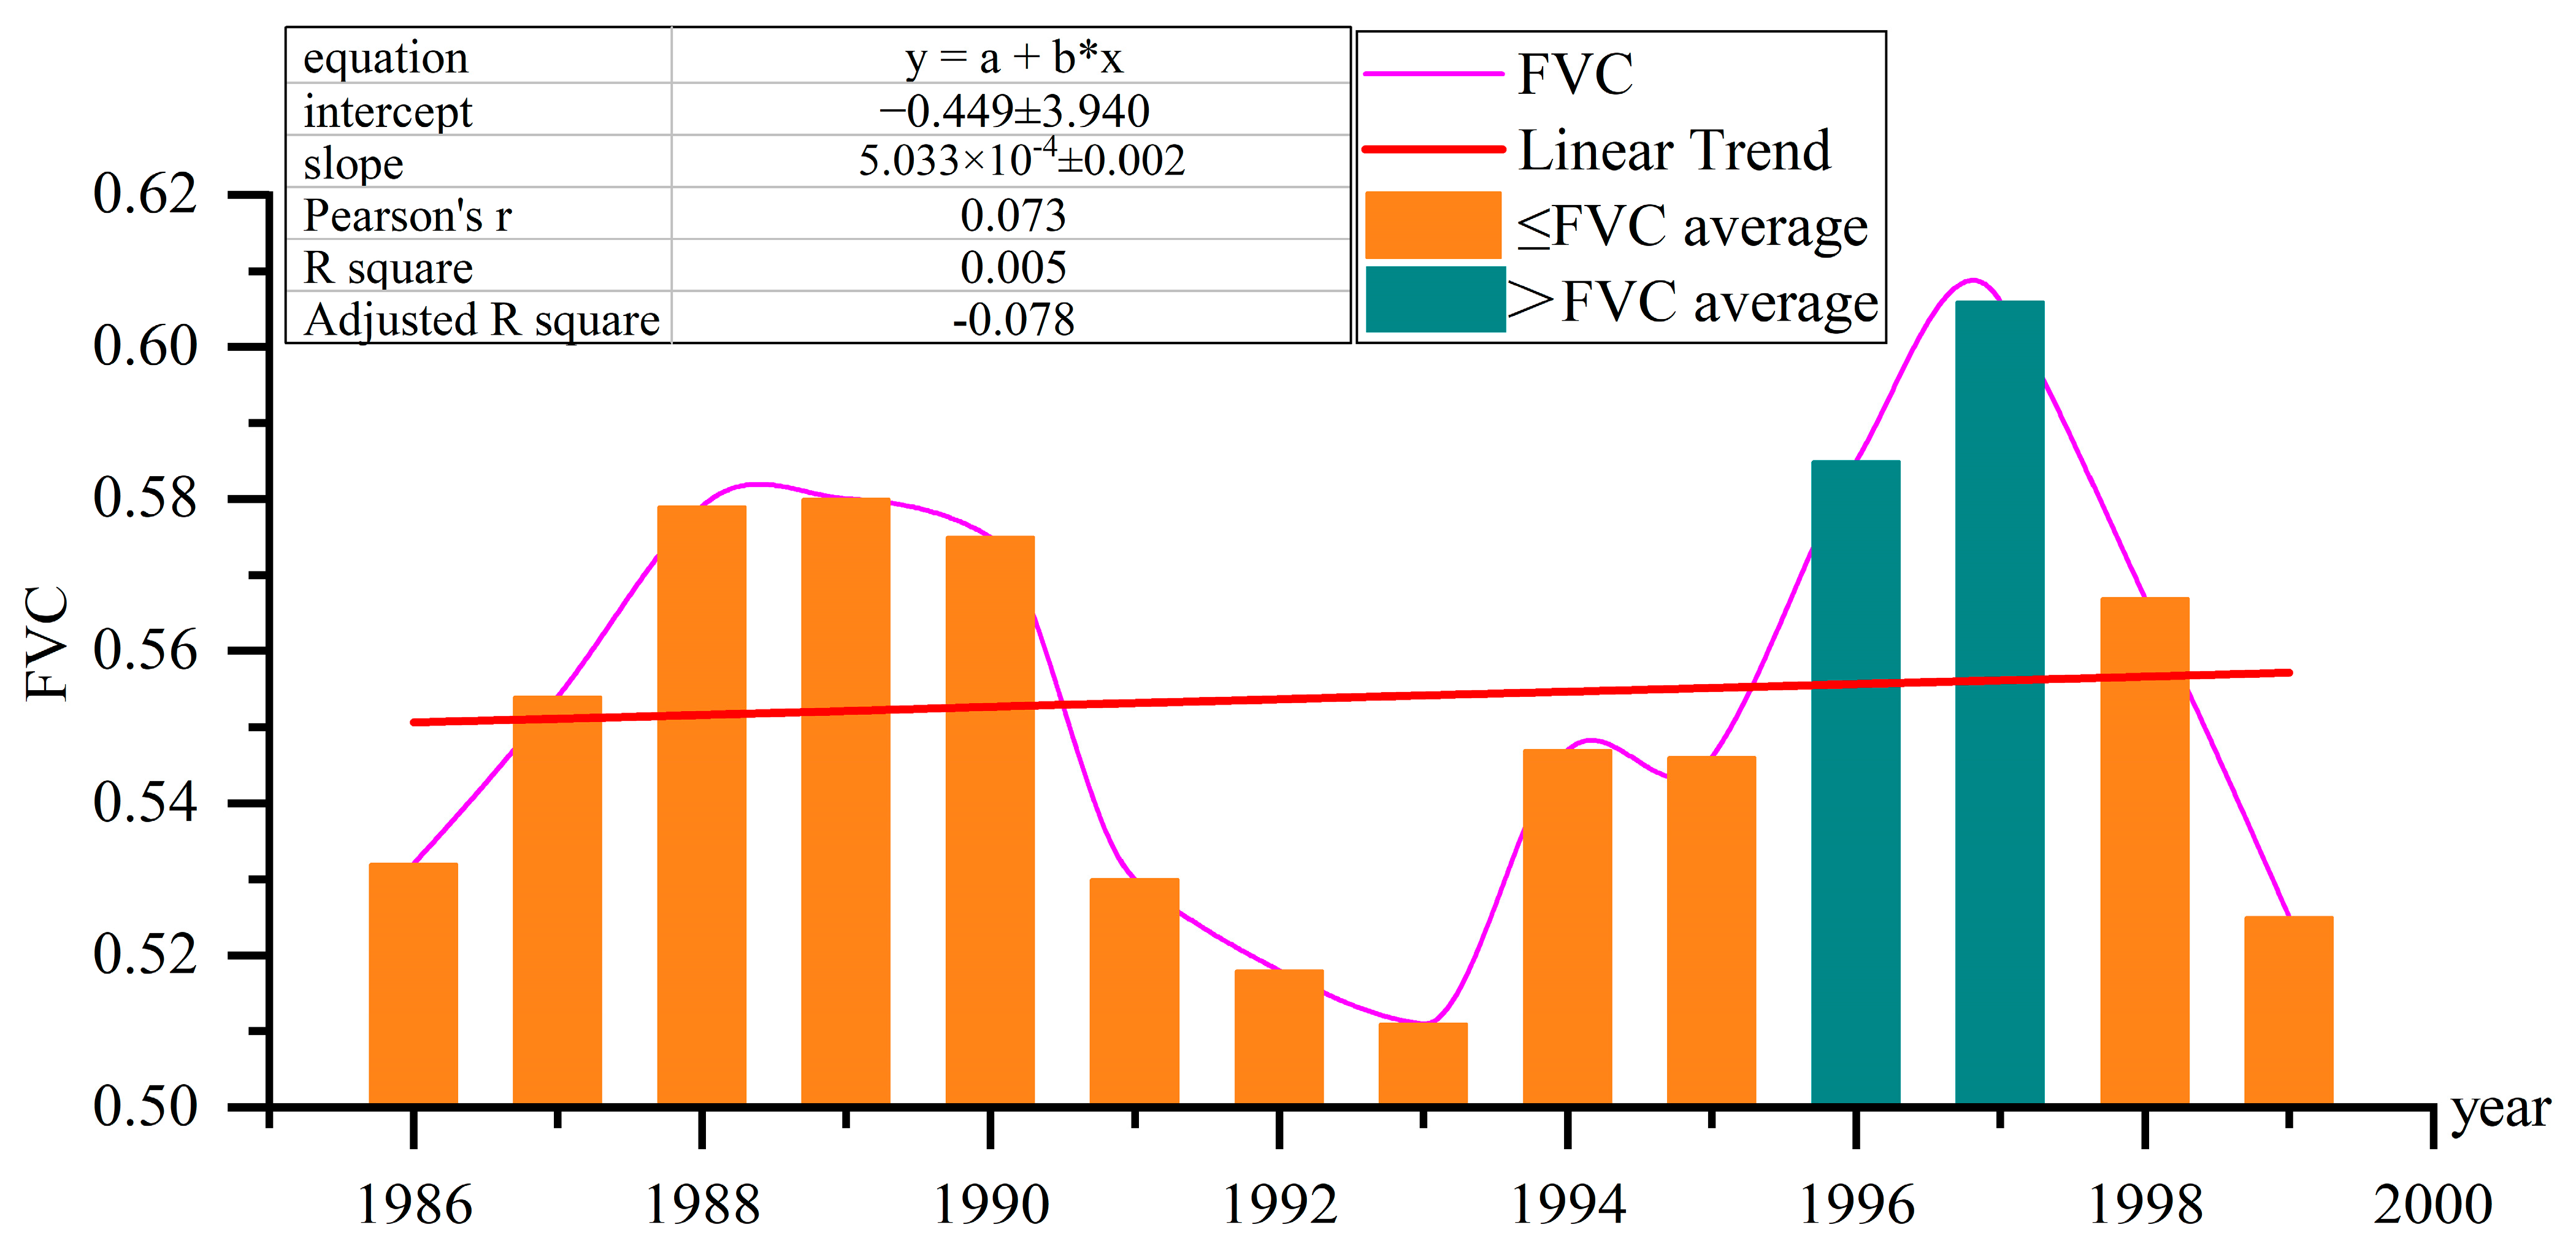
The FVC was calculated according to the pre-ecological management period (1987–1999) and the ecological management period (2000–2022). The average FVC for the pre-ecological management period was 0.554, the maximum annual average was 0.606 (1997), and the minimum annual average was 0.511 (1993). The FVC showed an increasing trend from 1986 to 1990, a rapid decline from 1990 to 1993, a steady increase from 1993 to 1997, and a downward trend from 1997 to 1999, with frequent changes in the FVC. The linear fitting of the FVC annual mean is shown in Figure 4. As it can be seen from the figure, there is essentially no linear trend in the mean value of the FVC during the period 1987–1999.
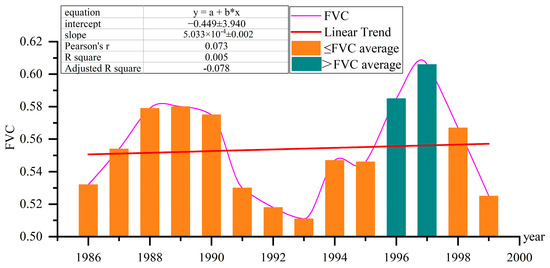
Figure 4.
Unitary linear-fitting graph of FVC mean values from 1986 to 1999.
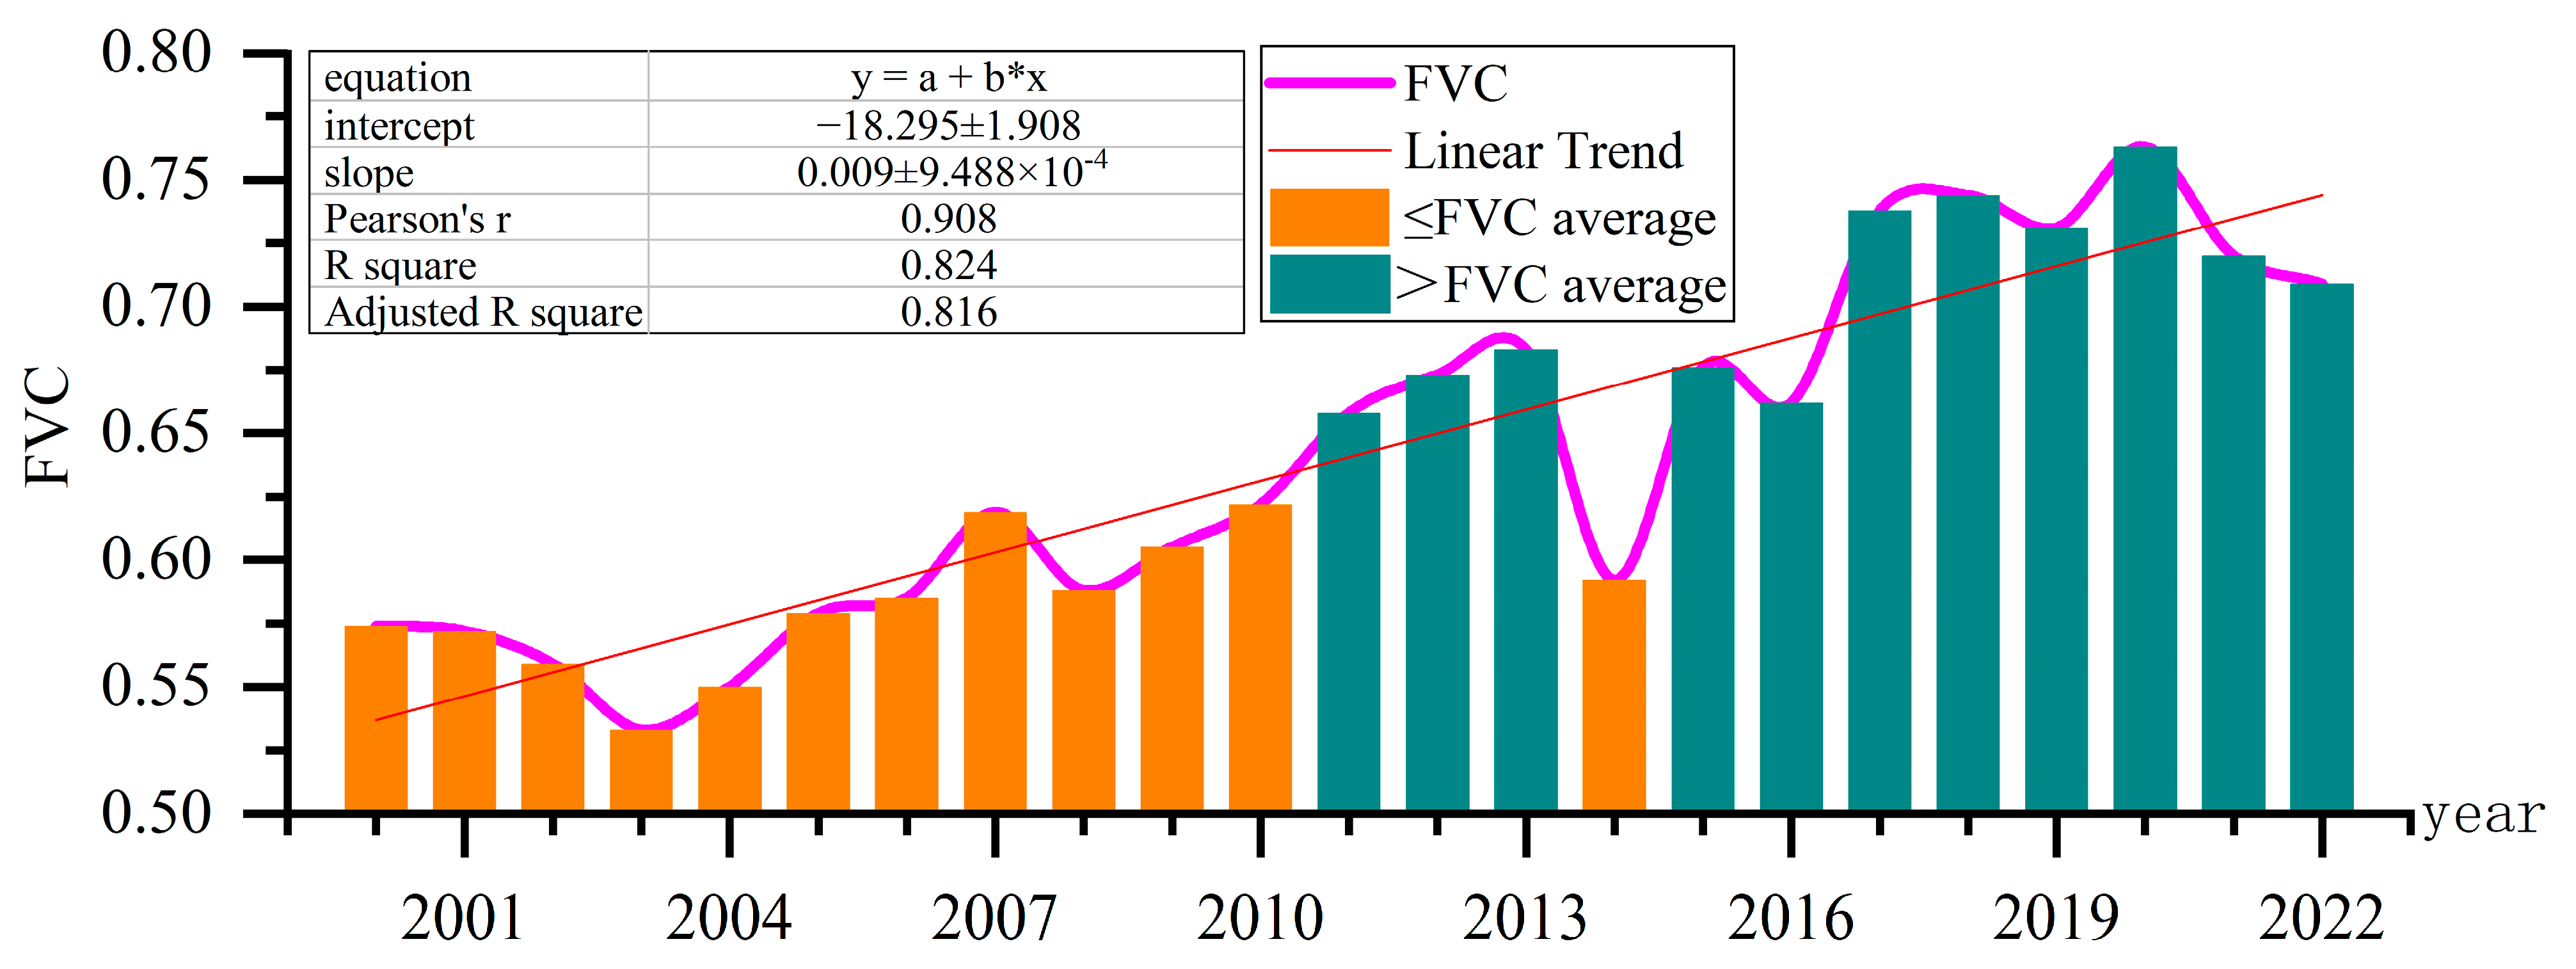
The average value of the FVC from 2000 to 2022 was 0.641, the maximum annual mean was 0.763 (2020), and the minimum annual mean was 0.533 (2003). From 2000 to 2010, the FVC increased slowly, but all of the values were lower than the average. From 2011 to 2022, only the 2014 FVC was lower than the average, and the values for the other years were higher than the average, showing a stable and rapid growth trend. The average FVC for 2017 exceeded 0.7. The Pearson correlation coefficient fitted using the FVC one-variable linear equation was 0.908, R squared was 0.824, the average annual growth rate was 0.00942a − 1, and the growth rate was 1.64%. The FVC had an obvious linear growth trend during the period 2000–2022, indicating that the FVC exhibited significant growth in the ecological governance period (Figure 5).
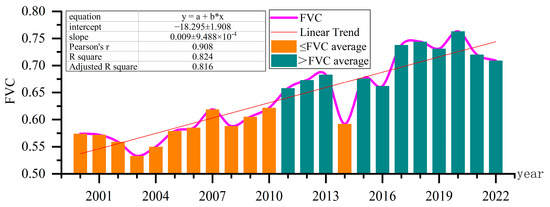
Figure 5.
Unitary linear-fitting graph of FVC mean values from 2000 to 2022.
In this study, only the linear-type trend of the FVC was considered in the Mengdong River Basin. The focus of this study was to analyze the role of ecological engineering on vegetation restoration in rocky desertification areas. The results demonstrated that, after the implementation of the ecological project, the vegetation cover in the region showed a significant linear-increasing trend. However, the FVC may in general have non-linear behaviors, which is a concern for subsequent studies.
In order to further reduce the fluctuations in remote sensing data, the FVC for the ecological management period was averaged over three-year intervals to obtain FVC data for eight time periods.
According to the FVC statistics in these eight periods, the mean value of the FVC in the rocky desertification monitoring area in the ecological control period was lower than that in the non-rocky desertification monitoring area in each period. The mean values of the FVC in the two regions showed little difference in the period 2001–2004, and the mean value of FVC in the rocky desertification monitoring area increased slowly from 2003 to 2008, while the mean value in the non-rocky desertification monitoring area increased rapidly. The mean value in the rocky desertification monitoring area increased rapidly after 2008 and approached the level of the mean value in the non-rocky desertification monitoring area (Table 5).
Table 5.
FVC mean values in the monitoring area with respect to rocky desertification for eight time periods during the ecological management period.
The FVC values of these eight time periods were calculated via the land cover categories. The average FVC showed the characteristics of forest land > shrub land > other woodland > garden plot > grassland > plowland. From 2001 to 2004, the average value of FVC for different land covers decreased slightly, and there was steady growth in the FVC mean for each category from 2004 to 2019. It was speculated that the FVC mean peaked in 2020 from the FVC mean of 2000 to 2020, and there was a slight decline in the following two years (Table 6).
Table 6.
FVC mean values by land cover category for the eight time periods during the ecological management period.
The FVC statistics according to the ecological management project for these eight time periods show that the average value of the FVC was characterized as nature reserve project > rocky desertification control project > fast-growing and high-yield forest base > middle–lower Yangtze River shelter belt project > key public welfare forest management project > other forestry projects > returning farmland to forest project. In the early stage of ecological management, the FVC was the lowest, and the increase was the highest, which is similar to the current level of the shelter belt project in the middle and lower reaches of the Yangtze River. The FVC level in the middle–lower Yangtze River shelter belt project was higher than that in the key public welfare forest management project in the early stage of ecological management, but the FVC level in the late stage of ecological management was slightly lower than that of the key public welfare forest management project, indicating that the FVC increase in the key public welfare forest management project was higher than that of the middle and lower reaches of the Yangtze River protection forest project. The increase in the FVC in other forestry projects belonged to the slow-growth type, and its effect on FVC improvement was slightly lower than that of the fast-growing and high-yield forest base (Table 7).
Table 7.
FVC mean values of ecological engineering in eight time periods during the ecological governance period.
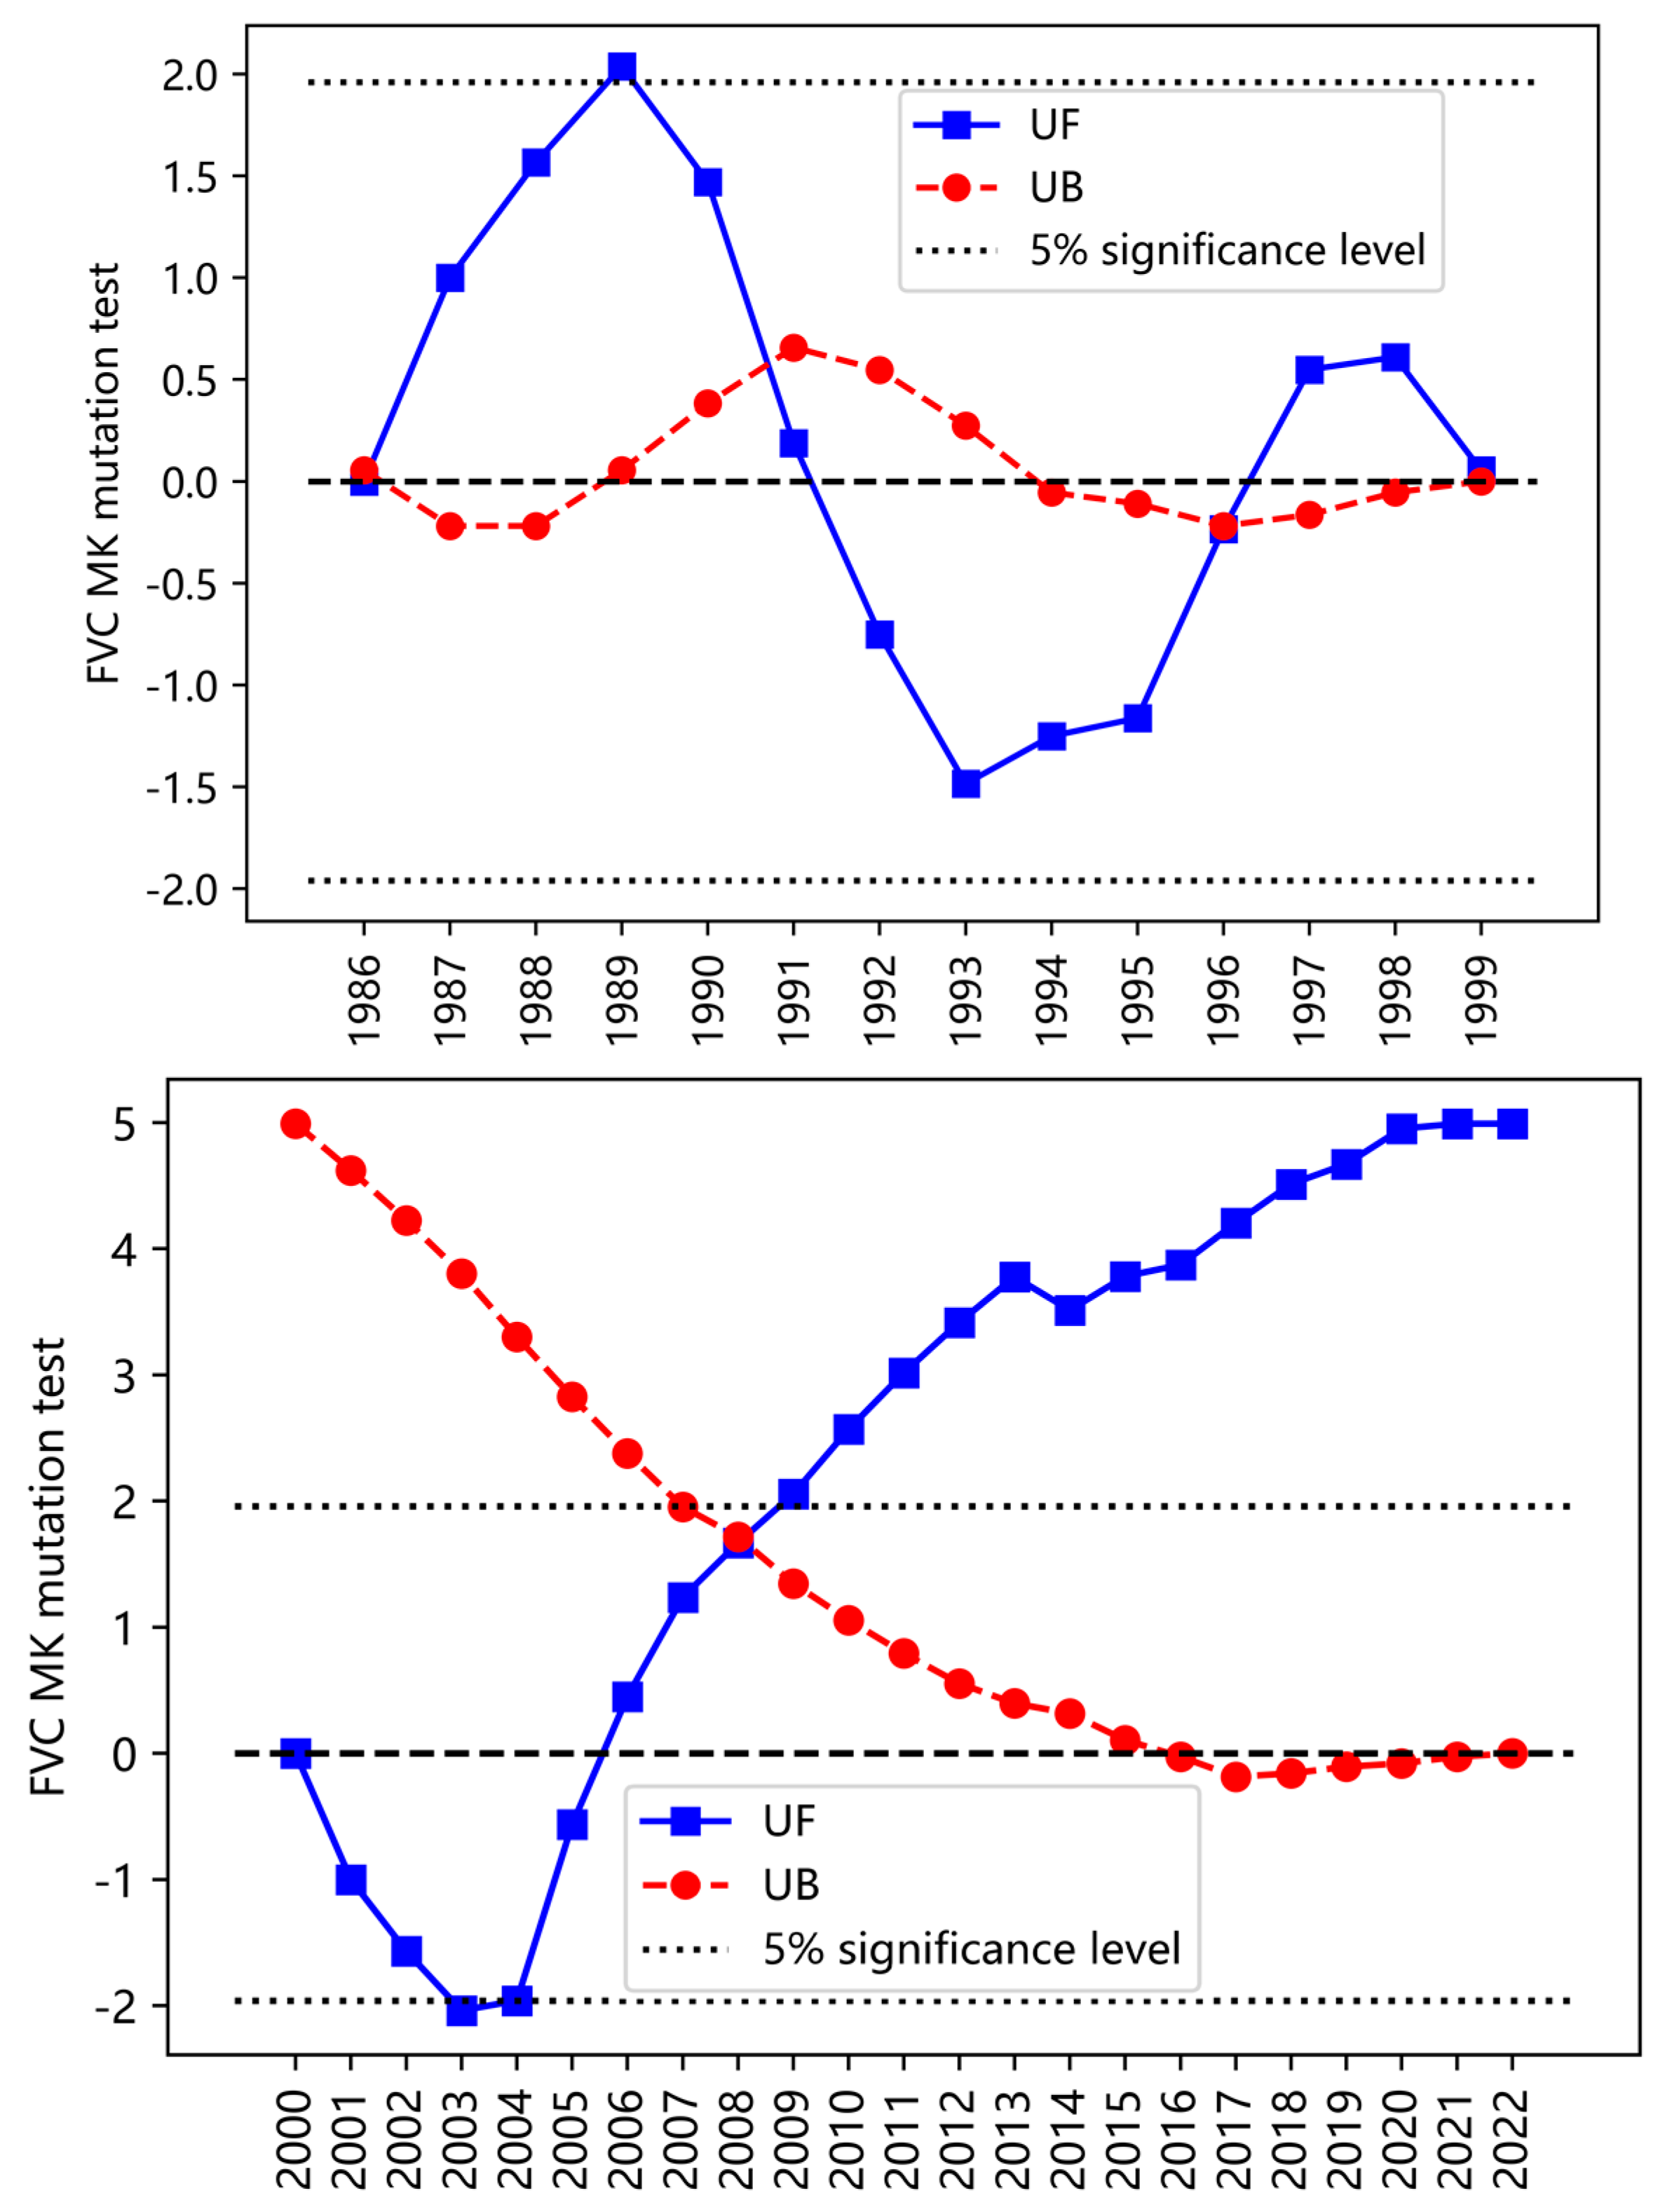
The results of the MK mutation test with respect to FVC data show that there were multiple intersection points between statistical forward sequence (UF) and statistical reverse sequence (UB) in the pre-ecological management period, and the FVC changed frequently without mutation points, as shown in Figure 6. During the period of ecological governance, the FVC showed a downward trend from 2000 to 2003 and then showed a significant upward trend. The UF value and UB value intersected in 2008, indicating that 2008 was a sudden change year with respect to the FVC, and the effectiveness of ecological governance began to become prominent.
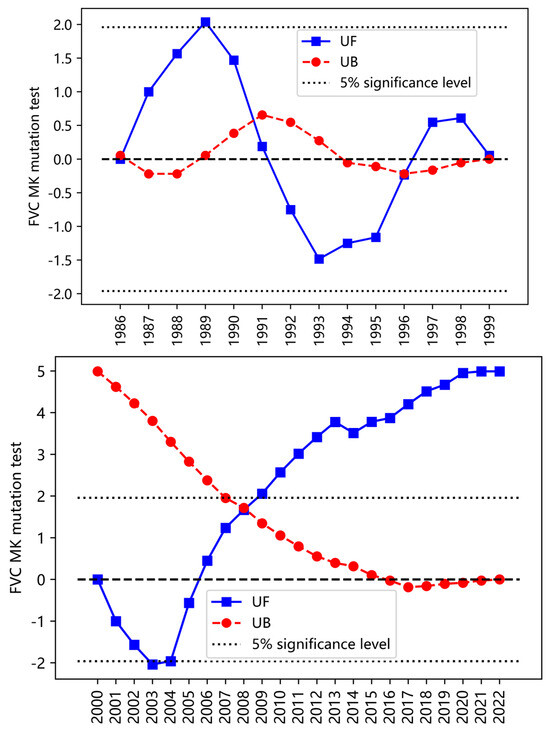
Figure 6.
FVC MK mutation test map from 1986 to 1999 (top). FVC MK mutation test map from 2000 to 2022 (bottom).
According to the vegetation coverage rating standard of rocky desertification monitoring, the FVC was divided into five grades, as shown in Table 8.
Table 8.
Classification of vegetation coverage.
The FVC of each year was graded and mapped, and FVC displays were selected for the years 1987/1993/1999 of the pre-ecological management period and 2002/2006/2010/2014/2018/2022 after ecological governance. This accounted for its FVC classification area, as shown in Table 9; the space distribution is shown in Figure 7.
Table 9.
Proportion of graded area of vegetation coverage in individual years (%).
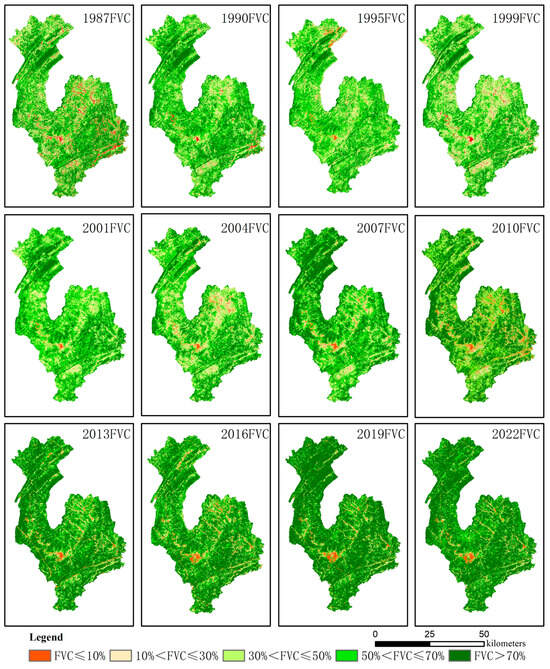
Figure 7.
Partial annual FVC distribution map.
It can be seen from the table that, during the period 1987–1999, before ecological governance, the area proportion of FVC for different grades changed very little, and the area proportion of FVC with respect to grades 3/4/5 was fundamentally similar; that is, a denser vegetation cover was not dominant.
From the annual fluctuation in FVC grades, the area of the FVC1 grade was not large, fluctuating at 4.51%. The area proportion of the FVC2 class fluctuated and decreased by nearly 75% during the ecological treatment period. The area proportion of the FVC3 grade changed very little from 1987 to 2004, rapidly decreased from 2004 to 2007, and gradually decreased by nearly 70% from 2007 to 2022. The area proportion of the FVC4 class fluctuated from 1987 to 1999 and steadily declined from 2001 to 2019, mainly changing to the FVC5 class. The area proportion of the FVC5 grade decreased from 31.2% to 26.06% during the period 1987–1999 and steadily increased from 27% to 65.46% during the period 2001–2022; that is, dense vegetation cover occupied a dominant position in the region.
From the comparison of the area share of vegetation cover grading between the first time period (2000–2002) and the eighth time period (2021–2022) of the ecological management period of each ecological project, the area share of the FVC5 grade of the fallow farmland reforestation project increased the most, from 17.85% to 84.96%. The area share of rocky desertification control projects with an FVC5 rating was 88.88%, ranking second only to the nature reserve project. The proportion of the FVC5-rated areas in the other ecological projects had essentially increased to more than twice the original level. This shows that the ecological management project had a significant effect on the improvement in the vegetation cover level, among which the returning farmland to forest project and rocky desertification control project had the most significant effect on the improvement in vegetation cover (Table 10).
Table 10.
Vegetation coverage level structure changes in the first and eighth periods of the ecological engineering treatment period.
4.2. Changing Trend and Future Trend of FVC
The MK trend test and Sen slope estimation were carried out for FVC values during the ecological management period from 2000 to 2022, and, combined with the Hurst index, the statistical values of the FVC change trend and future trend area were obtained.
As it can be seen from Table 11 and Figure 8, in the study area, the area with an extremely significant growth in the FVC accounted for 52.63%, the area with a significant growth accounted for 11.22%, the area with an insignificant growth accounted for 23.82%, the area with an insignificant reduction accounted for 8.4%, the area with a significant reduction accounted for 1.3%, and the area with an extremely significant reduction accounted for 2.54%. More than 85% of the regions showed an increasing trend in the FVC, and about 13% of the regions showed a decreasing trend in the FVC. The distribution of the FVC trend map is shown in Figure 8 (left).
Table 11.
MK trend test statistics for the FVC from 2000 to 2022 and future trends.
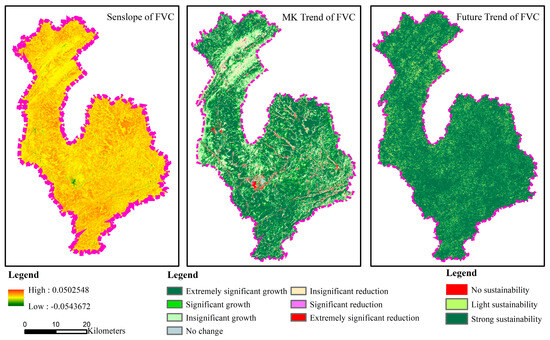
Figure 8.
FVC slope (left) and trend (medium) map from 2000 to 2022 and FVC future trend map (right).
The Hurst index of the FVC in the study area during the period 2000–2022 ranged from −0.233 to 2.476, with an average value of 0.864. The area with an H value greater than 0.75 accounted for 80.12%, and the area with an H value greater than 0.5 and less than or equal to 0.75 accounted for 19.25%, indicating that the future trend of most regions would develop in accordance with the current change trend. The proportion of highly stable growth accounted for about 80% of the corresponding growth trend change types, and the strong stable reduction type accounted for 79–85% of the corresponding reduction trend types. The sustainability profile of the FVC’s future trends is shown in Figure 8 (right).
As it can be seen from Figure 8 (medium), most of the areas in the study area belonged to the trends of extremely significant growth and significant growth. The insignificant growth trend was mainly located in the northern alpine forest land, which did not grow significantly due to the good foundation of the original forest land. The reduction was scattered or linear, mainly due to the occupation of construction land due to transportation.
From the statistics regarding whether the area was a rocky desertification monitoring area or not, among the extremely significant growth and significant growth, the proportion of the rocky desertification monitoring area was 70.28% and that of the non-rocky desertification monitoring area was 59.98%, indicating that the ecological engineering type of the stony desertification monitoring area was subject to more artificial intervention and the ecological governance effect was obvious. Among the insignificant growth and insignificant reduction with respect to this type, the proportion of the rocky desertification monitoring area was 25.42%, and the proportion of the non-rocky desertification monitoring area was slightly higher (36.3%) (Table 12).
Table 12.
MK trend test for FVC in rocky desertification monitoring area from 2000 to 2022.
From the perspective of the engineering category, the extremely significant growth trend in the farmland conversion to forest project accounted for the highest proportion, followed by the key public welfare forest management project. The lowest proportion was for the nature reserve project, and the extremely significant reduction trend area in other projects accounted for about 50%. Among the trend types of insignificant reduction, the nature reserve project accounted for the highest proportion (21.26%), followed by the middle–lower Yangtze River shelter belt project (8.76%). This shows that, even though ecological projects have played a great role in contributing to the increase in the share of the FVC structure, the FVC still fluctuates locally and needs to be monitored in a focused manner (Table 13).
Table 13.
MK trend test for the FVC by project from 2000 to 2022.
4.3. Relationship between FVC Change and Climate
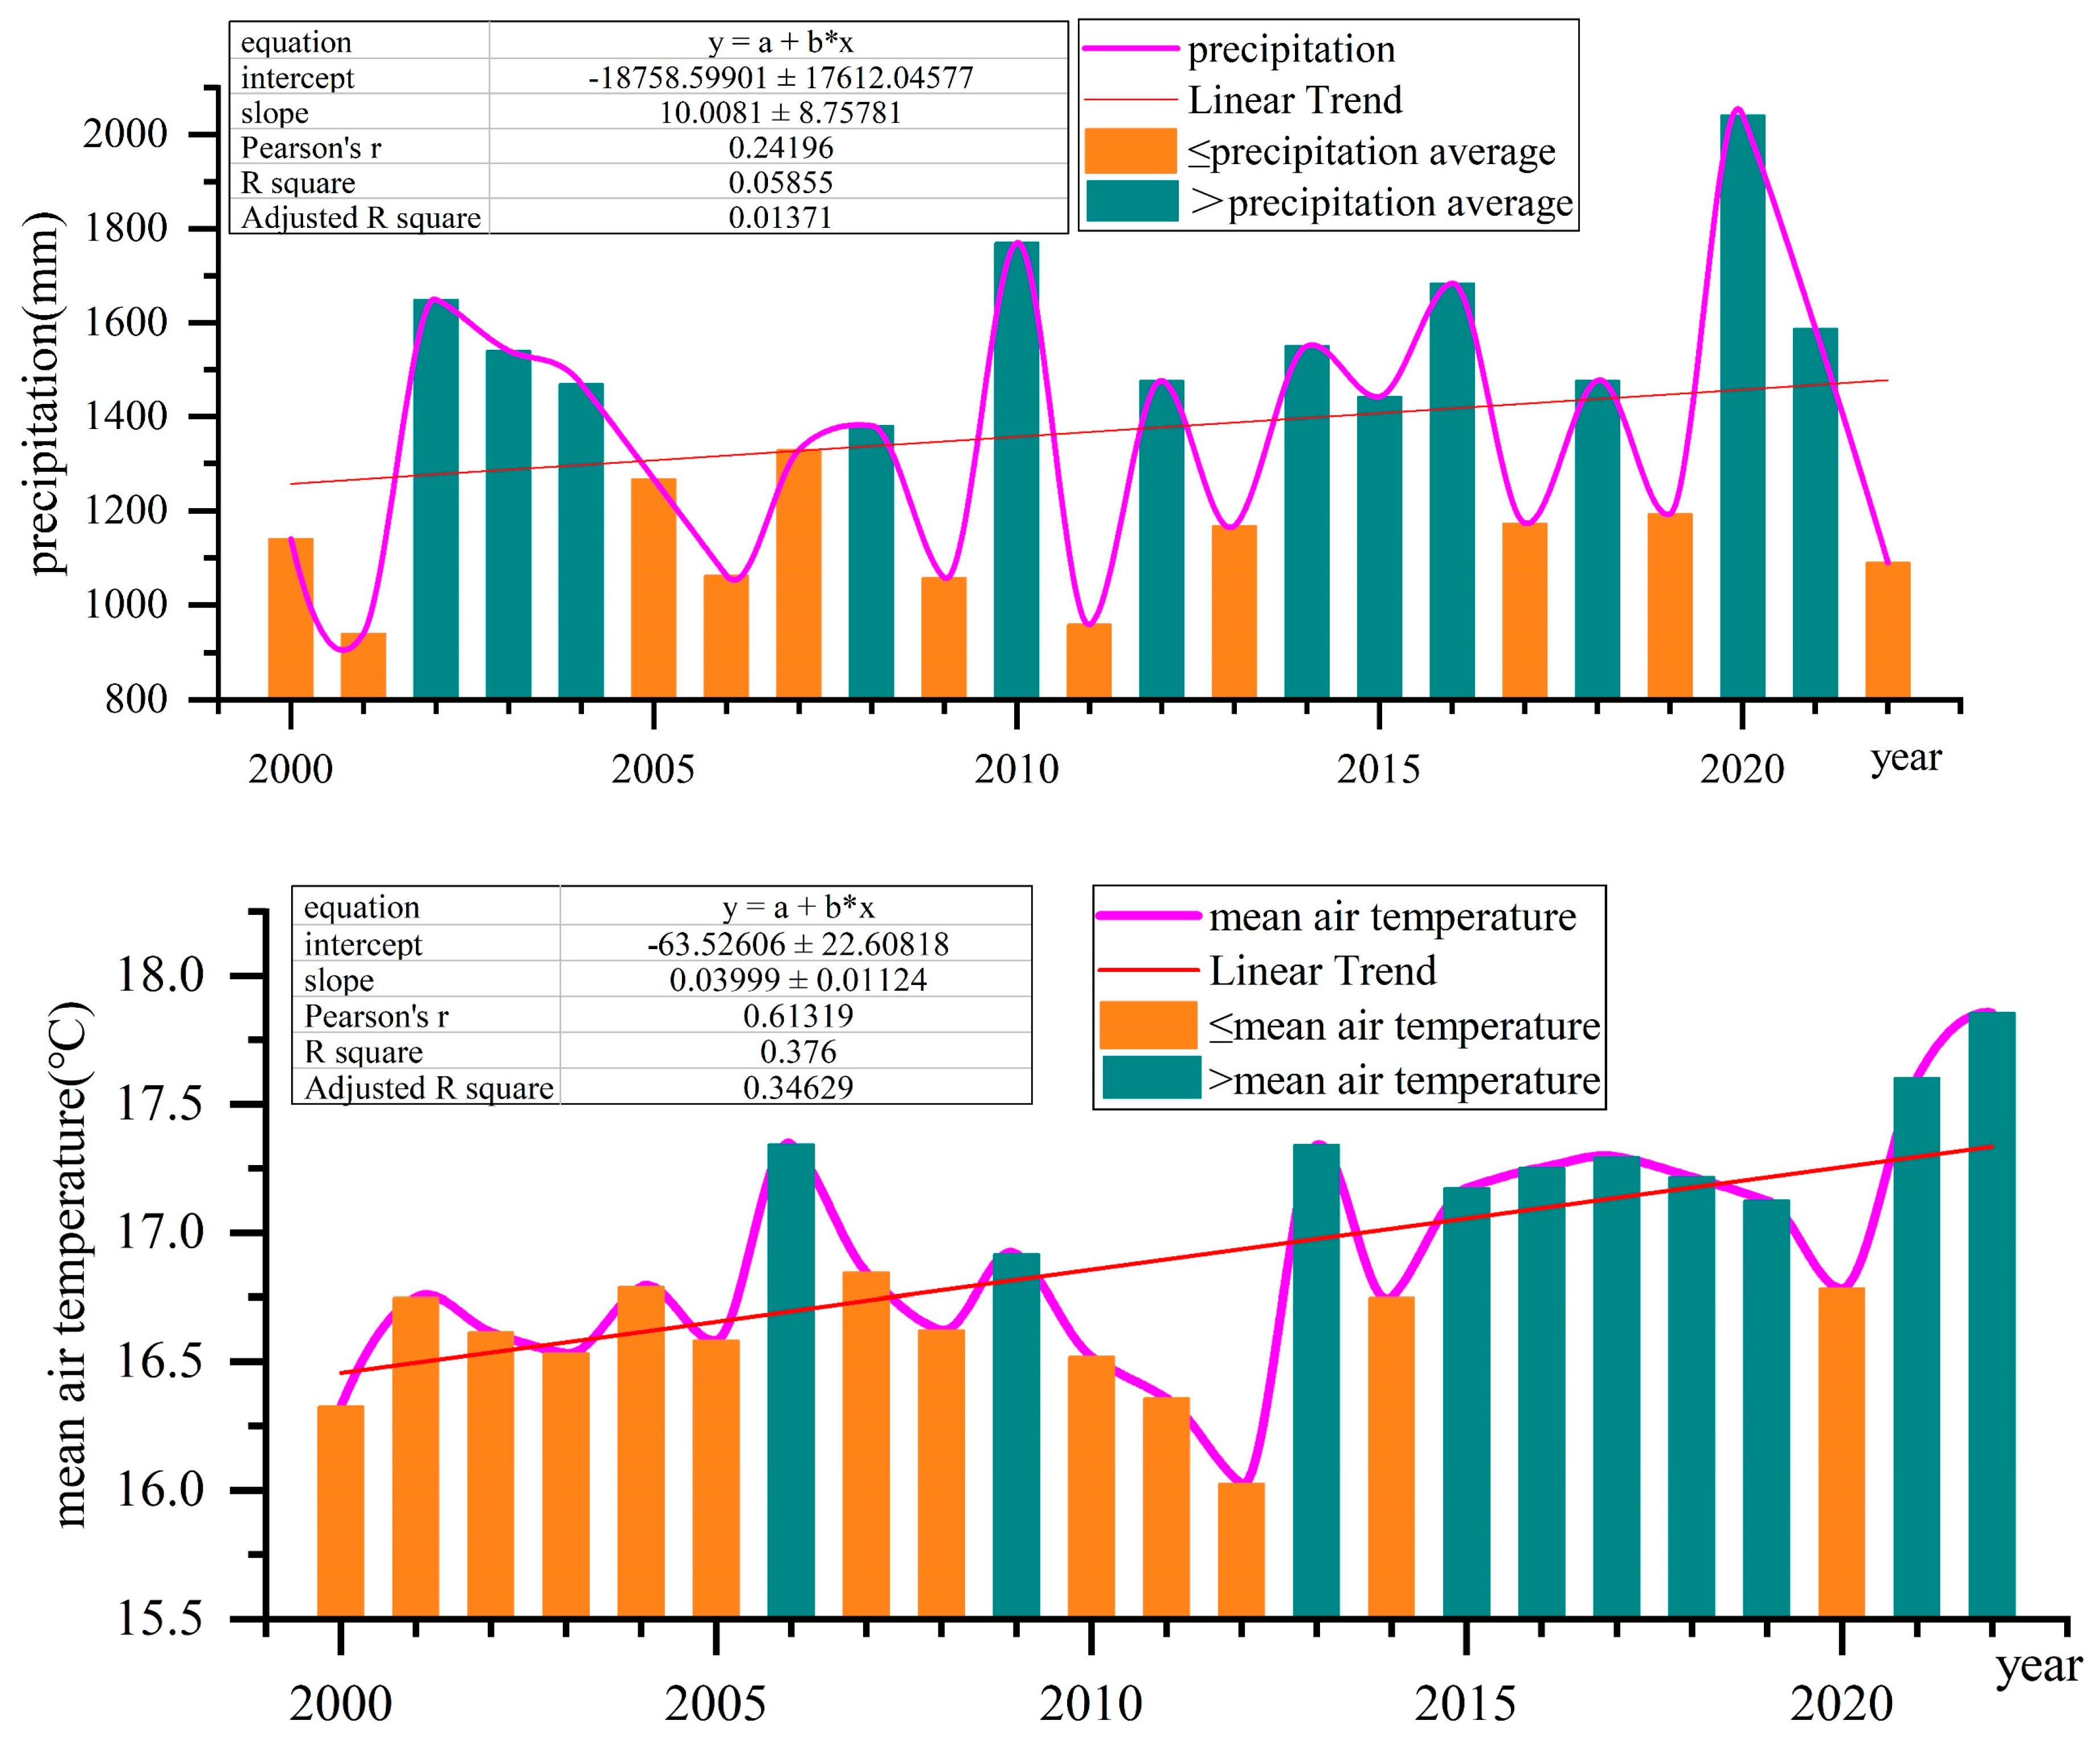
The annual mean value of precipitation in the study area from 2000 to 2022 was 1367.70 mm, with a rate of increase of 10.00 mm a−1 (0.8763% annual growth rate). The mean value of temperature from 2000 to 2022 was 16.90 °C, with a rate of increase of 0.04 °C a−1 (0.2450% annual growth rate), which suggests that there were indications of the study area warming and becoming wetter. Pearson’s correlation analysis showed a significant positive correlation between the FVC and temperature (R = 0.618, p = 0.001) and no significant correlation between the FVC and precipitation (R = 0.126, p = 0.559), indicating that the increase in temperature as a whole contributed to the increase in the FVC in the study area (Figure 9).
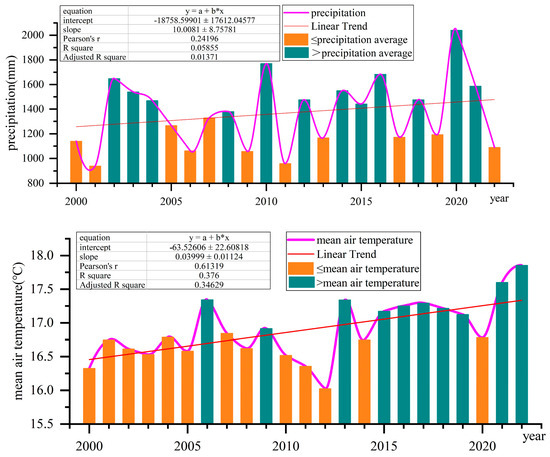
Figure 9.
Unitary linear-fitting map of annual precipitation and mean temperature between 2000 and 2022.
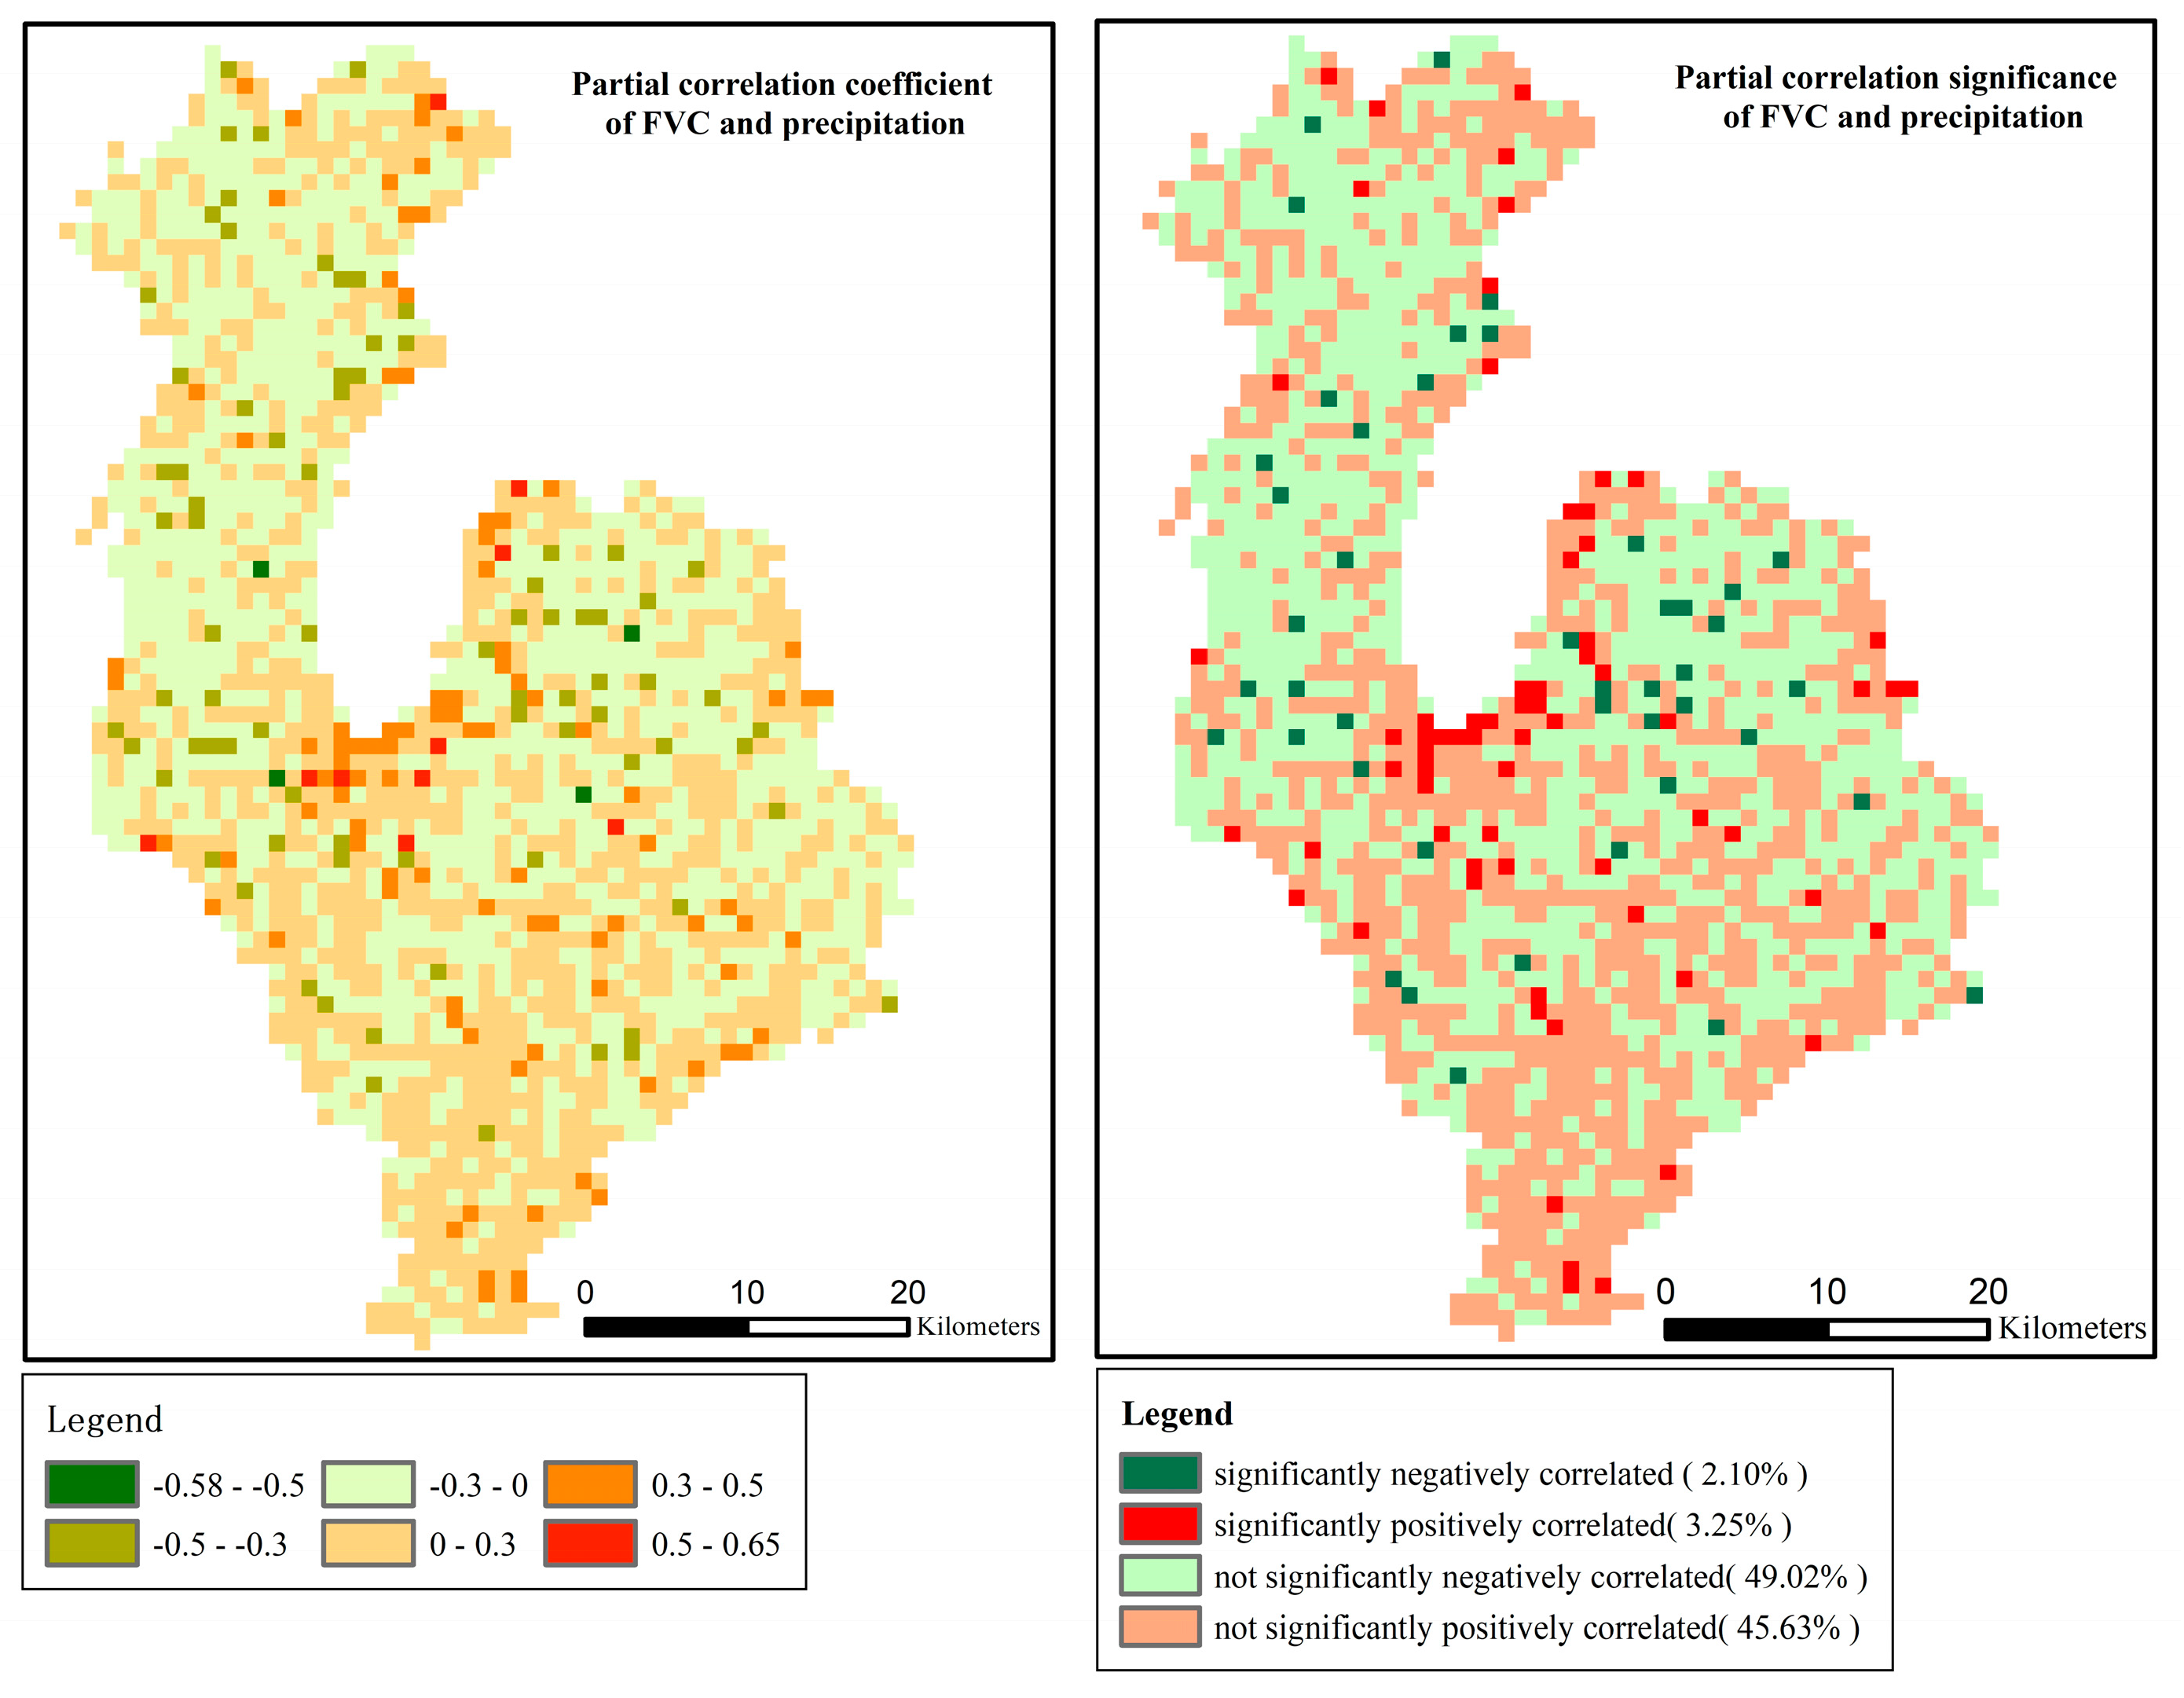
The partial correlation coefficient between the FVC and precipitation ranged from −0.58 to 0.65, with an average partial correlation coefficient of 0.004. The FVC and precipitation were significantly negatively correlated (p < 0.05) in 2.10% of the area, significantly positively correlated (p < 0.05) in 3.25% of the area, and not significantly negatively correlated in 49.02% of the area. From the significant distribution map of the partial correlation between the FVC and precipitation, the areas with non-significant negative correlation between the FVC and precipitation were mainly distributed in the northern (high elevation) and northeastern (high distribution of cultivated land) parts of the study area; the areas with a non-significant positive correlation were mainly distributed in the southern part of the study area, with lower elevation (Figure 10).
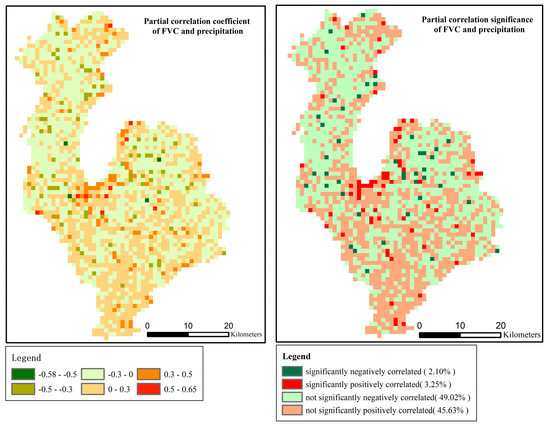
Figure 10.
Partial correlation coefficient and significance of FVC dynamics and precipitation from 2000 to 2022.
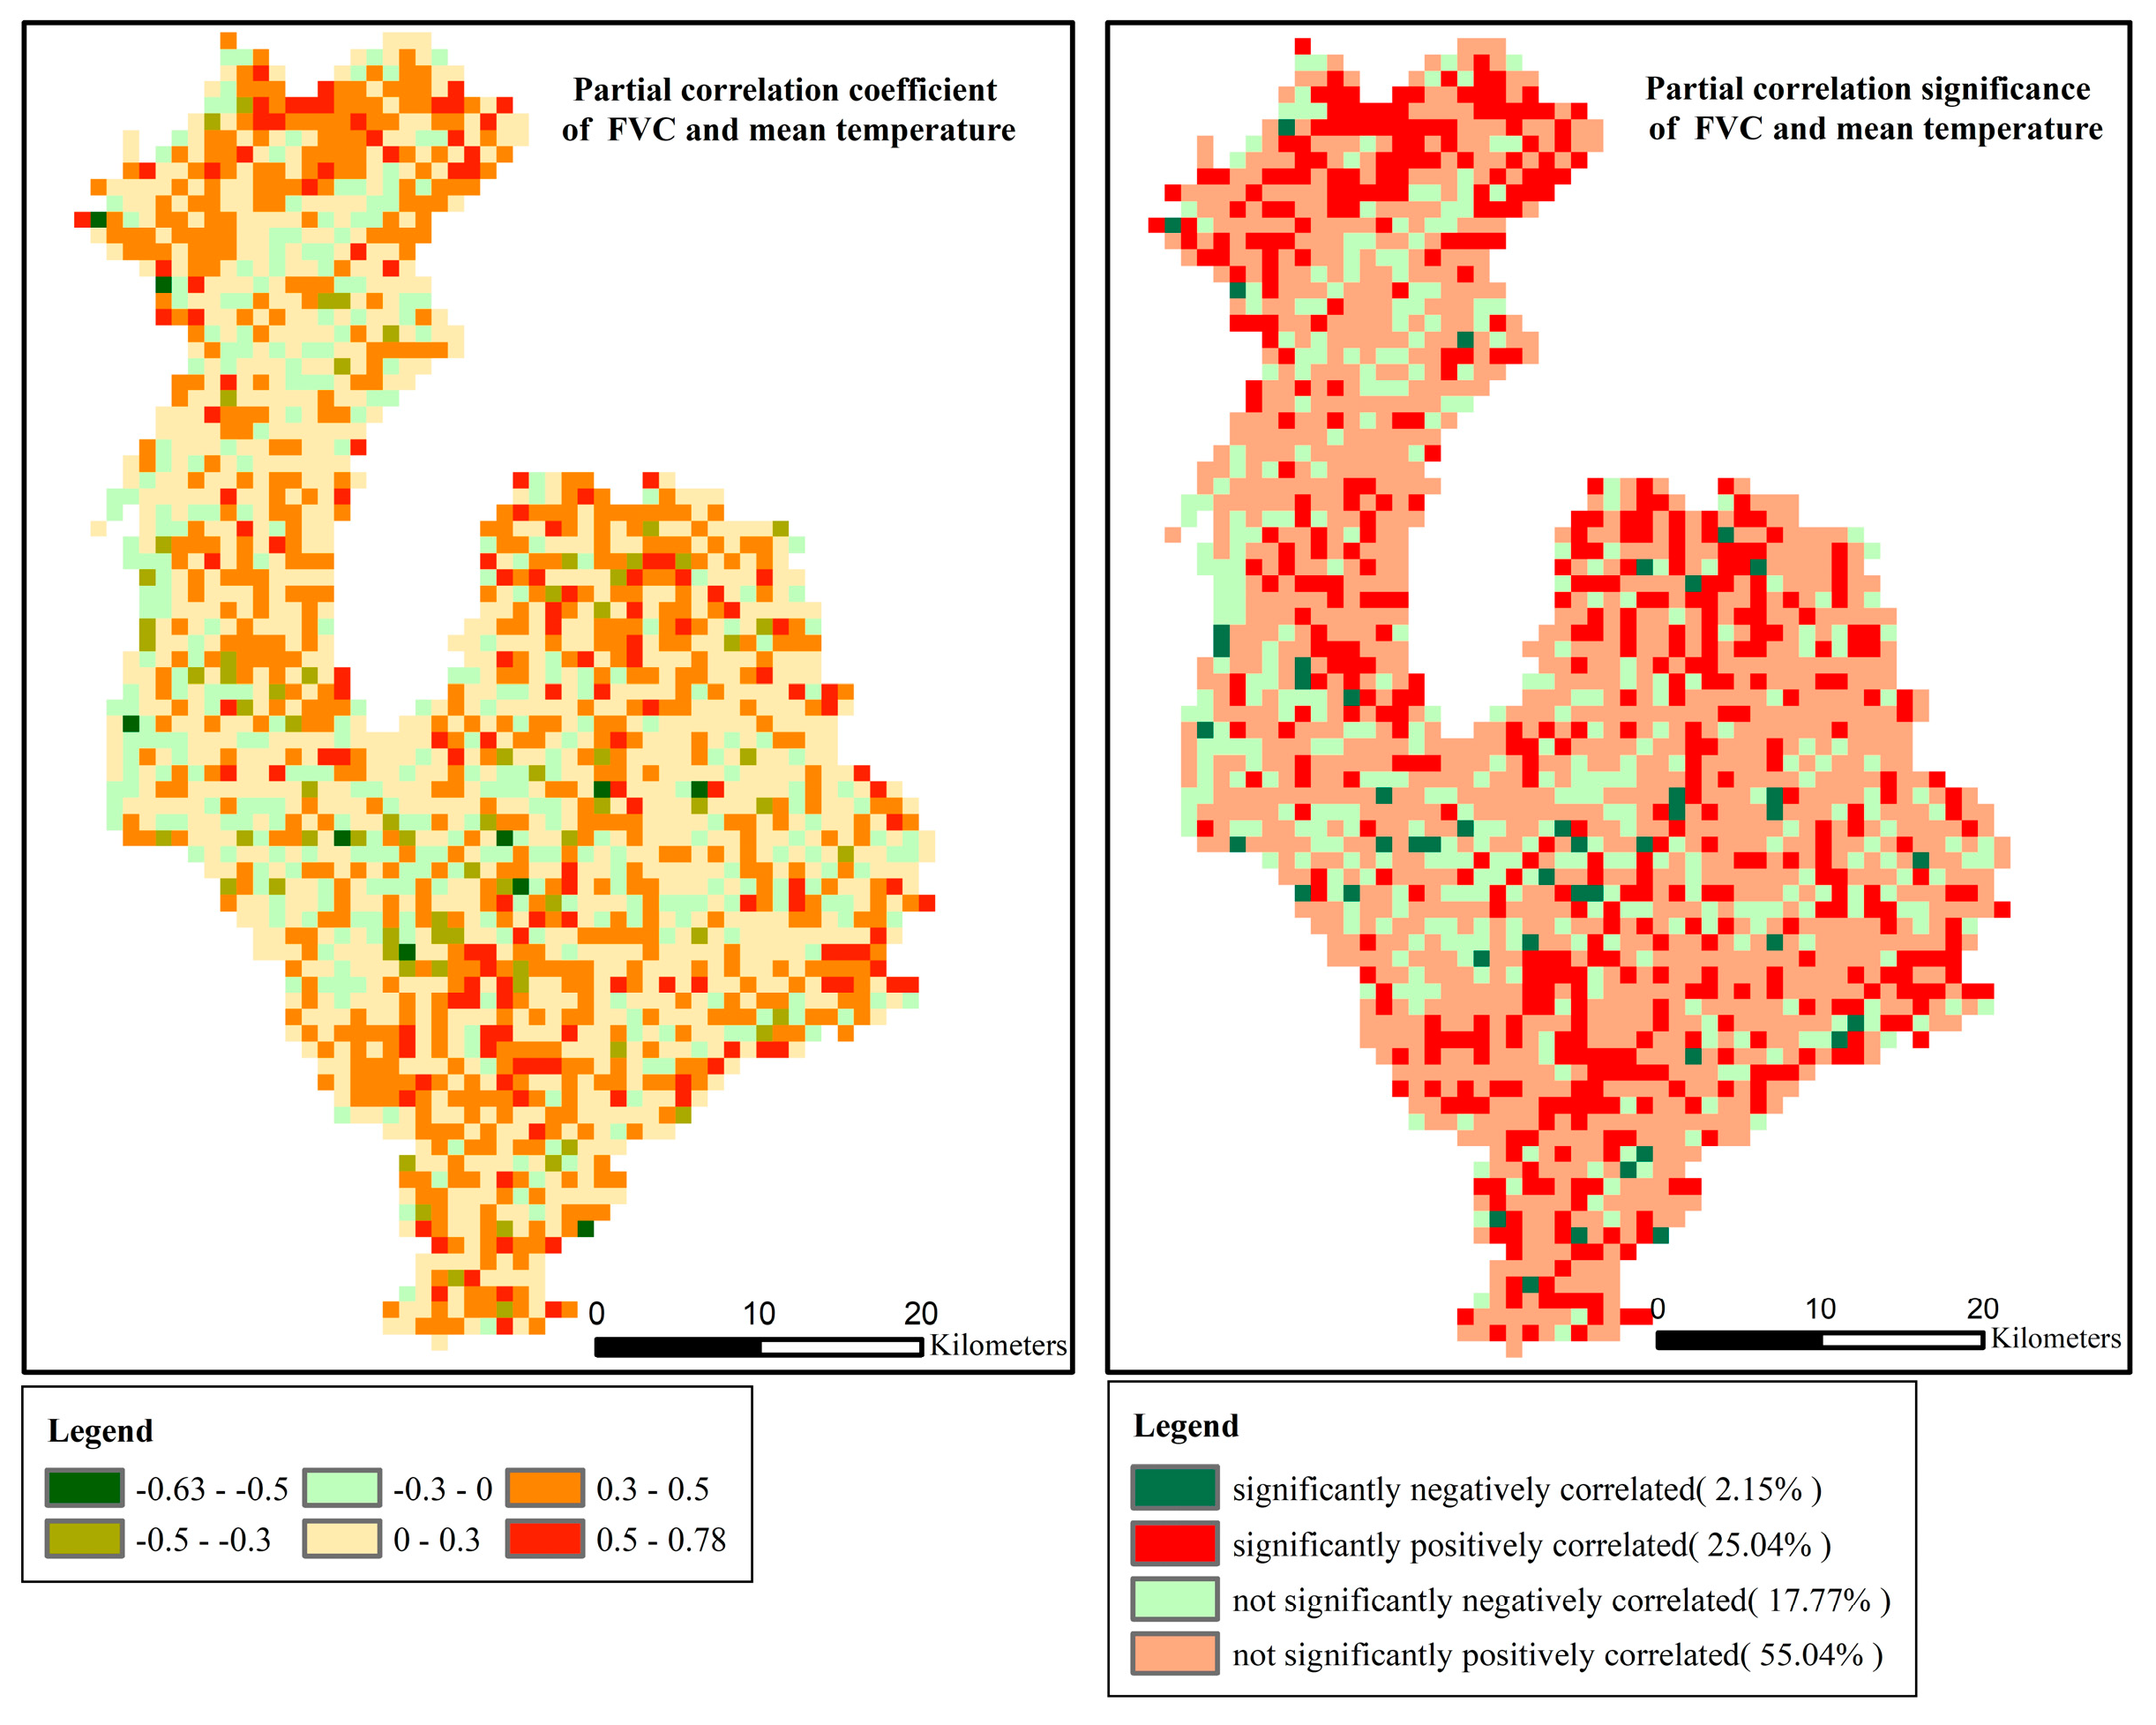
The partial correlation coefficient between the FVC and temperature ranged from −0.63 to 0.78, with an average partial correlation coefficient of 0.19. The area with a significant negative correlation between the FVC and temperature (p < 0.05) accounted for 2.15%, the area with a significant positive correlation (p < 0.05) accounted for 25.04%, the area with a non-significant negative correlation accounted for 17.77%, and the area with a non-significant positive correlation accounted for 55.04%. The positive correlation between the FVC and temperature was absolutely dominant. This indicates that the FVC is more sensitive to temperature than precipitation in areas with sufficient precipitation (Figure 11).
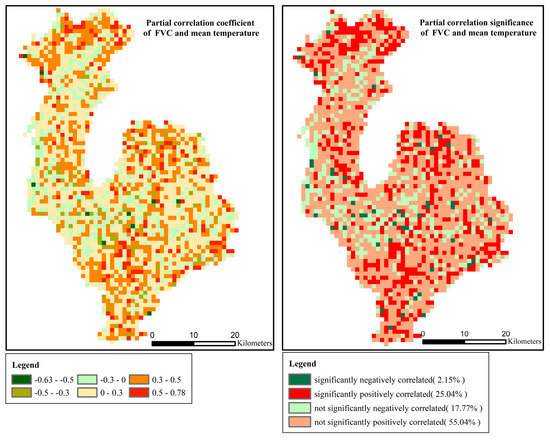
Figure 11.
Partial correlation coefficient and significance of FVC dynamics and mean temperature from 2000 to 2022.
4.4. Driving Force of FVC Change and Contribution Rate of Each Factor
Figure 12 shows that 79.03% of the regions in the study area suggest that the combined effect of climate change and human activities was the driving factor for the increase in the FVC; the area of FVC increase caused by climate change alone accounted for 4.36%, and the area of FVC increase caused by human activities alone accounted for about 5.88%.
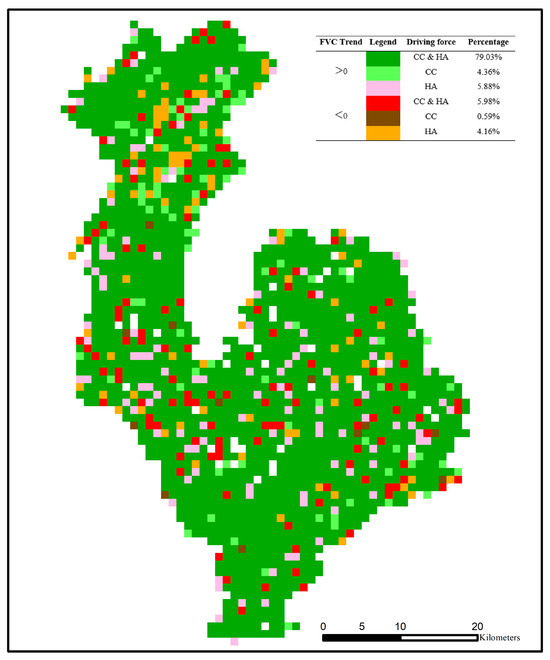
Figure 12.
Spatial distribution of drivers of vegetation cover change (CC and HA refer to climate change and human activities, respectively).
A total of 5.98% of the study area suggests that the combined effect of climate change and human activities was the driving factor for FVC reduction. The areas of FVC decreased by climate change alone and by human activities alone accounted for 0.59% and 4.16%, respectively. Overall, the combined effects of climate change and human activities are the main causes of FVC changes.
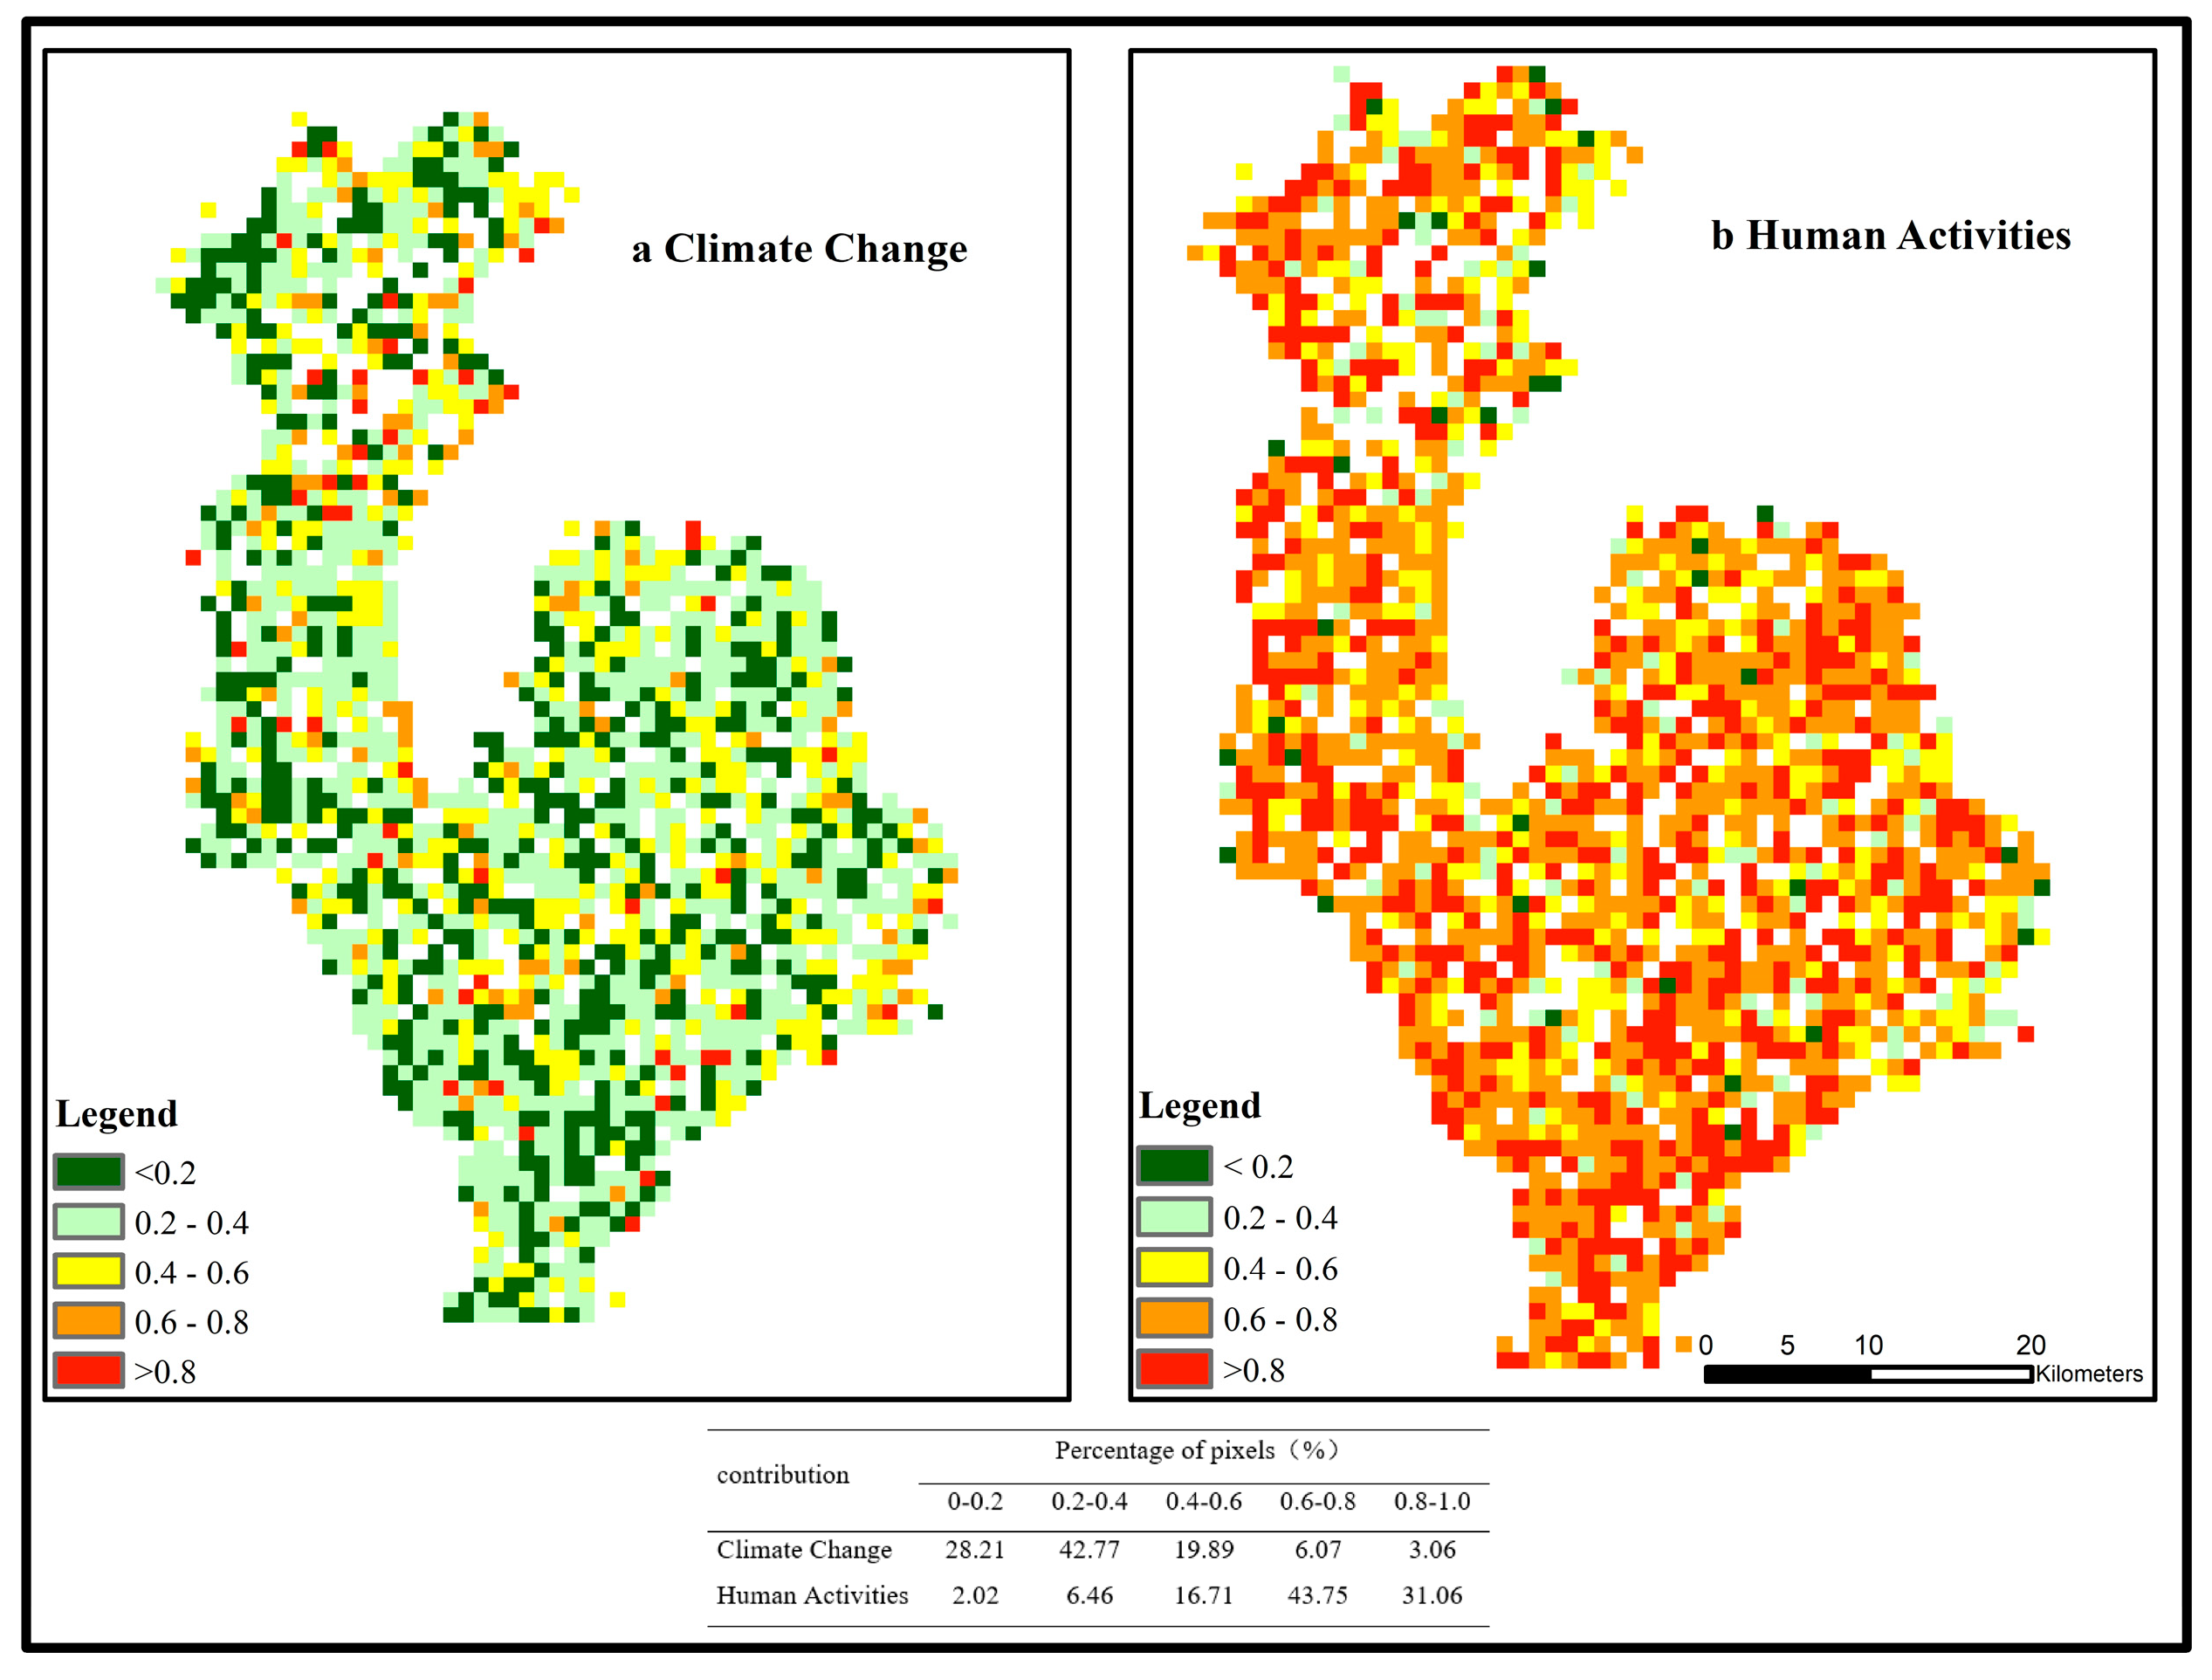
The average contribution of climate change was 0.31, and the average contribution of human activities was 0.69. Figure 13 shows that the contribution rate of climate change to FVC change was larger in the ranges 0–0.2 and 0.2–0.4, and the contribution rate of human activities to FVC change was larger in the ranges 0.6–0.8 and 0.8–1.0. In most regions, the contribution of human activities to the increase in the FVC was generally greater than that of climate change. According to the average change trend in the FVC in the study area and the average change trend in the FVC forecast and FVC residual, we calculated that the contributions of climate change and human activities to FVC change were about 30% and 70%, respectively.
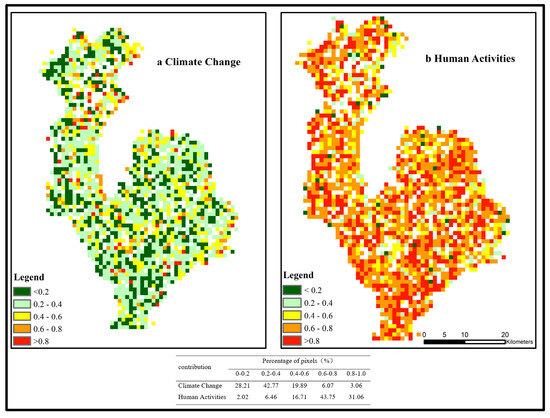
Figure 13.
Spatial distribution of contribution rates of climate change and human activities to vegetation cover change from 2000 to 2022.
5. Conclusions
We estimated the vegetation coverage of the Mengdong River Basin and analyzed the spatial-temporal characteristics and driving factors of vegetation coverage based on Landsat remote sensing images over the past 40 years. The overall FVC in the study area showed a trend of stabilization followed by growth, with the FVC remaining stable in the pre-ecological management period (1987–1999), while the FVC showed a significant increase during the ecological management period (2000–2022), with an average annual growth rate of 0.00942a−1 and a growth rate of 1.64%. The average value of the FVC in each year of the ecological management period showed the characteristics of forest land > shrub land > other forest land > garden land > grassland > cultivated land. The FVC grade showed the characteristic of changing from an FVC2/3/4 grade to an FVC5 grade, and the area of grade 5 accounted for more than 65%, indicating that dense vegetation cover occupied a dominant position in the region. From the perspective of ecological engineering types, the FVC5 level area had the most significant increase in the conversion of farmland to forest and the control of rocky desertification.
The area with an extremely significant growth in the FVC accounted for 52.63%, the area with significant growth accounted for 11.22%, and the area with insignificant growth accounted for 23.82%. Among the areas with extremely significant and significant growth, the proportion of the rocky desertification monitoring area was 70.28% and that of the non-rocky desertification monitoring area was 59.98%, indicating that the ecological engineering type of the stony desertification monitoring area was subject to more artificial intervention and that the ecological governance effect was obvious. The results of the MK mutation test of the FVC data in the ecological management period show that FVC values presented a decreasing trend from 2000 to 2003, after which the FVC had a significant upward trend; 2008 was the mutation year when the effectiveness of ecological management began to be evident.
The average partial correlation coefficient between the FVC and precipitation was −0.16 and that between the FVC and temperature was 0.27. The proportion of area of significant positive correlation and significant negative correlation between the FVC and temperature was slightly higher than that of precipitation, indicating that the FVC is more sensitive to temperature than precipitation.
The residual analysis results show that 79.03% of the study area suggested that the combined effect of climate change and human activities was the driving factor for the increase in the FVC, and the combined effect of climate change and human activities was the main reason for the change in the FVC. The contributions of climate change and human activities to FVC variation were about 30% and 70%, respectively.
Author Contributions
Conceptualization, D.C.; methodology, D.C. and S.W.; data analysis, D.C.; data curation, D.C.; writing—review and editing D.C.; writing—original draft preparation, D.C.; visualization, D.C.; project administration, D.C.; funding acquisition, D.C. All authors have read and agreed to the published version of the manuscript.
Funding
This research was funded by the Open Innovation Fund Project: A Study on Disturbance Range Identification in Production Construction Projects Utilizing Deep Learning under Grant 20K149 and by the National Key Research and Development Program of China (2021YFD2201303).
Data Availability Statement
All the data or code generated or used during this study are available from the author upon request (t20071062@csuft.edu.cn).
Conflicts of Interest
The authors declare no conflicts of interest.
References
- Wang, S. Concept Deduction and Its Connotation. Carsologica Sin. 2002, 21, 101–105. [Google Scholar]
- Cui, J.; Wen, Q.; Huang, J. Study on comprehensive treatment of rocky desertification in karst area. Soil Water Conserv. China 2024, 4, 49–52. [Google Scholar]
- Wu, D.; Cai, Y. Evaluation of Ecological Restoration Effects in China: A Review. Prog. Geogr. 2009, 28, 622–628. [Google Scholar]
- Long, M.; Bai, X.; Li, Z.; Xue, Y.; Chen, F.; Li, C.; Ran, C.; Zhang, S.; Du, C.; Song, F.; et al. Positive contribution and negative impact of karst rocky desertification control on biodiversity in southwest China. Acta Geogr. Sin. 2024, 79, 97–113. [Google Scholar]
- Guo, B.; Yang, F.; Fan, Y.; Zang, W. The dominant driving factors of rocky desertification and their variations in typical mountainous karst areas of southwest China in the context of global change. Catena 2023, 220, 106674. [Google Scholar] [CrossRef]
- Xu, E.; Zhang, H.; Li, M. Mining spatial information to investigate the evolution of karst rocky desertification and its human driving forces in Changshun, China. Sci. Total Environ. 2013, 458, 419–426. [Google Scholar] [CrossRef] [PubMed]
- Xu, H.; Wang, Y.; Su, Q.; Li, Z.; Jia, Y. Evolution of rock desertification and driving factors in typical karst areas of Yunnan province. J. Arid Land Resour. Environ. 2022, 36, 94–101. [Google Scholar]
- Wen, Y.; Cai, H.; Han, D. Driving factors analysis of spatial-temporal evolution of vegetation ecosystem in rocky desertification restoration area of Guizhou Province, China. Environ. Sci. Pollut. Res. Int. 2024, 31, 13122–13140. [Google Scholar] [CrossRef] [PubMed]
- Li, Y.; Sun, B.; Gao, Z.; Su, W.; Wang, B.; Yan, Z.; Gao, T. Extraction of rocky desertification information in karst area by using different multispectral sensor data and multiple endmember spectral mixture analysis method. Front. Environ. Sci. 2022, 10, 996708. [Google Scholar] [CrossRef]
- Chen, X.; Vierling, L.; Rowell, E.; DeFelice, T. Using lidar and effective LAI data to evaluate IKONOS and Landsat 7 ETM+ vegetation cover estimates in a ponderosa pine forest. Remote Sens. Environ. 2004, 91, 14–26. [Google Scholar] [CrossRef]
- Gitelson, A.; Kaufman, Y.; Stark, R.; Rundquist, D. Novel algorithms for remote estimation of vegetation fraction. Remote Sens. Environ. 2002, 80, 76–87. [Google Scholar] [CrossRef]
- Cai, H.; Yang, X.; Wang, K.; Xiao, L. Is Forest Restoration in the Southwest China Karst Promoted Mainly by Climate Change or Human-Induced Factors? Remote Sens. 2014, 6, 9895–9910. [Google Scholar] [CrossRef]
- Tong, X.; Wang, K.; Yue, Y.; Brandt, M.; Liu, B. Quantifying the effectiveness of ecological restoration projects on long-term vegetation dynamics in the karst regions of Southwest China. Int. J. Appl. Earth Obs. Geoinf. 2017, 54, 105–113. [Google Scholar] [CrossRef]
- Tong, X.; Brandt, M.; Yue, Y.; Horion, S.; Wang, K. Increased vegetation growth and carbon stock in China karst via ecological engineering. Nat. Sustain. 2018, 1, 44. [Google Scholar] [CrossRef]
- Brandt, M.; Yue, Y.; Wigneron, J.; Tong, X.; Tian, F. Satellite-observed major greening and biomass increase in South China karst during recent decade. Earth’s Future 2018, 6, 1017–1028. [Google Scholar] [CrossRef]
- Liao, C.; Yue, Y.; Wang, K.; Fensholt, R.; Tong, X. Ecological restoration enhances ecosystem health in the karst regions of southwest China. Ecol. Indic. 2018, 90, 416–425. [Google Scholar] [CrossRef]
- Zhang, W.; Cao, J.; Wu, X. Dynamic monitoring and control benefits of vegetation in rocky desertification areas based on Landsat images. Trans. Chin. Soc. Agric. Eng. (Trans. CSAE) 2019, 35, 221–229. [Google Scholar]
- Zhou, H.; Wang, Z.; Wu, X.; Chen, Y.; Zhong, Y.; Li, Z.; Chen, J.; Li, J.; Guo, S.; Chen, X. Spatiotemporal Variation of Annual Runoff and Sediment Load in the Pearl River during 1953–2017. Sustainability 2019, 11, 5007. [Google Scholar] [CrossRef]
- Stow, D.; Hope, A.; McGuire, D.; Verbyla, D.; Gamon, J. Remote sensing of vegetation and land-cover change in Arctic tundra ecosystems. Remote Sens. Environ. 2004, 89, 281–308. [Google Scholar] [CrossRef]
- Lamchin, M.; Lee, M.; Jeon, W.; Wang, W.; Lim, H. Long-term trend of and correlation between vegetation greenness and climate variables in Asia based on satellite data. Methodsx 2018, 618, 803–807. [Google Scholar] [CrossRef]
- Xue, X.; Wang, Z.; Hou, S. NDVI-Based Vegetation Dynamics and Response to Climate Changes and Human Activities in Guizhou Province, China. Forests 2023, 14, 753. [Google Scholar] [CrossRef]
- Liu, Y.; Li, L.; Chen, X.; Zhang, R.; Yang, J. Temporal-spatial variations and influencing factors of vegetation cover in Xin jiang from 1982 to 2013 based on GIMMS-NDVI3g. Glob. Planet. Chang. 2018, 169, 145–155. [Google Scholar] [CrossRef]
- Li, Y.; Cao, Z.; Long, H.; Liu, Y.; Li, W. Dynamic analysis of ecological environment combined with land cover and NDVI changes and implications for sustainable urban-rural development: The case of Mu Us Sandy Land, China. J. Clean. Prod. 2016, 142, 697–715. [Google Scholar] [CrossRef]
- Wande, G.; Ce, Z.; Liu, X.; Lu, Y.; Chen, Y.; Wei, Y.; Ma, Y. NDVI-based vegetation dynamics and their responses to climate change and human activities from 1982 to 2020: A case study in the Mu Us Sandy Land, China. Ecol. Indic. 2022, 137, 108745. [Google Scholar]
- Xu, X.; Liu, H.; Jiao, F.; Gong, H.; Lin, Z. Time-varying trends of vegetation change and their driving forces during 1981-2016 along the Silk Road Economic Belt. Catena 2020, 195, 104796. [Google Scholar] [CrossRef]
- Yan, D.; Wu, X.; Wang, B.; Hao, H. Characteristics and driving forces of changes in vegetation coverage on the Loess Plateau, 1982–2015. Acta Ecol. Sin. 2023, 43, 9794–9804. [Google Scholar]
- Zhang, X.; Wang, K.; Yue, Y.; Tong, X.; Liao, C. Factors impacting on vegetation dynamics and spatial non-stationary relationships in karst regions of southwest China. Acta Ecol. Sin. 2017, 37, 4008–4018. [Google Scholar]
- Chen, T.; Huang, Q.; Wang, Q. Differentiation characteristics and driving factors of ecosystem services relationships in karst mountainous area based on geographic detector modeling: A case study of Guizhou Province. Acta Ecol. Sin. 2022, 42, 6959–6972. [Google Scholar]
- Ma, B.; He, C.; Jing, J.; Wang, Y.; Liu, B. Attribution of vegetation dynamics in Southwest China from 1982 to 2019. Acta Geogr. Sin. 2023, 78, 714–728. [Google Scholar]
- Jin, K.; Wang, F.; Han, J.; Shi, S.; Ding, W. Contribution of climatic change and human activities to vegetation NDVI change over China during 1982–2015. Acta Geogr. Sin. 2020, 75, 961–974. [Google Scholar]
- Qi, X.; Jia, J.; Liu, H.; Lin, Z. Relative importance of climate change and human activities for vegetation changes on China’s silk road economic belt over multiple timescales. Catena 2019, 180, 224–237. [Google Scholar] [CrossRef]
- Shi, S.; Yu, J.; Wang, F.; Wang, P.; Zhang, Y.; Jin, K. Quantitative contributions of climate change and human activities to vegetation changes over multiple time scales on the Loess Plateau. Sci. Total Environ. 2021, 755, 142419. [Google Scholar] [CrossRef] [PubMed]
- Deng, Y.; Wang, Z.; Lu, S.; Zhong, J.; Zhu, L.; Chen, F.; Wu, L. Soil quality assessment via the factor analysis of karst rocky desertification areas in Hunan, China. Soil Use Manag. 2021, 38, 248–261. [Google Scholar] [CrossRef]
- Gen, G. The trend of rocky desertification land expansion in China is reversed—The National Forestry and Grassland Administration announces the third monitoring result of rocky desertification. Green China 2018, 23, 8–11. [Google Scholar]
- Guanyao, L. Concentrated Stream Data Processing for Vegetation Coverage Monitoring and Recommendation against Rock Desertification. Processes 2022, 10, 2628. [Google Scholar] [CrossRef]
- Li, S.; Zhou, Z.; Ma, R.; Liu, S.; Guan, Q. Extracting subpixel vegetation NDVI time series for evaluating the mixed pixel effect on GPP estimation in urban areas. Int. J. Digit. Earth 2023, 16, 3222–3238. [Google Scholar] [CrossRef]
- Xie, Y.; Li, Z.; Zhu, L.; Zhou, Y.; Liu, H.; Yu, T. Dynamic monitoring of desertification in response to climatic factors: A case study from the Gelintan Oasis on the southeastern edge of the Tengger Desert, China. Geocarto Int. 2022, 37, 9453–9473. [Google Scholar] [CrossRef]
- Wang, X.; Song, J.; Xiao, Z.; Wang, J.; Hu, F. Desertification in the Mu Us Sandy Land in China: Response to climate change and human activity from 2000 to 2020. Geogr. Sustain. 2022, 3, 177–189. [Google Scholar] [CrossRef]
- Hadi, D.; Hamid, G.; Telfer, W.; Rodrigo, J.; Collins, L.; Jansen, D. Desertification of Iran in the early twenty-first century: Assessment using climate and vegetation indices. Sci. Rep. 2021, 11, 20548. [Google Scholar]
- Tong, X.; Wang, K.; Brandt, M.; Yue, Y.; Liao, C.; Fensholt, R. Assessing Future Vegetation Trends and Restoration Prospects in the Karst Regions of Southwest China. Remote Sens. 2016, 8, 357. [Google Scholar] [CrossRef]
- Yan, Y.; Xin, Z.; Bai, X.; Zhan, H.; Xi, J.; Xie, J.; Cheng, Y. Analysis of Growing Season Normalized Difference Vegetation Index Variation and Its Influencing Factors on the Mongolian Plateau Based on Google Earth Engine. Plants 2023, 12, 2550. [Google Scholar] [CrossRef] [PubMed]
- Qi, X.; Sheng, H. Hurst Index Analysis of Social Electricity Consumption Change Trend Based on R/S Analysis. IOP Conf. Ser. Mater. Sci. Eng. 2020, 750, 012150. [Google Scholar] [CrossRef]
- Pei, J.; Wang, L.; Wang, X.; Niu, Z.; Kelly, M.; Song, X.P.; Huang, N.; Geng, J.; Tian, H.; Yu, Y.; et al. Time Series of Landsat Imagery Shows Vegetation Recovery in Two Fragile Karst Watersheds in Southwest China from 1988 to 2016. Remote Sens. 2019, 11, 2044. [Google Scholar] [CrossRef]
- Kim, J.; Hong, S.; Choi, I. Partial Correlation Analysis and Neural-Network-Based Prediction Model for Biochemical Recurrence of Prostate Cancer after Radical Prostatectomy. Appl. Sci. 2023, 13, 891. [Google Scholar] [CrossRef]


Disclaimer/Publisher’s Note: The statements, opinions and data contained in all publications are solely those of the individual author(s) and contributor(s) and not of MDPI and/or the editor(s). MDPI and/or the editor(s) disclaim responsibility for any injury to people or property resulting from any ideas, methods, instructions or products referred to in the content. |
© 2024 by the authors. Licensee MDPI, Basel, Switzerland. This article is an open access article distributed under the terms and conditions of the Creative Commons Attribution (CC BY) license (https://creativecommons.org/licenses/by/4.0/).