Article

MART3D: A Multilayer Heterogeneous 3D Radiative Transfer Framework for Characterizing Forest Disturbances

Innovation Research Center of Satellite Application (IRCSA), State Key Laboratory of Remote Sensing Science, Faculty of Geographical Science, Beijing Normal University, Beijing 100875, China
*
Author to whom correspondence should be addressed.
Forests 2024, 15(5), 824; https://doi.org/10.3390/f15050824
Submission received: 22 March 2024 / Revised: 27 April 2024 / Accepted: 6 May 2024 / Published: 8 May 2024

Abstract

:
The utilization of radiative transfer models for interpreting remotely sensed data to evaluate forest disturbances is a cost-effective approach. However, the current radiative transfer modeling approaches are either too abstract (e.g., 1D models) or too complex (detailed 3D models). This study introduces a novel multilayer heterogeneous 3D radiative transfer framework with medium complexity, termed MART3D, for characterizing forest disturbances. MART3D generates 3D canopy structures accounting for the within-crown clumping by clustering leaves, which is modeled as a turbid medium, around branches, applicable for forests of medium complexity, such as temperate forests. It then automatically generates a multilayer forest with grass, shrub and several layers of trees using statistical parameters, such as the leaf area index and fraction of canopy cover. By employing the ray-tracing module within the well-established LargE-Scale remote sensing data and image Simulation model (LESS) as the computation backend, MART3D achieves a high accuracy (RMSE = 0.0022 and 0.018 for red and Near-Infrared bands) in terms of the bidirectional reflectance factor (BRF) over two RAMI forest scenes, even though the individual structures of MART3D are generated solely from statistical parameters. Furthermore, we demonstrated the versatility and user-friendliness of MART3D by evaluating the band selection strategy for computing the normalized burn ratio (NBR) to assess the composite burn index over a forest fire scene. The proposed MART3D is a flexible and easy-to-use tool for studying the remote sensing response under varying vegetation conditions.

1. Introduction

Forest disturbances, such as wildfires, insect invasion, the spread of invasive plants and pathogen outbreaks, are greatly transforming and shaping the forest composition and structures of forests in various pathways, including reductions in foliage, the removal of underbrush and the thinning of the canopy and reducing habitats for animals [1,2,3,4,5]. In recent years, driven by climate change and other factors, forest disturbances have occurred more frequently, and the intensity of disturbances has shown an increasing trend, causing serious impacts on ecosystem services such as forest carbon sink [6]. Therefore, constant estimating and monitoring the distribution and severity of these disturbances are necessary, which is of utmost significance in choosing appropriate post-disturbance management strategies, aiming to minimize secondary consequences, such as soil degradation, and hasten the regrowth process [7,8]. Although field measurements are the primary means of obtaining information on disturbance status, they are often very time-consuming, resource-intensive and unsuitable for large-scale assessment efforts.
Remote sensing nowadays has been recognized as a powerful and cost-effective tool for mapping large-scale forest disturbances using remote sensing data, including images and LiDAR data [3]. Different types and severities of forest disturbances will cause different biochemical responses and structural changes in the forest, which are reflected in different responses to remote sensing signals. Wildfires can destroy vegetation, and even after a long period of restoration, the vegetation coverage in severely burned areas is still far behind the original [9], and the red, Near-Infrared (NIR) and Short-wave Infrared (SWIR) bands are sensitive to the burned areas and vegetation areas affected by fires [10]. Forest insects and diseases can cause a reduction in biomass, changes to pigment content and wilting in plants. [11]. For example, pine shoot beetles cause changes in the color of needles, which in turn affects the spectral characteristics of pine trees in the affected area, resulting in changes in the needle reflectance in the green, red and NIR bands [12]. Therefore, mapping the disturbance distribution and severity of disturbances requires an interpretation of remotely sensed signals to estimate variables related to canopy structural and spectral properties. Empirical statistical methods and image pattern recognition methods are commonly used to monitor forest disturbances through remote sensing. The vegetation index empirical threshold method is a widely used empirical statistical method, where indices include the Normalized Difference Vegetation Index (NDVI) [13], the Normalized Difference Moisture Index (NDMI) [14], etc. However, there are large differences between different regions, different types of forest (e.g., temperate forest and tropical forest), plant formations (e.g., grass, shrubs, mediate trees and upper trees) and disturbance categories (e.g., wildfires, forest insects and diseases), making this method difficult to transfer and apply. Among the image pattern recognition methods, traditional machine learning algorithms such as random forests [15,16,17] and support vector machines [18,19], as well as deep learning algorithms like the UNet model [20], are often utilized to monitor forest disturbance areas. But such methods have high requirements on data quality and availability, and the accuracy is often limited by ground survey data [16].
Among all approaches, radiative transfer modeling has been regarded as a general method to estimate canopy structural properties that does not require field measurements through the simulation of remote sensing signals under various canopy architectures [21]. This method has better interpretability because it takes into account the spectral response mechanism under vegetation stress, and it is more feasible for forest disturbance mapping in different regions because it does not rely on local training samples. Therefore, it can be adapted to different stand types and study areas. Moreover, the radiative transfer model has the ability to describe complex canopies and can more accurately characterize different types of damaged leaves under the influence of disturbances [22].
To date, however, radiative transfer models have not been widely applied to characterize forest disturbances, with a few exceptions being the assessment of burn severities [7,23,24,25], estimation of canopy structural variables [26,27] and monitoring of pests and diseases [28,29,30]. An underlying reason is that the majority of current radiative transfer models are either too abstract to accurately depict heterogeneous canopy structures or too complex for common users to parametrize. For example, the extensively used PROSAIL, i.e., PROSPECT+SAIL (Scattering by Arbitrarily Inclined Leaves) [31], relies on simplifying the foliage and branches into a turbid medium, ignoring within-canopy fine-scale structures, e.g., the clumping of leaves. Although 3D radiative transfer models, such as LESS (the LargE-Scale remote sensing data and image Simulation model) [32] and DART (Discrete Anisotropic Radiative Transfer) [33], can depict very detailed canopy structures, the efficient parameterization of the canopy to describe different disturbance scenarios remains a challenging and laborious process.
This study proposes a multilayer heterogeneous 3D radiative transfer framework (MART3D) to characterize forest structural and spectral alterations resulting from forest disturbances. Its primary aim is to address the problem that traditional forest disturbance monitoring methods are not widely applicable and have high requirements for measured data. MART3D first models elementary components of the landscape, and the forest disturbances are then implemented by adjusting the structural and spectral properties of the scene elements, and canopy reflectance is generated through radiative transfer simulations. MART3D is physically based, flexible and easy-to-parameterize, allowing for automatically generating trees with heterogeneous structures, which is suitable for applications in the field of remote sensing. This study confirms the accuracy of the modeling method and its impact on the simulated reflectance and also exemplifies the usage of MART3D in evaluating the efficiency of the VI in determining the severity of forest fires. The results of this study can be used to better understand how forest disturbances affect remote sensing signals and to develop improved methods for detecting and monitoring forest disturbances using remote sensing data. The structure of this article is as follows: Section 2 introduces the generation of the landscape components and the modeling of forest disturbances, as well as the radiative transfer computation. Section 3 verifies the accuracy of MART3D in the bidirectional reflectance factor (BRF) simulation and applies it to forest fire scenarios. Section 4 discusses the accuracy and innovations in the modeling method of individual trees and future applications and limitations of MART3D. Section 5 summarizes the conclusions.

2. Materials and Methods

2.1. An Overview of the Framework

The multilayer heterogeneous framework consists of a soil layer and several canopy layers (Figure 1). MART3D constructs disturbed forest scenes by combining elementary landscape components, such as trees and shrubs, with parameters that quantify forest disturbance. Typically, an undisturbed forest plot is initially produced by incorporating parameters related to the forest canopy structure and leaf biochemical properties, including the leaf area index (LAI), forest canopy cover (FCC), leaf chlorophyll content (LCC) and leaf water content. Using these parameters, MART3D automatically generates a 3D virtual landscape. Depending on the type and severity of forest disturbance, this undisturbed forest plot is then modified by adjusting its structural and spectral parameters, upon which the reflectance of the disturbed scene is simulated. Since the canopy shapes are relatively regular and the layers of the forest are moderately complex, this framework is more applicable for temperate forests, the vertical structure of which generally consists of distinct layers dominated by arboreous layers. The specific process is as follows: (1) First, an undisturbed canopy scene is constructed, including individual trees with crowns, leaves and branches, as well as grass, shrubs and soil layers. (2) Subsequently, according to the characteristics of the forest disturbance types, we embark on forest disturbance parametrization. For instance, the simulation of forest fires entails the canopy’s structural and spectral alterations, while simulating forest insects and diseases primarily involves spectral alterations (due to changes in LCC, etc.). (3) On the basis of the constructed 3D heterogeneous disturbed scene, we simulate the radiative transfer to derive the reflectance. Further elaboration on each part will be provided in the subsequent Section 2.2, Section 2.3 and Section 2.4.

2.2. Structure of Landscape Components

Unlike 1D radiative transfer models that abstract tree crowns into homogeneous layers, MART3D takes into account the heterogeneous structures of individual trees, as well as the within-crown clustering. Specifically, each individual tree is depicted with explicitly described branches and turbid medium-based leaf clusters [34]. Three crucial factors are considered in this study to construct a parametric tree model for easing the use of MART3D and strike a balance between complexity and accuracy; they are, respectively, the shape of the crown, the arrangement of branches and the distribution of leaves.

2.2.1. Modeling of Tree Crown and Branch

The crown shape is commonly modeled as simple geometries, including ellipsoid (e.g., Quercus palustris Münchh.), cone (e.g., Larix principis-rupprechtii Mayr), cylinder (e.g., Taxus baccata L.) and cube (e.g., pruned Betula pendula Roth). However, to represent more diverse crowns, a minimalistic tree generator model, TAG (Tree Generation based on Asymmetric generalized Gaussian), proposed by [35] is employed to produce crown contours with a greater degree of flexibility than simple geometries. By tweaking its shape parameter α and two scaling parameters σ l and σ r , TAG can model a wide range of crown shapes. TAG is a generalized Gaussian distribution that exhibits skew and can be defined as follows:
f x ; α , σ l , σ r = α ( β l + β r ) Γ ( 1 / α ) e x p x β l α ,     x < 0 α ( β l + β r ) Γ ( 1 / α ) e x p x β r α ,     x 0
β l = σ l Γ ( 1 / α ) Γ ( 3 / α ) ,   β l = σ r Γ ( 1 / α ) Γ ( 3 / α )
where shape parameter α influences the overall contour of the crown, particularly its roundness, and a larger value brings the crown closer to a cylinder; σ l and σ r regulate the lower and upper portions of the crown, respectively. By flipping the x-y coordinate and rotating the curve about the y-axis, a 3D boundary of the crown can be obtained which is symmetrical on the horizontal plane.
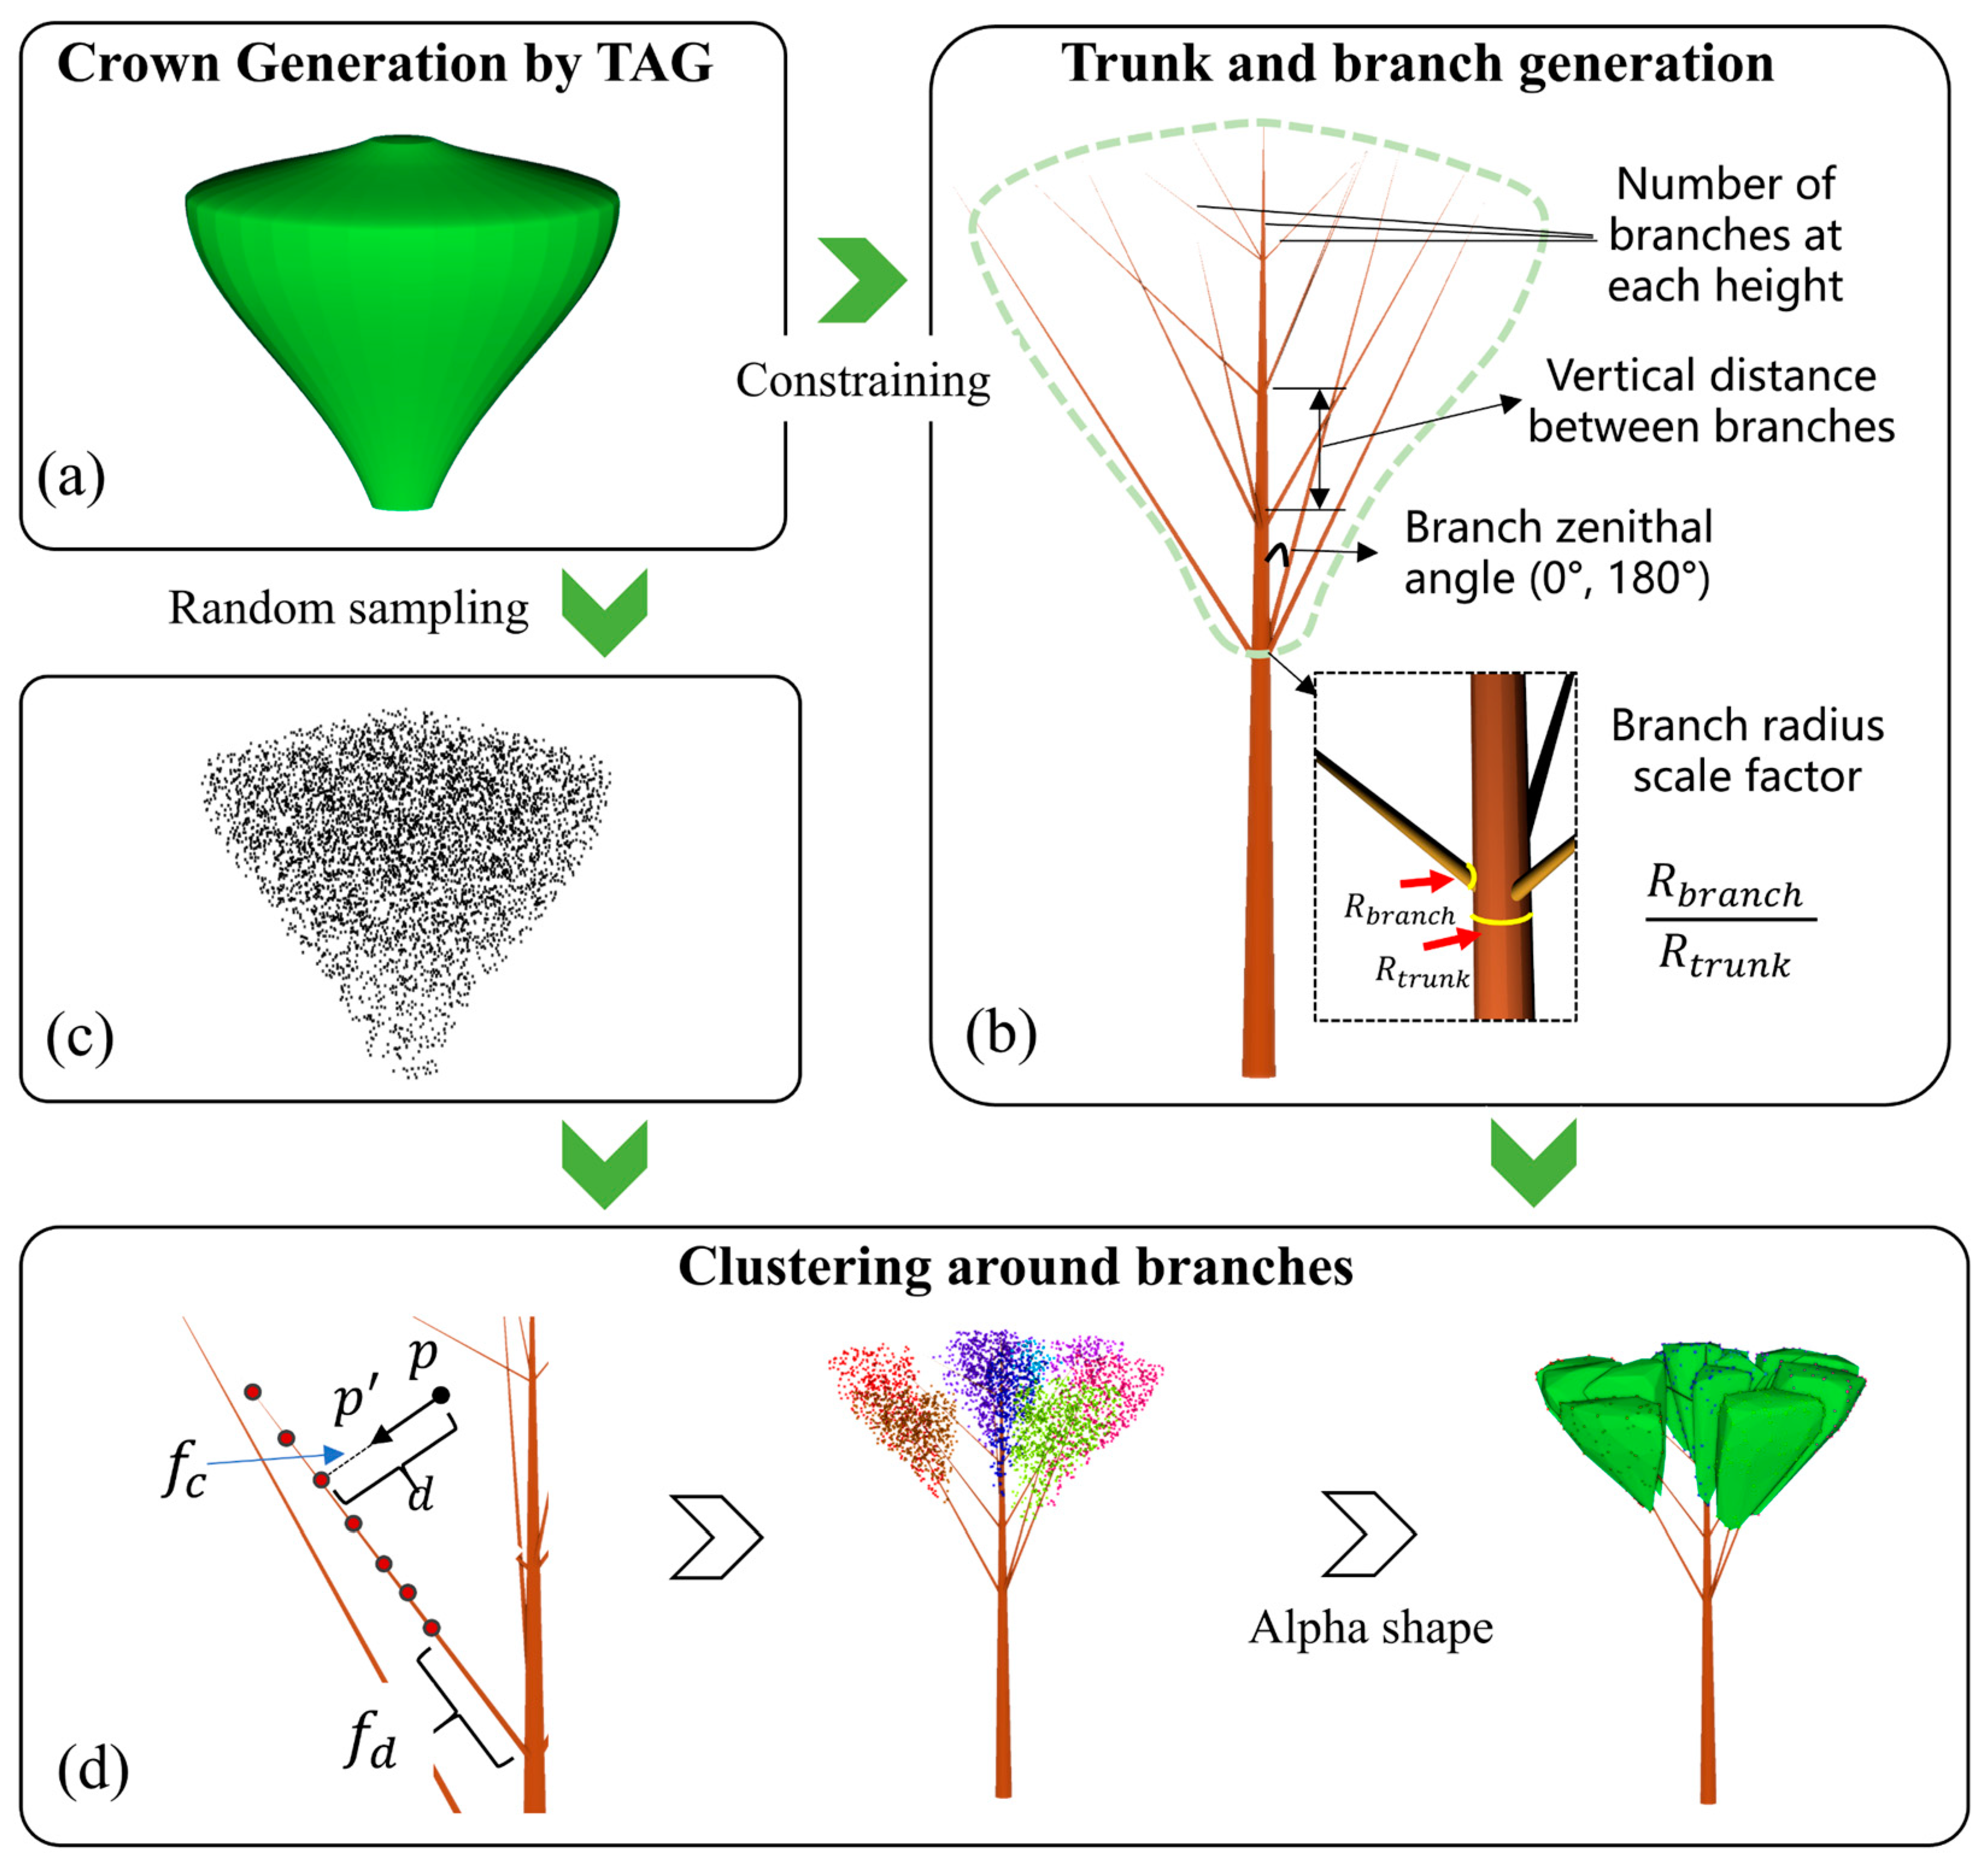
The trunk and branches comprise multiple cones (Figure 2), with the largest representing the tree trunk itself. Branches are affixed to the trunk at designated heights calculated by the trunk base height ( H t b ) and the vertical distance between branches ( H b b ), such as H t b , H t b + H b b and H t b + 2 H b b . At each branch height, the number of branches ( N b ) can be configured and are evenly distributed across the azimuthal angle of [0°, 360°). Additionally, a random angle is added to each branch to impart a more natural appearance to the tree. The branch zenithal angle can also be adjusted within the range of (0°, 180°). These two angles, i.e., azimuthal and zenithal angles, define the direction of a branch. Thus, its intersection with the crown determines the length of the branch. The base radius of the branch is regulated by the branch radius scale factor ( f b t ) in relation to the trunk radius at the same height, i.e.,
R b r a n c h = f b t · R t r u n k
where R b r a n c h is the base radius of the branch; R t r u n k is the trunk radius at the branch height, and it is determined by the diameter at breast height (DBH) and total tree height, becoming progressively smaller from bottom to top.

2.2.2. Modeling of Leaf Clumping

For modeling the leaves, a turbid medium-based approach is used in this study to reduce the requirement for computational resources and ease the setting of parameters. Specifically, leaves are enclosed by a complex boundary, and their properties are described with statistical parameters, including leaf volume density (LVD) and leaf angle distribution (LAD) [34]. Considering that leaves are typically attached to branches, we simulate the within-crown clumping by aggregating leaves around branches. As shown in Figure 2, a crown contour is first produced using TAG by specifying the crown diameter and crown height, followed by the generation of branches within the crown using branch parameters (Figure 2b). To model the clustering of leaves, a leaf clumping parameter ( f c ) and a leaf distance factor to branch root ( f d ) are defined. f c governs the degree of leaf clumping around the branches. Firstly, a large number of random points are first generated within the crown (Figure 2c), creating the leaf point cloud. Then, we uniformly sample points along the branches (Figure 2d), resulting in the branch point cloud. For each leaf point, we locate the nearest branch point and offset the leaf point using the leaf clumping parameter f c , i.e.,
p = p + d ( 1 f c ) ω
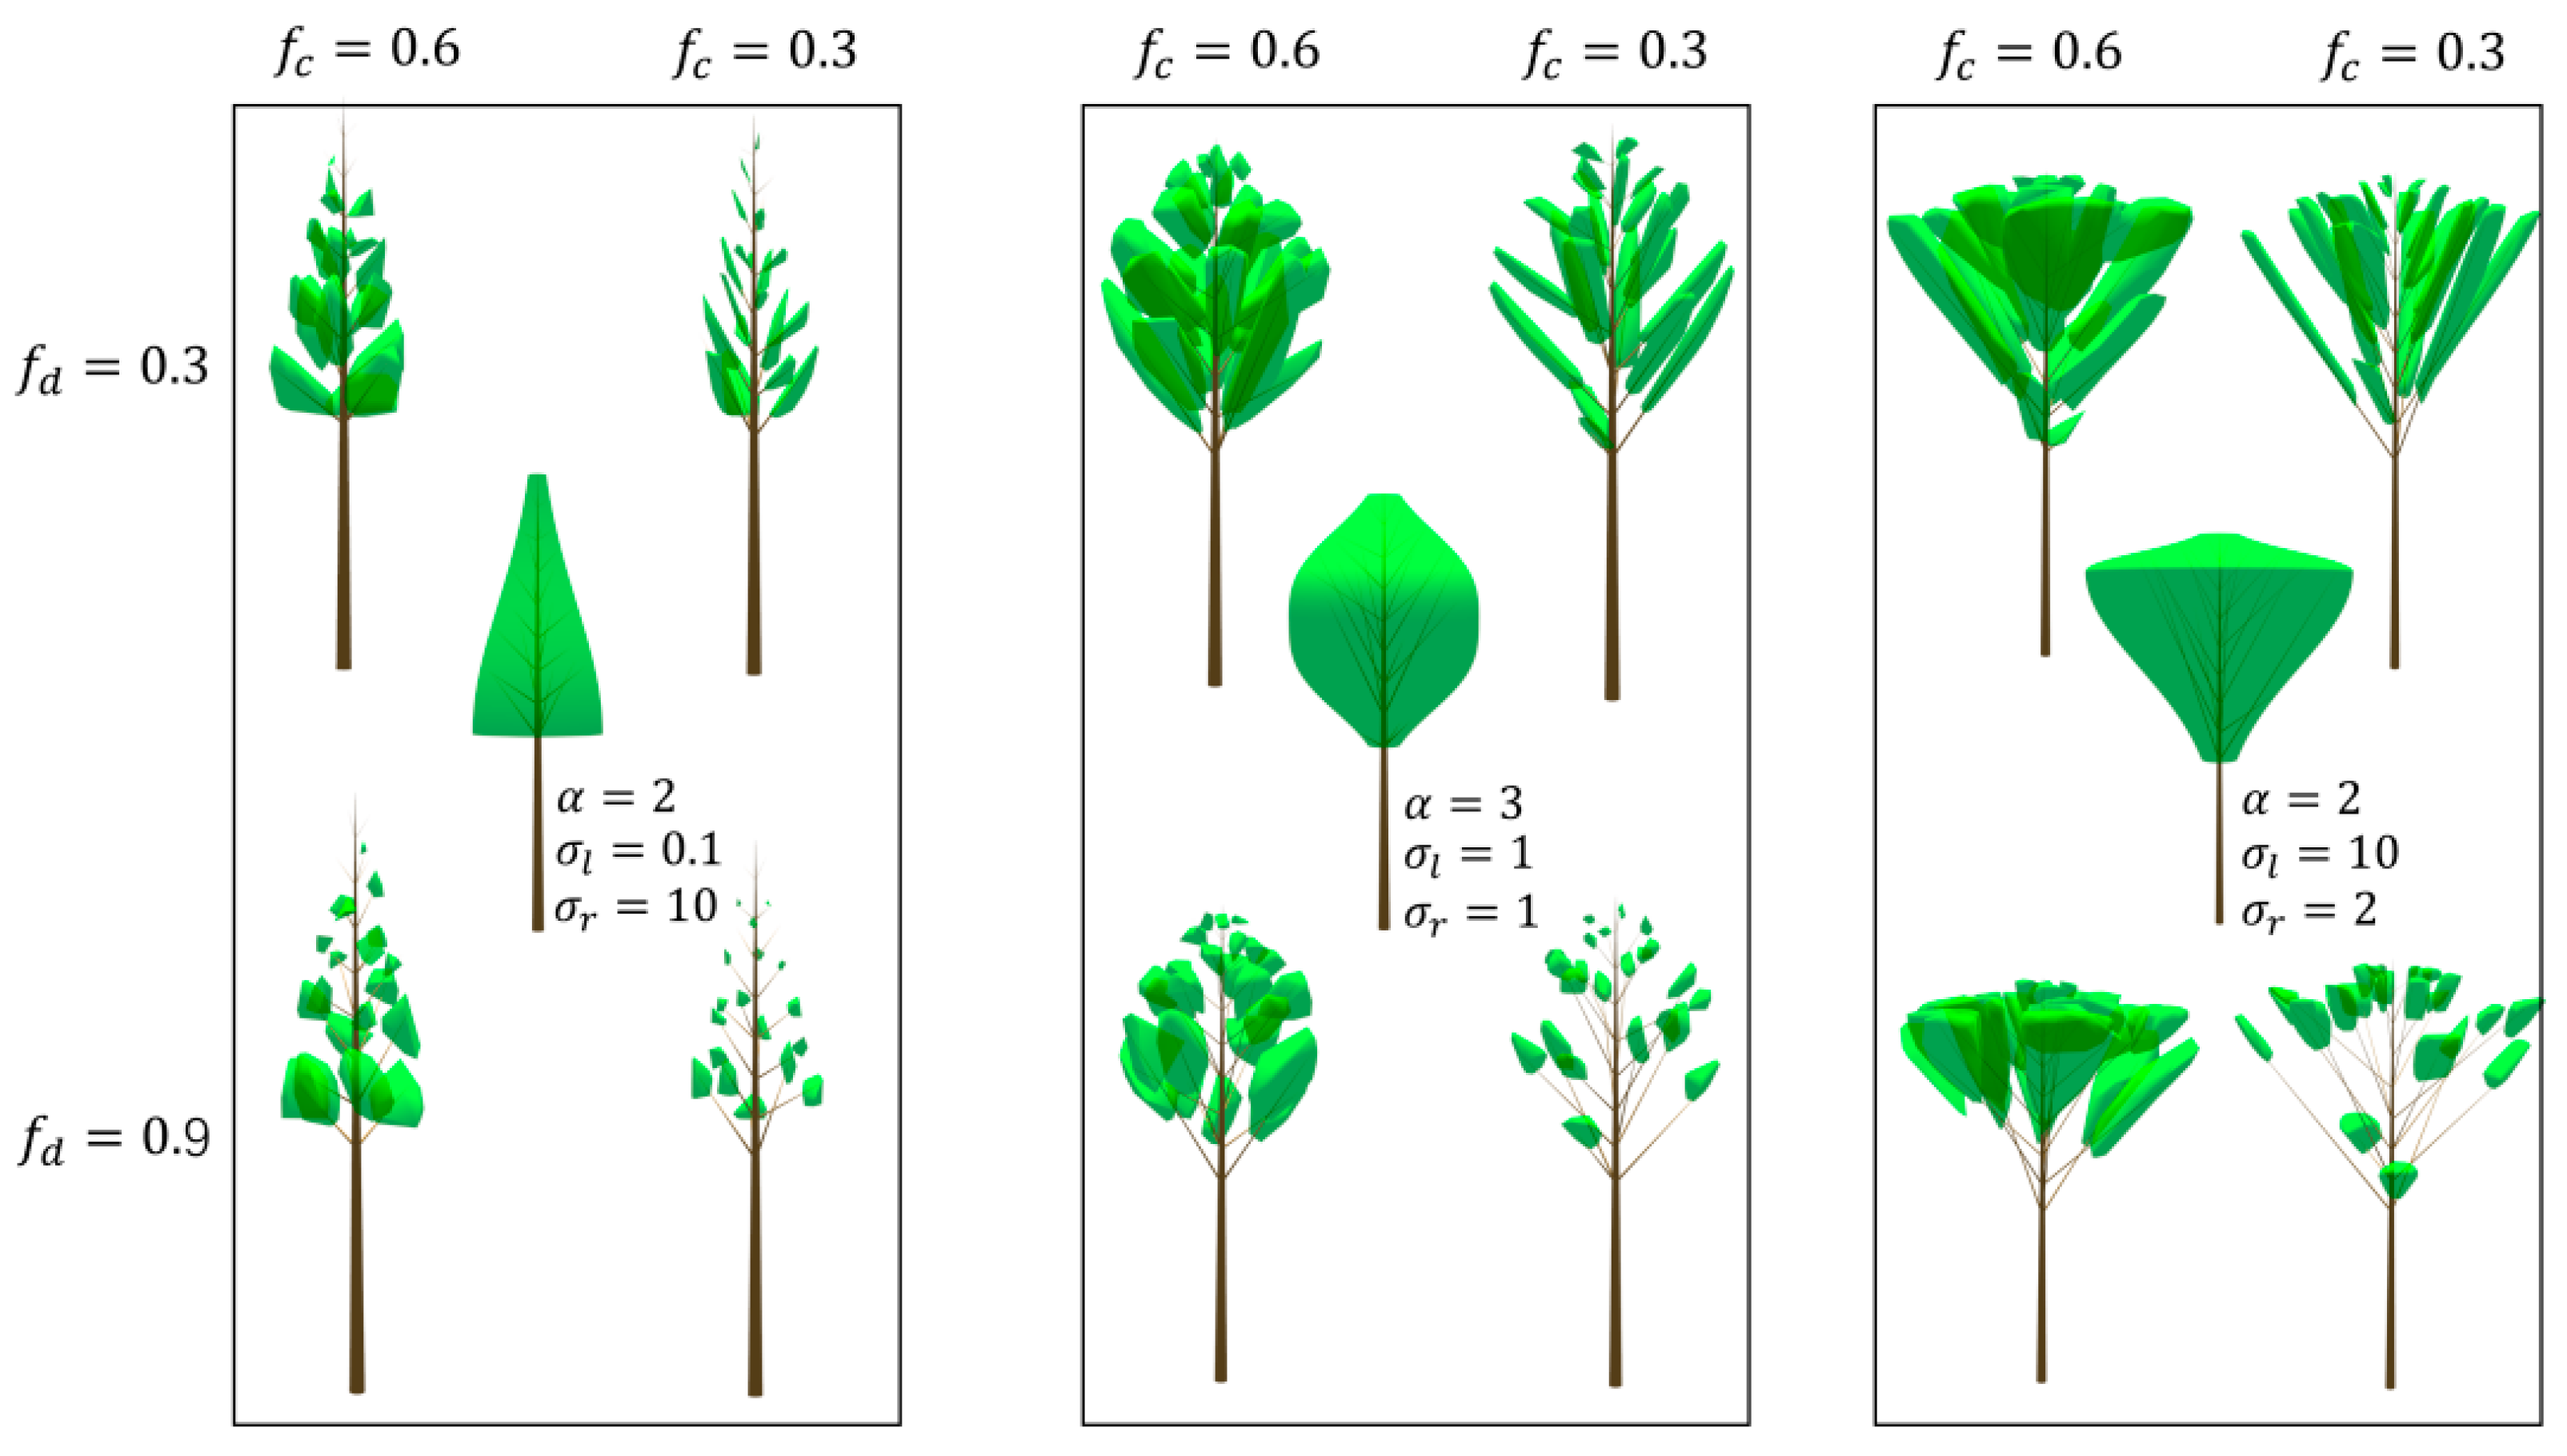
where p is the new position of the leaf point p ; ω and d represent the unit vector and distance from p to the nearest branch point, respectively. The value of f c ranges from 0 to 1, where f c = 0 indicates that all the leaf points are attached to the branch, and f c = 1 represents a completely random situation, where no leaf clumping occurs. As f c approaches the value of 0, more leaf points are clustered near the branch. The leaf distance factor to branch root, f d , indicates the distance of leaves from the root of the branch, i.e., determines the extent to which the leaves are concentrated at the top of the branches, mimicking natural plants where leaves are more densely distributed around the crown periphery. The range of f d is also from 0 to 1, controlling the starting points along branches when sampling the branch point cloud; when f d = 0 , the sampling begins from the branch root and leaves cover the entire branch, while f d = 1 means that only the branch tip is sampled. The closer its value is to 1, the more leaves are clustered at the branch tip. Several examples of generated individual trees with different crown shapes, and clumping factors, demonstrate that the TAG-based crown generation method can also produce cone- and ellipsoid-like shapes (Figure 3). Finally, the 3D contour envelope of the branch point cloud is created with the alpha shape algorithm (Figure 2d), which is widely used in 3D radiative transfer models for lightweight boundary descriptions of forest canopies [34].

2.2.3. Modeling of Grass and Shrubs

To model the grass and shrubs, although the same approach with individual trees described above can be directly applied, however, a simplified approach is employed in this study, considering the large numbers of such plants. Specifically, the shrubs are modeled as spheres with a turbid medium inside, while grasses are modeled with a homogeneous layer. The structural properties of these two vegetation layers are described with LVD and LAD as well.

2.3. Forest Disturbance Modeling

2.3.1. Forest Plot Generation

In order to model the forest’s structural and spectral alterations resulting from disturbances, a base forest plot, i.e., undisturbed forest plot, with a default extent of 30 m × 30 m is first generated using the landscape components detailed in Section 2.2. This procedure necessitates the acquisition of canopy-level parameters, including the LAI of grass, shrub, mediate tree and upper tree and the FCC of shrub, mediate tree and upper tree. Based on the value of the FCC, in conjunction with the crown diameter of the individual tree, the number of trees in the simulated forest plot can be determined. The LVD of each individual tree is then calculated based on the LAI and the crown volume derived from leaf boundaries. Stem density is then calculated, and the positions of each tree and shrub are randomly generated based on stem density; however, a minimum distance is set to avoid the trunk overlapping within the scene. The corresponding calculation methods are as follows:
N t r e e = x · y · F C C 1 / 4 · π · D c r o w n _ S N · D c r o w n _ E W
L V D = x · y · L A I N t r e e · C V
S D = 100 · 100 · N t r e e x · y
where N t r e e is the number of trees. For a 30 m × 30 m plot, its typical value ranges from 0 to 70, adjusted according to the FCC and crown diameter. x and y represent the size of the scene in the east–west direction and south–north direction, respectively; D c r o w n _ S N and D c r o w n _ E W are the diameters of the tree crown in the south–north direction and east–west direction, respectively. C V is crown volume; S D is the stem density, which is the number of trees per hectare; x and y are the size of the range corresponding to the tree generation position, slightly smaller than the size of the scene, calculated, respectively, as x = x D c r o w n _ E W and y = y D c r o w n _ S N , to ensure that the crowns do not exceed the scene boundaries.

2.3.2. Disturbed Forest Plot Parametrization

Instead of modeling specific disturbances separately, we try to find the common change characteristics of forest disturbances and propose a comprehensive modeling approach. Although there are various forest disturbance events, such as wildfires, insect invasions and pathogen outbreaks, no matter what type of forest disturbance it is, it will ultimately lead to structural and spectral changes in the forest. Therefore, in MART3D, we simulate the changes in these two properties undergone by the forest plot when disturbed by events, making the model more generalizable. To enable these alterations, we define the disturbed layers, ranging from health to severe damages, into 7 levels, which are inspired by the widely used composite burn index (CBI) [36]. These damage levels (DLs) are categorized on a scale of 0 to 3, with a step of 0.5. Specifically, we modify the LAI, component spectra of grass, shrub, mediate tree and upper tree according to the input damage levels. Finally, we compute a composite disturbance index by averaging the damage levels of each layer. For the LAI, the modified LAI is computed as L A I o ( 3 D L ) / 3 , where L A I o is the parameter of the health layer, and D L is the input damage level. For color change in leaves, branches and soils, a component spectrum from the most severe case ( S s e v e r e ) is first provided, then the modified spectra of each layer are computed as S n o r m a l 3 3 D L + S s e v e r e 3 D L , where S n o r m a l is the component spectrum for the health case.

2.4. Radiative Transfer Computation

Due to the significant heterogeneity of the generated forest plot, the analytic solution for the radiative transfer is practically infeasible. Consequently, a Monte Carlo ray-tracing technique is employed to simulate canopy reflectance. Specifically, LESS is utilized to implement these radiative transfer simulations. LESS is a ray-tracing-based 3D radiative transfer model that can simulate diverse remote sensing data, including multispectral images, thermal images and LiDAR data [32]. The latest version of LESS provides a boundary-based approach to describe leaf cluster (B-cluster), which strikes a suitable balance between model complexity and computation efficiency [34]. The B-cluster encapsulates a cluster of leaves with a complex boundary and describes the within properties by LVD and LAD, rendering it ideal for crowns generated with the approach described in Section 2.2. Therefore, LESS serves as the computation backend for the proposed MART3D.

3. Results

3.1. Model Accuracy Evaluation

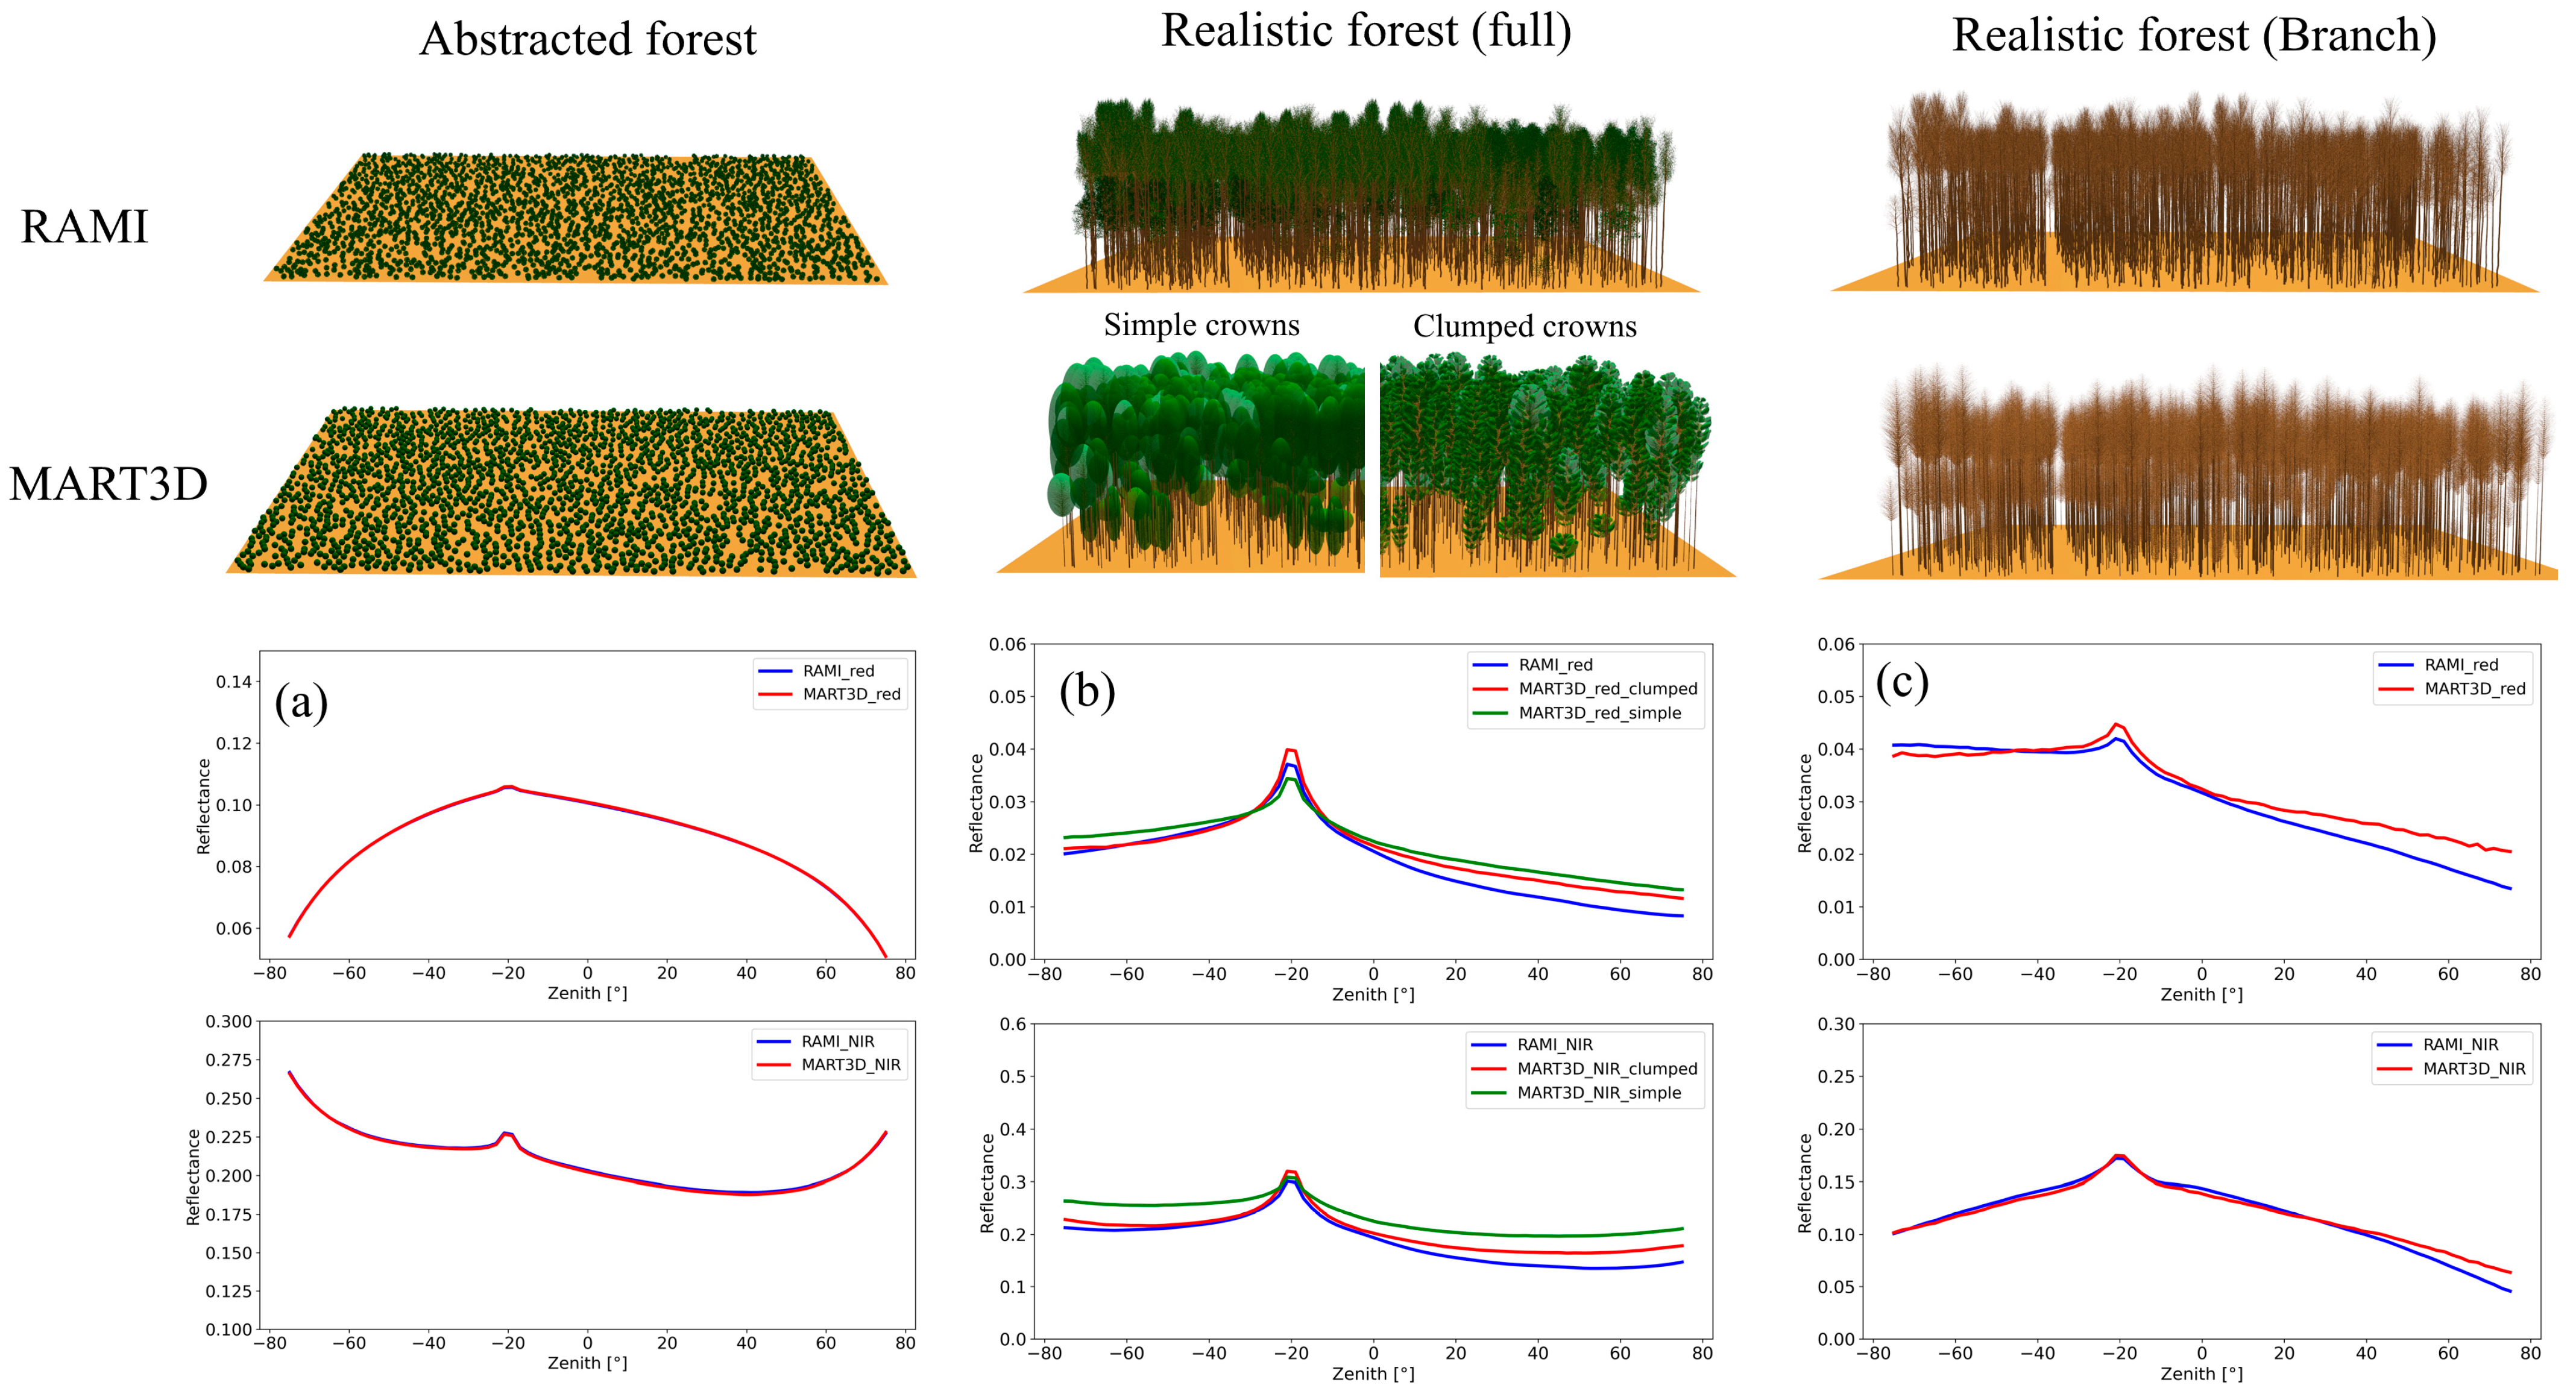
Radiation Transfer Model Intercomparison (RAMI) [37] is an internationally recognized standard model intercomparison project for verifying radiative transfer models, which accomplishes model cross-validation through the establishment of a range of standard scenes. These scenarios are of various types, ranging from simple scenes to realistic and complex scenes. To verify the accuracy of the tree modeling method and its impact on simulated reflectance, we selected two representative forest scenes from simple and complex scenarios, respectively, in RAMI: an abstracted forest (HET10) composed of 2547 spheres and a realistic forest canopy (HET09) consisting of 1029 trees from 7 species of 18 different individual tree models with detailed within-crown structures. These two scenes have been used in many studies for the validation of model accuracy [38,39,40]. HET10′s sphere crowns are filled with disc leaves, and each sphere has an LAI of 5.0. These spheres are randomly distributed within a 101 ×101 m scene, resulting in a total LAI of 0.98 and a canopy cover fraction of 0.1961. HET09 has a size of 105.5 m × 106.2 m, with a total LAI of 3.442, a canopy cover fraction of 0.5 and a wood area index of 3.2. In this case, we also used the tree positions and crown diameters provided by RAMI as input for MART3D. The spectral properties of all the trees and soil background can be obtained from the RAMI website. With these statistical parameters, we simulated BRFs in a principal plane from −75° to 75° with MART3D with a solar zenith angle of 20°. The MART3D simulated BRFs were then compared with the BRFs simulated with LESS over the original RAMI scenes. Specifically, in the scene of a realistic forest canopy, we compared the clumped crowns proposed in this paper with the traditional simple crowns (no within-clumping is considered), and we also compared branches generated from statistical wood parameters with branches with exact detailed structures.
We depicted the simulated BRFs using MART3D and LESS over the two selected abstracted and realistic forest canopies (Figure 4). It is evident that the BRF simulated with MART3D closely matches the BRF simulated with LESS, even though the MART3D scene is generated solely from statistical parameters. The consistency can be attributed to the fact the abstracted scene comprises only sphere-like canopies, with leaves uniformly distributed within each crown, thereby satisfying the assumption made in MART3D. However, for more realistic canopies, although the BRF between MART3D and LESS still matches, some inconsistencies exist. The RMSE (Root Mean Square Error) of red and NIR for the clumped MART3D scene is 0.0022 and 0.018, respectively, while for the simple crown scene, they are 0.0034 and 0.047, respectively. These results suggest that the consideration of the clumped leaves within crowns is essential. Furthermore, we also compared the BRF simulated using only branches. Although MART3D employs statistical wood parameters, instead of exact detailed structures, to generate the branch structures, the overall BRF shows good agreement, with RMSEs equal to 0.006 and 0.006 for red and NIR, respectively.

3.2. Model Applications

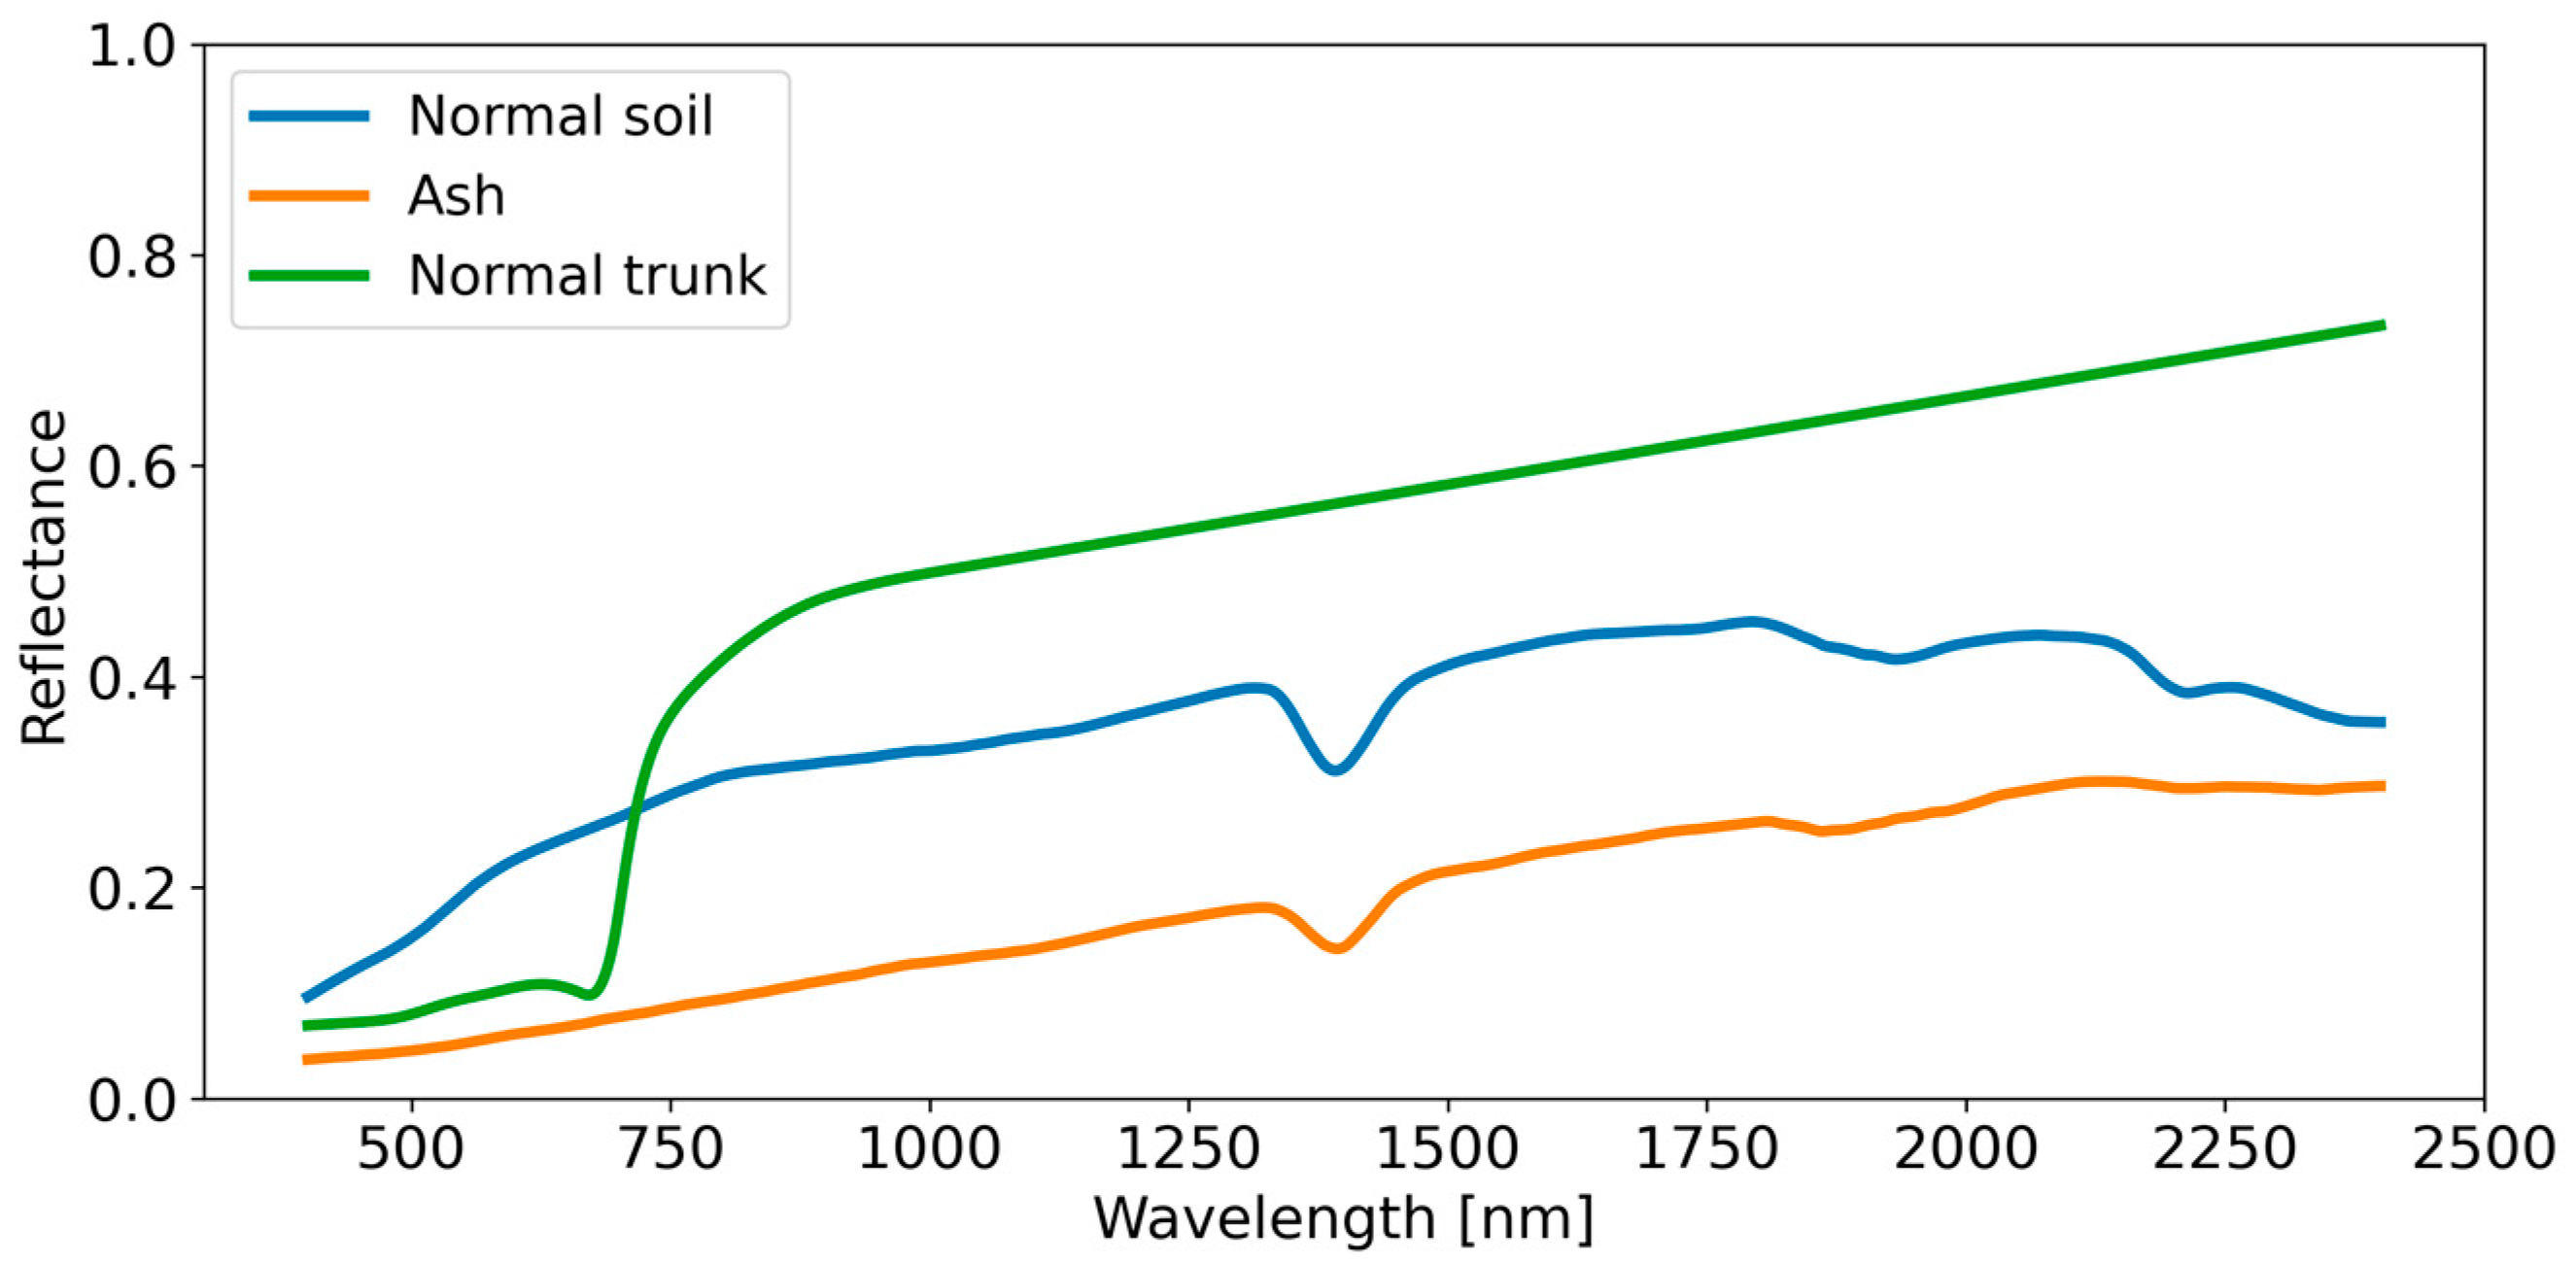
To demonstrate the usage of the proposed MART3D, we conducted a series of simulations over a burnt forest scene to characterize the burn severity through the remote sensing observed reflectance. The forest scene comprises five layers, including soil, grass, shrub, mediate tree and upper tree. The parameters used to construct the undisturbed forest scene (i.e., unburnt scene) are illustrated in Table 1. The spectra of normal soil, ash and trunk used in this study (Figure 5) were extracted from the Fire Research And Management Exchange System (Frames, https://www.frames.gov/, accessed on 1 November 2023). The disturbed scene is generated based on the undisturbed scene by defining the DL of each canopy layer and modifying the LAI and component spectrum, respectively, according to Section 2.3. The spectra of health and severe leaf are generated according to the green leaf and brown leaf parameters listed in Table 1 by using the PROSPECT model. The spectra of the burnt soil/branch are the composite of the normal soil/normal branch and ash spectra. To perform the simulation, the DLs of all the five layers are defined from 0 to 3 with a step of 0.5. However, some unrealistic combinations are filtered out according to the study of [7]; for instance, under the influence of wildfires, the DLs of the upper layer are generally not higher than the DLs of the lower layer. The simulations were carried out from 400 to 2500 nm with a 10 nm interval. Based on the simulated canopy reflectance, several vegetation indices and the corresponding CBI were computed and evaluated.
The normalized burn ratio (NBR), defined as (NIR − SWIR)/(NIR + SWIR), is commonly employed to assess the CBI; identifying the optimal band selection poses a challenge, owing to the unavailability of field-measured CBI. Thus, in this study, we employ the simulated dataset to ascertain the optimal band combinations from the two NIR bands (NIR1~NIR2) and eight SWIR bands (SWIR1~SWIR8) of WorldView-3 for calculating the NBR. The central wavelengths of NIR are 832 nm and 948 nm, whereas those of SWIR are 1210 nm, 1572 nm, 1661 nm, 1730 nm, 2164 nm, 2203 nm, 2260 nm and 2329 nm.
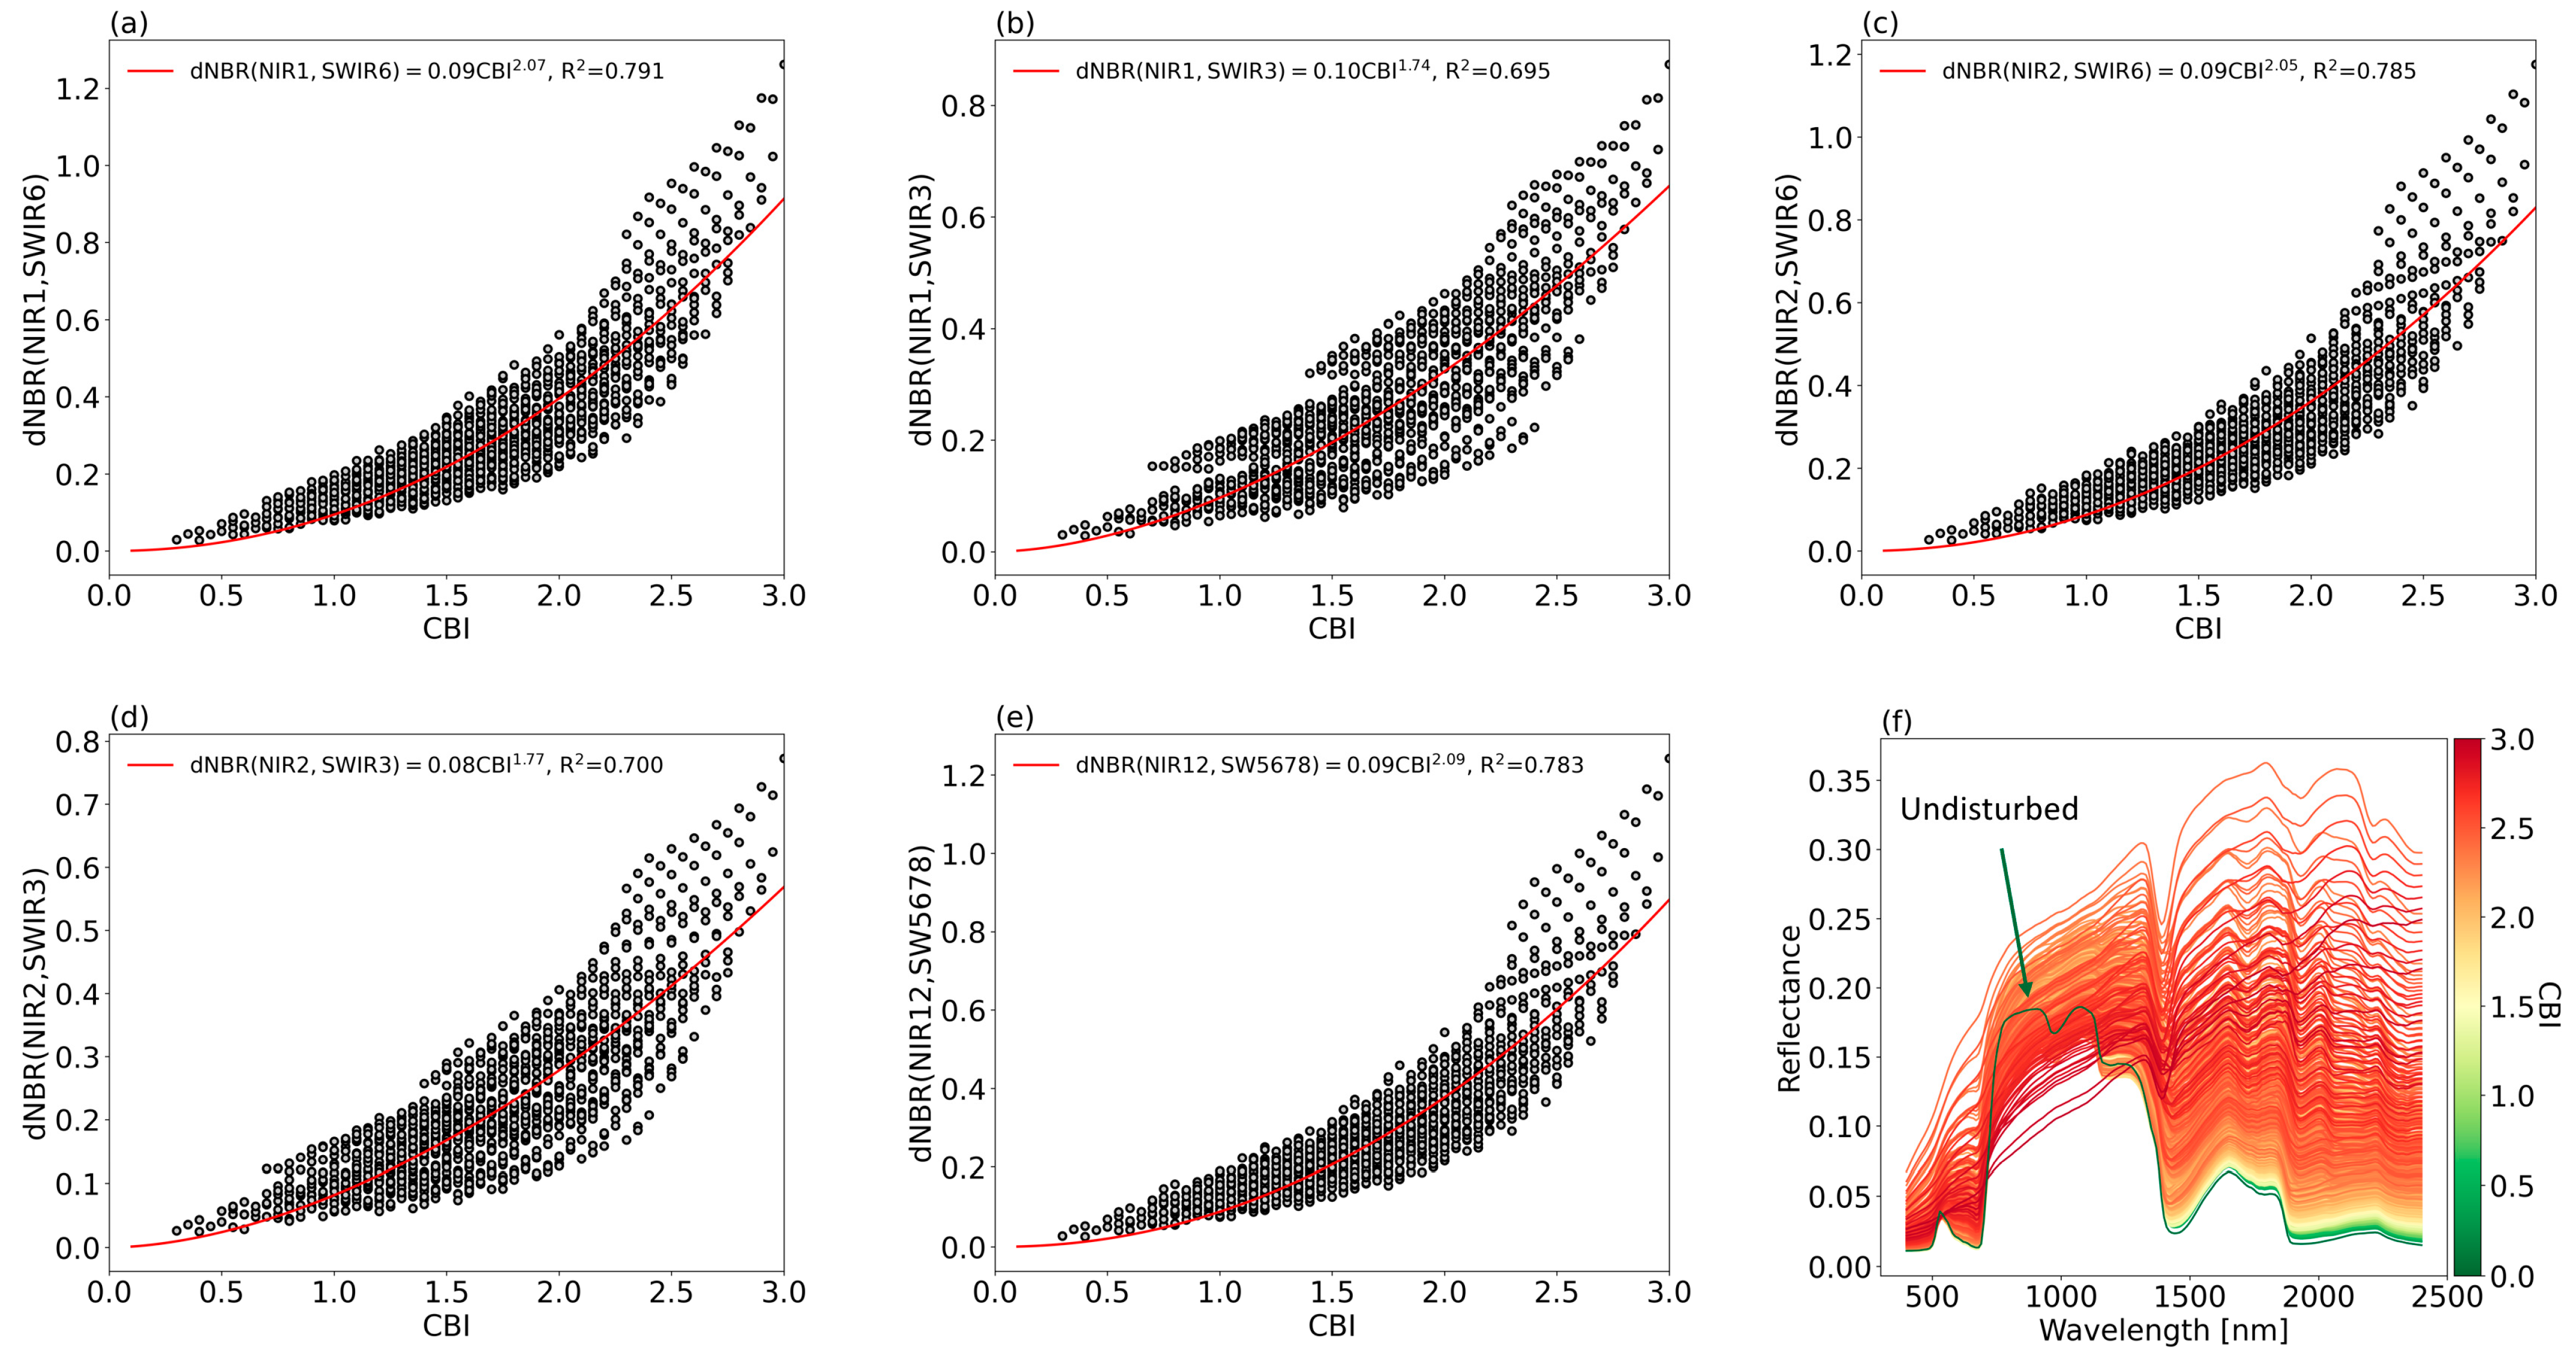
The regression correlation between the CBI and dNBR (the difference between the pre-fire NBR and post-fire NBR) indicates a positive relationship, utilizing different NIR and SWIR band combinations (Figure 6). Notably, the pairing of NIR1 and SWIR6 demonstrates the highest R-squared value of 0.791. Similarly, NIR2/SWIR6 and NIR12/SWIR5678 (where NIR12 donates the mean value of NIR1 and NIR2) exhibit closely comparable outcomes, whereas NIR1/SWIR3 and NIR2/SWIR3 yield lower accuracies. These findings were also validated by [41], which conducted a study assessing the CBI through field measurements and WorldView-3 images. This assessment indicates that optimizing band combinations using simulation datasets is a cost-effective method, which can also be employed to investigate the effects of sensor band response function, bandwidth and other factors, providing greater flexibility than field measurements.

4. Discussion

4.1. Accuracy of BRF Simulation

In this study, the BRF was simulated with MART3D for two forest scenes from RAMI and compared with the BRF simulated with LESS in the original RAMI scenes, where the simulation accuracy of the LESS has been well verified [32]. Based on the obtained results on representative red and NIR bands, it is evident that MART3D achieved good simulation accuracy for both abstracted scenes and realistic scenes. Comparing the RMSE and the consistency of the BRF between MART3D and LESS, the results highlight the significance of considering clustered leaves within the canopy, and branches generated using statistical wood parameters perform well in BRF simulations. Compared to PROSAIL [31], MART3D can describe the heterogeneous canopy structure with a fine-grained internal structure of the canopy, focusing on the distribution of branches and the aggregation of leaves. On the other hand, compared with models such as DART [33] and complete LESS [32], MART3D is relatively lightweight in the construction of forest scenes and more efficient in simulation. It can be effectively parameterized using simple statistical parameters and achieve accuracy close to complex models in the simulation of the BRF.

4.2. Innovations in Modeling Method of Individual Trees for Remote Sensing Applications

Although there are a large number of tree modeling and simulation methods in the field of computer graphics, most of these methods are oriented towards visualization, where the need is to be as visually realistic as possible [42]. However, in the field of remote sensing, the need to construct trees is mainly to well represent the parameters commonly used and to reflect the state of the ground surface. The generation of individual trees with heterogeneous structures in MART3D does not require much measured information, and only simple statistical parameters such as the canopy structure and leaf biochemical properties are needed to construct the scene. Meanwhile, we use TAG to generate canopy contours, which can be adjusted with parameters to flexibly and accurately represent a wider variety of crown shapes and simulate irregularly shaped trees in reality. In addition, the structure of branches and the within-crown clustering characteristics of leaves are also considered in MART3D, e.g., the leaf distance factor to branch root takes well into account the aggregation of leaves at the periphery of the canopy due to photosynthesis. Additionally, the turbid medium-based approach for modeling the leaves contributes to speeding up the computational speed and simplifying parameterization. Therefore, MART3D ensures that the modeling is relatively simple and efficient while the trees are closer to their characteristics in real habitats, which can meet the needs of remote sensing applications and facilitate research and practical use. The individual tree generation method in this model has already supported some applications, including waveform simulation and the retrieval of chlorophyll content. By comparing with real GEDI observations, this study verified the effectiveness of simulated waveforms for different forest scenes in identifying tree height components [35]. Additionally, it has been found that appropriate leaf spatial aggregation by our method can help improve the accuracy of chlorophyll content retrieval using the canopy spectral information, which was verified by a field-measured dataset [43]. These studies have demonstrated the effectiveness of this method and its proximity to natural trees.

4.3. Future Applications and Limitations of MART3D

There will be a wide range of applications for MART3D in the future. In practical research, the measurement of data in forest disturbance scenarios is difficult and hazardous, so there is a lack of field measurement data. The lightweight and easy parameterization of MART3D makes it possible to quickly construct several different severities of disturbance scenarios and automatically simulate corresponding remote sensing spectral data, which can effectively reduce reliance on field survey data. Therefore, compared with traditional methods such as empirical statistics, the approach proposed in this paper is more easily adaptable and applicable. Furthermore, compared to canopy spectral data simulation methods for a single type of forest disturbance using radiative transfer models [25,30], MART3D can be used as a general forest modeling framework considering the structural and spectral characteristics of the vegetation and can be applied to simulations of different types of forest disturbance scenarios. And MART3D is user-friendly and computationally efficient compared to models that require complex parameterization, and the simulated data are of high accuracy. In this paper, we exemplify its application for the optimal band selection of indices in disturbances such as wildfires, which can also be used in studies of other forest disturbances such as diseases and insect pests by structural and spectral alterations, etc. In addition, the application of MART3D can facilitate the study of the response mechanism of remote sensing signals under forest disturbances and the construction of novel vegetation indices, which can help to detect and monitor forest disturbances, and invert the parameters using remote sensing data. Utilizing MART3D for simulating extensive batches of remote sensing spectral data to train and improve the forest disturbance monitoring model and subsequently applying it to real remote sensing images is indeed a viable way to realize the monitoring of forest disturbances over a large area.
However, there are still some weaknesses in MART3D that need to be improved upon. (1) Since the canopy constructed by MART3D is relatively regular and ideal, it has good applicability to non-tropical forests, such as temperate broadleaf forests, mixed forests and needleleaf forests, but it is not suitable for the simulation of overly complex forests, such as tropical forests. (2) The damage level of forest disturbance is difficult to describe quantitatively, so its definition is inevitably somewhat subjective. (3) Modeling the heterogeneity of disturbances in the vertical direction of a single tree is still challenging, which will be further considered and improved on the basis of MART3D in the future.

5. Conclusions

This study proposed a novel approach, called a multilayer radiative transfer simulation framework (MART3D), for accurately modeling the canopy reflectance over heterogeneous canopies. MART3D automatically generates landscape elements, particularly individual trees, wherein the structures of branches and leaf clusters are explicitly modeled using a few measurable parameters. By comparing with the detailed forest scene from RAMI, we demonstrated that the parametrization scheme of MART3D achieves high accuracy in terms of the BRF. Additionally, we showcased the use of the proposed MART3D by simulating the reflectance of a forest fire scene and evaluated the performance of the NBR computed with different WorldView-3 bands. This study reveals that using a simulation dataset with the 3D radiative transfer model is a reliable and cost-effective method for characterizing the remote sensing response of forest disturbances. It is also an effective tool to generate a simulation database to support a remote sensing estimation of parameters over heterogeneous forests. The approach can provide decision support for the forestry department. In practical applications, it is planned to be extensively used in mapping large-scale forest disturbances, to obtain monitoring and early warning information for affected forest areas, providing strong support for safeguarding forest resources and ecosystems. The code for MART3D can be accessed through the following link: https://github.com/jianboqi/MART3D.

Author Contributions

Conceptualization, J.Q.; methodology, J.Q., L.O. and B.C.; software, J.Q. and L.O.; validation, J.Q., K.J. and W.Z.; formal analysis, J.Q. and L.O.; investigation, J.Q.; resources, Q.W.; data curation, J.Q.; writing—original draft preparation, J.Q.; writing—review and editing, J.Q. and L.O.; visualization, J.Q.; supervision, K.J. and Q.W.; project administration, K.J.; funding acquisition, Q.W. All authors have read and agreed to the published version of the manuscript.

Funding

This research was supported by the National Natural Science Foundation of China (Grant No. 42192580, No. 42192581 and No. 42371345).

Data Availability Statement

Data is contained within the article.

Acknowledgments

We would like to thank Simei Lin, for helping to define the burn severity of forest fires.

Conflicts of Interest

The authors declare no conflicts of interest.

References

  1. Atkins, J.; Bond-Lamberty, B.; Fahey, R.; Haber, L.; Stuart-Haëntjens, E.; Hardiman, B.; LaRue, E.; McNeil, B.; Orwig, D.; Stovall, A.; et al. Application of Multidimensional Structural Characterization to Detect and Describe Moderate Forest Disturbance. Ecosphere 2020, 11, e03156. [Google Scholar] [CrossRef]
  2. Montorio, R.; Pérez-Cabello, F.; Borini Alves, D.; García-Martín, A. Unitemporal Approach to Fire Severity Mapping Using Multispectral Synthetic Databases and Random Forests. Remote Sens. Environ. 2020, 249, 112025. [Google Scholar] [CrossRef]
  3. Senf, C.; Seidl, R.; Hostert, P. Remote Sensing of Forest Insect Disturbances: Current State and Future Directions. Int. J. Appl. Earth Obs. Geoinform. 2017, 60, 49–60. [Google Scholar] [CrossRef]
  4. Bempah, A.N.; Kyereh, B.; Ansong, M.; Asante, W. The Impacts of Invasive Trees on the Structure and Composition of Tropical Forests Show Some Consistent Patterns but Many Are Context Dependent. Biol. Invasions 2021, 23, 1307–1319. [Google Scholar] [CrossRef]
  5. Silaeva, T.; Andreychev, A.; Kiyaykina, O.; Balčiauskas, L. Taxonomic and Ecological Composition of Forest Stands Inhabited by Forest Dormouse Dryomys Nitedula (Rodentia: Gliridae) in the Middle Volga. Biologia 2021, 76, 1475–1482. [Google Scholar] [CrossRef]
  6. Seidl, R.; Schelhaas, M.-J.; Rammer, W.; Verkerk, P.J. Increasing Forest Disturbances in Europe and Their Impact on Carbon Storage. Nat. Clim. Chang. 2014, 4, 806–810. [Google Scholar] [CrossRef]
  7. De Santis, A.; Chuvieco, E.; Vaughan, P.J. Short-Term Assessment of Burn Severity Using the Inversion of PROSPECT and GeoSail Models. Remote Sens. Environ. 2009, 113, 126–136. [Google Scholar] [CrossRef]
  8. Viana-Soto, A.; Okujeni, A.; Pflugmacher, D.; García, M.; Aguado, I.; Hostert, P. Quantifying Post-Fire Shifts in Woody-Vegetation Cover Composition in Mediterranean Pine Forests Using Landsat Time Series and Regression-Based Unmixing. Remote Sens. Environ. 2022, 281, 113239. [Google Scholar] [CrossRef]
  9. Tian, Y.; Wu, Z.; Li, M.; Wang, B.; Zhang, X. Forest Fire Spread Monitoring and Vegetation Dynamics Detection Based on Multi-Source Remote Sensing Images. Remote Sens. 2022, 14, 4431. [Google Scholar] [CrossRef]
  10. Pleniou, M.; Koutsias, N. Sensitivity of Spectral Reflectance Values to Different Burn and Vegetation Ratios: A Multi-Scale Approach Applied in a Fire Affected Area. ISPRS J. Photogramm. Remote Sens. 2013, 79, 199–210. [Google Scholar] [CrossRef]
  11. Zhang, J.; Huang, Y.; Pu, R.; Gonzalez-Moreno, P.; Yuan, L.; Wu, K.; Huang, W. Monitoring Plant Diseases and Pests through Remote Sensing Technology: A Review. Comput. Electron. Agric. 2019, 165, 104943. [Google Scholar] [CrossRef]
  12. Lin, Q.; Huang, H.; Yu, L.; Wang, J. Detection of Shoot Beetle Stress on Yunnan Pine Forest Using a Coupled LIBERTY2-INFORM Simulation. Remote Sens. 2018, 10, 1133. [Google Scholar] [CrossRef]
  13. Gomez, D.; Ritger, H.; Pearce, C.; Eickwort, J.; Hulcr, J. Ability of Remote Sensing Systems to Detect Bark Beetle Spots in the Southeastern US. Forests 2020, 11, 1167. [Google Scholar] [CrossRef]
  14. Choi, W.; Kim, E.; Yun, S.; Lim, J.; Kim, Y. Quantification of One-Year Gypsy Moth Defoliation Extent in Wonju, Korea, Using Landsat Satellite Images. Forests 2021, 12, 545. [Google Scholar] [CrossRef]
  15. Junttila, S.; Näsi, R.; Koivumaki, N.; Imangholiloo, M.; Saarinen, N.; Raisio, J.; Holopainen, M.; Hyyppä, H.; Hyyppä, J.; Lyytikäinen-Saarenmaa, P.; et al. Multispectral Imagery Provides Benefits for Mapping Spruce Tree Decline Due to Bark Beetle Infestation When Acquired Late in the Season. Remote Sens. 2022, 14, 909. [Google Scholar] [CrossRef]
  16. Li, X.; Liu, Y.; Huang, P.; Tong, T.; Li, L.; Chen, Y.; Hou, T.; Su, Y.; Lv, X.; Fu, W.; et al. Integrating Multi-Scale Remote-Sensing Data to Monitor Severe Forest Infestation in Response to Pine Wilt Disease. Remote Sens. 2022, 14, 5164. [Google Scholar] [CrossRef]
  17. Iordache, M.; Mantas, V.; Baltazar, E.; Pauly, K.; Lewyckyj, N. A Machine Learning Approach to Detecting Pine Wilt Disease Using Airborne Spectral Imagery. Remote Sens. 2020, 12, 2280. [Google Scholar] [CrossRef]
  18. Migas-Mazur, R.; Kycko, M.; Zwijacz-Kozica, T.; Zagajewski, B. Assessment of Sentinel-2 Images, Support Vector Machines and Change Detection Algorithms for Bark Beetle Outbreaks Mapping in the Tatra Mountains. Remote Sens. 2021, 13, 3314. [Google Scholar] [CrossRef]
  19. Xi, G.; Huang, X.; Xie, Y.; Gang, B.; Bao, Y.; Dashzebeg, G.; Nanzad, T.; Dorjsuren, A.; Enkhnasan, D.; Ariunaa, M. Detection of Larch Forest Stress from Jas’s Larch Inchworm (Erannis Jacobsoni Djak) Attack Using Hyperspectral Remote Sensing. Remote Sens. 2022, 14, 124. [Google Scholar] [CrossRef]
  20. Ye, W.; Lao, J.; Liu, Y.; Chang, C.; Zhang, Z.; Li, H.; Zhou, H. Pine Pest Detection Using Remote Sensing Satellite Images Combined with a Multi-Scale Attention-UNet Model. Ecol. Inform. 2022, 72, 101906. [Google Scholar] [CrossRef]
  21. Zhu, X.; Skidmore, A.K.; Darvishzadeh, R.; Wang, T. Estimation of Forest Leaf Water Content through Inversion of a Radiative Transfer Model from LiDAR and Hyperspectral Data. Int. J. Appl. Earth Obs. Geoinf. 2019, 74, 120–129. [Google Scholar] [CrossRef]
  22. Li, X.; Shabanov, N.; Chen, L.; Zhang, Y.; Huang, H. Modeling Solar-Induced Fluorescence of Forest with Heterogeneous Distribution of Damaged Foliage by Extending the Stochastic Radiative Transfer Theory. Remote Sens. Environ. 2022, 271, 112892. [Google Scholar] [CrossRef]
  23. De Santis, A.; Chuvieco, E. GeoCBI: A Modified Version of the Composite Burn Index for the Initial Assessment of the Short-Term Burn Severity from Remotely Sensed Data. Remote Sens. Environ. 2009, 113, 554–562. [Google Scholar] [CrossRef]
  24. De Santis, A.; Chuvieco, E. Burn Severity Estimation from Remotely Sensed Data: Performance of Simulation versus Empirical Models. Remote Sens. Environ. 2007, 108, 422–435. [Google Scholar] [CrossRef]
  25. Fernández-Guisuraga, J.M.; Suárez-Seoane, S.; Calvo, L. Radiative Transfer Modeling to Measure Fire Impact and Forest Engineering Resilience at Short-Term. ISPRS J. Photogramm. Remote Sens. 2021, 176, 30–41. [Google Scholar] [CrossRef]
  26. Fernández-Guisuraga, J.M.; Suárez-Seoane, S.; Quintano, C.; Fernández-Manso, A.; Calvo, L. Comparison of Physical-Based Models to Measure Forest Resilience to Fire as a Function of Burn Severity. Remote Sens. 2022, 14, 5138. [Google Scholar] [CrossRef]
  27. Fernández-Guisuraga, J.M.; Verrelst, J.; Calvo, L.; Suárez-Seoane, S. Hybrid Inversion of Radiative Transfer Models Based on High Spatial Resolution Satellite Reflectance Data Improves Fractional Vegetation Cover Retrieval in Heterogeneous Ecological Systems after Fire. Remote Sens. Environ. 2021, 255, 112304. [Google Scholar] [CrossRef]
  28. Li, X.; Huang, H.; Shabanov, N.; Chen, L.; Yan, K.; Shi, J. Extending the Stochastic Radiative Transfer Theory to Simulate BRF over Forests with Heterogeneous Distribution of Damaged Foliage inside of Tree Crowns. Remote Sens. Environ. 2020, 250, 112040. [Google Scholar] [CrossRef]
  29. Lin, Q.; Huang, H.; Wang, J.; Chen, L.; Du, H.; Zhou, G. Early Detection of Pine Shoot Beetle Attack Using Vertical Profile of Plant Traits through UAV-Based Hyperspectral, Thermal, and Lidar Data Fusion. Int. J. Appl. Earth Obs. Geoinf. 2023, 125, 103549. [Google Scholar] [CrossRef]
  30. Lin, Q.; Huang, H.; Chen, L.; Wang, J.; Huang, K.; Liu, Y. Using the 3D Model RAPID to Invert the Shoot Dieback Ratio of Vertically Heterogeneous Yunnan Pine Forests to Detect Beetle Damage. Remote Sens. Environ. 2021, 260, 112475. [Google Scholar] [CrossRef]
  31. Jacquemoud, S.; Verhoef, W.; Baret, F.; Bacour, C.; Zarco-Tejada, P.J.; Asner, G.P.; François, C.; Ustin, S.L. PROSPECT+SAIL Models: A Review of Use for Vegetation Characterization. Remote Sens. Environ. 2009, 113, S56–S66. [Google Scholar] [CrossRef]
  32. Qi, J.; Xie, D.; Yin, T.; Yan, G.; Gastellu-Etchegorry, J.-P.; Li, L.; Zhang, W.; Mu, X.; Norford, L.K. LESS: LargE-Scale Remote Sensing Data and Image Simulation Framework over Heterogeneous 3D Scenes. Remote Sens. Environ. 2019, 221, 695–706. [Google Scholar] [CrossRef]
  33. Wang, Y.; Kallel, A.; Yang, X.; Regaieg, O.; Lauret, N.; Guilleux, J.; Chavanon, E.; Gastellu-Etchegorry, J.-P. DART-Lux: An Unbiased and Rapid Monte Carlo Radiative Transfer Method for Simulating Remote Sensing Images. Remote Sens. Environ. 2022, 274, 112973. [Google Scholar] [CrossRef]
  34. Qi, J.; Xie, D.; Jiang, J.; Huang, H. 3D Radiative Transfer Modeling of Structurally Complex Forest Canopies through a Lightweight Boundary-Based Description of Leaf Clusters. Remote Sens. Environ. 2022, 283, 113301. [Google Scholar] [CrossRef]
  35. Tan, S.; Zhang, Y.; Qi, J.; Su, Y.; Ma, Q.; Qiu, J. Exploring the Potential of GEDI in Characterizing Tree Height Composition Based on Advanced Radiative Transfer Model Simulations. J. Remote Sens. 2024, 4, 0132. [Google Scholar] [CrossRef]
  36. Key, C.H.; Benson, N.C. Landscape Assessment (LA). 2006. Available online: https://www.fs.usda.gov/research/treesearch/24066 (accessed on 1 November 2023).
  37. Widlowski, J.-L.; Taberner, M.; Pinty, B.; Bruniquel-Pinel, V.; Disney, M.; Fernandes, R.; Gastellu-Etchegorry, J.-P.; Gobron, N.; Kuusk, A.; Lavergne, T.; et al. Third Radiation Transfer Model Intercomparison (RAMI) Exercise: Documenting Progress in Canopy Reflectance Models. J. Geophys. Res. Atmos. 2007, 112, D09111. [Google Scholar] [CrossRef]
  38. Xie, J.; Xie, D.; Zhou, K.; Yan, G.; Mu, X. Analysis of the Directional Characteristics of the Clumping Index (CI) Based on RAMI-V Canopy Scenes. J. Remote Sens. 2024, 4, 0133. [Google Scholar] [CrossRef]
  39. Geng, J.; Zhang, Q.; Qiu, F.; Chen, J.M.; Zhang, Y.; Fan, W.; Tu, L.; Huang, J.; Wang, S.; Xu, L.; et al. Evaluation of GOFP over Four Forest Plots Using RAMI and UAV Measurements. Int. J. Digit. Earth 2021, 14, 1433–1451. [Google Scholar] [CrossRef]
  40. Li, W.; Guo, Q.; Tao, S.; Su, Y. VBRT: A Novel Voxel-Based Radiative Transfer Model for Heterogeneous Three-Dimensional Forest scenesVBRT. Remote Sens. Environ. 2018, 206, 318–335. [Google Scholar] [CrossRef]
  41. Warner, T.A.; Skowronski, N.S.; Gallagher, M.R. High Spatial Resolution Burn Severity Mapping of the New Jersey Pine Barrens with WorldView-3 near-Infrared and Shortwave Infrared Imagery. Int. J. Remote Sens. 2017, 38, 598–616. [Google Scholar] [CrossRef]
  42. Favorskaya, M.N.; Jain, L.C. Tree Modelling in Virtual Reality Environment. In Handbook on Advances in Remote Sensing and Geographic Information Systems: Paradigms and Applications in Forest Landscape Modeling; Favorskaya, M.N., Jain, L.C., Eds.; Springer International Publishing: Cham, Germany, 2017; pp. 141–179. ISBN 978-3-319-52308-8. [Google Scholar]
  43. Cheng, J.; Yang, H.; Qi, J.; Han, S.; Sun, Z.; Feng, H.; Chen, R.; Zhang, C.; Li, J.; Yang, G. Evaluation of the Effect of Leaf Spatial Aggregation on Chlorophyll Content Retrieval in Open-Canopy Apple Orchards. Int. J. Appl. Earth Obs. Geoinf. 2023, 121, 103367. [Google Scholar] [CrossRef]
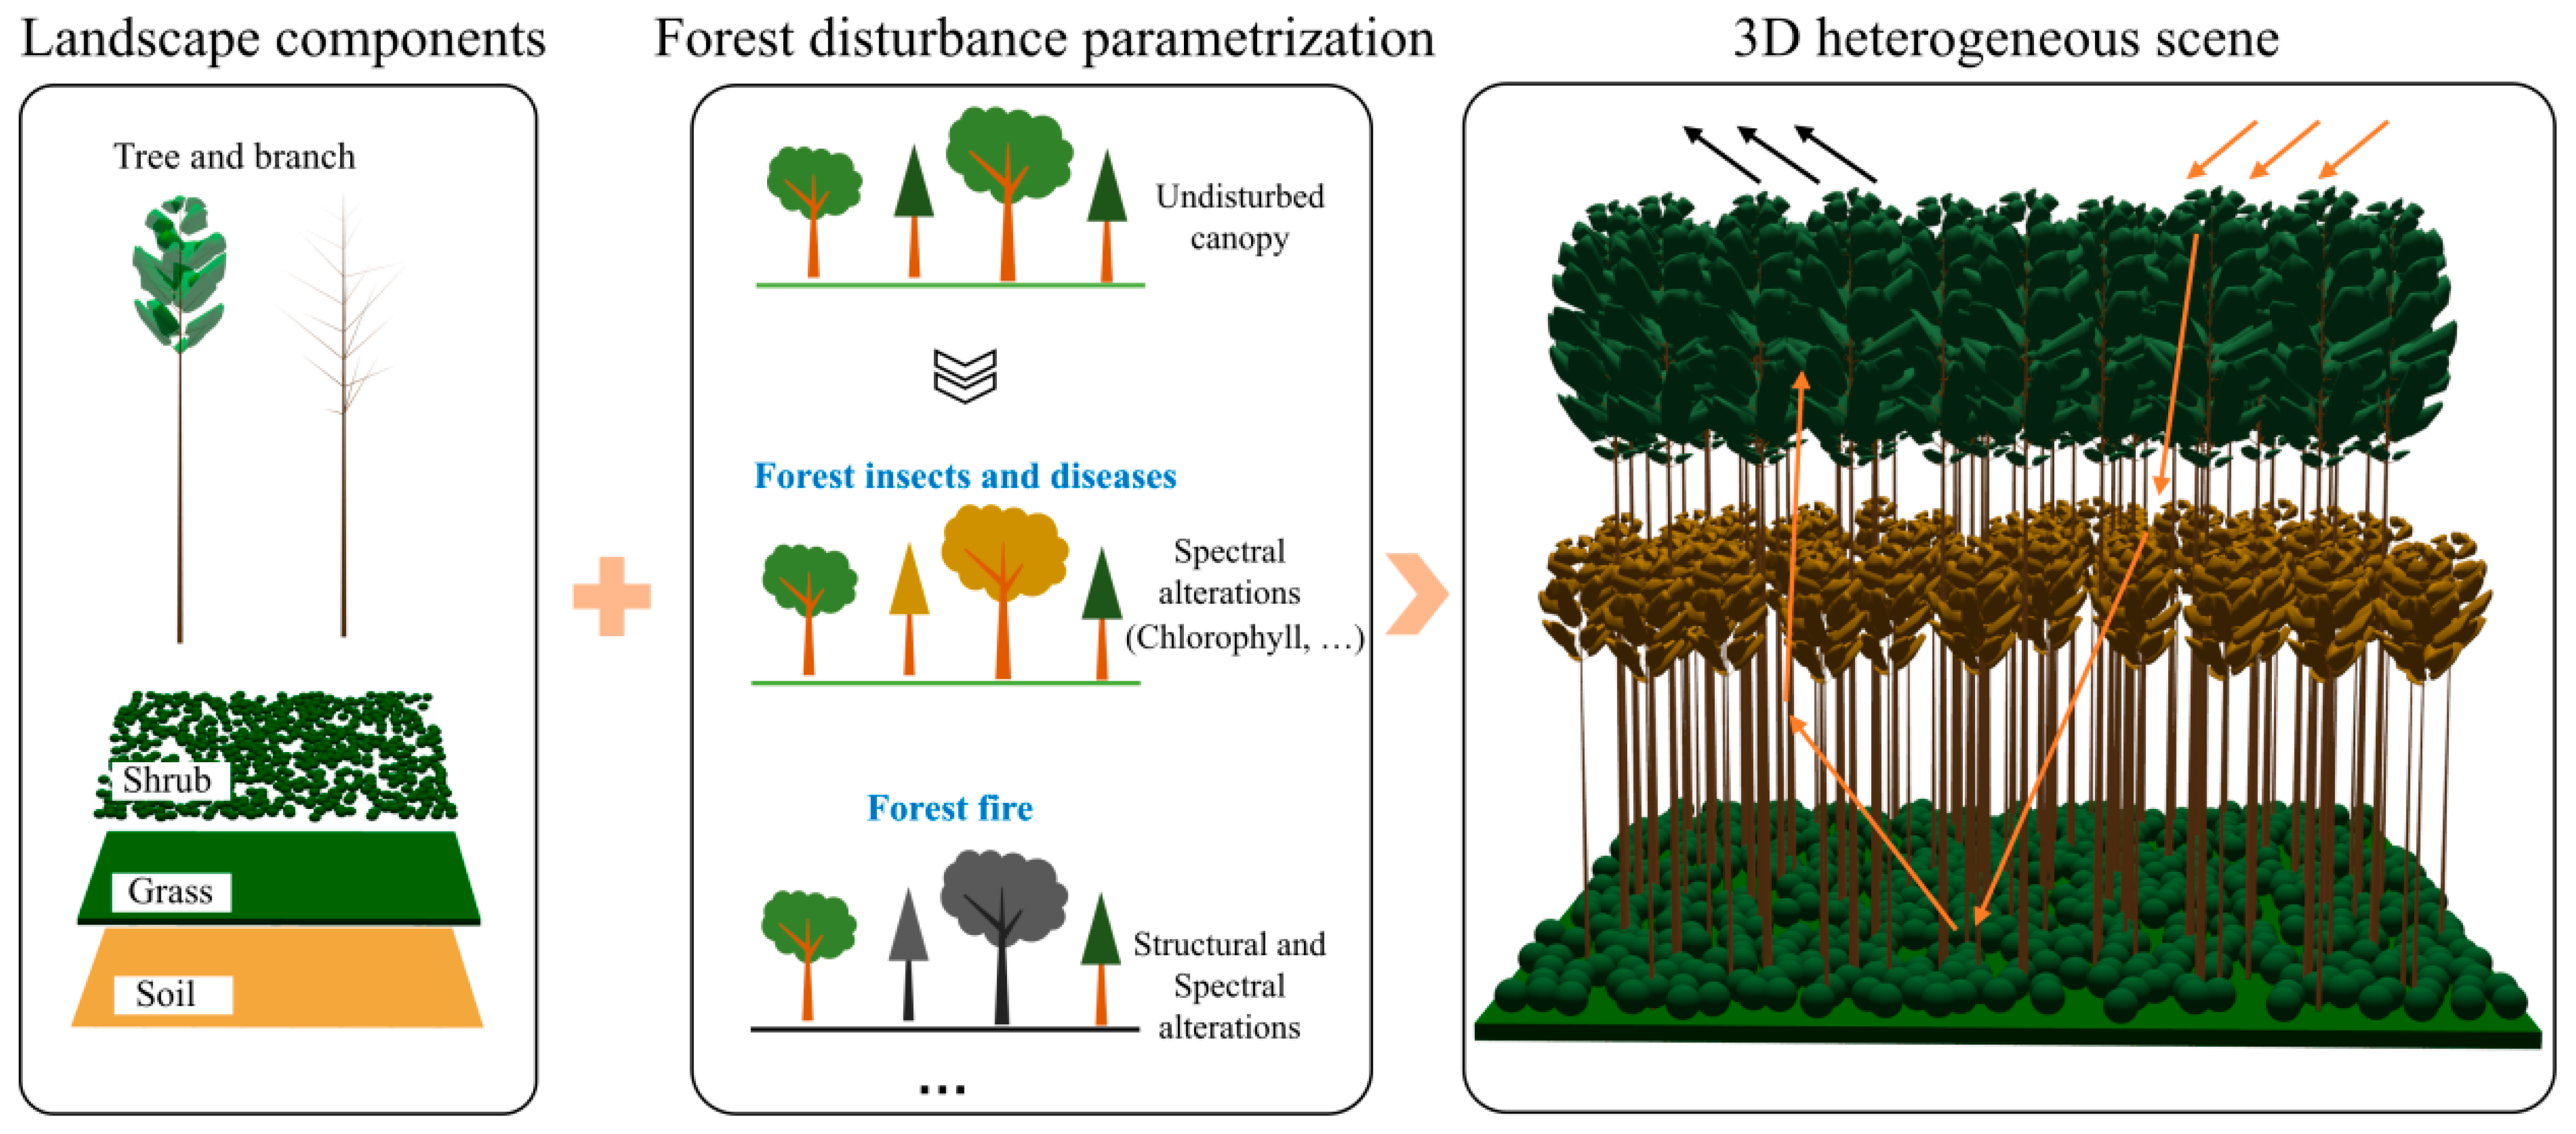
Figure 1. An overview of the multilayer heterogeneous framework (The orange arrows represent the propagation of incident radiation through the scene, and the black arrows represent the radiation leaving the scene.).
Forests 15 00824 g001
Figure 2. The modeling of individual trees in MART3D: (a) The generation of the crown by TAG; (b) Trunk and branch generation; (c) Leaf generation through random sampling within the crown; (d) Clustering of leaves around branches.
Forests 15 00824 g002
Figure 3. Crown generated with different shape and clumping parameters.
Forests 15 00824 g003
Figure 4. A comparison of the BRF simulated with MART3D and LESS: (a) the abstract forest (HET10); (b) the realistic forest (HET09) and (c) the branch of the realistic forest.
Forests 15 00824 g004
Figure 5. The soil and trunk spectra used for the simulation.
Forests 15 00824 g005
Figure 6. The scatter plot between CBI with different band combinations (ae) and the simulated spectra under different CBI (f).
Forests 15 00824 g006
Table 1. The parameters of the undisturbed scene.
LayerLAIFCCLeaf Parameters
(N, Car, BP, Cm, Cab, Anth, Cw) 1
Grass1.0---Green leaf: 2.5, 8.0, 0.2, 0.035, 70, 0.0, 0.048
Brown leaf: 2.5, 8.0, 1.5, 0.035, 20, 0.0, 0.0008
Shrub1.00.5
Mediate tree1.50.3
Upper tree2.50.7
1 N: Leaf structure parameter; Car: Carotenoid content (ug/cm2); BP: Brown pigment content; Cm: Dry matter content (g/cm2); Cab: Chlorophyll content (ug/cm2); Anth: Anthocyanin content (ug/cm2); Cw: Equivalent water thickness (cm).
Disclaimer/Publisher’s Note: The statements, opinions and data contained in all publications are solely those of the individual author(s) and contributor(s) and not of MDPI and/or the editor(s). MDPI and/or the editor(s) disclaim responsibility for any injury to people or property resulting from any ideas, methods, instructions or products referred to in the content.