Article

Exploring the Multi-Sensory Coupling Relationship of Open Space on a Winter Campus

College of Landscape Architecture and Art, Fujian Agriculture and Forestry University, Fuzhou 350108, China
*
Author to whom correspondence should be addressed.
Forests 2024, 15(5), 876; https://doi.org/10.3390/f15050876
Submission received: 14 April 2024 / Revised: 8 May 2024 / Accepted: 13 May 2024 / Published: 17 May 2024
(This article belongs to the Section Urban Forestry)

Abstract

:
Exploring the combined effects of multisensory interactions in open spaces can help improve the comfort of campus environments. Nine typical spaces on a university campus in Fuzhou were selected for this study. Subjects perceived the environment and then completed an on-site subjective questionnaire. At the same time, meteorological data (global radiation, air temperature, globe temperature, wind speed, relative humidity, and illumination intensity) were measured to determine the interactions between visual and acoustic and thermal perceptions. Differences in the meteorological parameters between the measuring points were described using a one-way ANOVA and Tukey’s post hoc test, and a chi-square test of independence was used to determine significant associations between thermal, acoustic, and visual comfort, which in turn led to the study of interactions between visual, acoustic, and thermal comfort using a two-way ANOVA. The following conclusions were drawn: (1) the Thermal Comfort Vote (TCV) increased with the increasing Acoustic Comfort Vote (ACV) at all levels of thermal stress. (2) The highest and lowest Acoustic Sensation Vote (ASV) values for each sound type were derived from either “slightly cold” or “warm” conditions. Both the Thermal Comfort Vote (TCV) and the Acoustic Comfort Vote (ACV) were positively correlated. (3) When “neutral”, the Thermal Sensation Vote (TSV) increased with increasing illumination intensity (LUX). (4) The Sunlight Sensation Vote (SSV) increased with the increasing Universal Thermal Climate Index (UTCI) when illumination intensity (LUX) was moderate and bright. (5) The highest and lowest Acoustic Sensation Vote (ASV) values for each sound type came from either “slightly cold” or “warm” conditions.

1. Introduction

As the standard of living rises, people are demanding more and more from their urban environments. Outdoor spaces are vital for residents’ living, communication, and organized activities. Improving the comfort of outdoor environments can increase the frequency, duration, and intensity of people’s activities in open spaces [1,2,3]. Thus, increasing time spent outdoors improves health and reduces disease risk [4,5]. Outdoor open space is subject to the interaction of many factors and its spatial quality depends on many factors such as visual comfort, acoustic comfort, and thermal comfort. In addition, plants have been found to influence space quality by improving air quality [6,7].
Thermal comfort is the most important environmental factor affecting residents’ participation in outdoor activities [8,9] and is susceptible to interference from noise and visual stimuli [10,11]. Especially in winter, attendance in open spaces drops dramatically [3]. As a result, the issue of improving the comfort of outdoor spaces in winter has received increasing attention from scholars from all walks of life.
The acoustic environment affects human thermal comfort in outdoor open spaces. An early study concluded that noise causes a slight increase in thermal sensation [12,13]. Yin (2022) found that the acoustic environment had a more significant impact on people’s thermal comfort at high and low temperatures than in moderate thermal environments by conducting on-site measurements of the acoustic and microclimatic environments in open spaces on a university campus, along with subjective questionnaires [14]. In addition, noise is an essential factor affecting heat perception, with increased noise levels causing subjects to feel more intense discomfort [11,15].
Illumination intensity (LUX) showed an interaction with daylight preference voting in terms of the Thermal Sensation Vote (TSV) and the Thermal Comfort Vote (TCV) [16].
Acoustic comfort is an essential component of overall comfort [17]. Temperature and light affect soundscape assessments [18]. In outdoor thermal environments, there is a significant negative correlation between the A-weighted Equivalent Sound Pressure Level (LAeq) and the Physiological Equivalent Temperature (PET) when visitors feel warmer [19]. Guan et al. found that temperature affects acoustic comfort under noisy conditions and that acoustic comfort is independent of temperature in a near-neutral thermal zone [20]. The visual landscape factor in older residential areas is vital for soundscape evaluation [21]. The positive correlation between the sky view factor (SVF) and acoustic comfort [22].
Visual comfort is an essential factor affecting the public [23]. On the one hand, landscape design elements such as plant composition and diversity, sidewalks, and water features influence visual comfort [24]. On the other hand, it has been demonstrated that physical parameters also affect visual comfort, such as illumination intensity [25], weather clearness [25], planting density of trees [26], shade [27], and ground surfacing materials [28].
Environmental evaluation is a complex process involving multiple perception and comfort factors. While providing valuable insights, studies of single perceptual factors do not adequately account for the full range of individual evaluations of the environment. Although the relationship between perception and comfort and specific environmental factors has been extensively studied, most studies have focused on the interaction of a few perceptual factors. In contrast, the combined effects of multiple perceptual factors have been under-explored [29,30,31,32]. In particular, studies on the combined impact of multisensory factors such as visual, auditory, and thermal sensations have mainly focused on indoor environments [16]. For example, studies on audiovisual stimuli have found that the perception of visual quality influences the perception of auditory quality and vice versa [33,34,35,36,37]. In acoustic–thermal perception studies, auditory perception increased with thermal sensation and noise level [38], with subjects feeling more thermally unpleasant when noise levels increased [39]. In visual–thermal studies, improvement in visual comfort reduces thermal discomfort and vice versa; reducing thermal discomfort increases visual comfort [40,41].
The outdoor space on campus is the principal activity place for students, and its environmental comfort directly affects teaching effectiveness and student growth. Optimized campus environments can significantly enhance student–teacher communication, concentration, and stress reduction [42] and improve the learning environment [43]. Students are the primary users of campus outdoor spaces, and enhancing the comfort of campus spaces can directly affect their well-being [44]. Most studies on the perception and comfort of campus outdoor space are two-factor interactions [14,45,46,47,48], and there is a lack of exploration of the combined effects of multiple perceptions [49,50]. Therefore, it is necessary to investigate the relationship between thermal comfort, acoustic comfort, and visual comfort in campus spaces to improve students’ satisfaction with campus outdoor spaces and promote healthy living.
In this study, nine typical spaces on the campus of a university in Fuzhou, which is located in the hot-summer and warm-winter regions of China [51], were selected as the research objects to explore the multisensory interactions of college students in the open space of the campus in winter through the collection of subjective and objective data on vision, sound, and heat. This study intends to reveal three research questions: (1) determine the effects of physical parameters such as thermal environment, sound type (STP), and illumination intensity (LUX) on thermal, acoustic, and visual comfort in campus open spaces; (2) explore the interactions between thermal, acoustic, and light sensations with thermal, acoustic, and visual comfort in campus open spaces; and (3) provide theoretical basis and technical guidance for campus open spaces to create a comfortable environment integrating visual, acoustic, and thermal comfort.

2. Research Methodology

2.1. Study Area

This study was conducted on a university campus in Fuzhou, a typical city in China’s hot-summer and warm-winter regions. Fuzhou has a subtropical monsoon climate with abundant sunshine and rainfall. The average annual temperature in Fuzhou is 20 to 25 °C. The campus is in Cangshan District, Fuzhou City (119°13′58.93″ E, 26°05′25.17″ N). With a green cover of 37.9%, the campus covers an area of approximately 160 hm2 [52], which is characterized by beautiful landscapes, rich spatial types, and diverse acoustic environments. It provides favorable conditions for studying the coupling relationship between thermal, acoustic, and visual comfort. According to previous studies, a 10–150 m radius affects the air temperature in urban spaces [53]. Therefore, the spatial extent was based on a radius of 10 m. Nine typical outdoor spaces on the campus were selected according to the proportion of different landscape elements and considering the sky visualization factor (SVF), sound source type, and functional differences: Xichen Road (S1); the atrium of the Innovation Building (S2); the square of Tianjiabing Building (S3); the green space under Chengzhi Building (S4); the lawn of Zhonghua Garden (S5); the woods of Zhonghua Garden (S6), Jingshan Road (S7), and Chunhui Bridge (S8); and Tuohuang Plaza (S9). See Figure 1. These nine spaces include famous spots on campus, close to administration buildings, teaching buildings, and campus entrances, and they are necessary places for teachers and students to study and live every day. The proportions of landscape elements in each space differ, and the visual effect varies greatly. At the same time, the nine spaces cover plazas, woodlands, water bodies, and buildings and can represent typical space types on campus.
Sky visualization factors (SVFs), fish-eye photographs, and environmental descriptions for each site are shown in Table 1.

2.2. Experimental Design

Referring to Xie’s study, the winter season in Fuzhou was divided into December–February [54]. Referring to the related test time [55,56], we chose clear and cloudless weather in this cycle as the test date, and the formal study was conducted on 7–8 December 2023. Before the start of the trial, the trial staff introduced the trial’s purpose, method, and process in detail to each volunteer. Upon arriving at the trial site, volunteers were required to carefully observe the surrounding landscape, listen to the sounds within the site, and fully perceive the site environment, a process that lasted 10 min. Volunteers were then given 5 min to complete the subjective questionnaire. During the filling process, the experimenter remained silent to avoid disturbing the subjects while measuring the meteorological data. Once the questionnaire was completed, the experimenter directed the volunteer to another test site within 10 min. This process was repeated until the volunteer completed the experience of the nine sites, thus ending the entire trial. Considering that not all of the nine outdoor spaces provide seating or sitting platforms, and to exclude the influence of other activities such as running, jogging, etc., on the results of the comfort poll, the trial required subjects to remain standing throughout the process to ensure that the metabolism of the different activities does not have an impact on the Thermal Sensation Vote (TSV).

2.2.1. Sound Selection

There is no standardized classification of sound types in current research on soundscapes. Axelsson proposed a system of five classifications of sound sources (vehicular traffic, fans, other noises, human voices, and natural sounds) as a norm for soundscape assessment. Through field surveys and with reference to Axelsson’s sound categorization [57], we classified the sounds in the measurement point space into six categories, including wind and leaf sounds, birds and insects, running water, vehicle traffic, music or radio, and human speech.

2.2.2. Experimental Data Collection

Reference was made to ASHRAE 55 (2017) and ISO 7726 (2002) for the selection of test instruments and measurement of meteorological parameters [58,59]. The meteorological stations in each test space were mounted on tripods at a vertical distance of 1.5 m from the ground (Table 2). Meteorological data monitored included air temperature (Ta), relative humidity (RH), wind speed (Va), global radiation (G), globe temperature (Tg), and illuminance intensity (LUX). Globe temperature, also known as the actual temperature, is a composite temperature that represents the actual temperature felt by a person when subjected to the combined effects of radiant and convective heat in a thermal environment and is usually slightly higher than the actual air temperature. The recording interval for all instruments was 1 min. Mean radiant temperature (Tmrt) was calculated using the air temperature (Ta), globe temperature (Tg), and wind speed (Va) [59]. The average radiant temperature is defined by assuming that the radiant heat transfer from the human body in the box to the box surface is equivalent to the heat transfer from the box surface when the actual temperature is not uniform. It is the primary input parameter for thermal index calculation. The calculation formula is as follows:
T m r t = [ ( T g + 273 ) 4 + 1.10 × 10 8 V a 0.6 ε D 0.4 ( T g T a ) ] 1 4 273
where ε is the black globe’s reflectivity (ε = 0.95 in this study), and D is its diameter (=0.05 m in this study).

2.2.3. Subjective Questionnaires

Following ISO 10551 (2019) [60], the questionnaire was divided into two parts: the first part investigated the volunteers’ personal information, including gender, age, height, weight, and clothing. The second part examined the volunteers’ perception of the visual, acoustic, and thermal environments in the experimental space, including Acoustic Sensation Vote (ASV), Acoustic Comfort Vote (ACV), Thermal Sensation Vote (TSV), Thermal Comfort Vote (TSV), Thermal Comfort Vote (TCV), Sunlight Sensation Vote (SSV), Visual Comfort Vote (VCV).
Based on the ASHRAE definition, volunteers were assessed using a 7-point scale for light perception (−3: very dark; −2: dark; −1: slightly dark; 0: moderate; +1: slightly bright; +2: bright; +3: very bright), sound perception (−3: very quiet; −2: quiet; −1: slightly quiet; 0: moderate; +1: slightly noisy; +2: noisy; +3: very noisy), and heat perception (−3: very cold; −2: cold; −1: slightly cold; 0: moderate; +1: slightly hot; +3: very hot). The Visual Comfort Vote, Acoustic Comfort Vote, and Thermal Comfort Vote were conducted on a 5-point scale: −2, very uncomfortable; −1, uncomfortable; 0, moderate; 1, comfortable; 2, very comfortable. The questionnaire can be found in Appendix A.

2.3. Thermal and Visual Indices

The Universal Thermal Climate Index (UTCI) model is widely used as it is considered to apply to all climatic, seasonal, temporal, and spatial scales [61,62]. Therefore, this study used the Universal Thermal Climate Index (UTCI) as a thermal index and calculations were made using the Rayman model to evaluate campus open spaces’ thermal comfort [63,64].
The meteorological parameters of the thermal environment were air temperature, relative humidity, wind speed, mean radiant temperature, and the corresponding date and time of completion of the subjective questionnaire, as well as personal variables of height, weight, age, sex, thermal resistance of clothing, and active metabolic rate, which were entered into the Rayman model to calculate the Universal Thermal Climate Index (UTCI). Clothing thermal resistance is based on the ASHRAE and ISO 7730 (2005) standards for clothing thermal resistance; after obtaining the value of the thermal resistance of each piece of clothing in the questionnaire, each one was then cumulatively summed to obtain the value of the clothing thermal resistance (Appendix B) [58,65]. Concerning the metabolic rate corresponding to outdoor activities, all volunteers in this trial were standing, so the metabolic rate was standardized at 70 W/m2.
The Mean Thermal Comfort Vote (MTSV) corresponding to each 1 °C Universal Thermal Climate Index (UTCI) interval group was calculated and fitted using a linear model based on the thermal environment parameters measured during the questionnaire survey. Referring to international biometeorological standards [9,66], a linear regression model was used to determine the corresponding temperature for a given TSV, dividing the UTCI into three levels: UTCI < 16.54 °C (slightly cold, TSV < −0.5), 16.54 °C ≤ UTCI < 21.97 °C (neutral, −0.5 ≤ TSV < 0.5), and UTCI ≥ 21.97 °C (warm, TSV ≥ 0.5) [67].
Illumination intensity is used as an indicator of the outdoor visual environment. Illumination represents the light captured on a curved surface, represented by lux units (one lumen per square meter) [68]. To be consistent with the Universal Thermal Climate Index (UTCI) classification, a linear regression model was fitted to the illumination intensity and the weighted average of SSV per 1 klux. A linear regression model was used to determine the corresponding illumination intensity for a given SSV, classifying the illumination intensity throughout the year into three classes: LUX < 9773.68 lux (neutral, SSV < 0.5), 9773.68 lux ≤ LUX < 26538.14 lux (slightly bright, 0.5 ≤ SSV < 1.5), and LUX ≥ 26538.14 lux (bright, SSV ≥ 1.5) [49,69].

2.4. Statistical Analysis

The Universal Thermal Climate Index (UTCI) and questionnaire data were analyzed and processed using Excel 2019 and IBM SPSS Statistics 26.0 software. Firstly, one-way ANOVA and Tukey’s post hoc test were used to describe the differences in meteorological parameters between measurement points. General descriptive statistics of the distribution of Thermal Sensation Vote (TSV) and Thermal Comfort Vote (TCV) at different sound types and light intensities were obtained by percentage stacked bar charts and box plots. Secondly, the chi-square test of independence was used to determine whether there was a significant association between thermal comfort indicators (TSV, TCV), acoustic comfort indicators (ASV, ACV), and visual comfort indicators (SSV, VCV).
A two-way ANOVA was used to analyze the interaction between Universal Thermal Climate Index (UTCI) rating; sound type; illuminance intensity (LUX) class; and acoustic, thermal, and visual comfort. Moreover, the results are shown in a clustered bar chart.

3. Descriptive Analysis

3.1. Attributes of Volunteers

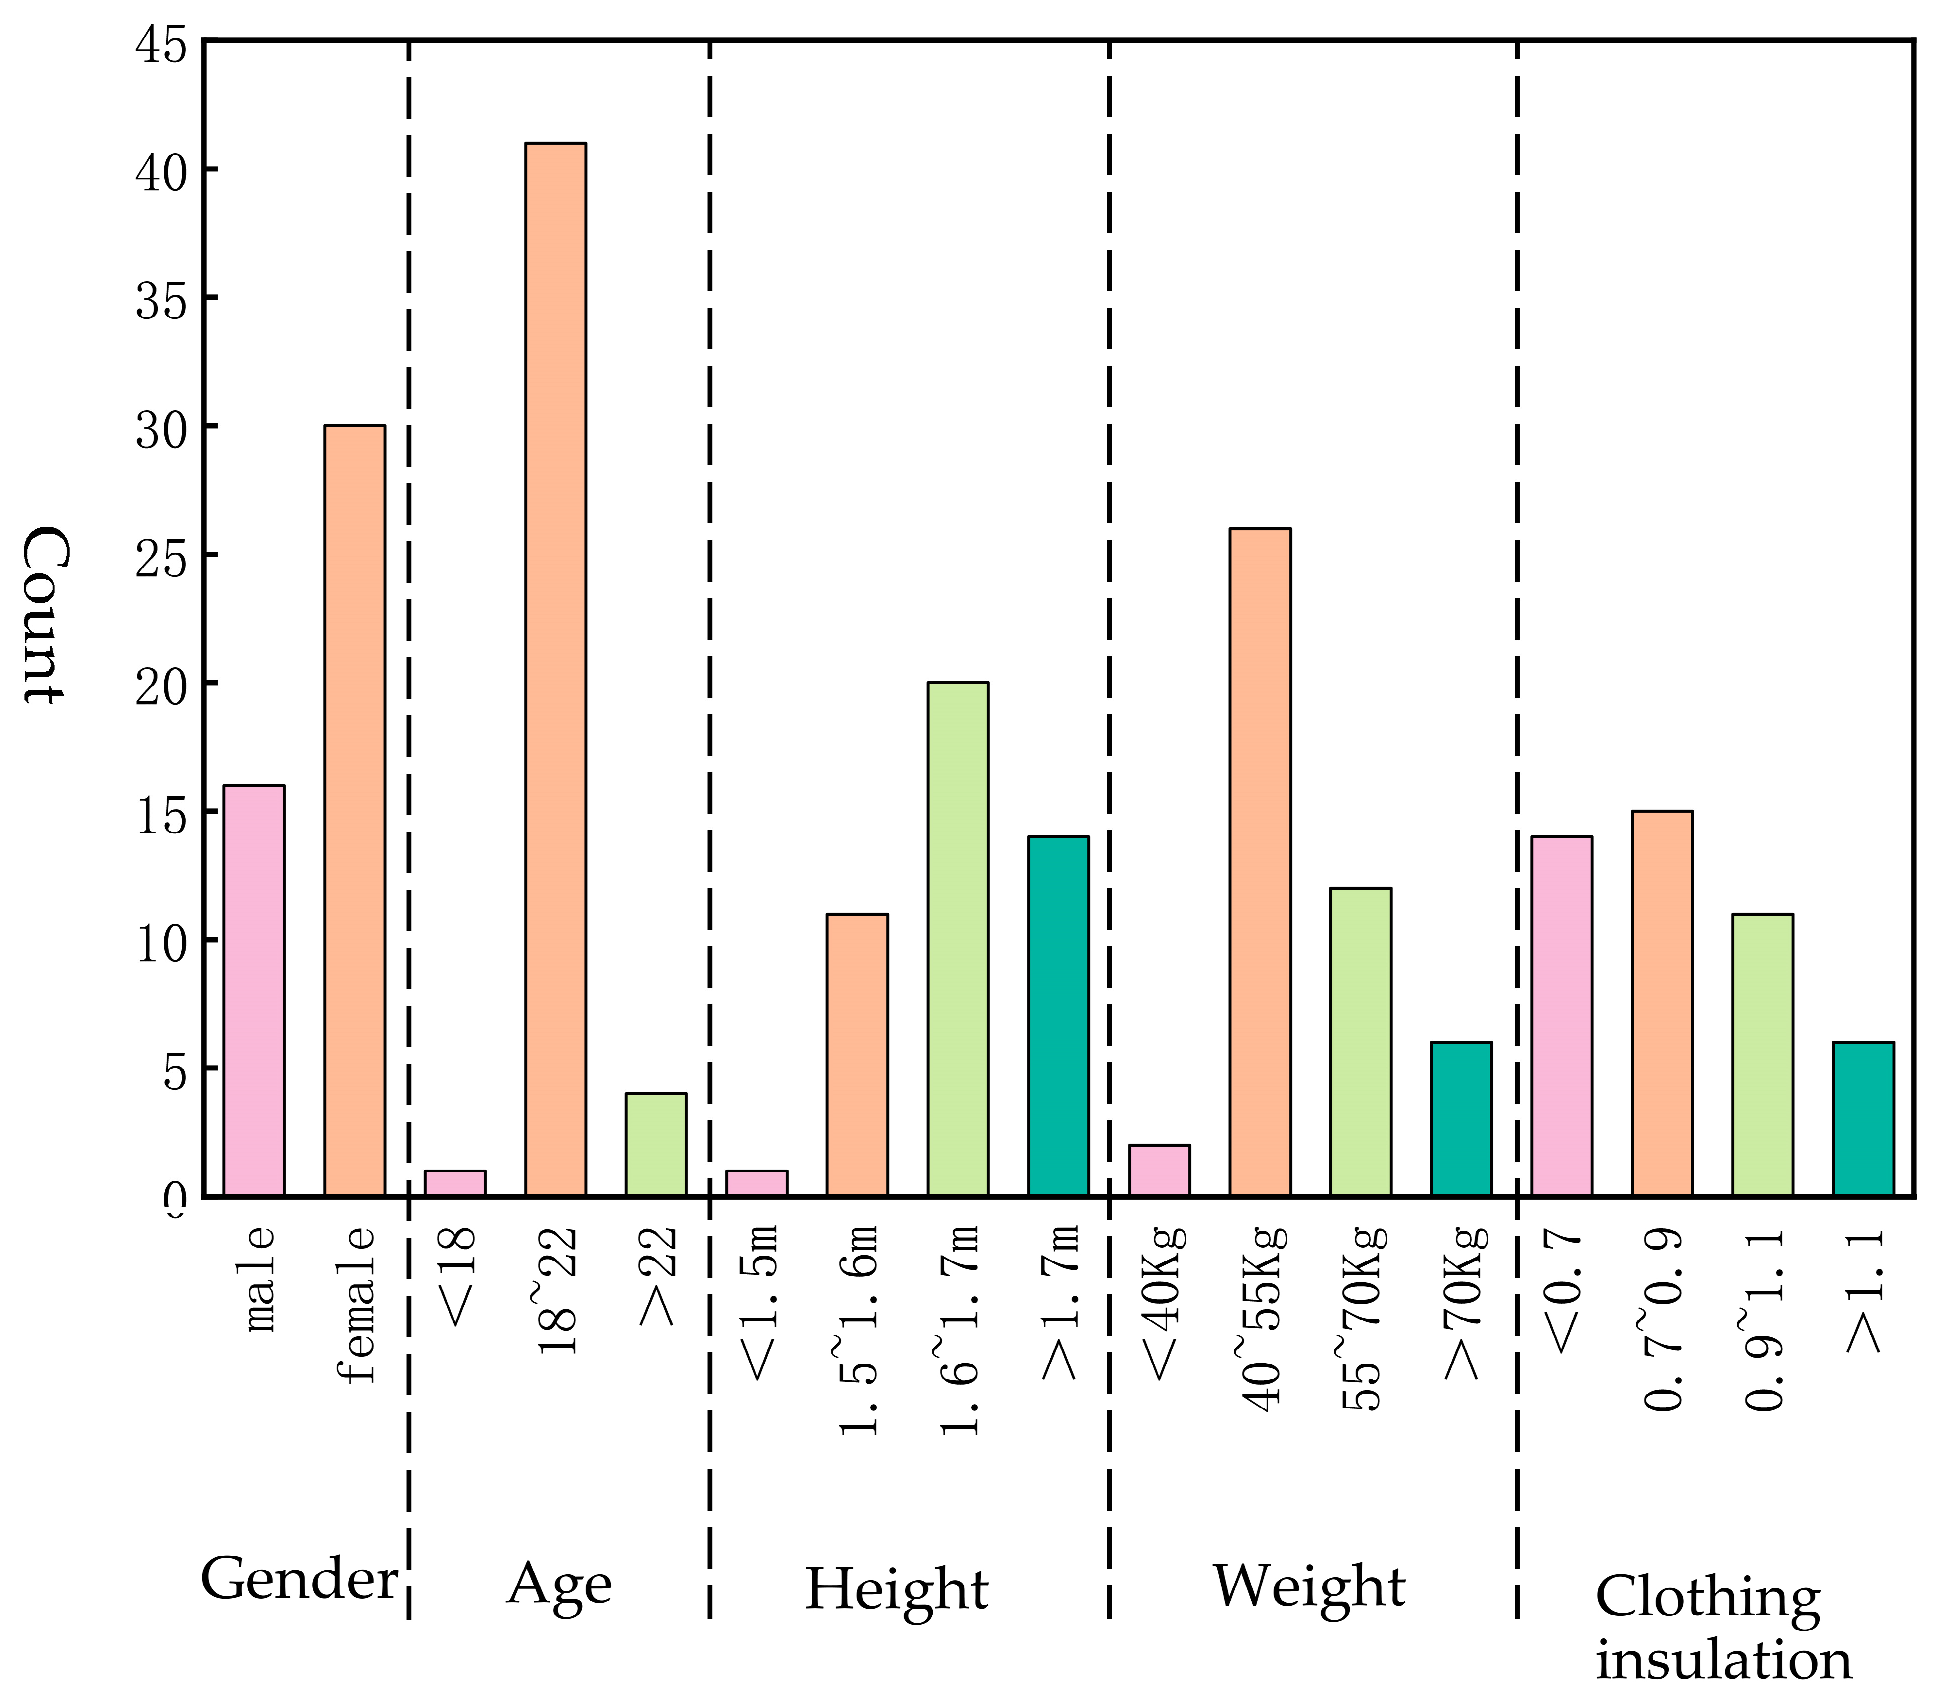
A total of 46 student volunteers were recruited as respondents for the trial. The volunteers were 17–33 years old, with heights ranging from 1.47 m to 1.82 m and weights ranging from 39 kg to 83 kg (Figure 2). All respondents had already adapted to the local climate and could accurately perceive temperature changes and adjust their clothing appropriately [70]. Each participant was informed of the procedure, requirements, and precautions before the trial, and they had normal hearing and vision and could reasonably assess their visual and acoustic surroundings. A total of 414 questionnaires were completed, including 385 valid questionnaires.

3.2. Meteorological Parameters

A one-way ANOVA analyses of variance were performed on the meteorological parameters for each space, as shown in Appendix C. The results indicated significant differences (p < 0.01) in air temperature, relative humidity, wind speed, global radiation, globe temperature, and illuminance intensity for the nine spaces, suggesting significant differences in the micrometeorological conditions between the spaces. The significance of the differences between two by two for each space was determined by Tukey’s post hoc test and is shown in Figure 3.
The mean air temperature and mean black sphere temperature were similar across the spaces, with S3 having the highest mean air temperature (22.72 °C) and the lowest mean wind speed (0.037 m/s); S9 had the lowest mean air temperature (14.9 °C). S5 had the highest mean wind speed, mean solar radiation, and mean illumination intensity, with 0.46 m/s and 169.31 W/m2 and 29665.58 lux, but it had the lowest mean humidity (35.16%). S7 had the lowest mean solar radiation and mean illumination intensity of 28.4 W/m2 and 2896.28 lux, respectively (Appendix D).

3.3. Thermal Sensation and Comfort of Volunteers

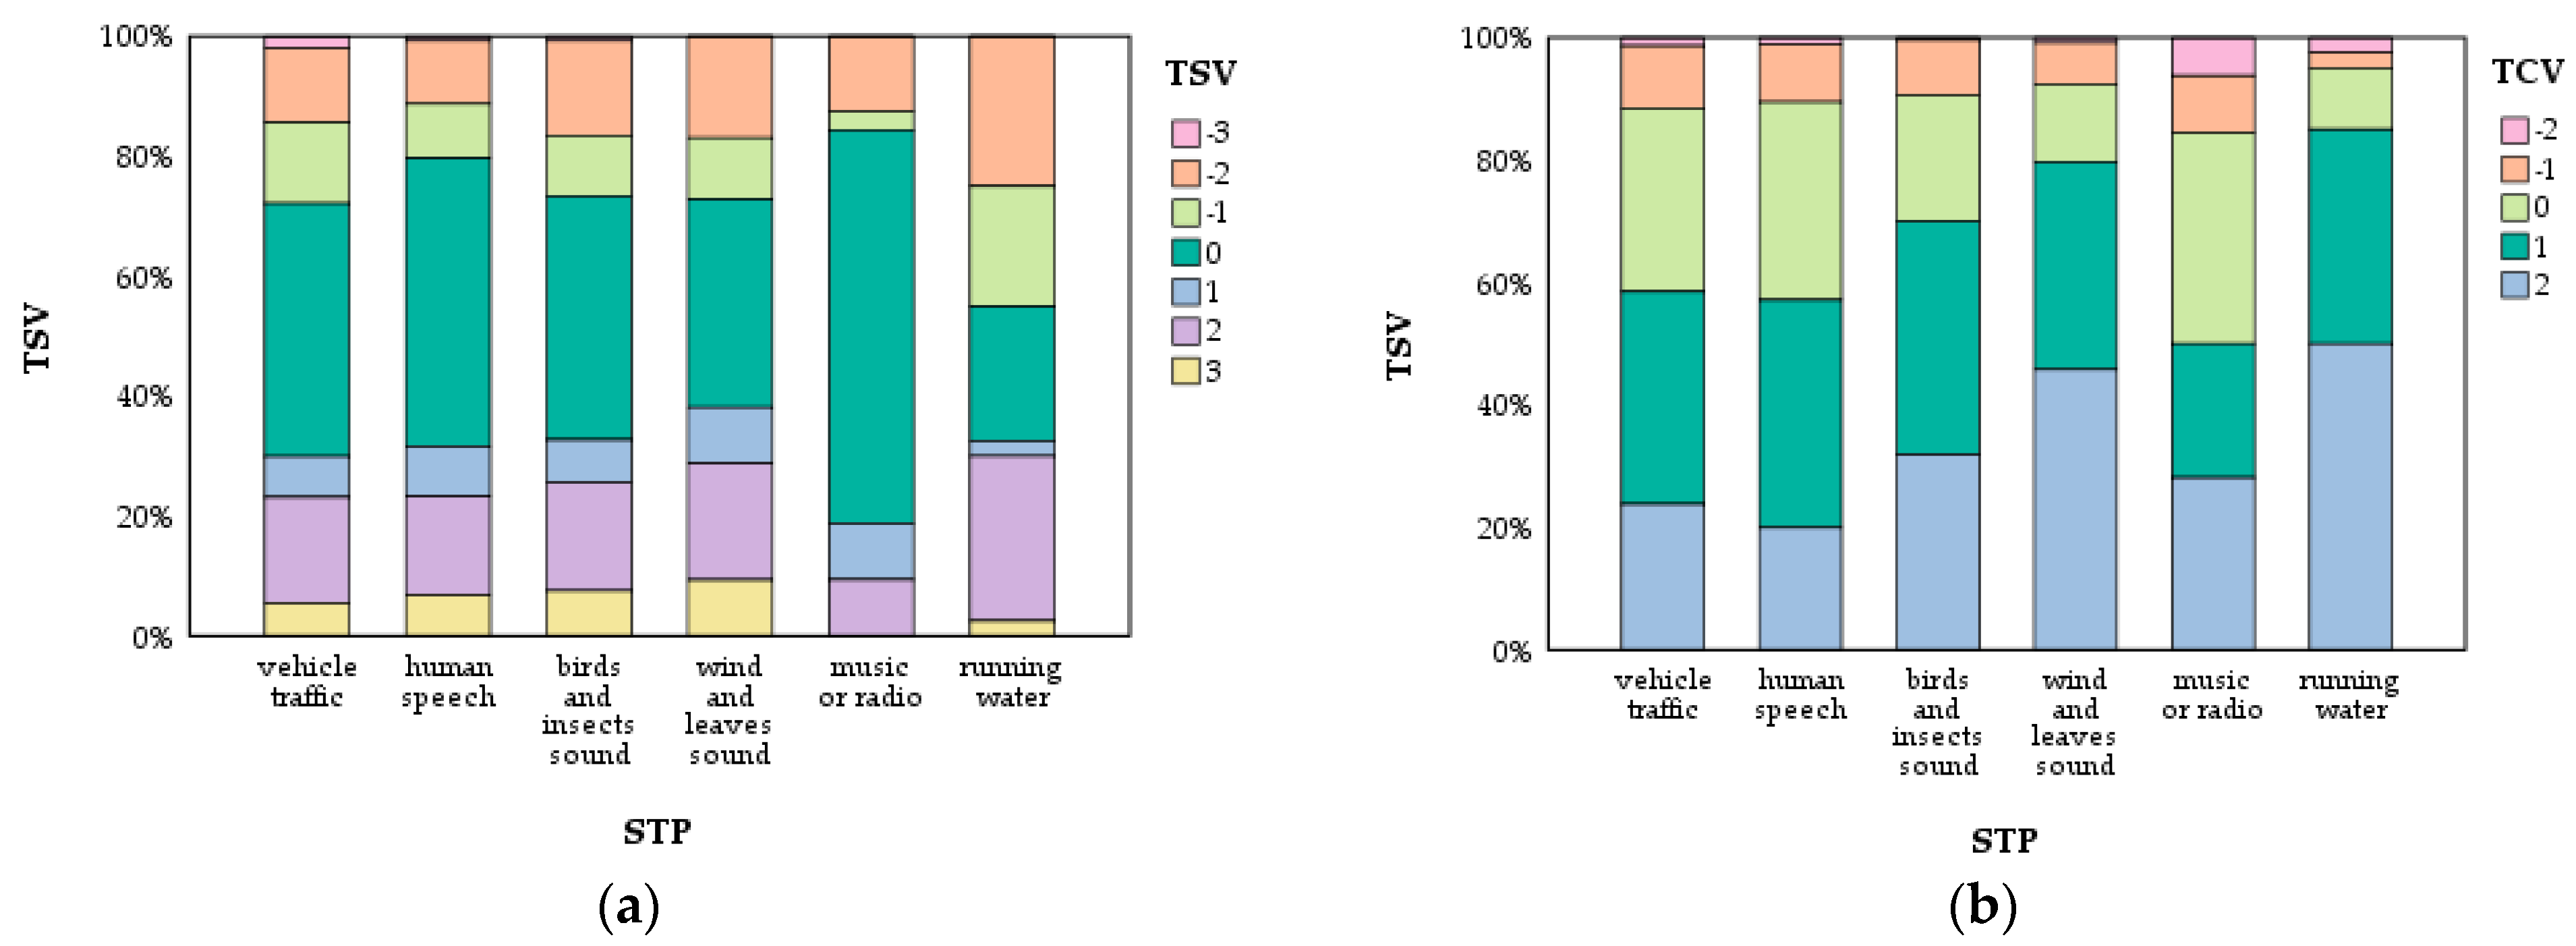
In the relationship between sound types (STPs) and the Thermal Sensation Vote (TSV), and the Thermal Comfort Vote (TCV), the running water sound differs from the other five sounds regarding overall distribution. The running water sound has a higher average percentage of “TSV = −2”, “TSV = 2”, and “TSV = 0” (25.00%, 27.50%, and 22.50%). This suggests that, compared to other sound types, people are less sensitive to heat in the running water environment. Apart from the sound of running water, the highest percentage of “TSV = −2” was found for the sound of wind and leaves and “TSV = −2” for the sound of birds singing and insects chanting (15.79% and 16.95%). The highest percentage (9.32%) was found for the sound of wind and leaves “TSV = 3”. The highest rate of “TSV = 0” was found in the radio or music sound (66.63%). This indicates that people are more sensitive to heat sensation in the wind and leaves’ sound environment, feeling a warmer TSV in the sound of birds and insects, and prefer a moderate Thermal Sensation Vote (TSV) in the sound of radio or music (Figure 4a).
The percentage of votes that were comfortable with the thermal environment (TCV = 2) were, in descending order, the sound of running water (50.00%), the sound of wind and leaves (45.76%), the sound of birds and insects (31.95%), the sound of radio or music (28.13%), the sound of vehicular traffic (23.81%), and the sound of people speaking (19.92%), and the votes that were uncomfortable with the thermal environment “The votes for TCV = −2” were, in descending order, radio or music sounds (6.25%), running water sounds (2.50%), vehicle traffic sounds (1.36%), human speech sounds (1.13%), the wind and leaves’ sound (0.85%), and the birds’ and insects’ sound (0.38%). The sounds of human speech, radio, or music, and vehicular traffic were more likely to be uncomfortable than other sounds (Figure 4b).
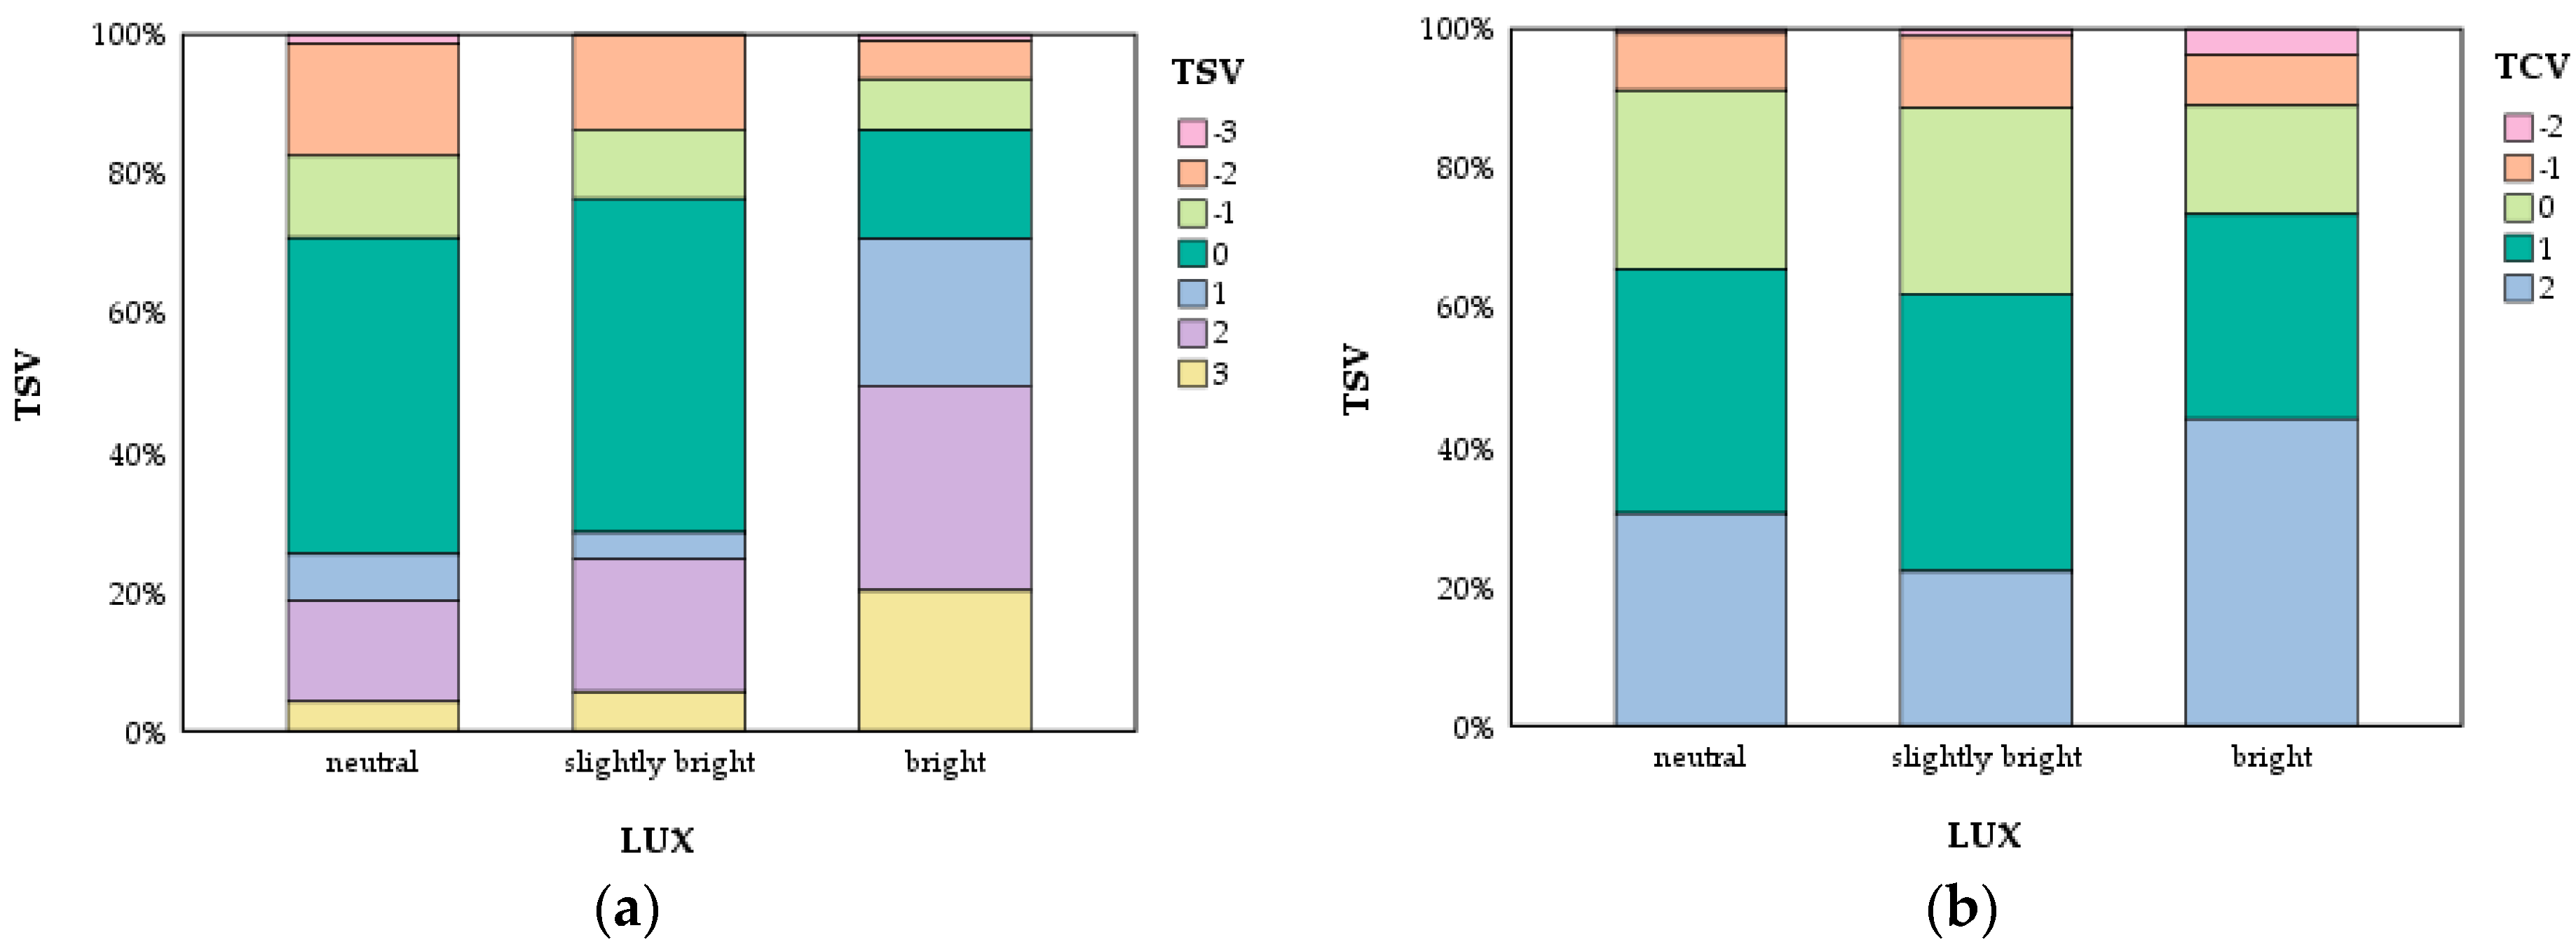
In the relationship between the illuminance intensity (LUX) class and the Thermal Sensation Vote (TSV), as well as the Thermal Comfort Vote (TCV), the percentage regarded as very hot (TSV = 3) in the Thermal Sensation Vote is “bright” (20.18%), “slightly bright” (5.63%), and “neutral” (4.20%), in descending order. The percentage regarded as cold (TSV = −2) is, in descending order, “neutral” (16.18%), “slightly bright” (13.73%), “bright” (5.50%), “neutral” (20.18%), “bright” (5.63%), and “neutral” (4.20%). This indicates that as the level of brightness increases, the percentage of thermal sensation increases. (Figure 5a).
The highest percentage (40.00%) of people were comfortable in the heat (TCV = 2) in the “bright” class. Very uncomfortable and uncomfortable (TCV = −2 and TCV = −1) scales were highest in the “slightly bright” class compared to other light environments, with 1.06% and 10.21%, respectively (Figure 5b).

3.4. Universal Thermal Climate Index (UTCI)

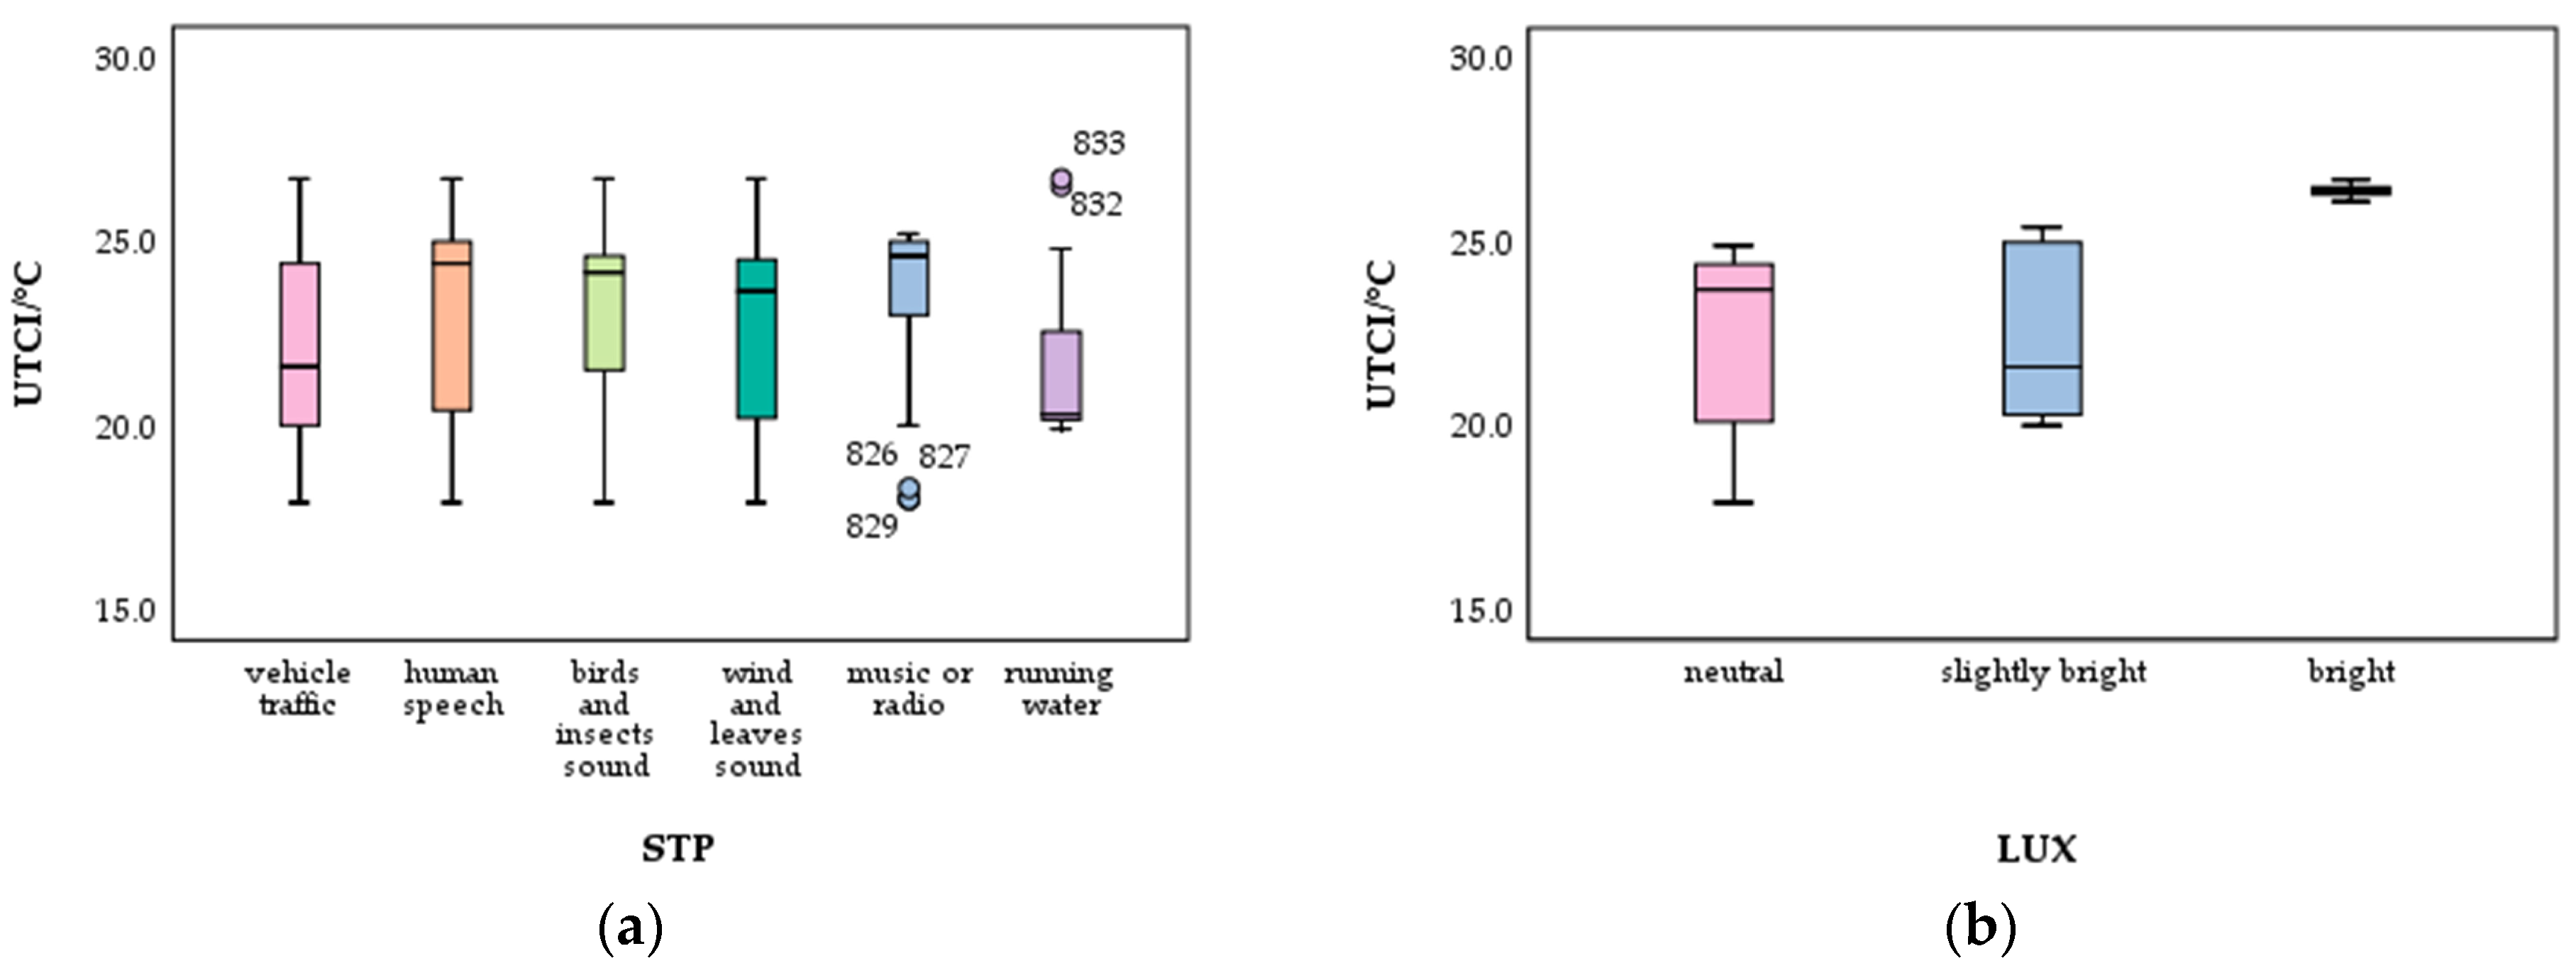
The five sounds’ median Universal Thermal Climate Index (UTCI) varied considerably. Among them are the sound of radio or music (26.6 °C), human speech (24.4 °C), birds and insects (24.15 °C), wind and leaves (23.7 °C), vehicle traffic (21.6 °C), and running water (20.3 °C). The Universal Thermal Climate Index (UTCI) of radio, music, and running water is most concentrated (Figure 6a).
The median Universal Thermal Climate Index (UTCI) values did not differ significantly between the three illumination intensity classes, with the maximum median Universal Thermal Climate Index (UTCI) value being “bright” (26.4 °C) and the minimum value being “neutral”. The “bright” environments had the most concentrated Universal Thermal Climate Index (UTCI) distribution (Figure 6b).

3.5. Correlation of Thermal, Acoustic, and Visual Comfort Indicators

The correlations between thermal (TSV and TCV), acoustic (ASV and ACV), and visual (SSV and VCV) indicators were verified using chi-square tests (Table 3). The relationships between the Thermal Sensation Vote(TSV) and the Acoustic Sensation Vote(ASV), the Thermal Sensation Vote(TSV) and the Acoustic Comfort Vote(ACV), the Thermal Sensation Vote(TSV) and the Sunlight Sensation Vote(SSV), the Thermal Sensation Vote(TSV) and the Visual Comfort Vote(VCV), the Thermal Comfort Vote(TCV) and the Acoustic Sensation Vote(ASV), the Thermal Comfort Vote(TCV) and the Acoustic Comfort Vote(ACV), the Thermal Comfort Vote(TCV) and the Sunlight Sensation Vote(SSV), the Thermal Comfort Vote(TCV) and the Visual Comfort Vote(VCV), the Acoustic Sensation Vote(ASV) and the Visual Comfort Vote(VCV), and the Acoustic Comfort Vote(ACV) and the Visual Comfort Vote(VCV) were all significant.

4. Interaction between Acoustic and Thermal Comfort

4.1. Effects of the Acoustic Environment on Thermal Perception

4.1.1. Effect of Sound Type on Thermal Perception

A two-way ANOVA was used to determine sequentially whether the Thermal Sensation Vote (TSV) and the Thermal Comfort Vote (TCV) differed based on the Universal Thermal Climate Index (UTCI) level and sound type.
The effect of the Universal Thermal Climate Index (UTCI) on the Thermal Sensation Vote (TSV) and the Thermal Comfort Vote (TCV) reached a significant level. The impact of sound type (STP) on both the Thermal Sensation Vote (TSV) and the Thermal Comfort Vote (TCV) was not important. The interaction of the Universal Thermal Climate Index (UTCI) and sound type was not substantial for the Thermal Sensation Vote (TSV) and the Thermal Comfort Vote (TCV) (Appendix E).
The Thermal Sensation Vote (TSV) increases for each sound type with the increasing Universal Thermal Climate Index (UTCI). The effect of sound type on the Thermal Sensation Vote (TSV) varied at different Universal Thermal Climate Index (UTCI) classes. At the “slightly cold” level, the wind and leaves’ sound was the warmest (0.14), while the rest were colder. This suggests that the sound of wind and leaves can alleviate the feeling of coldness in cold environments. At the “warm” level, the sound of running water made people feel colder (−1.00), and the rest of the sound types made people feel warmer, with the highest Thermal Sensation Vote for the sound of vehicle traffic (1.07). This indicates that in hotter environments, vehicle traffic sounds intensify the feeling of heat, and running water sounds reduce the feeling of heat. (Figure 7a).
For each sound type, the Thermal Comfort Vote was comfortable at each Universal Thermal Climate Index (UTCI) level. The highest Thermal Comfort Vote was found for the wind and leaves’ sound (1.35) in the “neutral” condition. The most comfortable Thermal Comfort Vote was found for running water (1.33) in the “warm” condition, indicating that the wind and leaves’ sound and running water significantly increased the subjective Thermal Comfort Vote. This suggests that the wind and leaves’ sound and running water sound can dramatically improve people’s subjective Thermal Comfort Vote (TCV). In the moderate environment, the radio or music sound had the lowest Thermal Comfort Vote (0.25), suggesting that people in a moderately hot climate with a radio or music sound had a higher requirement for thermal comfort (Figure 7b).

4.1.2. Impact of Acoustic Comfort on Thermal Perception and Thermal Comfort

We used a two-way ANOVA to test sequentially whether the Thermal Sensation Vote (TSV) and the Thermal Comfort Vote (TCV) differed by Universal Thermal Climate Index (UTCI) class and the Acoustic Comfort Vote (ACV). ANOVA showed that the effects of both the Universal Thermal Climate Index (UTCI) and the Acoustic Comfort Vote (ACV) on the Thermal Sensation Vote (TSV) reaching a significant level, and the interaction of the Universal Thermal Climate Index (UTCI) and the Acoustic Comfort Vote (ACV) on the Thermal Sensation Vote (TSV) was substantial. The effect of the Universal Thermal Climate Index (UTCI) on the Thermal Comfort Vote (TCV) was significant. The impact of the Acoustic Comfort Vote (ACV) on the Thermal Comfort Vote (TCV) was substantial. In contrast, the effect of the Universal Thermal Climate Index (UTCI) and the Acoustic Comfort Vote (ACV) interaction had a significant impact on the Thermal Sensation Vote (TSV) (Appendix E).
When the Acoustic Comfort Vote (ACV) was the same, the Thermal Comfort Vote increased significantly with increasing Universal Thermal Climate Index (UTCI) levels. When the Universal Thermal Climate Index (UTCI) levels are the same, the Acoustic Comfort Vote (ACV) affects the Thermal Comfort Vote (TCV) differently. At “slightly cold” and “neutral”, the Thermal Comfort Vote was lowest at ACV= −2 (−3, −0.40, respectively), i.e., it is easier to feel cold when hearing uncomfortable sounds in slightly cold environments. When it is “warm”, there is no significant effect of the Thermal Comfort Vote (TCV) at a different Acoustic Comfort Vote (ACV), and all Thermal Comfort Votes are positive except for the very uncomfortable acoustic environment (ACV = −2). This suggests that sounds (except ACV = −2) increase the subjective Thermal Comfort Vote in a slightly warm environment (Figure 8a).
When the Universal Thermal Climate Index (UTCI) is the same, thermal comfort increases significantly with increasing acoustic comfort level. This indicates that people in a comfortable ambient sound environment perceive the thermal environment as more comfortable. There is no significant pattern between the Thermal Comfort Vote and the Universal Thermal Climate Index (UTCI) when the Acoustic Comfort Vote (ACV) is the same (Figure 8b).

4.2. Effects of Thermal Environment on Acoustic Perception

4.2.1. Effect of Universal Thermal Climate Index (UTCI) on Acoustic Perception and Acoustic Comfort

To determine sequentially whether the Acoustic Sensation Vote (ASV) and Acoustic Comfort Vote (ACV) differed by Universal Thermal Climate Index (UTCI) class and sound type (STP), a two-way ANOVA was used. It showed a significant effect of the Universal Thermal Climate Index (UTCI) on the impacts of the Acoustic Sensation Vote (ASV) and the Acoustic Comfort Vote (ACV) and a non-significant effect of sound type on the Acoustic Sensation Vote (ASV). The interaction of the Universal Thermal Climate Index (UTCI) and sound type was significant for the Acoustic Sensation Vote (ASV). The effect of sound type was substantial for the Acoustic Comfort Vote (ACV), and the interaction of the Universal Thermal Climate Index (UTCI) and sound type was substantial for the Acoustic Comfort Vote (ACV) (Appendix E).
Comparing the three classes of the Universal Thermal Climate Index (UTCI), the highest Acoustic Sensation Vote (ASV) was found in slightly cold environments (all greater than 0), indicating a high tolerance for sound in slightly cold environments. The lowest Acoustic Sensation Vote (ASV) was found in warm environments (mean Acoustic Sensation Vote (MASV) = −0.52), indicating that in warm environments, people have a low tolerance for sound (Figure 9a).
The ambient sound environments generally gave a higher subjective Acoustic Comfort Vote (ACV), with the Acoustic Comfort Vote (ACV) in slightly cooler environments being significantly lower than the other Universal Thermal Climate Index (UTCI) levels, suggesting that more relaxed environments reduce people’s subjective acoustic comfort. The highest Acoustic Comfort Vote (ACV) scores in each sound type were derived from “neutral” or “warm” conditions. The highest Acoustic Comfort Vote (ACV) scores for each sound type were from “neutral” to “warm” conditions, suggesting that the subjective Acoustic Comfort Vote (ACV) of certain sounds can be altered by adjusting the thermal environment. Comparing the Acoustic Comfort Vote (ACV) of the different sound types, natural and artificial sounds had the highest Acoustic Comfort Vote (ACV) when “neutral”, while traffic sounds had the highest Acoustic Comfort Vote (ACV) when “warm” (Figure 9b).

4.2.2. Effect of Thermal Comfort on Acoustic Sensation and Acoustic Comfort

A two-way ANOVA was used to determine sequentially whether the Acoustic Sensation Vote (ASV) and the Acoustic Comfort Vote (ACV) differed based on the Universal Thermal Climate Index (UTCI) class and sound type (STP). Analysis of variance (ANOVA) showed that the effect of the Thermal Comfort Vote (TCV) on the Acoustic Sensation Vote (ASV) reached a significant level, and the impact of sound type on the Acoustic Sensation Vote (ASV) was not important. The interaction between the Thermal Comfort Vote (TCV) and sound type was not substantial for the Acoustic Sensation Vote (ASV). At the same time, the effect of the Thermal Comfort Vote (TCV) on the Acoustic Comfort Vote (ACV) reached a significant level. The impact of sound type on the Acoustic Comfort Vote (ACV) was substantial, and the interaction between the Thermal Comfort Vote (TCV) and sound type was significant for the Acoustic Comfort Vote (ACV) (Appendix E).
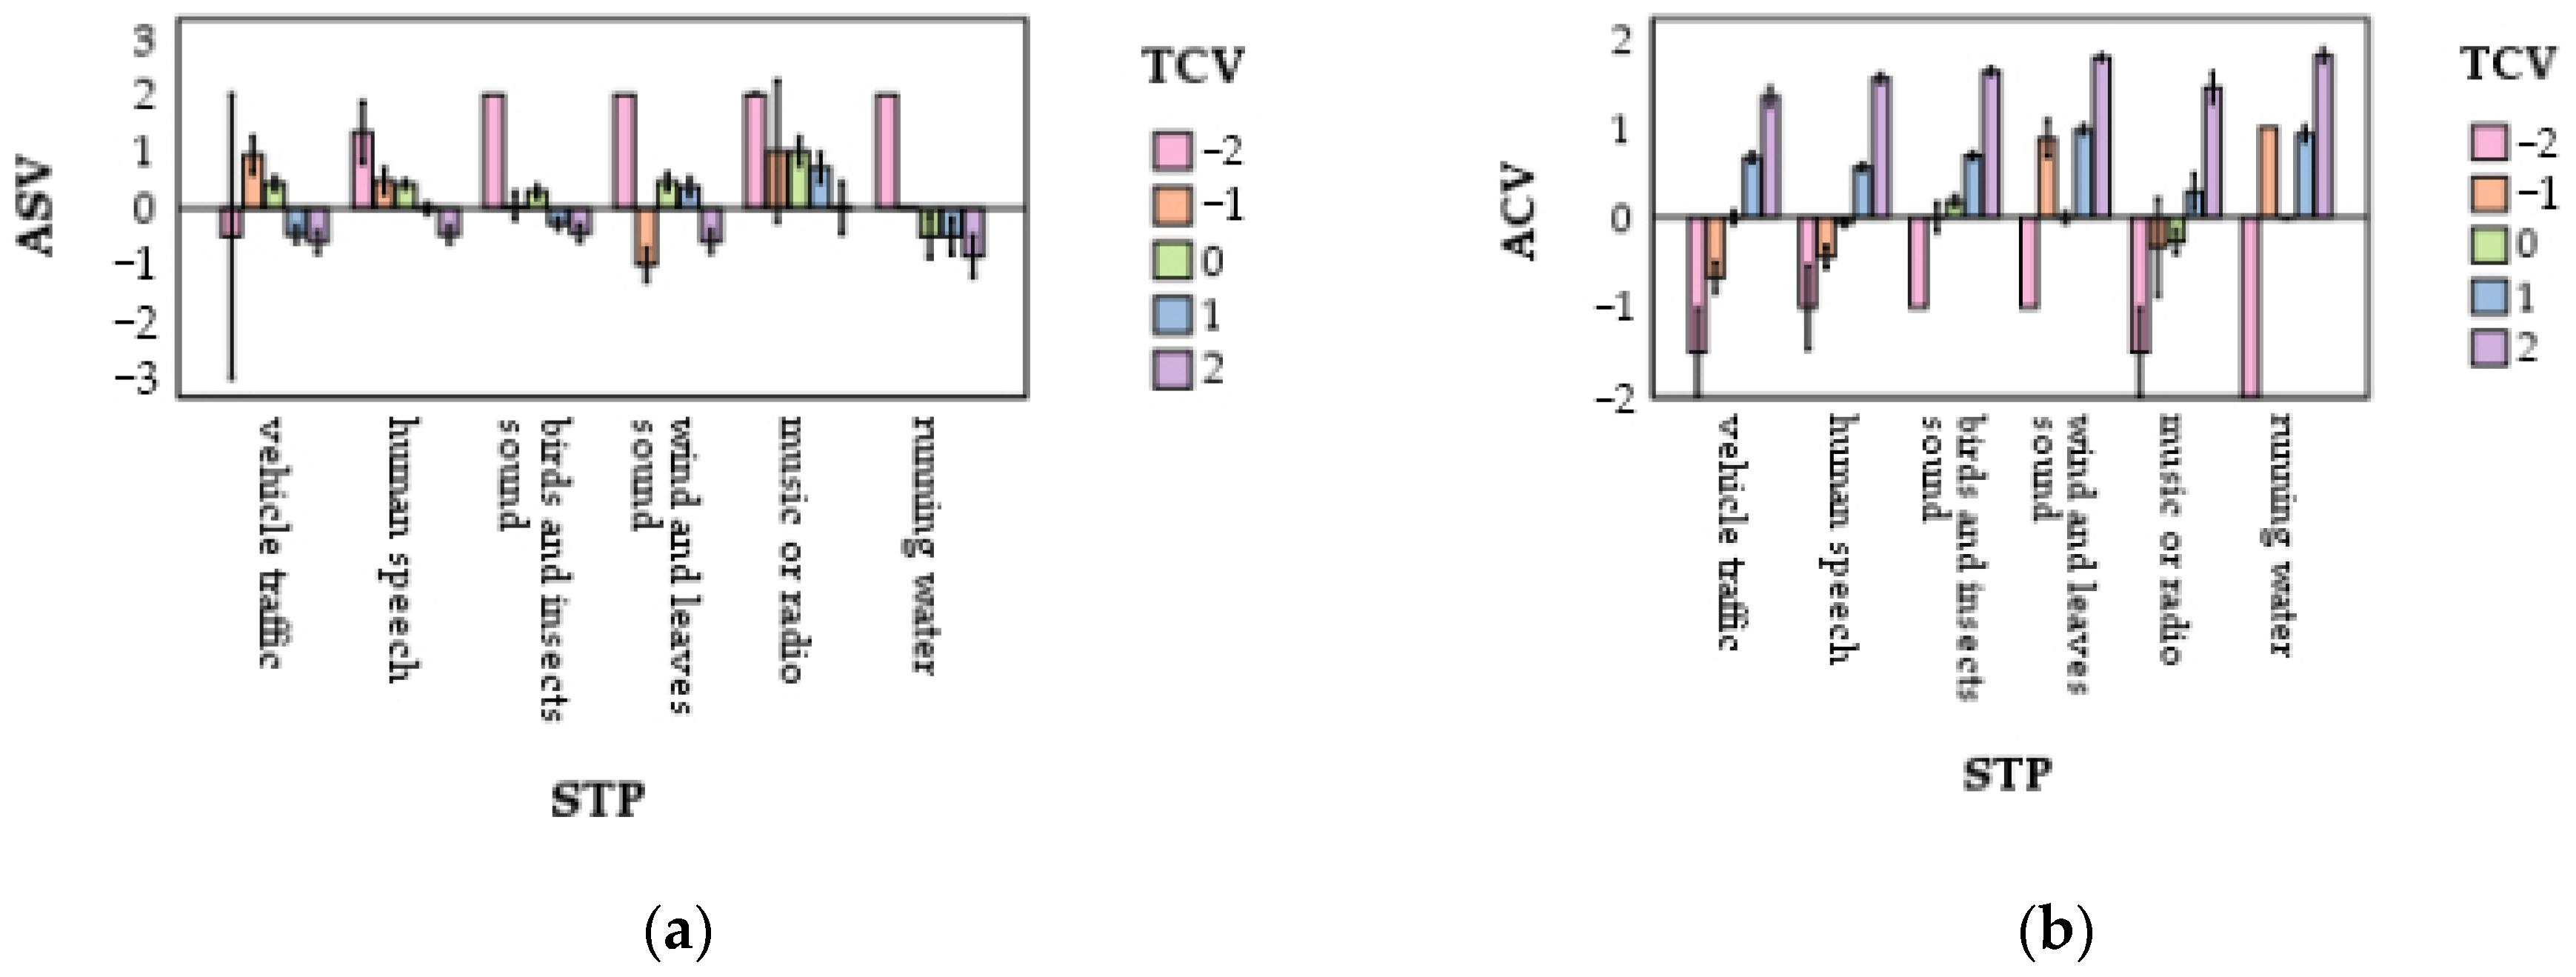
For the sound of running water, the Acoustic Sensation Vote was lower (−0.85) for being very comfortable with the thermal environment (TCV = 2) and higher (2.00) for being very uncomfortable with the thermal environment (TCV = −2). The same pattern is reflected in the sound of radio or music, birdsong and insects, and human speech. People feel the sounds are louder in thermal discomfort and quieter in thermal comfort. In the vehicle traffic sound, the Acoustic Sensation Vote was 0.93 for feeling acoustically comfortable in the thermal environment (TCV = −1) and 0.43 for the thermal environment being moderate (TCV = 0), indicating that people felt the sound was quieter in the thermal discomfort state (Figure 10a).
As the Thermal Comfort Vote increased, the overall Acoustic Comfort Vote (ACV) increased accordingly for each sound type. In this case, the Acoustic Comfort Vote (ACV) for all six sounds was >1 when the thermal environment was very comfortable (TCV = 2). This indicates that people who are very comfortable with the outdoor thermal environment are usually also comfortable with the sounds in the environment. When thermal comfort is low, the sound comfort ratings for the sounds in the environment are also lower (Figure 10b).

5. Interaction between Visual and Thermal Comfort

5.1. Effects of Visual Environment on Thermal Perception

5.1.1. Effect of Illumination Intensity on Thermal Sensation and Thermal Comfort

ANOVA was used to determine whether the Thermal Sensation Vote (TSV) and the Thermal Comfort Vote (TCV) were sensitive to variations in the illuminance intensity (LUX) class and Universal Thermal Climate Index (UTCI) class. The effects of the Universal Thermal Climate Index (UTCI) and illumination intensity on the Thermal Sensation Vote (TSV) and the Thermal Comfort Vote (TCV) were significant. The illumination intensity and Universal Thermal Climate Index (UTCI) interaction was significant for the Thermal Sensation Vote (TSV) and the Thermal Comfort Vote (TCV) (Appendix E).
The relationship between the Thermal Sensation Vote and the Universal Thermal Climate Index (UTCI) at different illuminance intensity (LUX) classes is shown in Figure 11a, with the lowest Thermal Sensation Vote (−0.58) at the “slightly cold” level and the highest Thermal Sensation Vote (1.19) at the “warm” level, suggesting that the Universal Thermal Climate Index (UTCI) can regulate thermal sensation. At the “warm” level, the brightest illumination intensity achieved the lowest Thermal Sensation Vote (0.58), suggesting that people are less sensitive to thermal environment in hotter environments when LUX is “brighter”. When LUX was “neutral”, the Thermal Comfort Vote was −0.58, −0.48, and 0.63, respectively, in descending order, indicating that the Thermal Sensation Vote (TSV) was positively correlated with the Universal Thermal Climate Index (UTCI) when the illumination intensity was moderate.
The relationship between the Thermal Comfort Vote (TCV) and the Universal Thermal Climate Index (UTCI) at different illuminance intensity (LUX) classes is shown in Figure 11b. The highest Thermal Comfort Vote (1.32) was achieved when the Universal Thermal Climate Index (UTCI) was “neutral” at “neutral” illuminance intensity (LUX), suggesting that people were more likely to achieve a higher Thermal Comfort Vote in moderate light and moderate heat environments. The lowest Thermal Comfort Vote (0.55) was achieved when the Universal Thermal Climate Index (UTCI) was “warm”, and the illuminance intensity (LUX) was “slightly bright”, suggesting that brighter light conditions lead to higher thermal comfort when people feel hotter.

5.1.2. Influence of Visual Comfort on Thermal Sensation and Thermal Comfort

A two-way ANOVA was used to determine sequentially whether the Thermal Sensation Vote (TSV) and the Thermal Comfort Vote (TCV) differed based on the Universal Thermal Climate Index (UTCI) class and the Visual Comfort Vote (VCV). It showed that the effect of the Universal Thermal Climate Index (UTCI) reached a significant level for the Thermal Sensation Vote (TSV) and the Visual Comfort Vote (VCV) for the Thermal Comfort Vote (TCV). The interaction of the Universal Thermal Climate Index (UTCI) and the Visual Comfort Vote (VCV) significantly affected the Thermal Sensation Vote (TSV). The effect of the Universal Thermal Climate Index (UTCI) on the Thermal Comfort Vote (TCV) reached a significant level, and the impact of the Visual Comfort Vote (VCV) on the Thermal Comfort Vote (TCV) was substantial. The interaction of the Universal Thermal Climate Index (UTCI) and the Visual Comfort Vote (VCV) significantly affected the Thermal Comfort Vote (TCV). The interaction of the Universal Thermal Climate Index (UTCI) and the Visual Comfort Vote (VCV) had a substantial effect on the Thermal Comfort Vote (TCV). The Universal Thermal Climate Index (UTCI) and the Visual Comfort Vote (VCV) had a significant impact on the Thermal Comfort Vote (TCV). The Universal Thermal Climate Index (UTCI) and the Visual Comfort Vote (VCV) had a considerable effect on the Thermal Comfort Vote (TCV).
The relationship between the Thermal Sensation Vote (TSV) and Universal Thermal Climate Index (UTCI) class at a different Visual Comfort Vote (VCV) is shown in Figure 12a. The Thermal Sensation Vote (TSV) increased with the increasing Universal Thermal Climate Index (UTCI) at all Universal Thermal Climate Index (UTCI) levels, and the effect of the Visual Comfort Vote (VCV) on the Thermal Sensation Vote (TSV) varied according to the Universal Thermal Climate Index (UTCI) class. The Thermal Sensation Vote was <0 at both “slightly cold” and “neutral” levels, indicating that people perceive colder environments as colder, whether they are comfortable or uncomfortable. The lowest Thermal Sensation Vote (−1.5) was obtained in the “warm” environment, indicating that when acoustically uncomfortable, a lower Thermal Sensation Vote (TSV) is obtained even in a hotter environment.
Figure 12b shows the relationship between the Thermal Comfort Vote (TCV) and Universal Thermal Climate Index (UTCI) class at a different Visual Comfort Vote (VCV). For each Universal Thermal Climate Index (UTCI) class, the Thermal Comfort Vote increased with the increasing Visual Comfort Vote (VCV), suggesting that the Thermal Comfort Vote can be improved by modulating the Visual Comfort Vote (VCV). The highest Thermal Comfort Vote (TCV = 1.73) was achieved when the visual comfort environment was very comfortable (VCV = 2), indicating that people are more likely to obtain a higher Thermal Comfort Vote (TCV) in moderate environments with acoustic comfort. The lowest Thermal Comfort Vote (−1) was achieved when the visual comfort environment was very uncomfortable (VCV = −2), indicating that people are more likely to feel thermal discomfort in acoustically uncomfortable conditions.

5.2. Effect of Thermal Environment on Visual Perception

5.2.1. Effect of Universal Thermal Climate Index (UTCI) on Light Perception and Visual Comfort

ANOVA showed that the effect of the Universal Thermal Climate Index (UTCI) reached a significant level for the Sunlight Sensation Vote (SSV), and illumination intensity was significant for the Sunlight Sensation Vote (SSV). The Universal Thermal Climate Index (UTCI) interaction and illumination intensity significantly affected the Sunlight Sensation Vote (SSV). The effect of the Universal Thermal Climate Index (UTCI) on the Visual Comfort Vote (VCV) reached a significant level, and the impact of illumination intensity on the Visual Comfort Vote (VCV) was substantial. The Universal Thermal Climate Index (UTCI) interaction and illumination intensity significantly affected the Visual Comfort Vote (VCV).
Overall, the Sunlight Sensation Vote (SSV) increased with increasing illumination intensity. At a LUX level of “neutral”, people perceived the Sunlight Sensation Vote (SSV) to be darkest at “slightly cold” (−0.18), and at a LUX class of “bright”, people perceived the Sunlight Sensation Vote (SSV) to be brightest when “warm” (1.72). When the LUX level was “bright”, people perceived the Sunlight Sensation Vote (SSV) as brightest when it was “warm” (1.72). This suggests that LUX can significantly affect the Sunlight Sensation Vote (SSV) and that the Universal Thermal Climate Index (UTCI) can regulate sunlight sensation (Figure 13a).
Figure 13b shows the relationship between the Visual Comfort Vote (VCV) and illuminance intensity (LUX) at different Universal Thermal Climate Index (UTCI) classes. When illumination intensity is “neutral”, a moderate illumination intensity makes people feel the most comfortable (1.37). When the thermal environment is “warm”, the Visual Comfort Vote (VCV) increases with illumination intensity. This suggests that visual comfort can be improved by adjusting the Universal Thermal Climate Index (UTCI) and illumination intensity.

5.2.2. Impact of Thermal Comfort on Light Perception and Visual Comfort

We used a two-way ANOVA to determine patterns in the Sunlight Sensation Vote (SSV) and the Visual Comfort Vote (VCV) with the Thermal Comfort Vote (TCV) and illuminance intensity (LUX) class. ANOVA showed a significant effect of the Thermal Comfort Vote (TCV) the on Sunlight Sensation Vote (SSV) and a critical impact of illumination intensity on the Sunlight Sensation Vote (SSV). The interaction of the Thermal Comfort Vote (TCV) and illumination intensity considerably impacted the Sunlight Sensation Vote (SSV). The effect of the Thermal Comfort Vote (TCV) on the Visual Comfort Vote (VCV) reached a significant level of effect, and the impact of illumination intensity on the Visual Comfort Vote (VCV) was not significant. The effect of the Thermal Comfort Vote (TCV) and illumination intensity on the Visual Comfort Vote (VCV) reached a considerable level.
The relationship between the Sunlight Sensation Vote (SSV) and illuminance intensity (LUX) at a different Thermal Comfort Vote (TCV) is shown in Figure 14a. In each Thermal Sensation Vote (TSV) condition, the Sunlight Sensation Vote increased as the illuminance class increased. When the heat was uncomfortable (TCV = −2), people with a “neutral” illuminance class felt that the light was the dimmest (SSV = −1.00), and people with an illumination intensity class of “brighter” and “bright” perceived a higher Sunlight Sensation Vote (SSV = 1.00). People with the illumination intensity class of “brighter” and “brighter” perceived a higher Sunlight Sensation Vote (SSV = 1.00, 3.00). This suggests that illuminance intensity (LUX) can significantly affect the Sunlight Sensation Vote and that people in heat-uncomfortable or heat-comfortable environments are more sensitive to the Sunlight Sensation Vote when the illuminance intensity (LUX) class is “neutral”.
The relationship between Visual Comfort Vote (VCV) and illuminance intensity (LUX) class at different Thermal Comfort Vote (TCV) is shown in Figure 14b. Visual Comfort Vote (VCV) increased with increasing Thermal Comfort Vote (TCV) at all illumination intensity classes. People who perceived the thermal environment to be the most comfortable (TCV = 2) likewise perceived the visual environment to be the most comfortable (VCV = 1.81, 1.68, and 1.79), and people who perceived the thermal environment to be the least comfortable (TCV = −2) likewise perceived the visual environment to be the same as those who found the thermal environment the least comfortable (VCV = −0.67, −0.67, and −1.00), suggesting that the Visual Comfort Vote (VCV) and the Thermal Comfort Vote (TCV) were significantly positively correlated at each illumination intensity class and that increasing people’s thermal comfort increased people’s visual comfort at the same time.

6. Discussion and Analysis

6.1. Influence of Acoustic–Thermal Environments

Sound type could not significantly influence subjective thermal sensation and could dramatically influence thermal comfort (Appendix E). Differences in the Thermal Sensation Vote (TSV) between voice types were insignificant, and voice type could significantly influence the Thermal Comfort Vote (TCV), a finding consistent with previous studies [20,45]. This may be because different sound types affect people’s acoustic comfort, and thus, their thermal comfort, e.g., cheerful sounds (nature sounds or meaningful radio sounds) can make people experience better thermal comfort [45]. In contrast, noise increases thermal discomfort and improves cold discomfort, and musical sounds can moderate high-temperature thermal discomfort but increase cold discomfort [71]. This is inconsistent with Brambilla’s views [72]. Acoustic comfort can significantly affect subjective thermal sensation and thermal comfort. In warm and slightly cold environments, the comfortable sound increased people’s thermal sensation, and sound comfort significantly enhanced thermal comfort (Figure 8). This is consistent with Geng’s findings [49]. Lin found that increasing acoustic comfort partially reduced thermal comfort, especially at high physical activity levels [73]. Based on the above conclusions, appropriately increasing the playing time and frequency of beautiful campus radio music may be considered in areas with high pedestrian flow in the school, and in open squares and other places with little shade, adding vertical greening, optimizing the structure of plant communities to provide habitats for insects and birds, and improving thermal comfort by improving acoustic comfort may be considered as well.
The effect of the Universal Thermal Climate Index (UTCI) on subjective acoustic sensation and acoustic comfort was significant (Appendix E). Previous studies showed that the impact of the Universal Thermal Climate Index (UTCI) on subjective the Acoustic Sensation Vote (ASV) was not substantial but one of the critical factors affecting acoustic comfort vote [11,13,25]. Jin et al. concluded that low temperatures in winter and high temperatures in summer exacerbated acoustic discomfort in subjects to some extent [74]. However, in this experiment, the six sounds obtained a lower Acoustic Comfort Vote (ACV) at “slightly cold”, and the music radio sound obtained the least comfortable Acoustic Comfort Vote (ACV) at “warm”, which may be because the study by Jin et al. considered only one sound traffic noise, and that the temperature difference between the cold area and the Fuzhou area was significant. This may be because only one type of sound, traffic noise, was considered in the study by Jin et al. Thermal comfort significantly influences people’s acoustic sensation and acoustic comfort (Appendix E). For vehicular traffic and birdsong, there was no significant pattern in the effect of increasing the Thermal Comfort Vote (TCV) on the Acoustic Sensation Vote (Figure 10a). For the other four sounds, people feel it is noisier when experiencing thermal discomfort and quieter when experiencing thermal comfort. An increase in the Thermal Comfort Vote (TCV) increases their acoustic comfort. Acoustic comfort increased with thermal comfort in all six sounds. One study found that thermal comfort affected acoustic comfort to varying degrees with season [14]. A study in a hospital found that thermal comfort improved patients’ acoustic ratings [75]. This is broadly consistent with our findings. Deficiencies in the acoustic environment can be enhanced by improving the thermal environment and regulating thermal comfort. For example, fountains or misting systems can be installed under noisy school buildings and near roads with high traffic noise. Water features can increase humidity and improve the thermal environment. Plants can also improve the thermal environment by planting shrubs that act as windbreaks, thus increasing the temperature and thermal sensation [34].

6.2. Influence of the Visual–Thermal Environment

Illumination intensity significantly affected thermal sensation and thermal comfort (Appendix E). This is in line with the findings of Du [32]. Respondents who felt hot would find the sun too strong [76]. In slightly cold and neutral environments, increasing illumination intensity increased people’s Thermal Comfort Vote (TCV), but in warm environments, appropriately decreasing illumination intensity increased people’s Thermal Comfort Vote (TCV) [49]. Other studies have suggested that winter light affects vision and thermal sensation through radiant heat [22]. In the present experiment, the effects of the Universal Thermal Climate Index (UTCI) level and illumination intensity on the Thermal Sensation Vote (TSV) and the Thermal Comfort Vote (TCV) did not show a clear pattern (Figure 11), which was due to the lack of a pattern for the Sunlight Sensation Vote (SSV) and the Visual Comfort Vote (VCV) in the “slightly bright” and “bright” illumination intensity class and the lack of a pattern for the Sunlight Sensation Vote (SSV) and the Visual Comfort Vote (VCV) in the “slightly cold” or “neutral” conditions.
An increase in visual comfort significantly increased thermal comfort (Figure 12b). Visual perception is an essential factor influencing the thermal comfort of residents in sunny climates [28]. Thermal discomfort can be alleviated by light conditions that improve visual comfort [38]. This contradicts Chinazzo et al., who suggest a negative correlation between luminance and thermal comfort [77]. However, it may not be appropriate to use illuminance alone as a measure of visual amenity, as the illuminance that determines visual amenity may also be an essential radiative condition in thermal comfort calculations. In addition, visual comfort is influenced by urban landscape design elements such as plant composition and diversity, pavements, and water features [24].
The Universal Thermal Climate Index (UTCI) significantly influenced sunlight sensation (Figure 13a). This is consistent with previous findings [31,78]. Yang et al.’s indoor study on the interaction of illuminance and temperature concluded that people perceive light as dimmer at 25 °C compared to at 20 °C and 30 °C, i.e., luminance tends to be perceived as dimmer under thermo-neutral conditions [23]. A study in a hot and humid subtropical climate indicated no significant difference between neutral respondents’ mean Sunlight Sensation Vote (SSV) and slightly more relaxed to colder under partly cloudy and sunny conditions [16]. The thermal and visual environment assessment also includes many other aspects (e.g., sensation, preference, comfort, acceptability, and tolerance) [77,79,80]. The Universal Thermal Climate Index (UTCI) similarly affected the Visual Comfort Vote (VCV), with a moderate Universal Thermal Climate Index (UTCI) favoring increased visual comfort when the outdoor light environment is moderate.
When outdoor illumination intensity is neutral, neither thermal comfort nor thermal discomfort is conducive to enhancing people’s light sensation polling (Figure 14a). This is because thermal perception affects illuminance perception emotionally [16]. We found that thermal and visual comfort were positively correlated. (Figure 14b). Increasing thermal comfort at each illumination intensity class is beneficial to improve visual comfort; when illumination intensity is dim, people with a higher Thermal Comfort Vote (TCV) will pay more attention to the light environment, and when illumination intensity is high outdoors, neither thermal comfort nor thermal discomfort is beneficial in increasing the Sunlight Sensation Vote (SSV) [49]. Kulve et al. concluded that as thermal comfort increases, human visual comfort also increases. This is consistent with our findings [38].
Based on the visual–thermal interaction, the thermal environment can be improved in hotter spaces by adding shade to avoid direct light and increase visual comfort. Tall trees can also provide shade. Thermal comfort in outdoor spaces can be improved on winter campuses by adding extracurricular, hands-on programs encouraging students to get out in the sun.

6.3. Limitations and Future Work

In this study, the visual, acoustic, and thermal comfort of college students in a winter outdoor space was investigated to discuss the effects of physical parameters such as thermal environment, sound type, and illumination intensity on thermal, acoustic, and visual comfort, as well as the coupling between thermal, acoustic, and visual comfort. Nevertheless, the results of this study have some limitations and potential for improvement.
First, sound type and illumination intensity were selected as objective factors for evaluating acoustic comfort and visual comfort in this pair. The results of the study showed that the interaction between visual comfort and acoustic comfort was not significant. More factors (e.g., different loudness of sound sources, visual greenness, aesthetic evaluation, pleasantness, etc.) could be used to evaluate acoustic comfort and visual comfort in further studies to further investigate the interaction between acoustic comfort and visual comfort.
Second, nine spaces within a campus were explored in this study, encompassing most of the space types within the campus. This study divided the measurement points according to different landscape elements with a radius of 10 m. More spaces with different ranges and types can be considered in future studies. Meanwhile, outdoor space is an important place for human activities, not only including campus space. Therefore, studying more spaces with different ranges and types is necessary, such as empty pocket parks, residential green spaces, and historical landscape areas. In addition, the differences in comfort among people of different ages should be studied to make the sensory comfort coupling relationship more explicit.
Finally, Fuzhou is a typical city in the hot-summer and warm-winter regions, with warm and humid winters and hot and rainy summers. This study was conducted in winter. Additional research on summer and transition seasons can be considered for subsequent studies to refine the coupling between multi-sensory comfort in hot-summer and warm-winter regions.

7. Conclusions

This study selected nine typical visual spaces on a university campus in Fuzhou City to investigate experimenters’ subjective perceptions of thermal, acoustic, and visual environments. On-site meteorological observations and volunteer questionnaires were used to explore the combined effects of visual, acoustic, and thermal comfort in campus open spaces. The following are the main findings of this study.
(1) The effect of acoustic comfort on thermal sensation was significant (p < 0.05). Under “warm” and “slightly cold” conditions, the perceived environment was colder (−3, −0.33) when the acoustic environment was very uncomfortable (ACV = −2), but when the acoustic environment was very comfortable (ACV = 2), the environment was considered more neutral (0.00,1.11). Acoustic comfort had a significant effect on thermal comfort (p < 0.05). The thermal comfort vote increased with increasing levels of acoustic comfort in all Universal Thermal Climate Index (UTCI) classes.
(2) Thermal comfort had a significant effect on acoustic sensation (p < 0.05), with the highest and lowest Acoustic Sensation Vote (ASV) scores in each sound type originating from either “slightly cold” or “warm” conditions. There was a significant effect of acoustic comfort on thermal comfort (p < 0.05). The Acoustic Comfort Vote (ACV) increases with the Thermal Comfort Vote (TCV) in each sound type.
(3) The effect of illumination intensity on thermal sensation and thermal comfort was significant (p < 0.05). When “neutral”, the Thermal Sensation Vote (TSV) increased with increasing illumination intensity. The lowest Thermal Comfort Vote (0.55) was obtained when “warm” and when illumination intensity was brighter.
(4) The effect of the Universal Thermal Climate Index (UTCI) on the Sunlight Sensation Vote (SSV) was significant (p < 0.05). The Sunlight Sensation Vote increased with the increasing Universal Thermal Climate Index (UTCI) when the illumination intensity class was moderate and brighter. Thermal comfort had a substantial effect on sunlight sensation (p < 0.05). With a “neutral” illumination intensity, people perceived it as dimmest (−1.00) when the thermal comfort was very low (TCV = −2) and as more neutral (0.23) when the thermal comfort was very high (TCV = 2). Thermal comfort significantly affected visual comfort (p < 0.05). Those who perceived the thermal environment as the most comfortable (TCV = 2) also perceived the visual environment as the most comfortable (VCV = 1.81, 1.68, 1.79).
This study contributes to the knowledge of perception and comfort and provides a way of new thinking for understanding the relationship between people and the environment. In addition, urban planners and designers can improve and optimize campus outdoor spaces based on the influence patterns among comfort levels, such as enhancing sound types, providing appropriate visual landscapes, and regulating thermal comfort to meet the needs of students and faculty in the use of spaces, thus improving the overall comfort of campus spaces.

Author Contributions

Conceptualization, J.Y. and S.L.; methodology, J.Y., S.L. and Y.Z. (Yijing Zhang); validation, S.L.; formal analysis, S.L., Q.Z. and H.W.; investigation, S.L., H.W., W.X. and P.X.; Writing—original draft preparation: S.L.; writing—review and editing: J.Y.; visualization, S.L.; supervision, T.H., L.C. and Y.Z. (Yushan Zheng). All authors have read and agreed to the published version of the manuscript.

Funding

This research received no external funding.

Data Availability Statement

The data presented in this study are available on request from the corresponding author. The data are not publicly available due to the institute’s policy.

Conflicts of Interest

The authors declare no conflicts of interest.

Appendix A

Table A1. Questionnaire.
2 Perception and Evaluation of Campus Space Questionnaire (Winter)—Chuangxin Building
1. Gender * ○Male ○Female2. Height:_________ (CM)3. Weight: _________ (KG)
4. Native Place: _________5. Age: _________
6. Education
○Secondary/high school (including vocational high school and high technology) and below ○College ○Bachelor’s degree ○Master’s degree ○Doctor’s degree
7. Please select all of your current clothing (multiple choice) * Tops:
□Vest□T-shirt□Thermal underwear
□Long-sleeved T-shirt□Thin coat□Overcoat
□Thick coat□Sweater□Down jacket
8. Bottoms: [Multiple choice] *
□Shorts□Short skirt□Leggings
□Capri trousers□Knee-length skirt□Long johns
□Pants□Short sleeve dress□Long woolen underwear
□Fleece-lined pants□Long sleeve dress
9. Shoes and Socks: [multiple choice] *
□Socks□Sandal□Sneaker
□Stocking□Shoes□Boot
10. Other: [Multiple choice] *
□Cap□Earmuff□Mask
□Cooling arm sleeves□Glove□Scarf
□None
11. The light in your current environment makes you feel: [Single choice] *
○-3
Very dark
○−2
Dark
○−1
Slightly dark
○0
Moderate
○+1
Slightly bright
○+2
Bright
○+3
Very bright
12. The view makes you feel: *
○−2
Very uncomfortable
○−1
Uncomfortable
○0
Moderate
○+1
Comfortable
○+2
Very comfortable
13. The main types of sound in this scene are: *
□vehicle traffic□human speech□Running water□ birds and insects□wind and leaf sounds□music or radio
14. The loudness of the current ambient sound makes you feel that: *
○−3
Very quiet
○−2
Quiet
○−1
Slightly quiet
○0
Moderate
○+1
Slightly noisy
○+2
Noisy
○+3
Very noisy
15. The sound you heard made you feel: [Single choice] *
○−2
Very uncomfortable
○−1
Uncomfortable
○0
Moderate
○+1
Comfortable
○+2
Very comfortable
16. In the current environment, you feel that: *
○−3
Very cold
○−2
Cold
○−1
Slightly cold
○0
Moderate
○+1
Slightly hot
○+2
hot
○+3
Very hot
17. Based on your current sense of body, you feel that the environment: *
○−2
Very uncomfortable
○−1
Uncomfortable
○0
Moderate
○+1
Comfortable
○+2
Very comfortable
* Mandatory option.

Appendix B

Table A2. Corresponding diagram of clothing insulation.
ClothingClothing Thermal ResistanceClothingClothing Thermal ResistanceClothingClothing Thermal Resistance
Ves0.06T-shirt0.08Long-sleeved T-shirt0.25
Thick coat0.4Thick coat0.48Sweater0.28
Thermal underwear0.20 Overcoat0.6Down jacket1.09
Shorts0.06Capri trousers0.2
Pants0.28Long johns0.2Knee-length skirt0.33
Leggings0.28Fleece-lined pants0.28Short sleeve dress0.19
Long woolen underwear0.2Short skirt0.23Long sleeve dress0.47
Socks0.02Stocking0.02Sandal0.02
Sneaker0.04Boot0.1Shoes0.04
None0Cap0.05Glove0.05
Scarf0.05

Appendix C

Table A3. Results of analysis of variance (ANOVA) for meteorological variables.
Sum of SquaresdfMean SquareFSig.
TaBetween Groups28.852826.107814.2190.000 *
Within Groups10.1003150.032
Total218.952323
RHBetween Groups856.6418107.080134.1660.000 *
Within Groups251.4063150.798
Total1108.047323
VaBetween Groups5.67580.7098.8050.000 *
Within Groups25.3793150.081
Total31.054323
GBetween Groups616,017.901877,002.238109.3110.000 *
Within Groups221,895.432315704.430
Total837,913.334323
TgBetween Groups59.01287.37686.8410.000 *
Within Groups3.058360.085
Total62.07044
IlluminanceBetween Groups5,235,427,812.4948654,428,476.562127.7910.000 *
Within Groups419,930,323.528825,121,101.506
Total5,655,358,136.02190
* significant at the 0.05 level.

Appendix D

Table A4. Mean values of physical measurements.
S1S2S3S4S5S6S7S8S9
Ta (°C)
Max22.06 22.16 22.13 22.46 22.62 22.22 20.55 21.84 20.05
Min21.98 22.09 21.98 21.38 22.22 20.90 19.98 20.94 19.83
Mean ± SD22.06 ± 0.0622.11 ± 0.0222.07 ± 0.0521.41 ± 0.0222.39 ± 0.1421.41 ± 0.4020.29 ± 0.2021.39 ± 0.2519.91 ± 0.07
RH (%)
Max38.43 37.91 40.89 38.30 37.08 39.62 43.65 41.27 40.40
Min36.50 36.78 38.00 36.05 33.86 35.36 38.68 35.55 38.45
Mean ± SD37.44 ± 0.4737.2 ± 0.2638.74 ± 0.6436.99 ± 0.5435.16 ± 0.7937.78 ± 1.1241.3 ± 1.3038.48 ± 1.5239.44 ± 0.57
Va(m/s)
Max0.67 1.00 0.67 0.65 1.34 0.68 0.33 1.34 1.00
Min0.00 0.00 0.00 0.00 0.00 0.00 0.00 0.00 0.00
Mean ± SD0.05 ± 0.140.16 ± 0.270.04 ± 0.130.15 ± 0.180.426 ± 0.520.10 ± 0.170.06 ± 0.130.35 ± 0.420.27 ± 0.29
G(W/m2)
Max65.663.1168.166.4464.436.919.496.944.7
Min44.461.946.954.245.633.111.930.638.5
Mean ± SD47.43 ± 3.8862.30 ± 0.5766.26 ± 18.4361.24 ± 5.36169.31 ± 75.7535.7 ± 1.2013.05 ± 1.5255.56 ± 14.6642.06 ± 2.10
UTCI (°C)
Max24.525.424.921.726.723.920.720.518.3
Min24.124.924.321.526.123.519.920.0 17.9
Mean ± SD24.4 ± 0.1025 ± 0.1224.6 ± 0.1321.6 ± 0.0526.4 ± 0.1523.7 ± 0.1020.23 ± 0.1920.2 ± 0.1418.1 ± 0.12
Illuminance (klux)
Max9.8411.1414.0714.4631.076.133.0117.426.75
Min3.9810.721.9812.9328.735.662.757.70 5.93
Mean ± SD7.00 ± 2.7110.99 ± 0.145.33 ± 3.4413.82 ± 0.5529.67 ± 0.895.86 ± 0.212.9 ± 0.8513.4 ± 5.126.34 ± 0.37

Appendix E

Table A5. Results of two-way ANOVA.
dfFSig. dfFSig.
TSVUTCI214.5070.000 *TCVUTCI21.2650.283
STP51.7290.125 STP51.8720.097
UTCI × STP91.6880.088 UTCI × STP90.6680.738
TSVUTCI213.6430.000 *TCVUTCI27.780.000 *
ACV43.1690.013 * ACV489.1630.000 *
UTCI × ACV82.0690.036 * UTCI × ACV81.5990.121
ASVUTCI223.6140.000 *ACVUTCI25.2360.005 *
STP51.0240.402 STP53.8120.002 *
UTCI × STP92.6370.005 * UTCI × STP92.1510.023 *
ASVSTP51.1010.358ACVSTP52.6730.021 *
TCV46.060.000 * TCV4107.3720.000 *
STP × TCV200.9370.539 STP × TCV201.6010.046 *
TSVUTCI238.9190.000 *TCVUTCI226.4960.000 *
LUX211.6910.000 * LUX213.6110.000 *
UTCI × LUX17.010.008 * UTCI × LUX17.2240.007 *
TSVUTCI258.1650.000 *TCVUTCI23.0580.048 *
VCV41.9290.104 VCV4132.5130.000 *
UTC × VCV61.350.232 UTCI × VCV63.8810.001 *
SSVUTCI215.6550.000 *VCVUTCI217.2130.000 *
LUX244.540.000 * LUX210.6730.000 *
UTC × LUX11.8250.177 UTCI × LUX119.5150.000 *
SSVLUX240.760.000 *VCVLUX21.2310.293
TCV43.4560.008 * TCV4132.5070.000 *
LUX × TCV82.6270.008 * LUX × TCV82.3060.019 *
* significant at the 0.05 level.

References

  1. Martinelli, L.; Lin, T.-P.; Matzarakis, A. Assessment of the Influence of Daily Shadings Pattern on Human Thermal Comfort and Attendance in Rome during Summer Period. Build. Environ. 2015, 92, 30–38. [Google Scholar] [CrossRef]
  2. Niu, J.; Xiong, J.; Qin, H.; Hu, J.; Deng, J.; Han, G.; Yan, J. Influence of Thermal Comfort of Green Spaces on Physical Activity: Empirical Study in an Urban Park in Chongqing, China. Build. Environ. 2022, 219, 109168. [Google Scholar] [CrossRef]
  3. Lin, T.-P.; Tsai, K.-T.; Hwang, R.-L.; Matzarakis, A. Quantification of the Effect of Thermal Indices and Sky View Factor on Park Attendance. Landsc. Urban Plan. 2012, 107, 137–146. [Google Scholar] [CrossRef]
  4. Zhang, J.; Chaaban, J. The Economic Cost of Physical Inactivity in China. Prev. Med. 2013, 56, 75–78. [Google Scholar] [CrossRef]
  5. Li, K.; Wang, L.; Feng, M. Relationship between Built Environments and Risks of Ischemic Stroke Based on Meteorological Factors: A Case Study of Wuhan’s Main Urban Area. Sci. Total Environ. 2021, 769, 144331. [Google Scholar] [CrossRef]
  6. Paton-Walsh, C.; Rayner, P.; Simmons, J.; Fiddes, S.L.; Schofield, R.; Bridgman, H.; Beaupark, S.; Broome, R.; Chambers, S.D.; Chang, L.T.-C.; et al. A Clean Air Plan for Sydney: An Overview of the Special Issue on Air Quality in New South Wales. Atmosphere 2019, 10, 774. [Google Scholar] [CrossRef]
  7. Popek, R.; Fornal-Pieniak, B.; Dąbrowski, P.; Chyliński, F. The Role of Spontaneous Flora in the Mitigation of Particulate Matter from Traffic Roads in an Urbanised Area. Sustainability 2023, 15, 7568. [Google Scholar] [CrossRef]
  8. Du, W.C.; Xia, X.H. How Does Urbanization Affect GHG Emissions? A Cross-Country Panel Threshold Data Analysis. Appl. Energy 2018, 229, 872–883. [Google Scholar] [CrossRef]
  9. Lai, D.; Zhou, C.; Huang, J.; Jiang, Y.; Long, Z.; Chen, Q. Outdoor Space Quality: A Field Study in an Urban Residential Community in Central China. Energy Build. 2014, 68, 713–720. [Google Scholar] [CrossRef]
  10. Candas, V.; Dufour, A. Thermal Comfort: Multisensory Interactions? J. Physiol. Anthr. Appl. Hum. Sci. 2005, 24, 33–36. [Google Scholar] [CrossRef]
  11. Pellerin, N.; Candas, V. Effects of Steady-State Noise and Temperature Conditions on Environmental Perception and Acceptability. Indoor Air 2004, 14, 129–136. [Google Scholar] [CrossRef] [PubMed]
  12. Nikolopoulou, M.; Baker, N.; Steemers, K. Thermal Comfort in Outdoor Urban Spaces: Understanding the Human Parameter. Sol. Energy 2001, 70, 227–235. [Google Scholar] [CrossRef]
  13. Nagano, K.; Horikoshi, T. New Comfort Index during Combined Conditions of Moderate Low Ambient Temperature and Traffic Noise. Energy Build. 2005, 37, 287–294. [Google Scholar] [CrossRef]
  14. Yin, Y.; Zhang, D.; Zhen, M.; Jing, W.; Luo, W.; Feng, W. Combined Effects of the Thermal-Acoustic Environment on Subjective Evaluations in Outdoor Public Spaces. Sustain. Cities Soc. 2022, 77, 103522. [Google Scholar] [CrossRef]
  15. Tiller, D.K.; Wang, L.M.; Musser, A.; Radik, M.J. Combined Effects of Noise and Temperature on Human Comfort and Performance: 2010 ASHRAE Annual Conference. ASHRAE Trans. 2010, 116, 522–540. [Google Scholar]
  16. Lam, C.K.C.; Yang, H.; Yang, X.; Liu, J.; Ou, C.; Cui, S.; Kong, X.; Hang, J. Cross-Modal Effects of Thermal and Visual Conditions on Outdoor Thermal and Visual Comfort Perception. Build. Environ. 2020, 186, 107297. [Google Scholar] [CrossRef]
  17. Kang, J.; Yang, W. Soundscape in Urban Open Public Spaces. World Archit. 2002, 144, 76–79. [Google Scholar]
  18. Yu, L.; Kang, J. Modeling Subjective Evaluation of Soundscape Quality in Urban Open Spaces: An Artificial Neural Network Approach. J. Acoust. Soc. Am. 2009, 126, 1163–1174. [Google Scholar] [CrossRef]
  19. Yang, W.; Kang, J. Acoustic Comfort Evaluation in Urban Open Public Spaces. Appl. Acoust. 2005, 66, 211–229. [Google Scholar] [CrossRef]
  20. Guan, H.; Hu, S.; Lu, M.; He, M.; Mao, Z.; Liu, G. People’s Subjective and Physiological Responses to the Combined Thermal-Acoustic Environments. Build. Environ. 2020, 172, 106709. [Google Scholar] [CrossRef]
  21. Zhou, Z.; Ye, X.; Chen, J.; Fan, X.; Kang, J. Effect of Visual Landscape Factors on Soundscape Evaluation in Old Residential Areas. Appl. Acoust. 2024, 215, 109708. [Google Scholar] [CrossRef]
  22. Li, K.; Liu, M. Combined Influence of Multi-Sensory Comfort in Winter Open Spaces and Its Association with Environmental Factors: Wuhan as a Case Study. Build. Environ. 2024, 248, 111037. [Google Scholar] [CrossRef]
  23. Grahn, P.; Stigsdotter, U.K. The Relation between Perceived Sensory Dimensions of Urban Green Space and Stress Restoration. Landsc. Urban Plan. 2010, 94, 264–275. [Google Scholar] [CrossRef]
  24. Polat, A.T.; Akay, A. Relationships between the Visual Preferences of Urban Recreation Area Users and Various Landscape Design Elements. Urban For. Urban Green. 2015, 14, 573–582. [Google Scholar] [CrossRef]
  25. Yang, W.; Moon, H.J. Cross-Modal Effects of Illuminance and Room Temperature on Indoor Environmental Perception. Build. Environ. 2018, 146, 280–288. [Google Scholar] [CrossRef]
  26. Chen, T.; Pan, H.; Lu, M.; Hang, J.; Lam, C.K.C.; Yuan, C.; Pearlmutter, D. Effects of Tree Plantings and Aspect Ratios on Pedestrian Visual and Thermal Comfort Using Scaled Outdoor Experiments. Sci. Total. Environ. 2021, 801, 149527. [Google Scholar] [CrossRef] [PubMed]
  27. Samira, L.; Abdou, S.; Reiter, S. Effect of Vegetation Cover on Thermal and Visual Comfort of Pedestrians in Urban Spaces in Hot and Dry Climate. Nat. Technol. 2017, 17, 30–42. [Google Scholar]
  28. Rosso, F.; Pisello, A.L.; Cotana, F.; Ferrero, M. On the Thermal and Visual Pedestrians’ Perception about Cool Natural Stones for Urban Paving: A Field Survey in Summer Conditions. Build. Environ. 2016, 107, 198–214. [Google Scholar] [CrossRef]
  29. Astolfi, A.; Corgnati, S.P.; Verso, V.L. Environmental Comfort in University Classrooms—Thermal, Acoustic, Visual and Air Quality Aspects. Research in Building Physics; CRC Press: Boca Raton, FL, USA, 2020. [Google Scholar]
  30. Ricciardi, P.; Buratti, C. Environmental Quality of University Classrooms: Subjective and Objective Evaluation of the Thermal, Acoustic, and Lighting Comfort Conditions. Build. Environ. 2018, 127, 23–36. [Google Scholar] [CrossRef]
  31. Wu, H.; Sun, X.; Wu, Y. Investigation of the Relationships between Thermal, Acoustic, Illuminous Environments and Human Perceptions. J. Build. Eng. 2020, 32, 101839. [Google Scholar] [CrossRef]
  32. Du, M.; Hong, B.-K.; Gu, C.; Li, Y.; Wang, Y. Multiple Effects of Visual-Acoustic-Thermal Perceptions on the Overall Comfort of Elderly Adults in Residential Outdoor Environments. Energy Build. 2023, 283, 112813. [Google Scholar] [CrossRef]
  33. Echevarria Sanchez, G.M.; Van Renterghem, T.; Sun, K.; De Coensel, B.; Botteldooren, D. Using Virtual Reality for Assessing the Role of Noise in the Audio-Visual Design of an Urban Public Space. Landsc. Urban Plan. 2017, 167, 98–107. [Google Scholar] [CrossRef]
  34. Li, Z.; Ba, M.; Kang, J. Physiological Indicators and Subjective Restorativeness with Audio-Visual Interactions in Urban Soundscapes. Sustain. Cities Soc. 2021, 75, 103360. [Google Scholar] [CrossRef]
  35. Liu, J.; Kang, J.; Luo, T.; Behm, H. Landscape Effects on Soundscape Experience in City Parks. Sci. Total Environ. 2013, 454–455, 474–481. [Google Scholar] [CrossRef]
  36. Van Renterghem, T.; Botteldooren, D. View on Outdoor Vegetation Reduces Noise Annoyance for Dwellers near Busy Roads. Landsc. Urban Plan. 2016, 148, 203–215. [Google Scholar] [CrossRef]
  37. Jeon, J.Y.; Lee, P.J.; Hong, J.Y.; Cabrera, D. Non-Auditory Factors Affecting Urban Soundscape Evaluation. J. Acoust. Soc. Am. 2011, 130, 3761–3770. [Google Scholar] [CrossRef]
  38. Nitidara, N.P.A.; Sarwono, J.; Suprijanto, S.; Soelami, F.X.N. The Multisensory Interaction between Auditory, Visual, and Thermal to the Overall Comfort in Public Open Space: A Study in a Tropical Climate. Sustain. Cities Soc. 2022, 78, 103622. [Google Scholar] [CrossRef]
  39. Kang, J.; Aletta, F.; Gjestland, T.T.; Brown, L.A.; Botteldooren, D.; Schulte-Fortkamp, B.; Lercher, P.; van Kamp, I.; Genuit, K.; Fiebig, A.; et al. Ten Questions on the Soundscapes of the Built Environment. Build. Environ. 2016, 108, 284–294. [Google Scholar] [CrossRef]
  40. Te Kulve, M.; Schlangen, L.; van Marken Lichtenbelt, W. Interactions between the Perception of Light and Temperature. Indoor Air 2018, 28, 881–891. [Google Scholar] [CrossRef] [PubMed]
  41. Haldi, F.; Robinson, D. On the Unification of Thermal Perception and Adaptive Actions. Build. Environ. 2010, 45, 2440–2457. [Google Scholar] [CrossRef]
  42. Li, D.; Sullivan, W.C. Impact of Views to School Landscapes on Recovery from Stress and Mental Fatigue. Landsc. Urban Plan. 2016, 148, 149–158. [Google Scholar] [CrossRef]
  43. Zijlema, W.L.; Triguero-Mas, M.; Smith, G.; Cirach, M.; Martinez, D.; Dadvand, P.; Gascon, M.; Jones, M.; Gidlow, C.; Hurst, G.; et al. The Relationship between Natural Outdoor Environments and Cognitive Functioning and Its Mediators. Environ. Res. 2017, 155, 268–275. [Google Scholar] [CrossRef] [PubMed]
  44. Eslamirad, N.; Sepúlveda, A.; De Luca, F.; Sakari Lylykangas, K. Evaluating Outdoor Thermal Comfort Using a Mixed-Method to Improve the Environmental Quality of a University Campus. Energies 2022, 15, 1577. [Google Scholar] [CrossRef]
  45. Chen, H.; Hong, B.; Qu, H.; Geng, Y.; Su, M. Effects of Acoustic Perception on Outdoor Thermal Comfort in Campus Open Spaces in China’s Cold Region. Buildings 2022, 12, 1518. [Google Scholar] [CrossRef]
  46. Wang, X.; Chen, Z.; Ma, D.; Zhou, T.; Chen, J.; Jiang, X. Relationship between Visual and Thermal Comfort and Electrodermal Activity in Campus Blue–Green Spaces: A Case Study of Guangzhou, China. Sustainability 2023, 15, 11742. [Google Scholar] [CrossRef]
  47. Zhen, M.; Chen, Z.; Zou, Q. Combined Effects of Thermal and Acoustic Environments on Outdoor Human Comfort in University Campus. Urban Clim. 2023, 49, 101566. [Google Scholar] [CrossRef]
  48. Tao, Y.; Lau, S.S.Y.; Gou, Z.; Zhang, J.; Tablada, A. An Investigation of Semi-Outdoor Learning Spaces in the Tropics: Spatial Settings, Thermal Environments and User Perceptions. Indoor Built Environ. 2019, 28, 1368–1382. [Google Scholar] [CrossRef]
  49. Geng, Y.; Hong, B.; Du, M.; Yuan, T.; Wang, Y. Combined Effects of Visual-Acoustic-Thermal Comfort in Campus Open Spaces: A Pilot Study in China’s Cold Region. Build. Environ. 2022, 209, 108658. [Google Scholar] [CrossRef]
  50. Dong, W.; Wu, J.; Chen, Y.; Zhou, X. A Bibliometric Review of Research on the Perceptions of Campus Public Spaces. Buildings 2023, 13, 501. [Google Scholar] [CrossRef]
  51. GB50178-93; Standard of Climatic Regionalization for Architecture. Ministry of Construction of the People’s Republic of China: Beijing, China, 1994; pp. 57–61.
  52. Wen, X.; Zhu, Y.; Dong, J.; Wang, M.; Dong, J. Effects of Soundscape on Emotion and Attention on Campus Green Space—A Case Study of Fujian Agriculture and Forestry University. Chin. Landsc. Archit. 2021, 37, 88–93. [Google Scholar] [CrossRef]
  53. Sun, C.-Y. A Street Thermal Environment Study in Summer by the Mobile Transect Technique. Theor. Appl. Clim. 2011, 106, 433–442. [Google Scholar] [CrossRef]
  54. Xie, Z.; Wang, H.; Zheng, Q.; Lin, W.; Wu, Q. Pollution Characteristics of Airborne Particles in Fuzhou City in 2015. Res. Environ. Sci. 2017, 30, 864–873. [Google Scholar] [CrossRef]
  55. Zhang, L.; Wei, D.; Hou, Y.; Du, J.; Liu, Z.; Zhang, G.; Shi, L. Outdoor Thermal Comfort of Urban Park—A Case Study. Sustainability 2020, 12, 1961. [Google Scholar] [CrossRef]
  56. Lin, J.; Chen, S.; Yang, J.; Li, Z. Research on Summer Outdoor Thermal Comfort Based on COMFA Model in an Urban Park of Fuzhou, China. Theor. Appl. Clim. 2024, 155, 2311–2322. [Google Scholar] [CrossRef]
  57. Axelsson, Ã.; Nilsson, M.E.; Berglund, B. The Swedish Soundscape-Quality Protocol. J. Acoust. Soc. Am. 2012, 131, 3476. [Google Scholar] [CrossRef]
  58. ASHRAE Standard 55; Thermal Environmental Conditions for Human Occupancy. ANSI/ASHRAE Standard: Atlanta, GA, USA, 2017.
  59. ISO 7726:1998; Thermal Environment-Instruments and Method for Measuring Physical Quantities. ISO: Geneva, Switzerland, 1998.
  60. ISO 10551:2019; Ergonomics of the Physical Environment—Subjective Judgement Scales for Assessing Physical Environments. ISO: Geneva, Switzerland, 2019.
  61. Jendritzky, G.; de Dear, R.; Havenith, G. UTCI—Why Another Thermal Index? Int. J. Biometeorol. 2012, 56, 421–428. [Google Scholar] [CrossRef] [PubMed]
  62. Li, J.; Liu, N. The Perception, Optimization Strategies and Prospects of Outdoor Thermal Comfort in China: A Review. Build. Environ. 2020, 170, 106614. [Google Scholar] [CrossRef]
  63. Fang, Z.; Lin, Z.; Mak, C.M.; Niu, J.; Tse, K.T. Investigation into Sensitivities of Factors in Outdoor Thermal Comfort Indices. Build. Environ. 2018, 128, 129–142. [Google Scholar] [CrossRef]
  64. Pantavou, K.; Theoharatos, G.; Santamouris, M.; Asimakopoulos, D. Outdoor Thermal Sensation of Pedestrians in a Mediterranean Climate and a Comparison with UTCI. Build. Environ. 2013, 66, 82–95. [Google Scholar] [CrossRef]
  65. ISO 7730:2005(En); Ergonomics of the Thermal Environment—Analytical Determination and Interpretation of Thermal Comfort Using Calculation of the PMV and PPD Indices and Local Thermal Comfort Criteria. ISO: Geneva, Switzerland, 2005.
  66. Cheung, P.K.; Jim, C.Y. Determination and Application of Outdoor Thermal Benchmarks. Build. Environ. 2017, 123, 333–350. [Google Scholar] [CrossRef]
  67. Lai, D.; Guo, D.; Hou, Y.; Lin, C.; Chen, Q. Studies of Outdoor Thermal Comfort in Northern China. Build. Environ. 2014, 77, 110–118. [Google Scholar] [CrossRef]
  68. Thimijan, R.W.; Heins, R.D. Photometric, Radiometric, and Quantum Light Units of Measure: A Review of Procedures for Interconversion. Hortscience 1983, 18, 818–822. [Google Scholar] [CrossRef]
  69. Zhang, M.; Kang, J. Towards the Evaluation, Description, and Creation of Soundscapes in Urban Open Spaces. Environ. Plann. B 2007, 34, 68–86. [Google Scholar] [CrossRef]
  70. Nikolopoulou, M.; Steemers, K. Thermal Comfort and Psychological Adaptation as a Guide for Designing Urban Spaces. Energy Build. 2003, 35, 95–101. [Google Scholar] [CrossRef]
  71. Zhang, L. Study on The Effects of Thermal And Acoustic on Human Comfort. Master’s Thesis, Qingdao University of Technology, Qingdao, China, 2017. [Google Scholar] [CrossRef]
  72. Brambilla, G.; Maffei, L.; Di Gabriele, M.; Gallo, V. Merging Physical Parameters and Laboratory Subjective Ratings for the Soundscape Assessment of Urban Squares. J. Acoust. Soc. Am. 2013, 134, 782–790. [Google Scholar] [CrossRef] [PubMed]
  73. Lin, D.; Li, T.; Chen, Z.; Li, L. Effects of Interactions between Thermal and Acoustic Environments on Subjective Comfort Evaluations in Outdoor Public Spaces. J. Asian Archit. Build. Eng. 2023, 1–16. [Google Scholar] [CrossRef]
  74. Jin, Y.; Jin, H.; Kang, J. Combined Effects of the Thermal-Acoustic Environment on Subjective Evaluations in Urban Squares. Build. Environ. 2020, 168, 106517. [Google Scholar] [CrossRef]
  75. Wu, Y.; Meng, Q.; Li, L.; Mu, J. Interaction between Sound and Thermal Influences on Patient Comfort in the Hospitals of China’s Northern Heating Region. Appl. Sci. 2019, 9, 5551. [Google Scholar] [CrossRef]
  76. Sharmin, T.; Steemers, K. Effects of Microclimate and Human Parameters on Outdoor Thermal Sensation in the High-Density Tropical Context of Dhaka. Int. J. Biometeorol. 2018, 64, 187–203. [Google Scholar] [CrossRef]
  77. Chinazzo, G.; Wienold, J.; Andersen, M. Effect of Indoor Temperature and Glazing with Saturated Color on Visual Perception of Daylight. LEUKOS 2021, 17, 183–204. [Google Scholar] [CrossRef]
  78. Laurentin, C.; Bermtto, V.; Fontoynont, M. Effect of Thermal Conditions and Light Source Type on Visual Comfort Appraisal. Light. Res. Technol. 2000, 32, 223–233. [Google Scholar] [CrossRef]
  79. Torresin, S.; Pernigotto, G.; Cappelletti, F.; Gasparella, A. Combined Effects of Environmental Factors on Human Perception and Objective Performance: A Review of Experimental Laboratory Works. Indoor Air 2018, 28, 525–538. [Google Scholar] [CrossRef] [PubMed]
  80. Chinazzo, G.; Wienold, J.; Andersen, M. Daylight Affects Human Thermal Perception. Sci. Rep. 2019, 9, 13690. [Google Scholar] [CrossRef] [PubMed]
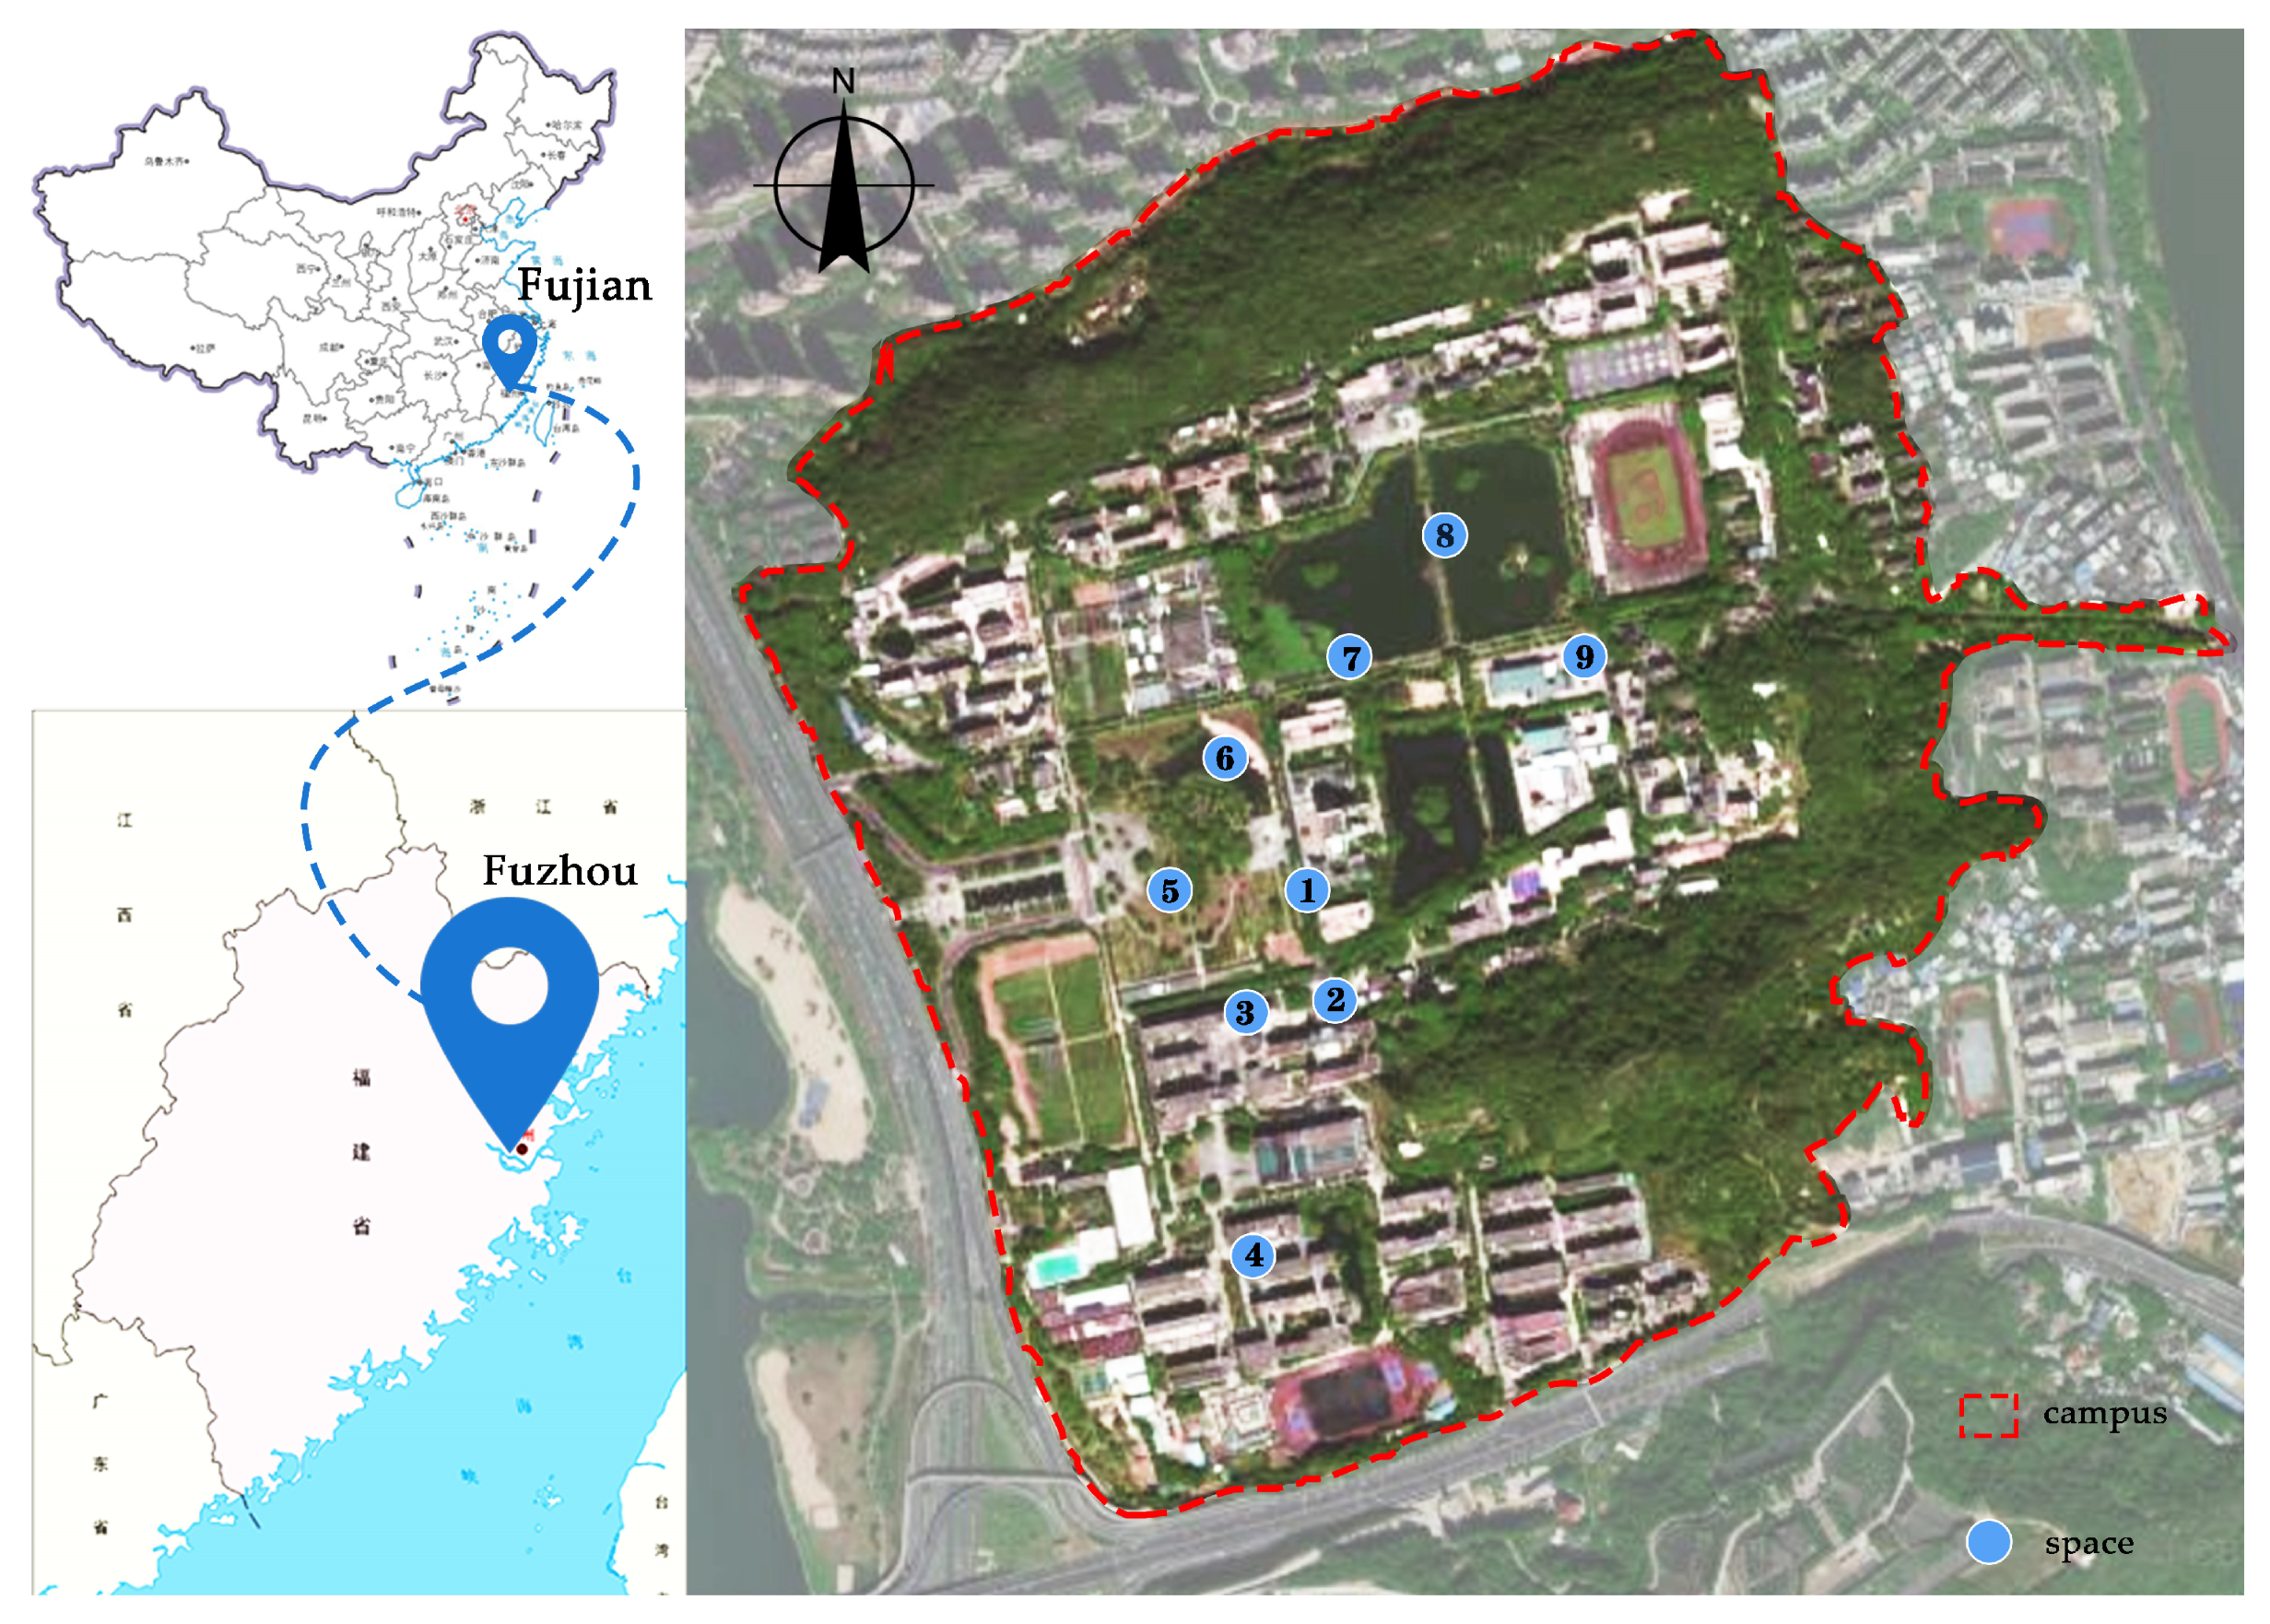
Figure 1. Location of the test site and various open spaces.
Forests 15 00876 g001
Figure 2. Basic information about the volunteers.
Forests 15 00876 g002
Figure 3. A post hoc Tukey’s test for different pairs of measurement points for the meteorological variables. (a) Global radiation (G)’s Tukey test results; (b) globe temperature (Tg)’s Tukey test results; (c) illuminance intensity(lux)’s Tukey test results; (d) air temperature (Ta)’s Tukey test results; (e) wind speed (Va)’s Tukey test results; (f) relative humidity (RH)’s Tukey test results. Different lowercase letters indicate significant differences among spaces (p < 0.05).
Forests 15 00876 g003aForests 15 00876 g003b
Figure 4. Distribution of Thermal Sensation Vote (TSV) (a) and Thermal Comfort Vote (TCV) (b) under different sound types (STPs).
Forests 15 00876 g004
Figure 5. Distribution of Thermal Sensation Vote (TSV) (a) and Thermal Comfort Vote (TCV) (b) at different illuminance intensity (LUX) classes.
Forests 15 00876 g005
Figure 6. Universal Thermal Climate Index (UTCI) (a) and illuminance intensity (LUX) (b) under different sound types (STPs).
Forests 15 00876 g006
Figure 7. Relationship between Thermal Sensation Vote (TSV) and Universal Thermal Climate Index (UTCI) (a), Thermal Comfort Vote (TCV) and Universal Thermal Climate Index (UTCI) (b) among sound types (STPs).
Forests 15 00876 g007
Figure 8. Relationship between Thermal Sensation Vote (TSV) and Universal Thermal Climate Index (UTCI) (a), and Thermal Comfort Vote (TCV) and Universal Thermal Climate Index (UTCI) (b) among Acoustic Comfort Vote (ACV) levels.
Forests 15 00876 g008
Figure 9. Relationship between mean Acoustic Sensation Vote (ASV) and sound types (STPs) (a), and Acoustic Comfort Vote (ACV) and sound types (STPs) (b) among Universal Thermal Climate Index (UTCI) classes.
Forests 15 00876 g009
Figure 10. Relationship between mean Acoustic Sensation Vote (ASV) and sound type (STP) (a), and Acoustic Comfort Vote (ACV) and sound type (STP) (b) among Thermal Comfort Vote (TCV) levels.
Forests 15 00876 g010
Figure 11. Relationship between Thermal Sensation Vote (TSV) and Universal Thermal Climate Index (UTCI) (a), and Thermal Comfort Vote (TCV) and Universal Thermal Climate Index (UTCI) (b) among illuminance intensity (LUX) levels.
Forests 15 00876 g011
Figure 12. Relationship between Thermal Sensation Vote (TSV) and Universal Thermal Climate Index (UTCI) (a), and Thermal Comfort Vote (TCV) and Universal Thermal Climate Index (UTCI) (b) among Visual Comfort Vote (VCV) levels.
Forests 15 00876 g012
Figure 13. Relationship between Sunlight Sensation Vote (SSV) and illuminance intensity (LUX) (a), and Visual Comfort Vote (VCV) and illuminance intensity (LUX) (b) among Universal Thermal Climate Index (UTCI) classes.
Forests 15 00876 g013
Figure 14. Relationship between Sunlight Sensation Vote (SSV) and illuminance intensity (LUX) (a), and Visual Comfort Vote (VCV) and illuminance intensity (LUX) (b) among Thermal Comfort Vote (TCV) levels.
Forests 15 00876 g014
Table 1. Environmental Characteristics of the Nine Open Spaces.
SpaceSVFFisheye PhotoCharacteristics
S10.240Forests 15 00876 i001The site is located under the campus administration building and is the leading traffic path for students to attend classes. The banyan tree serves as a street tree and provides shade all year round, creating a more enclosed space.
S20.370Forests 15 00876 i002The Innovation Building atrium is located under the main academic buildings on campus, connected by a footbridge to form a grey space underneath. It is predominantly hard-paved, with a green belt of shrubs planted around the building. It is a staging plaza for students to go to and from classes.
S30.453Forests 15 00876 i003The site is located in front of the Tian Jia Bing teaching building to the north and west, is surrounded by no greenery, and is dominated by a large amount of hard paving, which, unlike S2, is not sheltered at the top of the site.
S40.396Forests 15 00876 i004The site is located in the open space of the Chengzhi building complex. Tall school buildings block the east and west sides. There is a pavilion in the green space, and the surrounding area is planted with cherry blossoms, purple leaf plums, large-flowered violets, other flowering trees, rhododendrons, grey spaces, and other shrubs, which have a good landscape effect.
S50.848Forests 15 00876 i005The site is located on the open lawn of the campus Zhonghua Garden. It is surrounded by no building shelter and is planted with trees such as Sapindales, golden treasure trees, Camphor trees, etc. It is a place for students to rest, play, and communicate with each other.
S60.245Forests 15 00876 i006The site is located in the interior of the Zhonghua Garden, surrounded by running water; evergreen trees and deciduous trees are planted together, and the ground is grass, which creates a good landscape effect, and it is a place for students to take a walk for leisure and study by memorizing books.
S70.330Forests 15 00876 i007The site is located on Jinshan Road, south of Guanyin Lake, and is lined with plantings of white orchids, which partially block the view of the school building to the south. Permeable pavers dominate the sidewalk and are the main traffic path for the school.
S80.526Forests 15 00876 i008The site is located inside the Zhonghua Garden, surrounded by running water. Evergreen and deciduous trees are planted together to form a good landscape effect. This is a place for students to take a walk, relax, and study by memorizing books.
S90.699Forests 15 00876 i009The site is located in Topping Square, with the main building, the Great Hall, to the west. Unobstructed on three sides, with a representative sculpture in the center of the square, it is one of the school’s leading event venues.
Table 2. Instrument information.
InstrumentParametersRangePrecision
HOBO S-THC-M002Air temperature; relative humidity−40~+75 °C; 0%~100%±0.25 °C; ±2.5%
HOBO S-WCF-M003Wind speed0~76 m/s±1.1 m/s
HOBO S-LIB-M003Global radiation0~1280 W/m2±10 W/m2
TA632A/BIllumination intensity0.1~200,000 LUX±(3% + 5 LUX)
JT2011Globe temperature0~120 °C±0.5 °C
Table 3. Tests of chi-square independence for thermal, acoustic, and visual indicators.
X2dfSig.
Thermal Sensation VoteAcoustic Sensation Vote65.495360.000 *
Acoustic Comfort Vote70.275240.000 *
Sunlight Sensation Vote133.965360.000 *
Visual Comfort Vote52.598240.000 *
Thermal Comfort VoteAcoustic Sensation Vote96.515240.000 *
Acoustic Comfort Vote305.340160.000 *
Sunlight Sensation Vote35.999240.000 *
Visual Comfort Vote256.918160.000 *
Acoustic Sensation VoteSunlight Sensation Vote44.521240.010
Visual Comfort Vote47.523160.000 *
Acoustic Comfort VoteSunlight Sensation Vote27.059240.233
Visual Comfort Vote201.912160.000 *
* significant at the 0.05 level.
Disclaimer/Publisher’s Note: The statements, opinions and data contained in all publications are solely those of the individual author(s) and contributor(s) and not of MDPI and/or the editor(s). MDPI and/or the editor(s) disclaim responsibility for any injury to people or property resulting from any ideas, methods, instructions or products referred to in the content.