Article

Assessing Carbon Sequestration Potential in State-Owned Plantation Forests in China and Exploring Feasibility for Carbon Offset Projects

1
Forest Carbon Research Lab, Faculty of Forestry, The University of British Columbia, 2424 Main Mall, Vancouver, BC V6T 1Z4, Canada
2
Faculty of Agriculture and Food Sciences, The University of Queensland, Brisbane, QLD 4072, Australia
3
Key Laboratory of Carbon Cycling in Forest Ecosystems and Carbon Sequestration, Zhejiang A&F University, Hangzhou 311300, China
*
Author to whom correspondence should be addressed.
Forests 2024, 15(5), 886; https://doi.org/10.3390/f15050886
Submission received: 21 April 2024 / Revised: 9 May 2024 / Accepted: 16 May 2024 / Published: 20 May 2024
(This article belongs to the Section Forest Ecology and Management)

Abstract

:
In the pursuit of carbon neutrality, state-owned forests are prime candidates for carbon offset projects due to their unique tenure and management characteristics. Employing methodologies endorsed by the International Panel on Climate Change and logistic growth curves, this study assesses the carbon stocks and sequestration potential of established state-owned plantation forests across 31 Chinese provinces from 2023 to 2060, encompassing seven forestry industry groups. This study projects that by 2060, these forests will amass a carbon stock of 558.25 MtC, with the highest stock in Northeast China (122.09 MtC) and the lowest in Northwest China (32.27 MtC), notably showing the highest growth rate at 91.15%. Over the forecast period, they are expected to accumulate a carbon sink of 637.07 MtCO2e, translating to an average annual carbon sink of 17.22 MtCO2e and an average annual carbon sink per unit of 1.41 tons of CO2 per hectare per year. Additionally, state-owned forests have the potential to offset approximately 0.15%–0.17% of annual carbon emissions, aligning with international climate goals. However, it is essential to note that the conversion of these carbon sinks into tradable carbon credits is subject to specific methodology requirements. Therefore, the future development of carbon offset projects in China’s state-owned forests should consider the advancement of carbon market mechanisms, including the Chinese Certified Emission Reduction and the introduction of a carbon inclusion mechanism and natural forest methodology, to fully realize their potential contributions to carbon neutrality. In summary, these findings offer valuable insights for shaping the future of carbon offset initiatives within China’s state-owned forests.

1. Introduction

In the context of global climate change, forest carbon offset potential has gained increasing recognition worldwide as a significant approach to reducing greenhouse gas emissions and accomplishing Nationally Determined Contributions (NDCs) [1]. Forest carbon offset projects, supported by financial mechanisms in carbon markets, serve as an ecological compensation strategy by assigning a monetary value to the carbon stored in forests, thereby generating tradeable assets known as carbon credits. These credits are a means to offset the carbon footprint of businesses and individuals. It is important to note that while forests often contain significant biomass, the generation of carbon credits primarily relies on the addition of carbon sequestration beyond a predetermined baseline, such as forest preservation and improved forest management that provide additional carbon sequestration benefits relative to a business-as-usual scenario [2,3,4]. As per available data [5], the issuance of forestry carbon credits within the international carbon market experienced consistent growth, averaging an annual increase of 64% from 2010 to 2015.
As the world’s largest emitter of carbon dioxide [6], China has mentioned in its 2022 NDC goal that it intends to integrate forest carbon sinks into its national carbon offset mechanism [7]. However, not all projected forest carbon sinks can be converted into carbon credits. The development of a carbon offset project typically involves identifying forest land tenure and meeting the methodological criteria of the carbon offset mechanism. This includes fulfilling relevant conditions and demonstrating additionality, among other requirements. In addition, forestry carbon offset projects are typically more applicable to large and medium-sized forest farms [8], while after the current restart of China’s Certified Emission Reduction (CCER) mechanism, forestry carbon offset projects are all of the plantation type [9]. As a result, governments and developers prioritize state-owned plantation forests. These forests are preferred due to their well-defined ownership and the relatively straightforward process of proving additionality. Therefore, it is essential to accurately assess the current condition of state plantation resources and predict their carbon sink potential.
Numerous well-established methods have been established to assess forest biomass carbon stock. Sharp et al. were the first to calculate forest biomass in North Carolina, USA, using an average biomass expansion factor [10]. However, forest biomass is not constant; rather, it varies with forest age, site class, and stand density, and thus this calculation underestimates biomass in younger stands and overestimates biomass in older stands [11,12,13,14,15,16,17,18]. Following this, with the continuous improvement of science and technology, many new methods have improved the aforementioned limitations. Xu et al. used the continuous biomass expansion factor method and logistic growth curves to predict the carbon sequestration capacity of China’s forests from 2000 to 2050 [19]. This method first determines the stock density based on the area and volume data of each forest age group, then calculates the biomass density using the continuous biomass conversion factor, and subsequently predicts the future carbon stock by fitting the relationship between biomass density and forest age. He et al. employed secondary succession theory and sample plot data to estimate carbon sinks for the period between 2010 and 2050 [20]. Qiu et al. assessed China’s forest carbon stocks from 2003 to 2050 based on national forest inventory data from 2003, 3008, and 2013, as well as data from 7801 sample plots, using a variety of quantitative models, such as the breast diameter equation [21]. In addition, the International Panel on Climate Change (IPCC) method, the allometric growth equation, and remote sensing are commonly used to assess forest carbon sequestration. The anisotropic growth equation refers to the construction of a biomass equation based on the relationship between the diameter at the breast height of a forest tree and its height. The remote sensing method is a relatively new technique, and numerous studies have established strong correlations between parameters derived from remote sensing and above-ground biomass [22]. However, this method cannot effectively distinguish between forest land tenure and stand origin. The internationally used IPCC method can quickly and easily predict the carbon pools of above-ground biomass, below-ground biomass, dead wood biomass, and deadfall biomass based on default values, stock density data from national databases, and wood density data from greenhouse gas inventories.
Due to the review of previous studies and the quantification methods of forest carbon sinks in China, it is apparent that current research primarily focuses on quantifying the carbon sinks at the ecological level and determining how much carbon emissions can be neutralized. Given the extensive research and diverse methodologies applied to quantify forest carbon sinks in China, it is evident that most studies focus on ecological-level carbon quantification and its potential to neutralize carbon emissions. These studies encompass all natural and planted forests and do not specifically quantify forest stands that could be developed for forestry carbon offset projects. Therefore, considering the importance of state-owned forests in carbon offset projects in China, a quantitative study is necessary. To fill the gaps in existing research, we used the IPCC method with a logistic model to predict the carbon sequestration potential of four carbon pools in state-owned plantation forests across 31 provinces in China, including seven Forest Industry Groups (FIGs), but excluding Hong Kong, Macao, and Taiwan. The main objectives of this study are (1) to quantify the carbon sink potential and average annual carbon sequestration of existing state-owned plantation forests, thereby providing data support for project feasibility reports and project design documents; (2) to analyze the carbon offsetting capacity of the existing state-owned plantation forests; and (3) to propose a strategy for the development of China’s future forestry carbon offsetting projects, informed by our study’s findings.

2. Materials and Methods

2.1. Study Area

The research area is mainland China, a vast country whose climate is influenced by monsoon winds and exhibits significant continental and oceanic characteristics, resulting in a diverse array of climate types. The terrain varies dramatically from high in the west to low in the east, encompassing mountains, plateaus, plains, basins, and hills. Consequently, this diverse geography supports a wide variety of vegetation types.
Our study covers 31 provinces in China, including seven important FIGs, excluding Hong Kong, Macau, and Taiwan. We divided the 31 provinces into North, South, Northwest, Southwest, East, Northeast, and Central China based on geographic and climatic factors. North China includes Inner Mongolia, Hebei, Shanxi, Beijing, and Tianjin; South China includes Hainan, Guangdong, and Guangxi; Northwest China includes Shaanxi, Qinghai, Xinjiang, Gansu, and Ningxia; Southwest China includes Yunnan, Xizang, Guizhou, Chongqing, and Sichuan; East China includes Shanghai, Shandong, Jiangsu, Anhui, Zhejiang, and Fujian; Northeast China includes Jilin, Heilongjiang, and Liaoning; Central China includes Henan, Hubei, Hunan, and Jiangxi.

2.2. Above-Ground Biomass Carbon Pool

In this paper, we use the IPCC biomass method [23] to calculate the above-ground biomass carbon stock following Equation (1):
S A G B = j = 1 m k = 1 u A G B j k · C F j k = j = 1 m k = 1 u A R j k · F S V j k · S V D j k · B E F j k · C F j k
where S A G B is the above-ground carbon stock of the arboreal forest (t C); A G B j k is the above-ground biomass of tree species j at the kth age group (t d.m.·hm−2); A R j k is the area of tree species j at the kth age group (ha); S V D j k is the basic wood density of tree species j at the kth age group (t d.m.m−3); B E F j k is the biomass expansion factor of the kth age group of tree species j (t d.m.m−3); C F j k is the carbon content of tree species j at the kth age group (t C·(t d.m.) −1); and F S V j k is the forest stock volume per unit area of tree species j at the kth age group (t d.m.·hm−2).

2.3. Below-Ground Biomass Carbon Pool

We use the ratio of below-ground biomass to above-ground biomass [23] to calculate the below-ground biomass carbon stock as follows:
S B G B = j = 1 m k = 1 u S A G B _ j k · R B A j ,
where S B G B is the below-ground carbon stock of the arboreal forest (t C); S A G B _ j k is the above-ground biomass carbon stock of tree species j at the kth age group (t d.m.·hm−2); and R B A j is the average ratio of the below-ground biomass to above-ground biomass for tree species j, dimensionless.

2.4. Dead Wood Biomass Carbon Pool

We employ the IPCC default value method [23] to calculate the dead wood carbon stock following Equation (3):
S D W = j = 1 m k = 1 u A G B j k · D R D W · C F D W ,
where S D W is the dead wood carbon stock of the arboreal forest (t C); A G B j k is the above-ground biomass carbon stock of tree species j at the kth age group (t d.m.·hm−2); D R D W is the ratio of the default value of dead wood biomass to above-ground biomass, dimensionless; and C F D W is the carbon content of dead wood, dimensionless.

2.5. Deadfall Biomass Carbon Pool

We use the IPCC default value method [23] to calculate the deadfall carbon stock as follows:
S D F = j = 1 m k = 1 u A G B j k · D R D F · C F D F ,
where S D F is the deadfall carbon stock of the arboreal forest (t C); A G B j k is the above-ground biomass carbon stock of tree species j at the kth age group (t d.m.·hm−2); D R D F is the ratio of the default value of deadfall biomass to above-ground biomass, dimensionless; and C F D W is the carbon content of the deadfall biomass, dimensionless.

2.6. Carbon Sequestration Potential of State-Owned Plantation Forests

2.6.1. Forest Carbon Stock Prediction

We use the growth relationship equation between forest stock volume per unit area and forest age to predict forest carbon stock [19], namely, F S V in Equation (1) is extended to Equation (5).
F S V j k = a j 1 + b j e c j ( t j k + p ) ,
where F S V j k is the forest stock volume per unit area of tree species j at the kth age group (t d.m.m−3); t j k is the median stand age of tree species j at the kth age group; p is the predicted period; and a j , b j , and c j are the relationship coefficients between the forest stock volume per unit area of tree species j and the stand age ( a j , b j , and c j are obtained by fitting the existing data of forest stock volume per unit area to the stand age, with p set as 0). The fitted parameters for each regional tree species are shown in Supplementary Data.

2.6.2. Forest Carbon Mitigation

We use the IPCC carbon stock change method to calculate the carbon sink potential of state-owned plantation forests in China as follows:
j = 1 F C S j , x z = j = 1 T S j , z T S j , x T z T x · 44 12 ,
where F C S j , x z is the carbon sink of tree species j from year x to year z; T S j , x and T S j , z are the carbon stocks of tree species j at year x and year z, respectively; T x and T z are the years x and z of the forecast period, respectively; and 44/12 is the carbon conversion factor.

2.7. Carbon Density

The carbon density is calculated using Equation (7):
S D j = j = 1 k = 1 S A G B , j , k + S B G B , j , k + S D W , j , k + S D F , j , k A R j , k ,
S D j is the carbon density of tree species j; S A G B , j , k , S B G B , j , k , S D W , j , k , and S D F , j , k are the carbon stocks of above-ground biomass carbon pool, below-ground biomass carbon pool, dead wood carbon pool and deadfall carbon pool of tree species j at the kth age group, respectively; and A R j , k is the area of tree species j at the kth age group.

2.8. Data Sources and Analysis

The data on forest stock volume per unit area of dominant tree species are obtained from the 7th to 9th National Forest Inventory dataset [24]. This dataset is non-spatial, primarily recording accumulation data from 415,000 sample plots in China. It is also categorized based on different origins and tree species. State-owned plantation forest area is sourced from the National Forest Resources Intelligent Management Platform [25]. The average ratio of below-ground biomass to above-ground biomass, wood basic density, median stand age, and biomass expansion factors are obtained from the technical regulations for continuous forest inventory [26]. Carbon content, dead wood, and deadfall default values are taken from the IPCC Good Practice Guidance for Land Use, Land-Use Change, and Forestry [23].
For the data analysis, we used MATLAB 2016b to fit the logistic growth curves for different age groups, ensuring that each curve’s R-squared value was more than 0.8. We also used adjusted R-squared and root mean square deviation to validate the accuracy of the curves.

2.9. Scenario Settings

The calculations are performed for the interval 2023–2060. The carbon sequestration potential is calculated only for existing state-owned plantation forests; carbon sinks generated by future afforestation activities are not considered, as afforestation plans in China are typically phased. Additionally, logging plans are phased as well, typically following five-year cycles. Furthermore, it is assumed that the existing forest area will remain constant throughout the prediction period, with no natural disasters, logging, or other such events.

3. Results

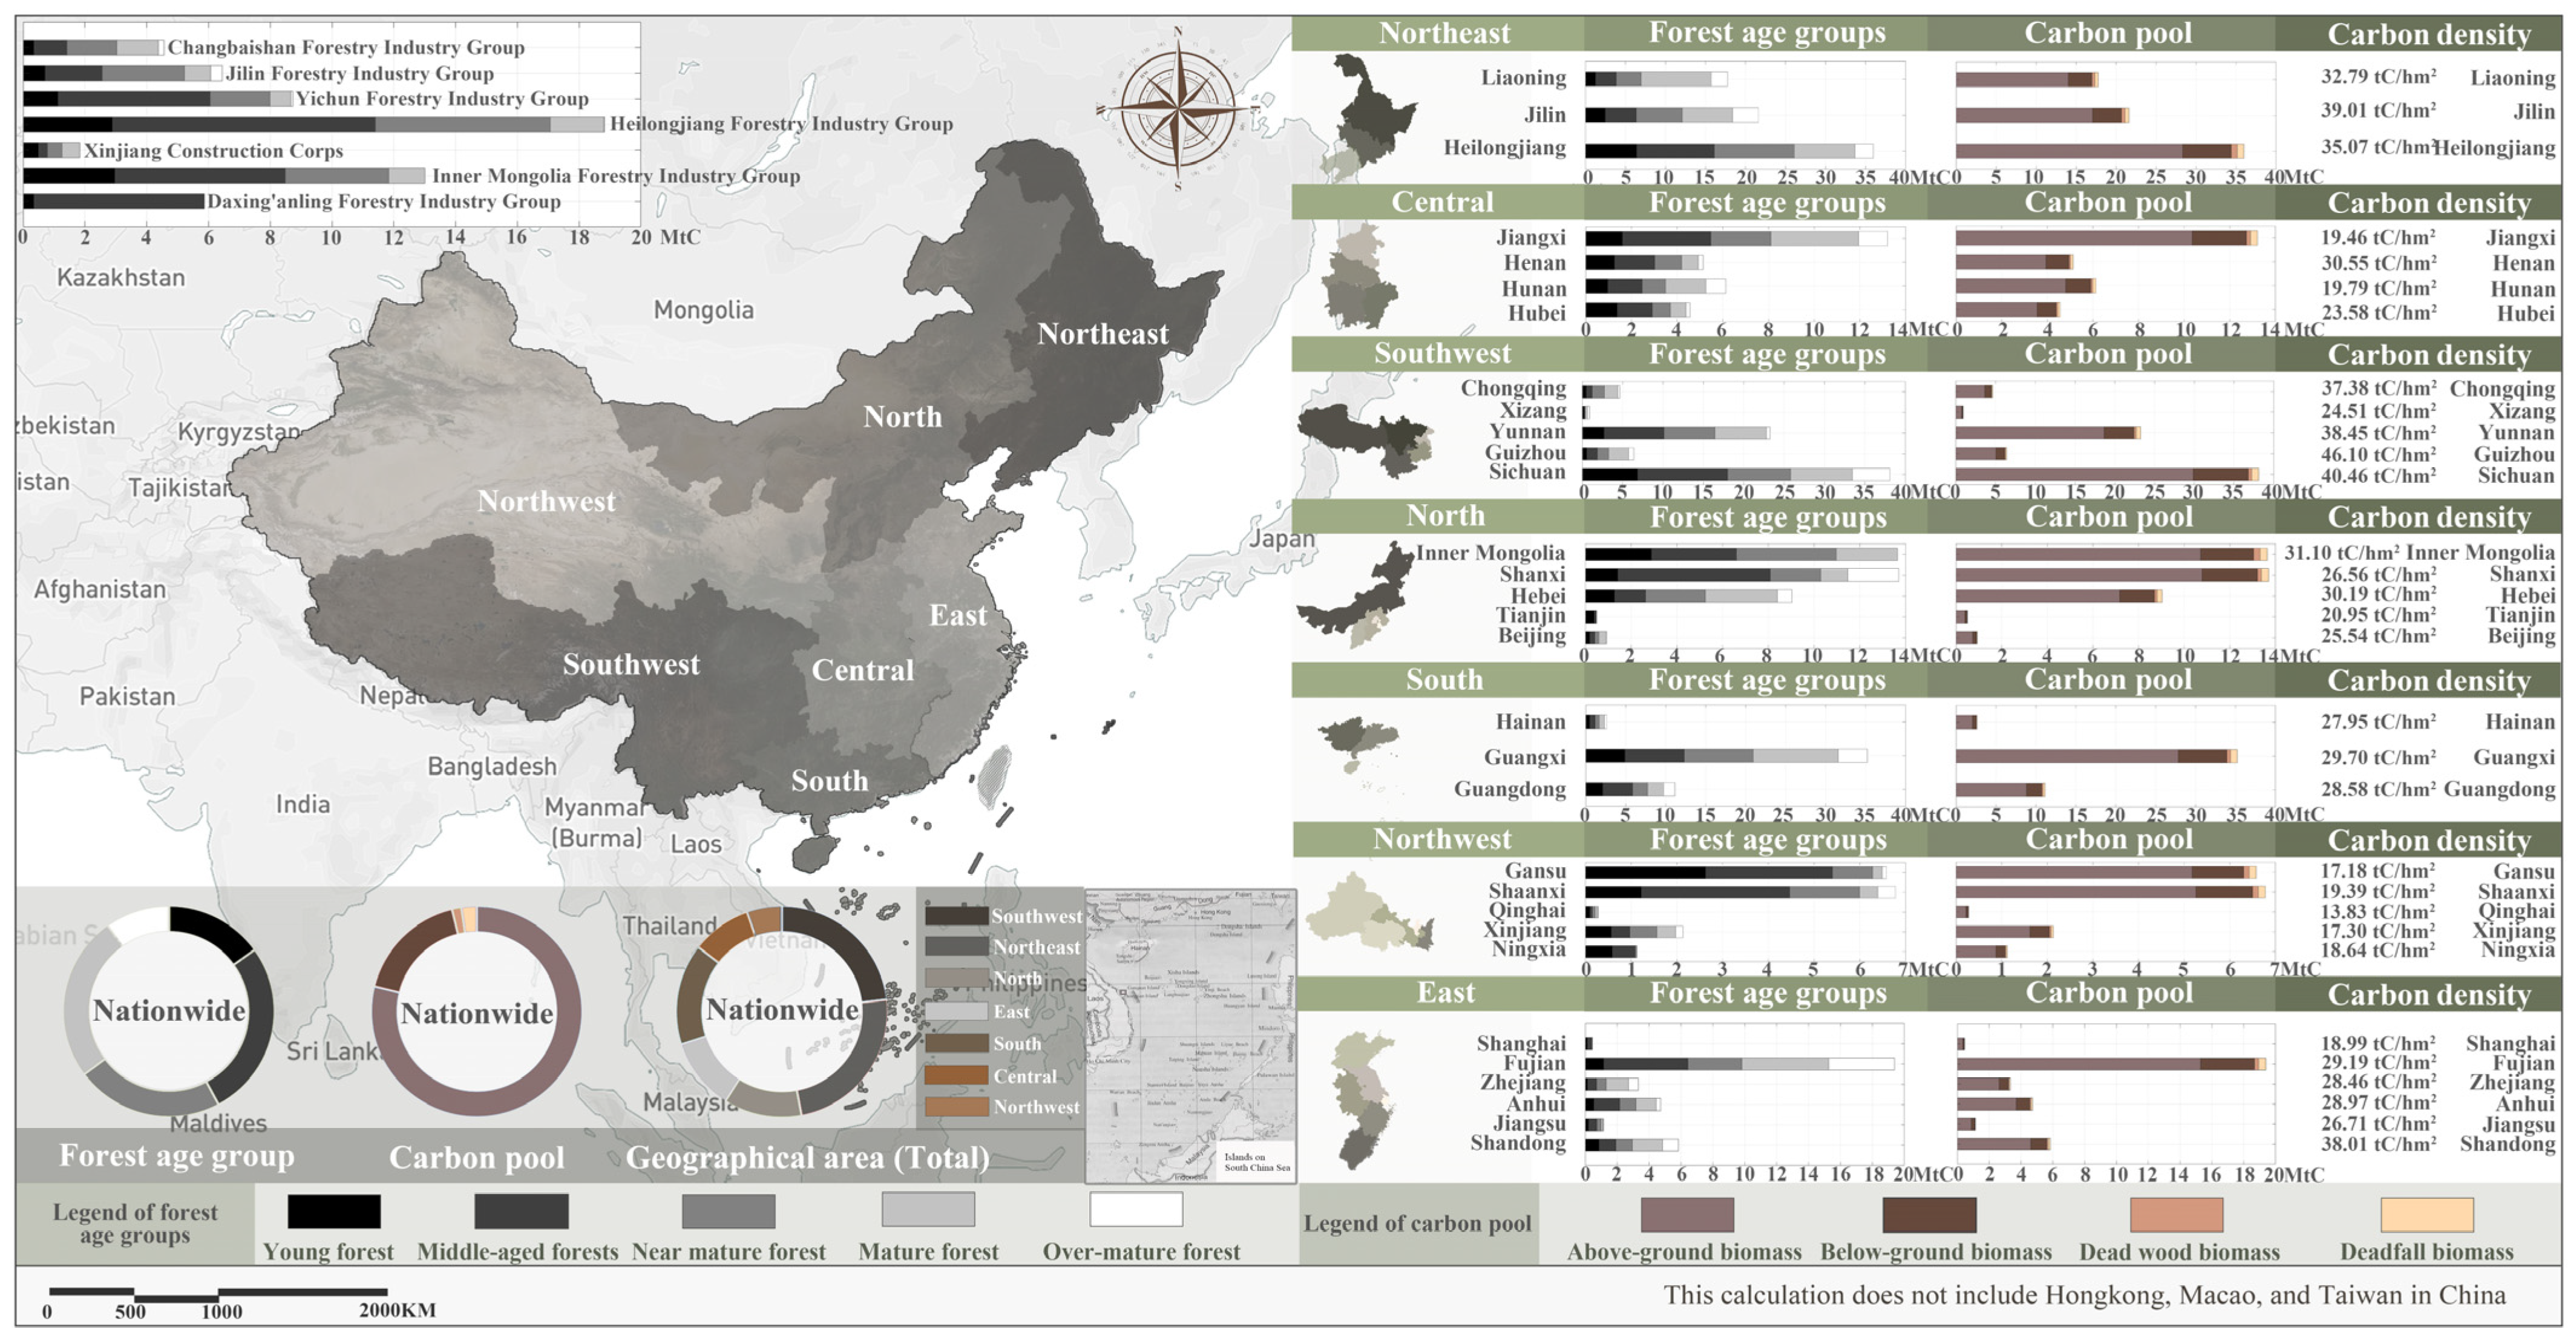
3.1. Carbon Stock and Carbon Density

The total carbon stock of state-owned plantation forests in China in 2023 is determined to be 375.42 million tons of carbon (MtC), with a carbon density of 30.77 tons of carbon per hectare (tC/hm2). Figure 1 presents the calculation results of the carbon stock and carbon density of each forest age and carbon pool.
In terms of forest age groups at the national level (excluding FIGs), the carbon stocks of middle-aged forests (85.79 MtC) are the highest, followed by mature forests (79.87 MtC), near-mature forests (71.45 MtC), young forests (47.73 MtC), and over-mature forests (31.32 MtC). At the regional level, young and middle-aged forests in Southwest China have the highest carbon stocks, with 10.77 MtC and 20.68 MtC, respectively. Moreover, near-mature, mature, and over-mature forests in Northeast China exhibit the highest carbon stocks, with 18.87 MtC, 22.63 MtC, and 7.58 MtC, respectively. Young forests in East China have the lowest carbon stocks, accounting for 6.23% of the national level. In Northwest China, middle-aged to over-mature forests exhibit the lowest carbon stocks, representing less than 10% of the total. In terms of carbon density, all age groups in Southwest China have the highest carbon density in the country, with an average of 41.00 tC/hm2, while all age groups in Northwest China exhibit the lowest carbon density in the country, with an average of 20.55 tC/hm2. Overall, the average carbon density of state-owned plantation forests in China is 17.74 tC/hm2 at the young age stage, while the carbon density of over-mature forests is 36.78 tC/hm2, with an average growth rate of 107.39%.
In terms of carbon pool types at the national level (excluding FIGs), the aboveground biomass carbon pool of China’s state-owned plantation forests is determined as 249.05 MtC, the belowground biomass carbon pool as 55.03 MtC, the dead wood biomass carbon pool as 4.70 MtC, and the deadfall biomass carbon pool as 7.37 MtC. Overall, the aboveground biomass carbon pool accounts for approximately 78.77% of all carbon stocks, and thus, it is the most dominant carbon pool among the four carbon pool types. At the regional level, the aboveground biomass carbon pools in the northeast and southwest regions are larger, determined as 59.39 MtC and 57.93 MtC, respectively, followed by 38.70 MtC in the south, 29.79 MtC in the north, 27.46 MtC in the east, 22.65 MtC in the central region, and 13.14 MtC in the northwest. In contrast, the proportion of carbon stocks in the belowground biomass, dead wood, and deadfall carbon pools to the total carbon stocks in each region does not vary significantly, with proportions ranging from 16.81% to 18.37%, 1.10% to 2.05%, and 2.30% to 2.34%, respectively. In terms of carbon density, the aboveground biomass carbon pool exhibits the highest carbon density in southwest China at 31.39 tC/hm2, while the lowest is observed in northwest China at 14.04 tC/hm2. The carbon density of the remaining three pools did not differ significantly at the regional level. Overall, the carbon density of the aboveground biomass carbon pool is the highest in state-owned plantation forests in China, at 22.81 tC/hm2, while the carbon density of the belowground biomass carbon pool, dead wood carbon pool, and deadfall carbon pool is lower, at 5.07 tC/hm2, 0.43 tC/hm2, and 0.68 tC/hm2, respectively.
As of 2023, the carbon stock ranking of the seven important FIGs is as follows: Heilongjiang FIG (18.83 MtC), Inner Mongolia FIG (13.01 MtC), Yichun FIG (8.73 MtC), Jilin FIG (6.44 MtC), Daxing’anling FIG (5.87 MtC), Changbaishan FIG (4.57 MtC), and Xinjiang Construction Corps (1.83 MtC). The important FIGs totaled 59.27 MtC. In terms of carbon density, Changbaishan FIG exhibited the highest value at 39.97 MtC, followed by Jilin FIG at 37.13 MtC, Heilongjiang FIG at 33.87 MtC, Yichun FIG at 33.74 MtC, Daxing’anling FIG at 32.79 MtC, Inner Mongolia FIG at 30.67 MtC, and Xinjiang Construction Corps FIG with the lowest at 17.07 MtC.

3.2. Prediction of Carbon Stock and Carbon Density

The carbon stocks (excluding FIGs) in 2030, 2040, 2050, and 2060 are estimated as 392.85 MtC (37.78 tC/hm2), 438.14 MtC (42.13 tC/hm2), 459.17 MtC (44.16 tC/hm2), and 471.01 MtC (45.29 tC/hm2), respectively.
At the regional level, the highest carbon stock by 2060 is projected in the northeast (122.09 MtC), followed by the southwest (98.53 MtC), south (63.82 MtC), central (53.74 MtC), east (51.37 MtC), north (49.19 MtC), and northwest (32.27 MtC). In terms of the growth rate, the northwest of China is expected to have the highest growth rate of carbon stock during 2023–2060, at 91.15%, followed by 85.10% in central China, 62.02% in the northeast, 47.38% in the east, 34.50% in the southwest, 30.32% in the south, and 30.16% in the north. The carbon density is projected to vary depending on the region. The highest average carbon density of state-owned plantation forests in China by 2060 is estimated to be in Northeast China, at 57.54 tC/hm2, while the lowest is in Northwest China, at 34.49 tC/hm2. In terms of growth rate, the carbon density in Northwest China is expected to exhibit the highest growth rate of 91.15% during the projection period, followed by Central China with 85.10%, while North China is projected to exhibit the lowest growth rate of 30.16%.
At the provincial level, no significant changes were observed in the ranking of carbon stocks in China’s state-owned plantation forests during the prediction period. As of 2060, Heilongjiang, Guangxi, and Sichuan provinces possess higher carbon stocks, with 55.02 MtC, 47.44 MtC, and 47.29 MtC, respectively, while provinces such as Jiangsu, Xizang, Beijing, Shanghai, Tianjin, and Qinghai have considerably lower carbon stocks (less than 2 MtC). In terms of carbon density, Shandong province exhibits the highest value of 70.21 tC/hm2, followed by Guizhou province with 66.28 tC/hm2, Jilin province with 61.91 tC/hm2, and Liaoning province with 60.49 tC/hm2. In contrast, provinces such as Qinghai, Xinjiang, Tianjin, and Guangdong exhibit lower carbon density values, ranging from 20.29 tC/hm2 to 31.76 tC/hm2. Moreover, Jiangxi province has the highest growth rate of 100.44%, while that of Guangdong province is the lowest at 11.13%.
By 2060, carbon stocks in FIGs total 87.24 MtC. The Heilongjiang FIG is the largest with 29.15 MtC, followed by the Inner Mongolia FIG with 15.61 MtC, the Yichun FIG with 12.47 MtC, the Jilin FIG with 10.41 MtC, the Daxing’anling FIG with 9.19 MtC, the Changbaishan FIG with 7.18 MtC, and the Xinjiang Construction Corps with 3.23 MtC. In terms of carbon density, the Changbaishan FIG is the densest in 2060, at 62.85 tC/hm2, followed by the Jilin FIG at 60.02 tC/hm2, the Daxing’anling FIG at 52.44 tC/hm2, the Yichun FIG at 51.37 tC/hm2, the Inner Mongolia FIG at 36.81 tC/hm2, and the Xinjiang Construction Corps with 30.10 tC//hm2. Note that although the Xinjiang Construction Corps is the least carbon-intensive in the forecast period, it is the fastest-growing (at approximately 34.58%). Table 1 reports the predicted carbon stock and carbon density in state-owned plantation forests in China.

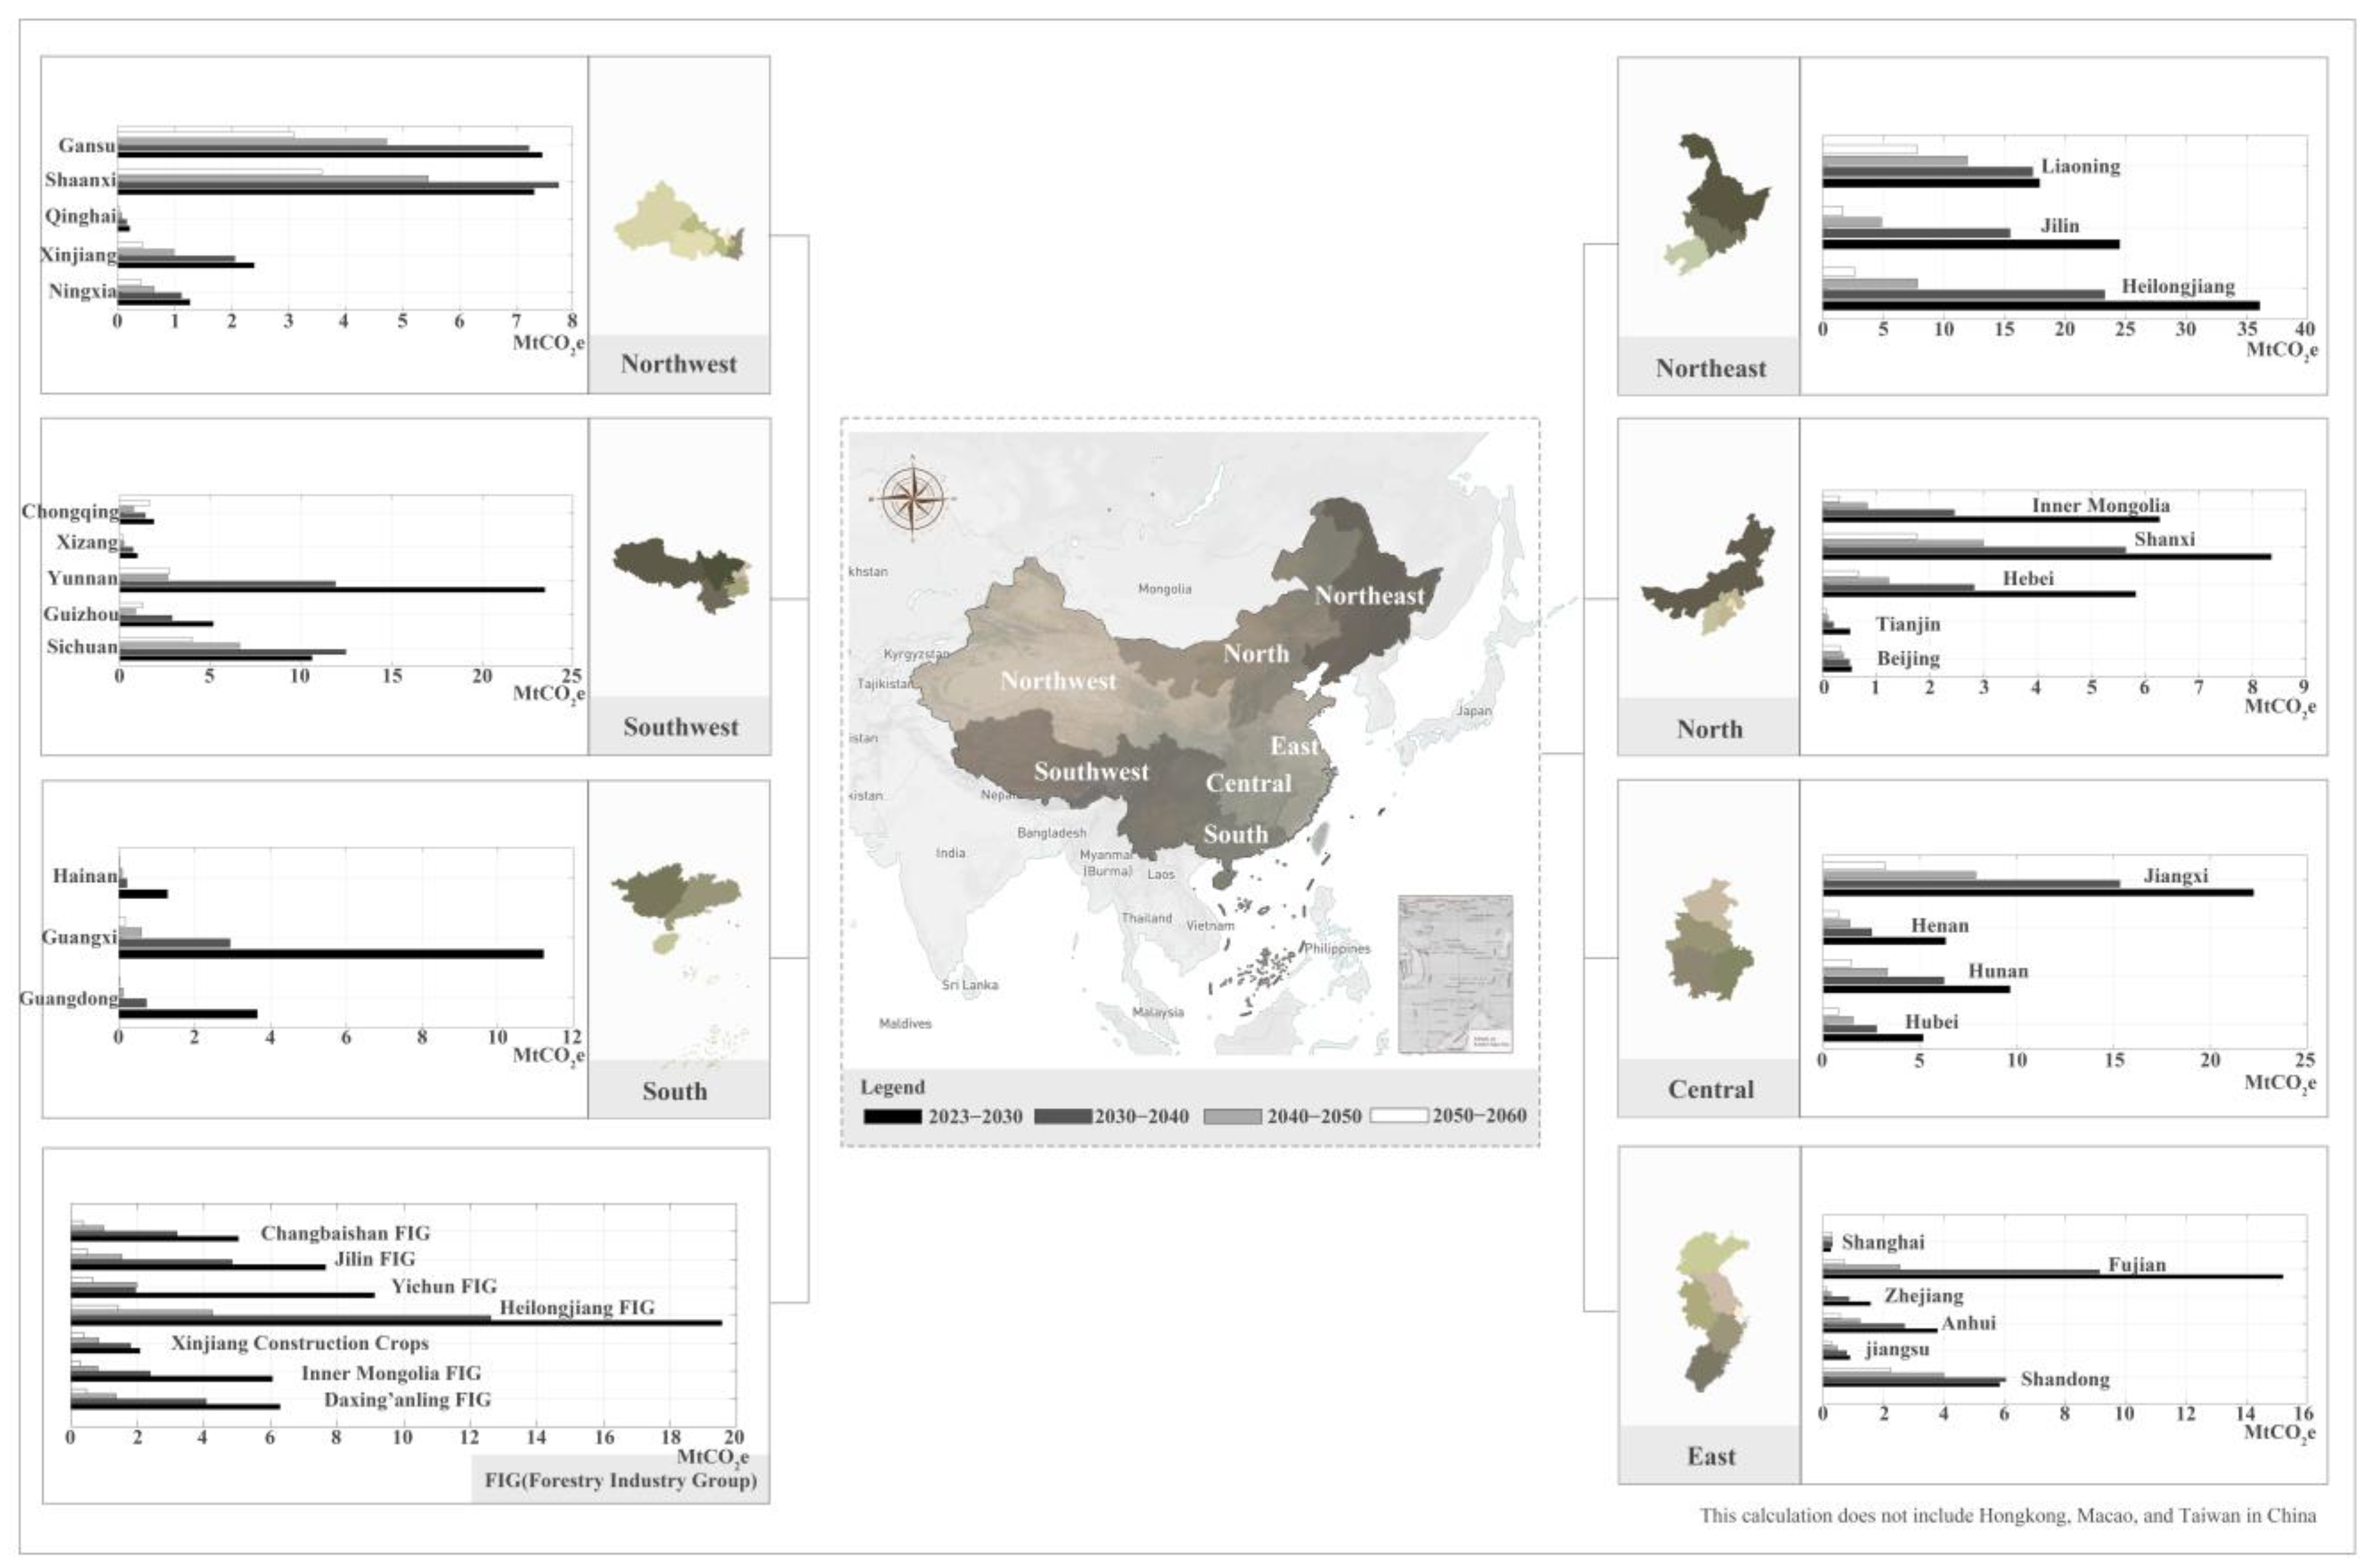
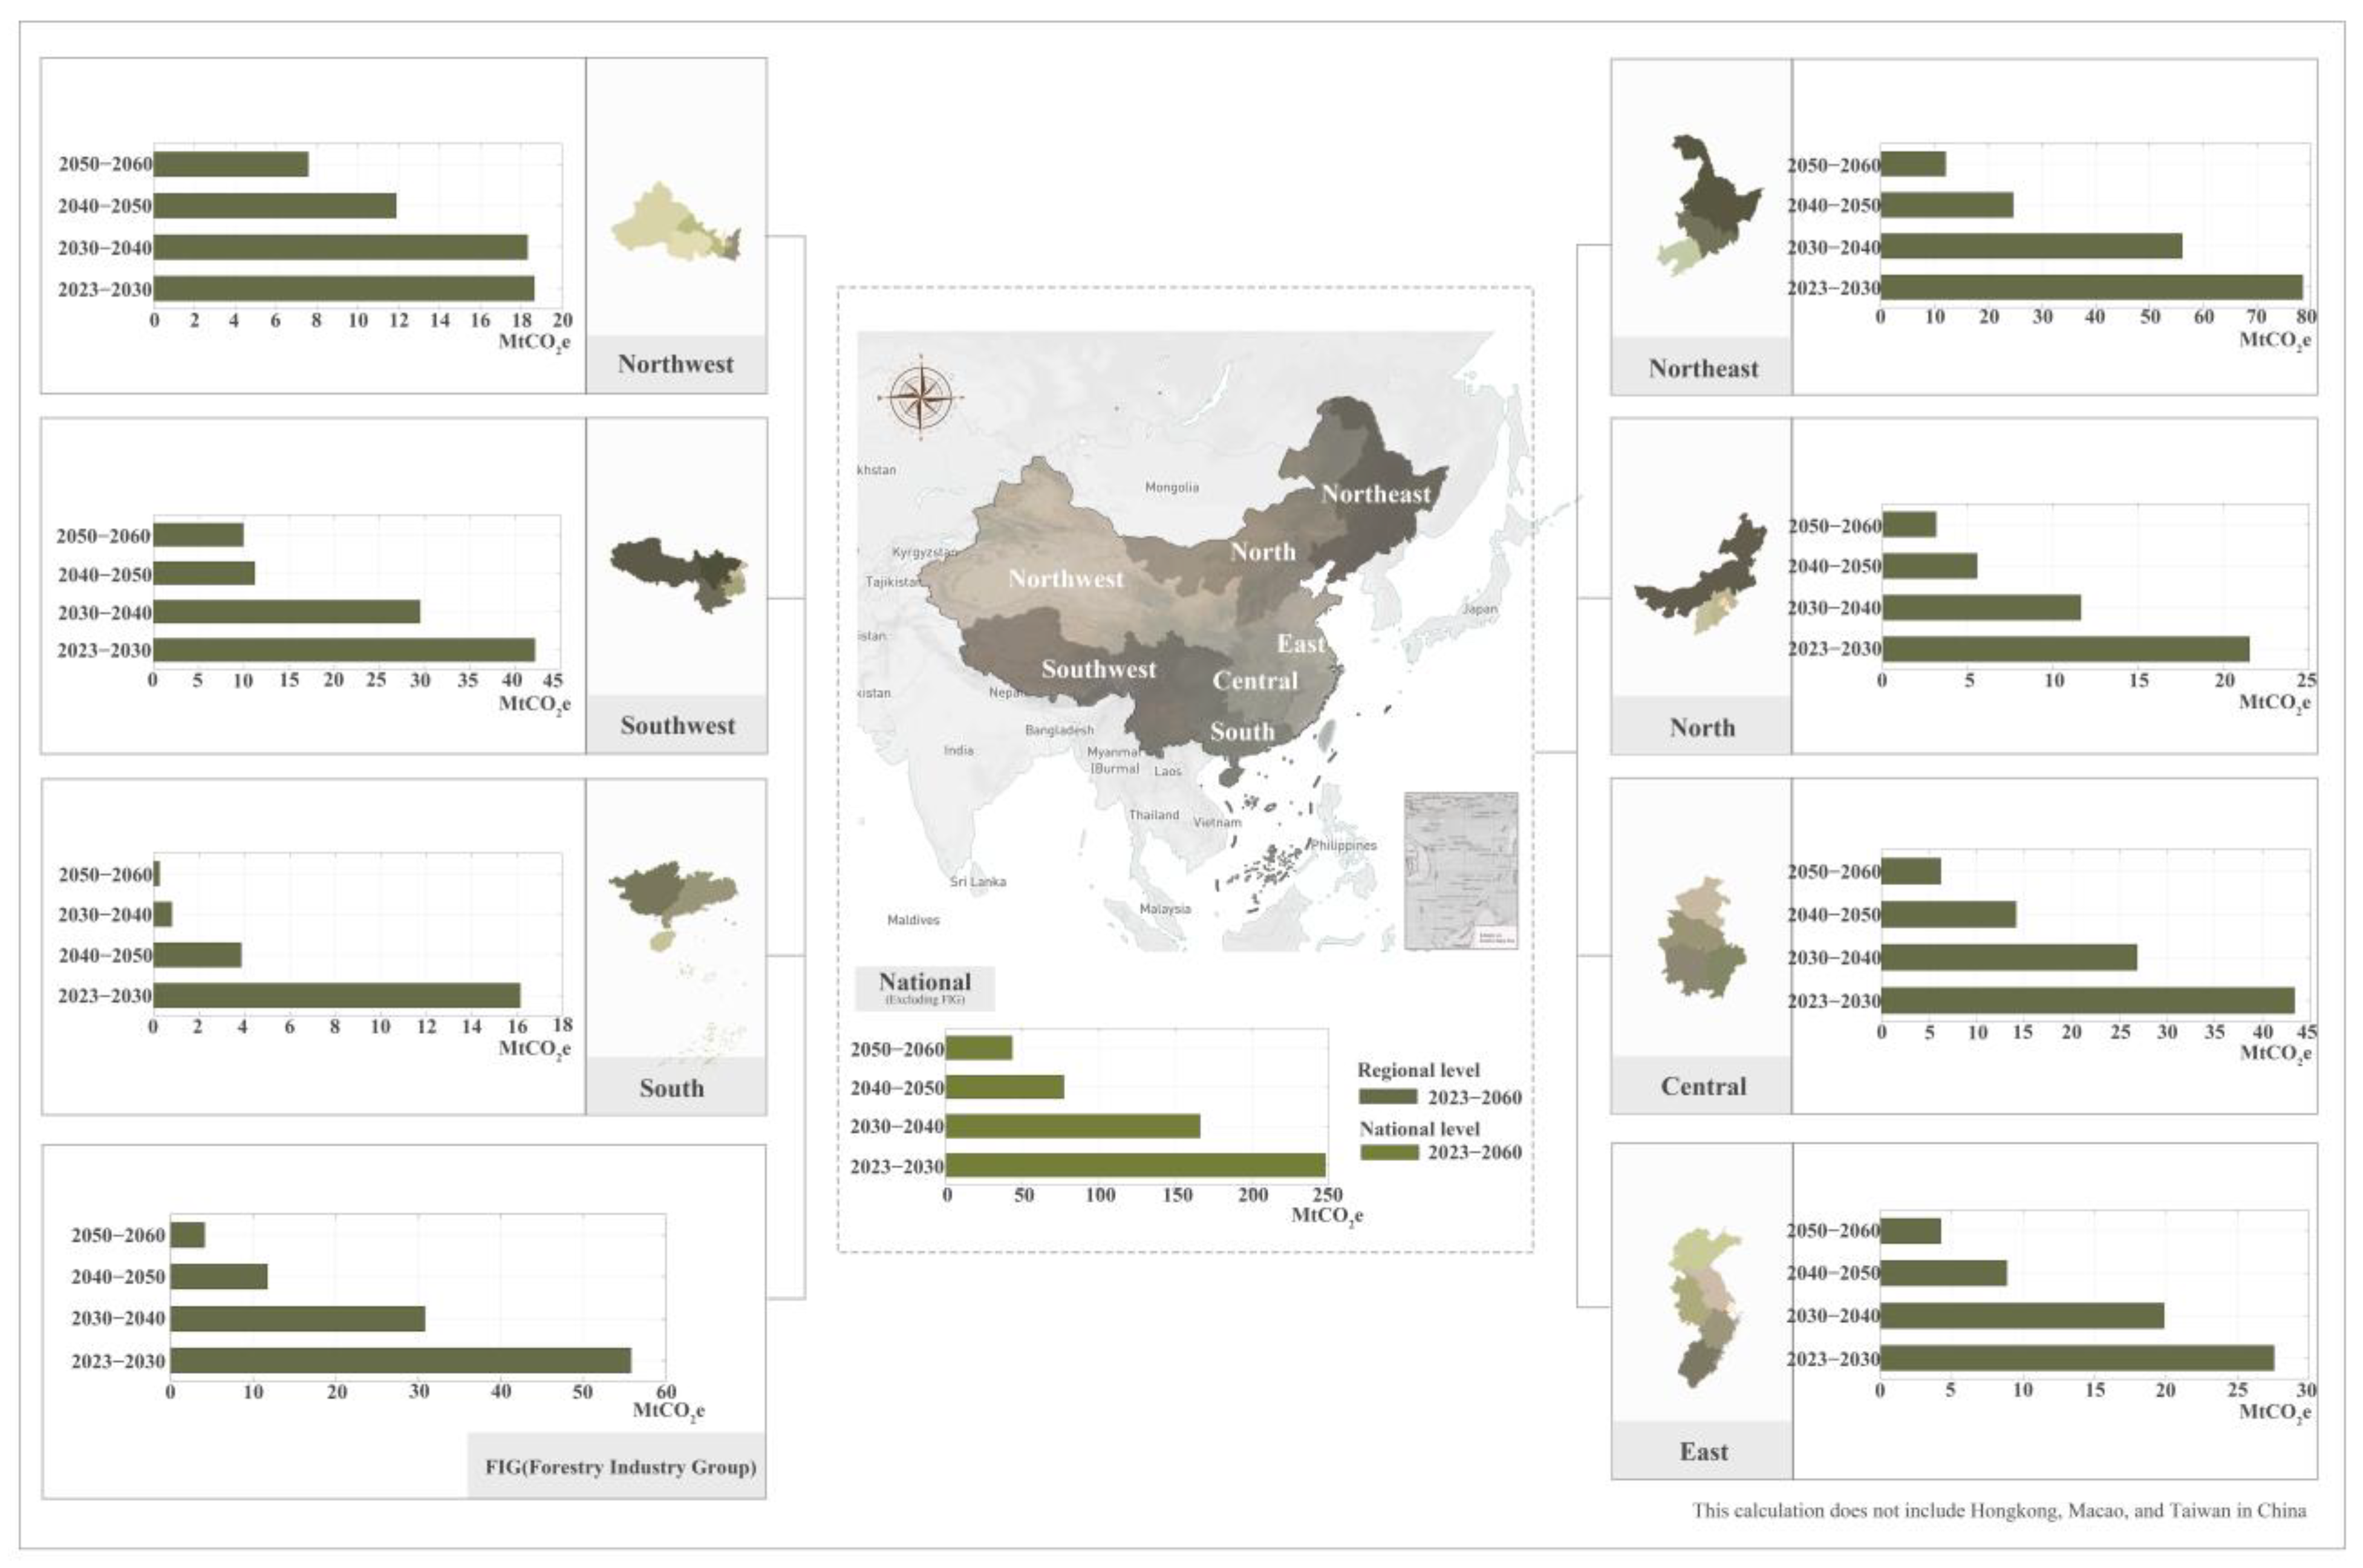
3.3. Prediction of Carbon Sink

Figure 2 and Figure 3 present the carbon sequestration potential of state-owned plantation forests in China. The national-level carbon sink projections (excluding FIGs) for the periods 2023–2030, 2030–2040, 2040–2050, and 2050–2060 are 247.90 MtCO2e, 166.08 MtCO2e, 77.12 MtCO2e, and 43.42 MtCO2e, respectively. The cumulative carbon sink during the forecast period is estimated at 534.52 MtCO2e, resulting in an average annual carbon sink of 14.45 MtCO2e and a national average annual carbon sink per unit of 1.39 tons of CO2 per hectare per year (tCO2e/(hm2·a)).
At the regional level (excluding FIGs), the largest carbon sink potential during the forecast period is expected to be in Northeast China with 171.36 MtCO2e, followed by Southwest China with 92.67 MtCO2e, Central China with 90.60 MtCO2e, East China with 60.55 MtCO2e, Northwest China with 56.43 MtCO2e, North China with 41.79 MtCO2e, and South China with 21.11 MtCO2e. The average annual carbon sink per unit in each region is projected to be 2.18 tCO2e/ha in the northeast, 1.41 tCO2e/ha in the east, 1.36 tCO2e/ha in the southwest, 1.81 tCO2e/(hm2·a) in the center, 0.86 tCO2e/(hm2·a) in the north, 1.63 tCO2 e/(hm2·a) in the northwest, and 0.34 tCO2e/(hm2·a) in the south. Overall, the carbon sequestration capacity of state-owned plantation forests in Northeast China, Northwest China, Central China, and East China is projected to be higher than the national average (1.39 tCO2e/(hm2·a)), while other regions are estimated to have a lower carbon sequestration capacity. At the provincial level, Heilongjiang, Liaoning, Jiangxi, Jilin, and Yunnan are projected to have large carbon sinks during the period 2023–2060, with 69.84 MtCO2 e, 55.00 MtCO2e, 48.65 MtCO2e, 46.53 MtCO2e, and 40.79 MtCO2e, respectively, while Beijing, Hainan, Shanghai, Tianjin, and Qinghai are estimated to have smaller carbon sinks (less than 2 MtCO2e). The average annual carbon sink per unit in Shandong, Liaoning, Jilin, and Guizhou is projected to be high, with 3.19 tCO2e/(hm2·a), 2.74 tCO2e/(hm2·a), 2.27 tCO2e/(hm2·a), and 2.00 tCO2e/(hm2·a), respectively, while Hainan, Guangxi, Qinghai, and Guangdong are projected to have a lower carbon sink potential (less than 0.5 tCO2e/(hm2·a)).
During the forecast period, the cumulative carbon sink of the seven important FIGs is 102.55 MtCO2e; the highest carbon sink is the Heilongjiang FIG (37.85 MtCO2e, 1.02 MtCO2e per year), followed by the Jilin FIG (14.56 MtCO2e, 0.39 MtCO2e per year), the Yichun FIG (13.71 MtCO2e, 0.37 MtCO2e per year), the Daxing’anling FIG (12.19 MtCO2e, 0.33 MtCO2e per year), the Changbai Mountain FIG (9.58 MtCO2e, 0.26 MtCO2e per year), the Inner Mongolia FIG (9.54 MtCO2e, 0.26 MtCO2e per year); and the Xinjiang Construction Corps (5.13 MtCO2e, 0.14 MtCO2e per year).

3.4. Bias Analysis

To assess the reliability of the calculations, we performed a comparative analysis based on forest carbon density (Table 2). The results reveal the reliability of the calculations.
As previously mentioned, some of the forest stock volume data were missing for certain tree species in the 9th National Forest Inventory data. Therefore, similar tree species were selected as substitutes. However, this may influence the accuracy of the results. Furthermore, the biomass of mixed forests is influenced by a variety of factors, such as the composition of tree species, the age of the stand, the planting density, and other traits [27], which are difficult to analyze at a national scale level. Similarly, using root-to-stem ratios and default values to calculate biomass carbon pools can also introduce some errors.
The harvesting targets generally vary depending on the provinces of China. Despite this, we did not calculate the changes in carbon stock resulting from different harvesting scenarios. However, in practice, logging activities, such as intensive forest management based on moderate harvesting intensity and long rotation, will increase carbon stocks [28,29].

4. Discussion

4.1. Analysis of the Carbon Offsetting Capacity of State-Owned Forest

Previous studies have reported China’s average annual carbon emissions under the NDC and Shared Socioeconomic Pathway Scenarios (SSPS) from 2020 to 2060 to range between 10,234 MtCO2e and 11,693 MtCO2e [30,31]. Based on this, we calculate that state-owned plantation forest carbon sinks in China can offset approximately 0.15–0.17% of carbon emissions per year.
Obviously, the existing state-owned forest has a limited capacity for carbon offset, but considering the afforestation plan published by the government [32], state-owned forests still have room for improvement in carbon offset. Based on the afforestation plan, China will afforest 73,781,300 ha per year from 2021 to 2050. Combined with the current proportion of state-owned forests, it will generate 41.84 MtCO2e per year. It is worth mentioning that China also has a forest management plan encompassing 2,717,500,00 ha during the same period. Therefore, the existing state-owned forest still has significant additional capacity for forest carbon offsets. Notably, in 2023, the China Forestry and Grassland Administration emphasized the need for collaboration on collective forest rights reform with state-owned forest farms [33]. They also highlighted the importance of exploring diversified joint management models, such as cooperative afforestation and management involving rural collective economic organizations and farmers. Within this policy framework, centralizing the management of scattered forest lands through the resources and technology of state-owned forest farms can significantly enhance the carbon sink potential of China’s forestry industry.

4.2. New Pathways for Expanding the Potential of Carbon Offsetting Mechanisms in China’s Forests—Developing Methodologies for Natural Forests

As noted earlier, state-owned plantation forest carbon sinks have a limited capacity to offset carbon emissions, and fewer still meet the necessary conditions for carbon offsetting using the methodology, highlighting the need to consider the development of natural forest methodologies.
The primary natural forest carbon sink schemes on the international carbon market are Reduced Emissions from Deforestation and Forest Degradation (REDD+) projects. As of 2021, existing state-owned natural forests cover an area of 67.46 million hectares, with a forest stock of 9.72 billion m3 [25]. Furthermore, the Chinese government has implemented strict natural forest protection policies and has made great efforts to conduct mountain closures for the natural regeneration of forests [34]. The development of REDD+ methodologies under CCER, or carbon inclusion mechanisms, will further increase the forestry carbon offset potential.
The key elements of the REDD+ methodology include (1) identifying baseline scenarios; (2) demonstrating project additionality; (3) determining project boundaries and land eligibility; (4) selecting the carbon pool for baseline scenarios (project scenarios); (5) selecting GHG emission sources for baseline scenarios (project scenarios); (6) measuring emission reductions for baseline scenarios (project scenarios); (7) assessing non-persistent risk for projects; (8) determining project leakage; (9) monitoring baseline scenarios (project scenarios); and (10) determining the conditions required for the application of the methodology. The most important step in developing a REDD+ methodology is determining how to identify the baseline scenario, namely, determining the forest reference emission level (FREL)/forest reference level (FRL) at different baselines. The FREL/FRL is an important factor influencing the amount of emission reductions from a project and directly determining the emission reduction potential of the activity.
In general, REDD+ has three reference levels, including the historical baseline, the historical adjusted baseline, and the projected baseline. The historical baseline uses historical logging rates as a basis for future projections. For example, Mexico employed data from 2000 to 2010 to predict emissions in 2011–2015 [35]. However, this approach ignores factors that may affect logging activities in the future. Therefore, some countries have advocated for an additional factor to correct this, namely, the historical adjustment baseline. The projected baseline aims to use econometric modeling to analyze the socioeconomic and structural drivers of deforestation. However, this method is complex and requires high data precision [36].
Although there is no uniform FREL/FRL at the international level, it is generally recognized that the quality of activity data, emission factors, and drivers of forest change can determine the methodology used to develop FREL/FRL [37]. Notably, many current projects design baselines through historical deforestation averages [38], while West et al. [39], in a review of REDD projects in six countries on three continents, found that most REDD projects did not significantly reduce deforestation due to inaccuracies in the design of the ex ante baselines of many projects, i.e., the ex ante baselines overestimated the emissions due to deforestation. Based on this, the Chinese government should focus on the deforestation drivers at the national or regional level and collect sufficient historical data when developing a natural forest conservation methodology.

4.3. Development Strategy for Forestry Carbon Offset Programs in China

4.3.1. Extending the Application Conditions of the Methodologies

As mentioned earlier, not all forest carbon sinks can be used for carbon offsetting purposes. The development of forestry carbon offset projects requires methodologies that set criteria such as the timing of planting forest land, minimum continuous area of forest blocks, soil type, vegetation height, forest age group, and the additionality of activities. Therefore, the amount of carbon sinks available for forestry carbon offsetting in Chinese state forests will be lower than those determined in this paper.
Currently, existing CCER methodologies are severely limited in their application, which greatly impedes the development of forest carbon offset programs in China. Therefore, modifications to expand the scope of the applications are required. For example, the CCER forest management methodology (referring to the old methodology, as the new forest management methodology has not yet been published) mandates the use of newly planted young and middle-aged forests. However, analysis of the carbon stock calculations presented in this paper reveals that a substantial portion of the existing carbon stock in state-owned forest plantations is primarily concentrated in near-mature and mature forests. As such, any future revisions to the methodology must consider broadening the age range of eligible forests. This expansion would substantially enhance the carbon offset potential within the forestry sector. Furthermore, the “Measures for the Management of Voluntary Greenhouse Gas Emission Reduction Trading (for Trial Implementation)” [40] released in 2023 stipulated that projects seeking registration must have initiated construction activities after 8 November 2012, and emissions reductions must be generated after China’s commitment to achieving carbon neutrality (22 September 2020) in order to be registered. In addition, in the context of state-owned plantation forests, which represent a major source of timber production [41], the predominant use of fast-growing tree species signifies that forest stands established between 2012 and 2020 will rapidly mature into near-mature and mature forests. Consequently, they will no longer meet the criteria for participating in forest management carbon offset projects. Thus, expanding the applicability of the current CCER methodology can improve the carbon sink benefits of future forestry carbon offset projects.
It is worth noting that the integration of wildlife carbon services into the market has a high potential to attract significant investment due to the biodiversity synergies of forestry carbon offset projects [42]. Integrating biodiversity as an indicator into methodologies is urgent. However, a key challenge lies in quantifying the relationship between biodiversity and carbon.

4.3.2. Active Development of the Carbon Inclusion Mechanism

As mentioned previously, the CCER methodology has limited applicability, resulting in the exclusion of forest lands with high forest cover and ecological quality from the CCER market. Consequently, the development of a more widely applicable carbon inclusion mechanism is necessary to enhance social responsibility, financial revenue, and the contribution of forestry carbon sinks to the carbon-neutral pathway. Currently, pilot forestry carbon inclusion projects have been initiated in Zhejiang, Sichuan, and Guangdong provinces in China, along with the establishment of an initial management system. There are both variations and similarities in the implementation and management frameworks of carbon inclusion projects across regions. In general, the authorities are required to establish expert pools, manage methodologies, manage carbon credits and transactions, supervise projects, and oversee other relevant aspects of building management systems. In comparison to the CCER mechanism, the carbon inclusion mechanism offers greater flexibility in quantifying carbon emission reductions (incremental sinks) from micro and small enterprises, community households, and individual behavior.
However, based on the existing pilot projects, several potential risks have not been adequately addressed during the project development and management system construction phase. These risks encompass natural, social, and financial aspects associated with project construction and implementation. Therefore, for future endeavors, it is crucial to (1) establish a natural risk monitoring and early warning system; (2) develop a risk compensation mechanism that integrates forestry insurance with carbon sink pledges and financing; and (3) conduct forestry education to enhance farmers’ awareness of the multiple benefits associated with forestry carbon sink projects. These measures aim to foster a harmonious relationship between people and forestry ecosystems.

5. Conclusions

This study quantifies the carbon sink capacity of existing state-owned plantation forests in China, estimating a total of 637 MtCO2e from 2023 to 2060. However, this represents a minimal annual offset, approximately 0.15%–0.17% of national carbon emissions, highlighting the limited role of existing forests in national carbon neutrality goals without additional interventions. Importantly, our findings reveal that the current methodologies for carbon offset calculation significantly restrict the conversion of these carbon sinks into tradable carbon credits. The actual potential for tradable carbon credits is far lower than the theoretical carbon sink capacity calculated. In the future, considering the reasons for silvicultural potential, there is an urgent need for China to expand the application conditions of existing methodologies to cover a wider range of forest types and tree ages, thereby unlocking the carbon-offsetting potential of state-owned forests. Additionally, including biodiversity indicators in these methodologies should be considered. Actively developing carbon-inclusive mechanisms, exploring the REDD+ methodology for natural forests, and researching suitable historical harvesting baselines are also important steps to enhance the contribution of forest carbon sinks to achieving carbon neutrality. Overall, considering the result that China’s state-owned plantation forests do not have a high potential for carbon offsets, the development of China’s future carbon market and its emission reduction strategy should still focus on reducing fossil energy emissions.
The research calculations in this paper use a non-spatial dataset due to the need to consider ownership, so the calculation process does not take into account the actual planting situation (e.g., mixed forests). Moreover, because the dataset selected partially represents dominant tree species only at the genus level, the accuracy of the data affects the calculation results. Consequently, there may be some deviation from the actual situation at the level of data accuracy.

Supplementary Materials

The following supporting information can be downloaded at https://www.mdpi.com/article/10.3390/f15050886/s1, Table S1: Parameter fitting results.

Author Contributions

Conceptualization, Z.C. and G.W.; methodology, Z.C.; software, Z.C.; validation, B.D., H.D. and G.Z.; formal analysis, Z.C. and B.D.; data curation, Z.C. and B.D.; writing—original draft preparation, Z.C.; writing—review and editing, B.D., H.D. and G.Z.; visualization, Z.C. and B.D.; supervision, G.W., G.Z. and H.D.; project administration, G.W., G.Z. and H.D.; funding acquisition, G.W., G.Z. and H.D. All authors have read and agreed to the published version of the manuscript.

Funding

This research was supported by the UBC-ZAFU Carbon and Climate Change Program, Grant #GR022067. This study was also supported by the China Scholarship Council, Grant #202309110004.

Data Availability Statement

The data is not publicly available due to raw data copyright issues.

Conflicts of Interest

The authors declare that they have no known competing financial interests or personal relationships that could have appeared to influence the work reported in this paper.

References

  1. Van Der Gaast, W.; Sikkema, R.; Vohrer, M. The contribution of forest carbon credit projects to addressing the climate change challenge. Clim. Policy 2018, 18, 42–48. [Google Scholar] [CrossRef]
  2. Austin, K.G.; Baker, J.S.; Sohngen, B.L.; Wade, C.M.; Daigneault, A.; Ohrel, S.B.; Ragnauth, S.; Bean, A. The economic costs of planting, preserving, and managing the world’s forests to mitigate climate change. Nat. Commun. 2020, 11, 5946. [Google Scholar] [CrossRef] [PubMed]
  3. Rossi, D.J.; Baker, J.S.; Abt, R.C. Quantifying additionality thresholds for forest carbon offsets in Mississippi pine pulpwood markets. For. Policy Econ. 2023, 156, 103059. [Google Scholar] [CrossRef]
  4. Broekhoff, D.; Gillenwater, M.; Colbert-Sangree, T.; Cage, P. Securing Climate Benefit: A Guide to Using Carbon Offsets; Stockholm Environment Institute & Greenhouse Gas Management Institute: 2019. Available online: https://www.offsetguide.org/pdf-download/ (accessed on 16 May 2024).
  5. Ecosystem Marketplace. 2022. Available online: https://data.ecosystemmarketplace.com/ (accessed on 20 September 2023).
  6. Hu, M. United Nations Framework Convention on Climate Change (UNFCCC). 2021. Available online: https://climatechampions.unfccc.int/chinas-net-zero-future/ (accessed on 20 September 2023).
  7. United Nations Framework Convention on Climate Change (UNFCCC). 2021. Available online: https://www4.unfccc.int/sites/NDCStaging/pages/Party.aspx?party=CHN (accessed on 20 September 2023).
  8. Zhu, Y.; Lan, H.; Ness, D.A.; Xing, K.; Schneider, K.; Lee, S.H.; Ge, J.; Zhu, Y.; Lan, H.; Ness, D.A.; et al. Carbon trade, forestry land rights, and farmers’ livelihood in rural communities in China. In Transforming Rural Communities in China and Beyond: Community Entrepreneurship and Enterprises, Infrastructure Development and Investment Modes; Springer: Cham, Switzerland, 2015; pp. 61–91. [Google Scholar]
  9. Ministry of Ecology and Environment of the People’s Republic of China. Notice on the Issuance of Four Methodologies, including the Methodology for Greenhouse Gas Voluntary Emission Reduction Projects Afforestation Carbon Sinks (CCER-14-001-V01). 2023. Available online: https://www.mee.gov.cn/xxgk2018/xxgk/xxgk06/202310/t20231024_1043877.html (accessed on 15 November 2023).
  10. Sharp, D.D.; Lieth, H.; Whigham, D. Assessment of regional productivity in North Carolina. Prim. Product. Biosph. 1975, 14, 131–146. [Google Scholar] [CrossRef]
  11. Brown, S.A.; Lugo, A.E. Aboveground biomass estimates for tropical moist forests of the Brazilian Amazon. Interciencia Caracas 1992, 17, 8–18. [Google Scholar]
  12. Turner, D.P.; Koerper, G.J.; Harmon, M.E.; Lee, J.J. A carbon budget for forests of the conterminous United States. Ecol. Appl. 1995, 5, 421–436. [Google Scholar] [CrossRef]
  13. Fang, J.Y.; Wang, G.G.; Liu, G.H.; Xu, S.L. Forest biomass of China: An estimate based on the biomass–volume relationship. Ecol. Appl. 1998, 8, 1084–1091. [Google Scholar]
  14. Fang, J.; Chen, A.; Peng, C.; Zhao, S.; Ci, L. Changes in forest biomass carbon storage in China between 1949 and 1998. Science 2001, 292, 2320–2322. [Google Scholar] [CrossRef]
  15. Brown, S.L.; Schroeder, P.E. Spatial patterns of aboveground production and mortality of woody biomass for eastern US forests. Ecol. Appl. 1999, 9, 968–980. [Google Scholar] [CrossRef]
  16. Nilsson, S.; Shvidenko, A.; Stolbovoi, V.; Gluck, M.; Jonas, M.; Obersteiner, M. Full Carbon Account for Russia: Interim Report IR-00-021; International Institute for Applied Systems Analysis: Laxenburg, Austria, 2000. [Google Scholar]
  17. Fang, J.Y.; Wang, Z.M. Forest biomass estimation at regional and global levels, with special reference to China’s forest biomass. Ecol. Res. 2001, 16, 587–592. [Google Scholar] [CrossRef]
  18. Guo, Z.; Fang, J.; Pan, Y.; Birdsey, R. Inventory-based estimates of forest biomass carbon stocks in China: A comparison of three methods. For. Ecol. Manag. 2010, 259, 1225–1231. [Google Scholar] [CrossRef]
  19. Xu, B.; Guo, Z.; Piao, S.; Fang, J. Biomass carbon stocks in China’s forests between 2000 and 2050: A prediction based on forest biomass-age relationships. Sci. China Life Sci. 2010, 53, 776–783. [Google Scholar] [CrossRef]
  20. He, N.; Wen, D.; Zhu, J.; Tang, X.; Xu, L.; Zhang, L.; Hu, H.; Huang, M.; Yu, G. Vegetation carbon sequestration in Chinese forests from 2010 to 2050. Glob. Chang. Biol. 2017, 23, 1575–1584. [Google Scholar] [CrossRef]
  21. Qiu, Z.; Feng, Z.; Song, Y.; Li, M.; Zhang, P. Carbon sequestration potential of forest vegetation in China from 2003 to 2050: Predicting Forest vegetation growth based on climate and the environment. J. Clean. Prod. 2020, 252, 119715. [Google Scholar] [CrossRef]
  22. Kumar, L.; Mutanga, O. Remote Sensing of Above-Ground Biomass. Remote Sens. 2017, 9, 935. [Google Scholar] [CrossRef]
  23. Penman, J.; Gytarsky, M.; Hiraishi, T.; Krug, T.; Kruger, D.; Pipatti, R.; Buendia, L.; Miwa, K.; Ngara, T.; Tanabe, K.; et al. Good Practice Guidance for Land Use, Land-Use Change and Forestry. 2003. Available online: https://www.ipcc-nggip.iges.or.jp/public/gpglulucf/gpglulucf_files/GPG_LULUCF_FULL.pdf (accessed on 24 September 2023).
  24. National Forestry and Grassland Administration. China Forest Resources Report; China Forestry Press: Beijing, China, 2019. [Google Scholar]
  25. National Forest Resources Intelligent Management Platform. 2022. Available online: http://www.stgz.org.cn/ (accessed on 25 September 2023).
  26. GB/T 38590-2020; Technical Regulations for Continuous Forest Inventory. China Quality Inspection Press: Beijing, China, 2020.
  27. Feng, Y.; Schmid, B.; Loreau, M.; Forrester, D.I.; Fei, S.; Zhu, J.; Tang, Z.; Zhu, J.; Hong, P.; Ji, C.; et al. Multispecies forest plantations outyield monocultures across a broad range of conditions. Science 2022, 376, 865–868. [Google Scholar] [CrossRef]
  28. Tong, X.; Brandt, M.; Yue, Y.; Ciais, P.; Rudbeck Jepsen, M.; Penuelas, J.; Wigneron, J.-P.; Xiao, X.-P.; Song, X.-P.; Horion, S.; et al. Forest management in southern China generates short term extensive carbon sequestration. Nat. Commun. 2020, 11, 129. [Google Scholar] [CrossRef] [PubMed]
  29. Ameray, A.; Bergeron, Y.; Valeria, O.; Girona, M.M.; Cavard, X. Forest carbon management: A review of silvicultural practices and management strategies across boreal, temperate and tropical forests. Curr. For. Rep. 2021, 7, 245–266. [Google Scholar] [CrossRef]
  30. Li, M.; Liu, H.; Geng, G.; Hong, C.; Liu, F.; Song, Y.; Tong, D.; Zheng, B.; Cui, H.; Man, H.; et al. Anthropogenic emission inventories in China: A review. Natl. Sci. Rev. 2017, 4, 834–866. [Google Scholar] [CrossRef]
  31. Zhang, F.; Xu, N.; Wu, F. Research on China’s CO2 emissions projections from 2020 to 2100 under the shared socioeconomic pathways. Acta Ecol. Sin. 2021, 41, 9691–9704. (In Chinese) [Google Scholar]
  32. State Forestry Administration of China, National Forest Management Plan. 2016. Available online: https://www.gov.cn/xinwen/2016-07/28/5095504/files/b9ac167edfd748dc8c1a256a784f40d5.pdf (accessed on 10 December 2023).
  33. China Forestry and Grassland Administration. Deepening the Reform of the Collective Forest Rights. 2023. Available online: https://www.forestry.gov.cn/c/www/zyxx/529388.jhtml (accessed on 9 May 2024).
  34. Xu, J.; Xie, S.; Han, A.; Rao, R.; Huang, G.; Chen, X.; Hu, J.; Liu, Q.; Yang, X.; Zhang, L. Forest Resources in China—The 9th National Forest Inventory; National Forestry and Grassland Administration: Beijing, China, 2019. [Google Scholar]
  35. United Nations Framework Convention on Climate Change (UNFCCC). Mexico’s Forest Reference Emission Level Proposal. 2015. Available online: https://redd.unfccc.int/media/frel_mexico_modified.pdf (accessed on 15 November 2023).
  36. Parker, C.; Mitchell, A.; Trivedi, M.; Mardas, N.; Sosis, K. The Little REDD+ Book. 2009. Available online: https://globalcanopy.org/wp-content/uploads/2020/12/LRB_en.pdf (accessed on 15 November 2023).
  37. Herold, M.; Verchot, L.; Angelsen, A.; Maniatis, D.; Bauch, S. A stepwise framework for setting REDD+ forest reference emission levels and forest reference levels. CIFOR Brief 2012, 52, 1–8. [Google Scholar]
  38. Delacote, P.; Le Velly, G.; Simonet, G. Revisiting the location bias and additionality of REDD+ projects: The role of project proponents status and certification. Resour. Energy Econ. 2022, 67, 101277. [Google Scholar] [CrossRef]
  39. West, T.A.P.; Wunder, S.; Sills, E.O.; Börner, J.; Rifai, S.W.; Neidermeier, A.N.; Frey, G.P.; Kontoleon, A. Action needed to make carbon offsets from forest conservation work for climate change mitigation. Science 2023, 381, 873–877. [Google Scholar] [CrossRef] [PubMed]
  40. Ministry of Ecology and Environment of the People’s Republic of China. Measures for the Management of Voluntary Greenhouse Gas Emission Reduction Trading (for Trial Implementation). 2023. Available online: https://www.mee.gov.cn/gzk/gz/202310/t20231020_1043695.shtml (accessed on 10 November 2023).
  41. Wang, Y.; Bai, G.; Shao, G.; Cao, Y. An analysis of potential investment returns and their determinants of poplar plantations in state-owned forest enterprises of China. New For. 2014, 45, 251–264. [Google Scholar] [CrossRef]
  42. Berzaghi, F.; Cosimano, T.; Fullenkamp, C.; Scanlon, J.; Fon, T.E.; Robson, M.T.; Forbang, J.L.; Chami, R. Value wild animals’ carbon services to fill the biodiversity financing gap. Nat. Clim. Chang. 2022, 12, 598–601. [Google Scholar] [CrossRef]
Figure 1. Carbon stock in state-owned plantation forests in China in 2023.
Forests 15 00886 g001
Figure 2. Carbon sink potential of state-owned plantation forests in China (provincial level), 2023–2060.
Forests 15 00886 g002
Figure 3. Carbon sink potential of state-owned plantation forests in China (national level), 2023–2060.
Forests 15 00886 g003
Table 1. Predicted carbon stock and carbon density in China’s state-owned plantation forests.
RegionProvince2030204020502060
Carbon
Stock
Carbon
Density
Carbon
Stock
Carbon
Density
Carbon
Stock
Carbon
Density
Carbon
Stock
Carbon
Density
SouthwestSichuan40.99 43.53 44.40 47.14 46.20 49.06 47.29 50.22
Guizhou7.79 56.28 8.58 61.98 8.82 63.73 9.18 66.28
Yunnan29.64 49.03 32.89 54.40 33.61 55.60 34.37 56.86
Xizang1.17 31.82 1.38 37.40 1.45 39.26 1.50 40.65
Chongqing5.14 41.54 5.53 44.66 5.74 46.39 6.20 50.05
NortheastHeilongjiang45.82 44.66 52.18 50.85 54.31 52.94 55.02 53.63
Jilin28.30 51.08 32.53 58.70 33.85 61.09 34.31 61.91
Liaoning22.65 41.82 27.38 50.55 30.64 56.57 32.76 60.49
NorthBeijing1.07 29.63 1.21 33.37 1.32 36.29 1.41 38.76
Tianjin0.63 26.85 0.69 29.20 0.71 30.36 0.73 31.15
Hebei10.62 35.50 11.39 38.08 11.72 39.20 11.91 39.81
Shanxi15.98 30.98 17.52 33.96 18.33 35.54 18.81 36.46
Inner Mongolia15.35 35.00 16.02 36.52 16.25 37.04 16.33 37.24
EastShandong7.43 48.37 9.09 59.11 10.18 66.23 10.79 70.21
Jiangsu1.38 32.49 1.60 37.58 1.73 40.66 1.80 42.41
Anhui5.76 35.32 6.49 39.83 6.83 41.89 6.98 42.85
Zhejiang3.75 32.16 3.99 34.19 4.07 34.83 4.10 35.12
Fujian23.53 35.43 26.02 39.19 26.72 40.24 26.91 40.53
Shanghai0.52 21.93 0.61 25.58 0.69 29.23 0.78 32.79
SouthGuangdong12.15 31.14 12.35 31.64 12.38 31.73 12.39 31.76
Guangxi46.42 39.15 47.22 39.83 47.3939.97 47.44 40.01
Hainan3.90 41.78 3.96 42.39 3.98 42.65 3.99 42.75
CentralHubei5.97 30.86 6.72 34.76 7.14 36.96 7.36 38.06
Hunan 8.76 28.28 10.46 33.77 11.37 36.69 11.76 37.96
Henan6.86 40.81 7.55 44.90 7.93 47.15 8.14 48.45
Jiangxi19.27 28.39 23.45 34.55 25.60 37.72 26.48 39.01
NorthwestNingxia1.47 24.39 1.77 29.44 1.95 32.34 2.06 34.22
Xinjiang2.79 22.60 3.35 27.16 3.62 29.35 3.74 30.31
Qinghai0.33 16.74 0.37 18.92 0.39 19.89 0.40 20.29
Shaanxi8.77 25.09 10.89 31.13 12.37 35.39 13.35 38.19
Gansu8.61 22.49 10.58 27.64 11.88 31.01 12.72 33.23
NationalTotal392.8537.78438.1442.13459.1744.16 471.0145.29
State-owned forest farmDaxing’ Anling Forestry Industry 7.5842.388.6948.589.0650.669.1951.35
Inner Mongolia Forestry Industry14.6634.5715.3136.0915.5336.6115.6136.81
Xinjiang Construction Crops2.4022.372.8926.943.1229.123.2330.09
Heilongjiang Forestry Industry24.1643.4627.6049.6628.7651.7429.1552.43
Yichun Forestry Industry11.2243.3311.7545.4212.2947.5012.4748.19
Jilin Forestry Industry8.5349.209.8556.8210.2759.2110.4160.03
Changbaishan Forestry Industry5.9452.046.8159.657.0862.047.1862.87
Total74.4941.1582.9045.8086.1147.5787.2448.20
Carbon stock unit: MtC; Carbon density unit: tC/hm2. Calculations do not include Hong Kong, Macao, and Taiwan in China.
Table 2. Comparison of carbon density calculations.
TypeYearCarbon StockAreaCarbon DensityData Source
National plantations 20212276.34 MtC76.84 Mhm29.62 tC/hm2 [25]
State-owned plantations2021 *425.30 MtC *12.20 Mhm34.86 tC/hm2-
* The carbon stock inversion in 2023 is based on the average annual carbon sink to obtain the carbon stock in 2021.
Disclaimer/Publisher’s Note: The statements, opinions and data contained in all publications are solely those of the individual author(s) and contributor(s) and not of MDPI and/or the editor(s). MDPI and/or the editor(s) disclaim responsibility for any injury to people or property resulting from any ideas, methods, instructions or products referred to in the content.

