Article

Identification of Damaged Canopies in Farmland Artificial Shelterbelts Based on Fusion of Unmanned Aerial Vehicle LiDAR and Multispectral Features

1
College of Resources and Environment, Xinjiang Agricultural University, Urumqi 830052, China
2
Xinjiang Key Laboratory of Soil and Plant Ecological Processes, Urumqi 830052, China
3
Forestry and Grassland Resources Monitoring Center of Xinjiang Production and Construction Corps, Urumqi 830026, China
*
Author to whom correspondence should be addressed.
Forests 2024, 15(5), 891; https://doi.org/10.3390/f15050891
Submission received: 30 March 2024 / Revised: 15 May 2024 / Accepted: 16 May 2024 / Published: 20 May 2024
(This article belongs to the Special Issue UAV Application in Forestry)

Abstract

:
With the decline in the protective function for agricultural ecosystems of farmland shelterbelts due to tree withering and dying caused by pest and disease, quickly and accurately identifying the distribution of canopy damage is of great significance for forestry management departments to implement dynamic monitoring. This study focused on Populus bolleana and utilized an unmanned aerial vehicle (UAV) multispectral camera to acquire red–green–blue (RGB) images and multispectral images (MSIs), which were fused with a digital surface model (DSM) generated by UAV LiDAR for feature fusion to obtain DSM + RGB and DSM + MSI images, and random forest (RF), support vector machine (SVM), maximum likelihood classification (MLC), and a deep learning U-Net model were employed to build classification models for forest stand canopy recognition for the four image types. The model results indicate that the recognition performance of RF is superior to that of U-Net, and U-Net performs better overall than SVM and MLC. The classification accuracy of different feature fusion images shows a trend of DSM + MSI images (Kappa = 0.8656, OA = 91.55%) > MSI images > DSM + RGB images > RGB images. DSM + MSI images exhibit the highest producer’s accuracy for identifying healthy and withered canopies, with values of 95.91% and 91.15%, respectively, while RGB images show the lowest accuracy, with producer’s accuracy values of 79.3% and 78.91% for healthy and withered canopies, respectively. This study presents a method for identifying the distribution of Populus bolleana canopies damaged by Anoplophora glabripennis and healthy canopies using the feature fusion of multi-source remote sensing data, providing a valuable data reference for the precise monitoring and management of farmland shelterbelts.

1. Introduction

Farmland shelterbelts are an ecological protection system consisting of certain tree species with structural functions that play an important role in improving the environment, regulating the climate, and safeguarding agricultural production, which is an important agricultural infrastructure [1]. Populus bolleana, as the main afforestation species for second-generation shelterbelts in arid regions of China, has the characteristics of straight and fast growth, resistance to atmospheric drought, tolerance to barrenness, easy regeneration, etc. [2,3]. Anoplophora glabripennis belongs to the order Coleoptera and the family Cerambycidae. It is a significant wood-boring pest of artificial shelterbelts and an important international quarantine pest [4,5]. Its larvae bore into the main stem of host plants, creating permanent cavities and defects in the trees. This severely affects the growth of the trees, leading to crown withering and the eventual death of the entire plant. In recent years, some areas of the Three-North Shelter Forest Program in China’s Xinjiang region have been degraded to varying degrees due to damage by Anoplophora glabripennis [6]. Mitigating the degradation of shelterbelts involves management and prevention, necessitating timely and accurate health monitoring of the shelterbelts [7].
In forestry surveys, traditional ground-based surveys are commonly employed to identify the health status of forests. However, this method has drawbacks, including the need for on-site assessment by skilled professionals, prolonged duration, and high costs, typically resulting in the acquisition and evaluation of only a limited number of samples [8]. The rapid and accurate acquisition of forest canopy health information is of paramount importance for forest resource surveys and precision updating. Nowadays, remote sensing techniques, including active and passive methods, can provide relatively low-cost, rapid, and accurate measurements of forest parameters over relatively large areas [9].
UAVs possess characteristics such as high spatial resolution and good timeliness, offering researchers the capability to rapidly and objectively determine forest structure [10,11], as well as obtain data on the occurrence and spread of pests and diseases [12], for use in scaled and precise forestry surveys [13]. Presently, optical remote sensing via UAVs constitutes the primary data source for monitoring and controlling forest pests and diseases. When vegetation is afflicted by pests or diseases, the transport of water and nutrients can be impeded, resulting in a change in external color from green to red or gray, and altering spectral reflectance [14].
In the visible-light spectrum, researchers have utilized spectral information obtained from UAV RGB cameras to study vegetation parameters and the damage status of forests [15,16]. You et al. [17] proposed a method to convert RGB images into LAB and HSV color space images and combined them with YOLOv5 to identify trees killed by pine wilt disease with high accuracy in affected forest stands. Tobias et al. [18] defined whiteness by the ratio of red pixel values to blue pixel values for each individual pixel relative to the ratio of average red and average blue values across the entire orthoimage. They calculated the ratio of white pixels to total pixels within the canopy using a simple GIS model as a basis for assessing the damage level of individual trees, achieving a maximum average accuracy of 94% in detecting damage to individual fir trees in the Zao Mountains of Japan caused by bark beetle attacks. Bai et al. [19] extracted features sensitive to pest damage severity using a continuous projection algorithm (SPA) from UAV visible-light images, combined with patterns and texture features in RGB vegetation indices, and employed machine learning methods to construct a model for identifying damage caused by Erannis jacobsoni Djak to Larix sibirica, achieving an overall accuracy of over 85%.
Chlorophyll plays a crucial role in plant life and status, serving as an indicator of plant growth and health. Within multispectral data, bands such as red, near-infrared, and red-edge are closely associated with chlorophyll content and properties. When trees are affected by pests or other damage, it alters the leaves’ spectral responses and biochemical characteristics [20]. Azadeh and Dimitrios [21] utilized unmanned aerial systems (UAS) to construct SVM models for tree species classification and health assessment using various vegetation indices and texture features. They found that the red-edge Chlorophyll Index (CI) exhibited the highest correlation with the main field data categories compared to other vegetation indices, underscoring the significance of the red-edge band in the detailed classification of vegetation species and health status due to its sensitivity to slight variations in chlorophyll content, consistent across most species and health status categories. Vegetation indices are numerical values generated by linear or nonlinear combinations of multispectral data, indicating vegetation conditions or biomass [22]. Jiang et al. [23] employed a high-resolution hyperspectral sensor to extract sensitive spectral and texture features related to mangrove pest information. By computing 52 vegetation indices and the first-order derivative reflectance of hyperspectral bands, they conducted feature selection and RF modeling to evaluate red mangrove leaves at different levels of pest infestation. Various spectral indices on UAV platforms, such as the EXG, NDVI, NPCI, R/G, and G/B vegetation indices, have been validated as having high detection accuracy in forest pest detection [24,25]. In the case of forest damage detection, Shin et al. [26] classified the severity of the Gangneung forest fire in Korea. By comparing NDVI thresholding with supervised classifiers such as maximum likelihood (MLH) and the Spectral Angle Mapper (SAM), they found that NDVI thresholding showed similar or higher accuracy in burned-surface classification.
With the advancement of machine learning and deep learning technologies, they have become crucial means of monitoring and controlling forest pests and diseases [27,28,29]. Mutiara et al. [30], using UAV optical imagery, conducted a study comparing two classic supervised classifiers, Artificial Neural Network (ANN), and Support Vector Machine (SVM), in the classification of pine trees infected with pine wilt disease against healthy ones in the villages of Wonchang and Anbi in Chuncheon City, Republic of Korea. They found that the SVM classification results exhibited higher overall accuracy compared to the ANN classification results. Furthermore, Yu et al. [31] employed two object detection algorithms (Faster R-CNN and YOLOv4) and two traditional machine learning algorithms based on feature extraction (RF and SVM) for identifying infected pine trees. They found that the accuracy of the feature-based RF and SVM models surpassed that of Faster R-CNN and YOLOv4, with random forest achieving slightly higher recognition accuracy than support vector machine.
Different satellite sensors have been utilized to collect forest data across wide geographical areas at various resolutions [32,33]. In medium-resolution satellite imagery for the identification of areas infected by pests and diseases, Li et al. [34] proposed an extension of the stochastic radiative transfer model (SRTP) based on Sentinel-2, combining a small amount of prior knowledge with a model simulation and a random forest algorithm to identify areas infected by pests and diseases from medium-resolution remote sensing images. Using high-resolution satellite imagery, Mullen [35] employed WorldView-2 to detect early tree damage caused by mountain pine beetles, achieving an overall accuracy of 75% in distinguishing infested trees from healthy ones. Azadeh et al. [36] utilized satellite images with different gradient spatial resolutions, including WorldView-2, Pléiades 1B, and SPOT-6, along with UAV image data as a reference. They effectively detected the spread of European spruce bark beetles to healthy trees in advance based on annual index changes from imagery of extremely high and high spatial and spectral resolution.
Satellite and UAV passive optical remote sensing can provide reflectance information in the horizontal direction of forests [37,38,39]. Light Detection and Ranging (LiDAR) is an active laser measurement technology that, through laser scanning combined with positioning and orientation systems (POSs), generates high-precision and dense 3D point clouds, digital elevation models (DEMs), digital surface models (DSMs), and information on tree height, diameter at breast height (DBH), and more. LiDAR is widely used for acquiring three-dimensional forest scanning data at different scales [40,41,42].
Terrestrial laser scanning (TLS) and unmanned aerial vehicle laser scanning (UAV-LS) can be utilized for measuring standard tree metrics, as well as tree canopy structure, species identification, monitoring tree health status, and the estimation of tree physiological parameters such as the leaf area index (PAC) and leaf area-to-sapwood area ratio (VC) [43,44]. Dimitrios et al. [45] demonstrated a significant improvement in the accuracy of tree metric estimation by integrating UAV-LS and TLS data, enhancing the three-dimensional (3D) structure of individual trees. Antti et al. [46] utilized waveform features (WF) from airborne LiDAR to detect tree mortality rates. As trees die, their canopy and branch structures become less dense and more irregular, resulting in more complex WF returns. By highlighting the differences in radiometric and geometric WF features between live and dead trees, WF features were employed for the binary classification of live and dead trees using the random forest method, achieving accuracy ranging from 94.7% to 98.5%. The extent of tree canopy dieback is a crucial indicator reflecting the occurrence and development of most pests and diseases.
The integration of active remote sensing LiDAR with passive remote sensing multispectral sensors has emerged as an effective approach to forest resource monitoring. Huang [47] employed a ground-based integrated support platform with a miniaturized laser scanner and a multispectral camera to assess the dieback rate of Yunnan pine stands affected by Tomicusyunnanensis. By employing principal component analysis to select laser scanner-related parameters, canopy transmittance, and multispectral image information, a random forest regression model was used to estimate the dieback rate, resulting in a coefficient of determination R2 of 0.8289. Zhao et al. [48] monitored the vertical distribution of forest insects and diseases using airborne hyperspectral LiDAR (AHSL) combined with a three-dimensional radiative transfer model, LESS. AHSL provided both structural and spectral information on the forest, enabling the detection of damage throughout the canopy and achieving good classification accuracy in the mid and lower canopy layers. Brent W et al. [49] paired tree objects with on-site observed trees using laser scanning point-cloud segmentation techniques. Through a random forest classifier, trees were classified into four categories: asymptomatic, live, Armillaria-infected, recently dead, and dead. The classification accuracy of live and dead tree objects was the highest, with an overall accuracy of 95.3%. Sa et al. [50] utilized UAV-acquired multispectral and LiDAR data along with ground-based measurements to extract sensitive features using variance analysis. They then constructed a severity identification model for larch caterpillar infestation using random forest and support vector machine models. The study found that the normalized difference greenness index (NDGI) and the 25% height percentile of LiDAR features were the most sensitive, serving as important features for identifying larch caterpillar infestation severity. Yang et al. [51] evaluated the degree of decline in protective forest belts on desert oasis farmland using a combination of airborne hyperspectral cameras and ground-based laser scanning. By employing machine learning techniques, they found that the laser scanner structure-variable model outperformed the hyperspectral feature-variable model in overall accuracy for identifying forest decline. Furthermore, the model combining airborne hyperspectral cameras with laser scanning outperformed the single-sensor evaluation model.
In summary, UAV multispectral data in the red, red-edge, and near-infrared bands are more sensitive, containing high-quality information that can be used to differentiate vegetation health status. Meanwhile, UAV LiDAR is capable of accurately measuring forest structural characteristics and exhibits a strong correlation with tree canopy information [52]. Combining these two technologies helps in obtaining canopy reflectance in the horizontal direction and enhancing structural information in the vertical direction for forest monitoring.
The Three-North Shelter Forest Program in China establishes artificial ecosystems in ecologically fragile areas, yet it remains inherently constrained by severe natural conditions [53]. The harsh terrain, limited selection of tree species, and weak technological and economic foundations objectively contribute to the instability of ecological achievements, resulting in varying degrees of degradation in the Three-North Shelter Forest Program. Currently, there is limited research on the identification of canopy damage in artificial shelterbelts within complex agricultural production environments. Hence, the primary objectives of this study are as follows:
  • To construct different machine learning and deep learning models, exploring models with optimal accuracy in identifying damaged and healthy canopy distributions in farmland shelterbelts.
  • To analyze the impact of image fusion with different spectral gradients and LiDAR elevation features on classification accuracy using various feature-fused images.

2. Materials and Methods

2.1. Study Area

The research area is located in the 6th Company of the 21st Regiment of Tiemenguan City, 2nd Division of the Xinjiang Production and Construction Corps, Bayingolin Mongolian Autonomous Prefecture, Xinjiang Uygur Autonomous Region (42°7′54″ N, 83° 23′59″ E). It is located in the Yanqi Basin at the southern foot of the Tianshan Mountains, belonging to the Kongque River Basin, with an altitude of about 1006 m (Figure 1a,b). Its main terrain is plains, and it has a continental temperate desert climate [54]. The annual average temperature is 8.6 degrees Celsius, with a frost-free period of about 177 days and average annual precipitation of 59.2 mm. It is suitable for planting crops such as wheat and sugar beet. The forest resources in this area mainly consist of artificial farmland shelterbelts dominated by Populus bolleana. In this region, the degradation of shelter forests caused by the Anoplophora glabripennis beetle is showing a gradually increasing trend (Figure 1c–f).

2.2. Data Acquisition and Preprocessing

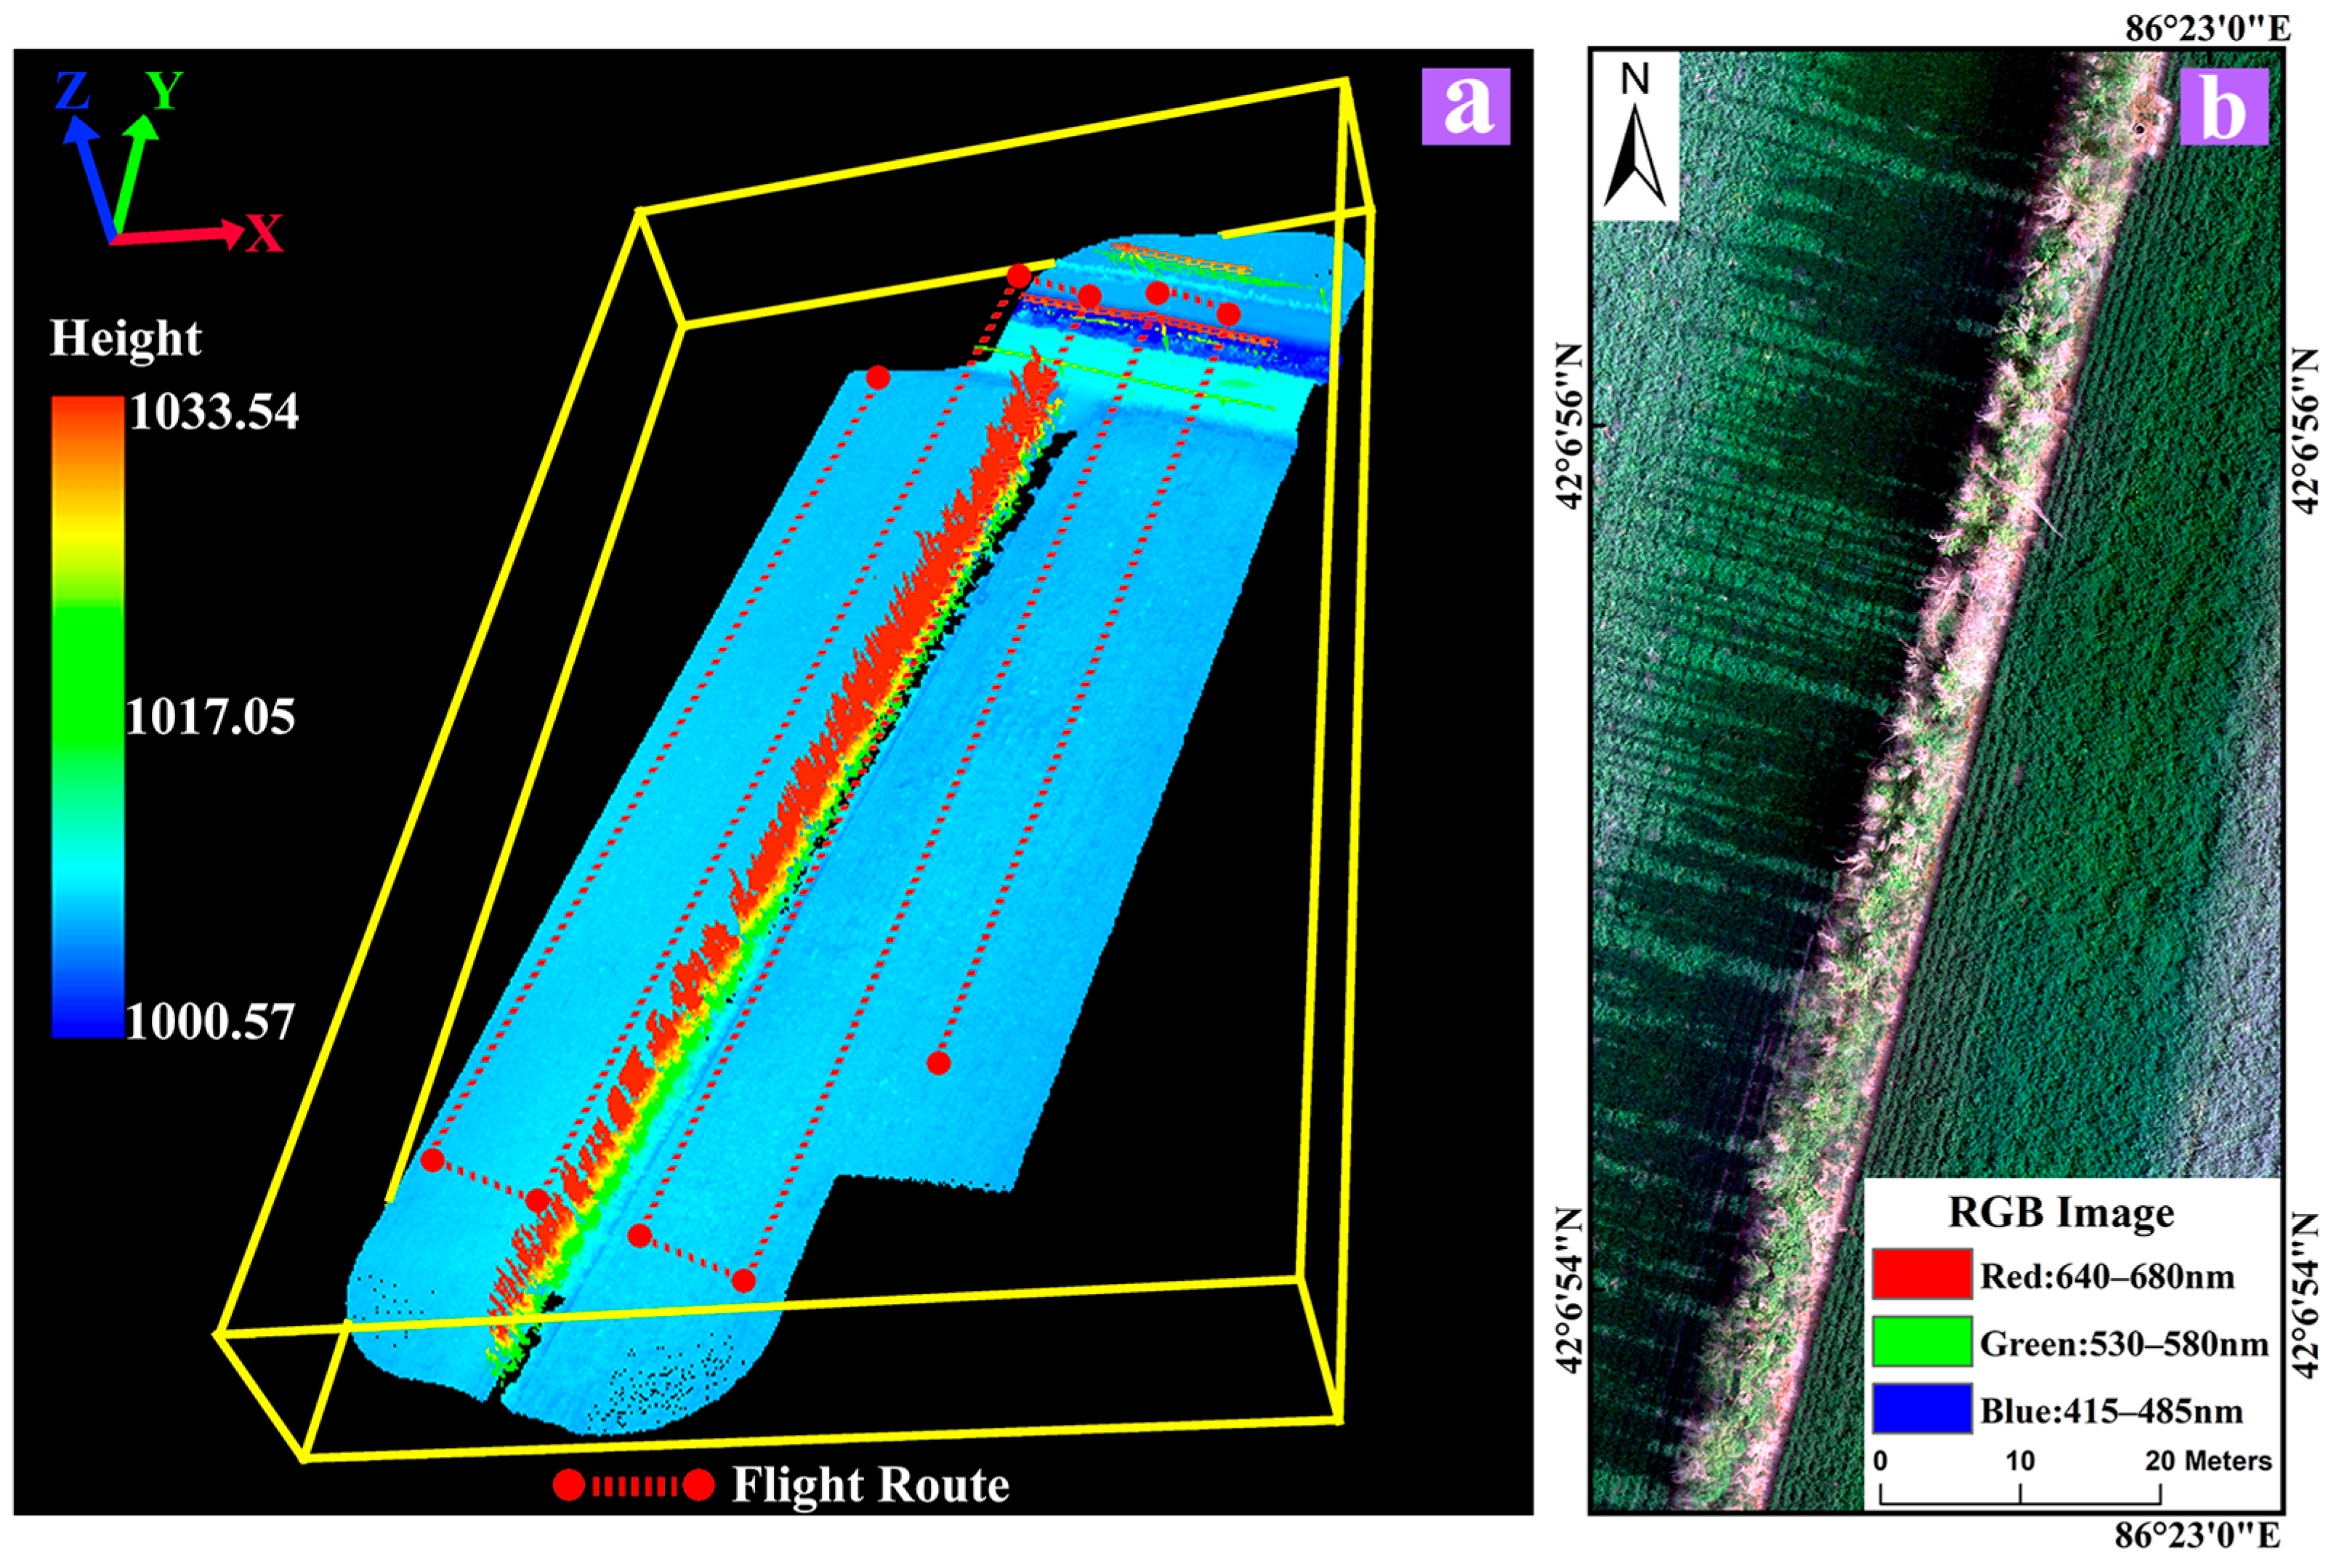
2.2.1. UAV Data Acquisition

On 15 August 2023, heavily degraded shelterbelt plots severely affected by the Anoplophora glabripennis beetle were selected as the experimental areas. This study utilized the DJI Matrice M300 RTK unmanned aerial vehicle (Shenzhen Dajiang Innovation Technology Co. Ltd., Shenzhen, China) (Figure 2a) with a maximum flight time of 55 min and a top speed of 23 m/s, capable of withstanding wind speeds of up to 15 m/s (Beaufort scale 7). The UAV was equipped with a YUSENSE MS600 Pro multispectral sensor (Changguang Yuchen Information Technology and Equipment (Qingdao) Co. Ltd., Qingdao, China) (Figure 2b) featuring six 1.2-megapixel multispectral channels (Table 1), capturing data in the form of multichannel .jpg grayscale images. The LiDAR sensor used was the DJI Zenmuse L1 (Figure 2c), capable of single-return data rates of up to 240,000 points/second and multi-return rates up to 480,000 points/second, with real-time heading accuracy of 0.3° and attitude accuracy of 0.008°. The IMU data frequency was 200 Hz. LiDAR data acquisition occurred at 12:00 Beijing time, and multispectral data acquisition occurred at 16:00 on the same day under clear weather conditions with wind speeds below 1 m/s. The UAV operated at an altitude of 50 m, following a vertical zigzag flight path (Figure 3a) set using the DJ Pilot2 V7.0.2.5 software on the remote controller, conducting autonomous aerial photography at regular intervals (Figure 3b). The flight plan was configured with an 80% overlap in the flight direction and a 70% sidewise overlap.

2.2.2. Ground Survey Data

Due to the non-vertical growth of Populus bolleana, certain portions of the canopy in the orthophoto map captured by the UAV may extend over bare ground and adjacent farmland, rather than being entirely contained within the shelterbelt area. In order to ensure the integrity of forest stand data and explore the influence of actual agricultural production environments on model classification, the study area was set to include all areas within a 2.5 m buffer zone from the edge of the shelterbelts.
First, the study area was surveyed on the ground using field reconnaissance and handheld laser rangefinders (Shendawei Technology (Guangdong) Co. Ltd., Dongguan, Guangdong, China). The land surface in the study area was classified into four categories, tree trunk base outlines, bare land, weeds, and crops, resulting in a land use type map of the study area. Subsequently, the UAV ortho-aerial images were overlaid with the land use type map. Horizontal-plane canopy contours were extracted by human–computer interactive visual interpretation, and damaged and healthy canopies were classified. Finally, the horizontal-plane forest stand measurements of five categories, including withered canopy, healthy canopy, bare land, weeds, and crops, were obtained as the validation set for this study.

2.2.3. Data Preprocessing

Pix4D Mapper (Pix4D SA, Prilly, Switzerland) is an image-processing software capable of processing image data captured by UAVs into high-precision 3D maps, models, and measurement results [55]. It supports various image data formats, automatically matches similar points between adjacent images, accurately calculates the position and orientation of each pixel in three-dimensional space, and performs orthorectification and stitching. In this study, the automatic image quality assessment function of Pix4D Mapper was utilized, with 1086 images participating in the calibration process. Among them, 1080 images were successfully calibrated, achieving a success rate of 99%. Six low-quality images were automatically excluded from the calibration process. The dense point-cloud generation was set to high-quality mode to minimize noise during densification. The minimum number of feature point matches was set to 3, and texture was applied in the orthoimage application of the mapping mode option. Subsequently, aerial triangulation of the point cloud was conducted and the control points were automatically matched, resulting in the acquisition of six-band digital orthophoto maps (DOMs) and a digital surface model with a spatial resolution of 3.67 cm.
DJI Terra and LiDAR360 (Beijing Green Valley Technology Co. Ltd., Beijing, China) are professional pieces of software for processing Light Detection and Ranging (LiDAR) data. The process of creating digital surface model based on LiDAR involves preprocessing L1 LiDAR data through the DJI Terra platform [25]. The point-cloud density is set to the original sampling rate, and 100% of the point cloud is used for processing, with the effective distance of the point cloud set to 300 m, and the output format as LAS data. Subsequently, LiDAR360 [56] is employed for point-cloud filtering to remove noise. We utilized the automatic calculation of the search radius in LiDAR360 V4.0 software, with the relative error (sigma) as the denoising criterion. Points within the search radius with fewer than 4 points were considered isolated and were removed. Following this, the ArcScene 10.8 platform was utilized for terrain classification and the LAS dataset-to-raster conversion of point-cloud data. To ensure spatial consistency among different remote sensing data sources, we generated a DSM based on LiDAR data with a resolution of 3.67 cm, matching the spatial scale of the multispectral data [57,58].
We compared the DSM derived from Digital Aerial Photogrammetry (DAP) (Figure 4a) based on optical imagery with those from LiDAR data (Figure 4b). The DSM data generated from DAP exhibited distinct striping, artifacts, and coherence issues in densely vegetated areas, failing to accurately represent elevation in low-canopy-cover regions and lacking complete tree canopy reconstruction. The LiDAR-derived DSM closely matched actual conditions, with DAP missing canopy data in many areas where LiDAR data were successfully collected. Optical imagery, generated through photogrammetric techniques, relies on contrast and brightness differences between pixels for height information retrieval. The unique characteristics of Populus bolleana pose challenges for photogrammetric image matching, as continuous coverage ensures accurate reconstruction [59]. The gaps within the degraded canopy of Populus bolleana exhibit steep and intricate surfaces [60]. This abrupt vertical variation, coupled with diverse height changes in the canopy, results in occlusion phenomena that disrupt image matching [59]. Additionally, the tall stature of Populus bolleana, coupled with leaf fluttering and branch swaying, may also affect feature matching. Furthermore, the study area (Figure 4c) being farmland shelterbelts with surrounding crops exhibiting texture features and spectral reflectance similar to canopy layers further decreased the modeling accuracy of DAP point clouds. LiDAR directly measures ground surface height by emitting laser pulses and measuring their return time, providing high-precision elevation data unaffected by lighting conditions. While optical imagery may suffer from decreased quality and adhesiveness in DSMs due to low brightness and shadowed areas, LiDAR remains unaffected by lighting conditions, resulting in significantly higher accuracy of DSMs generated by LiDAR compared to those generated by DAP optical methods, consistent with previous research by Megan et al. [61].

2.3. Research Methodology

2.3.1. Composition of Feature Fusion Images

Visible-light true-color images consist solely of the red, green, and blue bands. The near-infrared (805–875 nm), red-edge band 1 (710–730 nm), and red-edge band 2 (735–765 nm) of multispectral sensors are more sensitive to chlorophyll in forestry remote sensing. Artificial farmland shelterbelts exhibit complex environmental characteristics. To distinguish the differences in classification results between visible-light images and fused images with added spectral gradients (near-infrared and red-edge bands), this study used different bands of the multispectral sensor to produce RGB images (R, G, B) and MSI images (R, G, B, Nir, Re1, Re2).
To further explore the correlation between canopy identification and ground interference features, additional feature variables need to be added. Significant height differences exist between tree canopies and ground interference objects. By employing DSM data generated by LiDAR, which provides finer expression of changes in object height, for feature fusion, the aim is to enhance height expression capabilities for better capturing the spatial features of objects. Therefore, in this study, DSM data were separately fused into the fourth band of RGB images and the seventh band of MSI images, resulting in DSM + RGB images and DSM + MSI images with height expression information and different gradient spectral features (Figure 5).
After creating the feature fusion images, masks were extracted based on the research vector boundaries. Low-pass-filtering tools were then applied to the RGB images, MSI images, DSM + RGB images, and DSM + MSI images to reduce salt-and-pepper noise. The filtered images were used for classification, and the identification results were verified for accuracy using manually collected ground survey vector data. Furthermore, the identification effectiveness of damaged canopy distribution in shelterbelts using fusion images with different gradient spectral features and height features was analyzed.

2.3.2. Samples and Classifiers

We compared the canopy health conditions using TensorFlow deep learning and three traditional classifiers: random forest, support vector machine, and maximum likelihood classification. The TensorFlow model utilized a U-Net architecture based on Ronneberger, Fischer, and Brox [62,63], as depicted in Figure 6. In this study, the patch size was set to 464, and four feature fusion images with band numbers of 3, 4, 6, and 7 were used for training. The number of epochs was set to 25.
We delineated five land cover types into equally distributed and randomly positioned Regions of Interest (ROIs) with an area of 0.04 m2 each. The ROIs were divided into training and validation sets in a 7:3 ratio to reduce spatial correlation between the training and validation datasets. The total numbers of ROIs selected were 40, 60, 80, 100, 120, and 140 for testing the classification on MSI images. All four methods exhibited accuracy saturation as the sample size increased, with further increases in sample size resulting in diminishing returns on accuracy improvement. Therefore, in this study, we ultimately set the number of training ROIs to 100 and validation ROIs to 40. During accuracy validation, the classification results were reclassified into three classes: withered canopy, healthy canopy, and others.
Figure 6. Deep learning U-Net architecture schematic.
Forests 15 00891 g006

2.3.3. Accuracy Evaluation Methods

The Kappa coefficient [64] serves as a validation metric for the classification accuracy of simulated results, with its calculation formula depicted in Equation (1).
K a p p a = P o P c P p P c
where Po is the proportion of correctly simulated results; Pc is the expected proportion of correctly simulated results under random conditions; and Pp is the proportion of correctly simulated results under ideal classification conditions, with a value of 100%. If two images are identical, the Kappa coefficient equals 1. A Kappa coefficient greater than or equal to 0.75 indicates high consistency and good simulation accuracy [65]. A Kappa coefficient of less than or equal to 0.4 indicates poor consistency, high differences between the two images, and lower simulation accuracy.
The Kappa coefficient can effectively represent the classification accuracy of a model, but their values may be influenced by an abundance of certain classes in the overall dataset and may not adequately characterize each class. Therefore, other metrics still need to be selected to aid in accuracy verification. The confusion matrix (Table 2) statistically categorizes the model’s classification results, listing the numbers of correct and incorrect classifications for both the actual values and predicted values. Producer’s accuracy (PA) [66] refers to the ratio of the number of samples in a category correctly identified by the classifier to the actual total number of samples in that category in the classification result. It measures the accuracy of the classifier’s ability to classify or discriminate a category, and a high producer’s accuracy indicates that the classifier is able to identify the category better (see Equation (2)). User’s accuracy (UA) [67], on the other hand, refers to the proportion of samples correctly identified by the classifier for a specific class out of the total samples classified as that class by the classifier in the classification results. It assesses the ability of the classifier to correctly identify results for the user, with higher user’s accuracy indicating that the classifier’s classification results are more reliable (see Equation (3)).
In this study, three traditional classifiers with a deep learning model are used to classify different featured images, and the accuracy of the classification results is evaluated by the overall accuracy, Kappa coefficient, confusion matrix, producer’s accuracy and user’s accuracy.
O A = T P + T N T P + T N + F P + F N
P A = T P T P + F N

3. Results

3.1. Spectral Reflectance Analysis

From the spectral reflectance distribution chart in Figure 7, it is evident that among the blue, green, and red visible-light bands, the reflectance between healthy canopies and weeds is relatively similar. Hence, relying solely on visible-light bands makes it challenging to differentiate between weeds and a healthy canopy. However, in the near-infrared and red-edge bands, which are more sensitive to chlorophyll, the reflectance difference between a healthy canopy and weeds can be somewhat enhanced. It is worth noting that in the case of farmland shelterbelts adjacent to cultivated land, healthy green crops exhibit similar reflectance characteristics to healthy canopies within the near-infrared and red-edge bands.
The near-infrared and red-edge bands can detect the chlorophyll content in plant cell structures. When trees are dehydrated or wilting, the spongy layer on the leaf surface undergoes changes, resulting in higher absorption of radiation energy in the near-infrared and red-edge bands compared to healthy canopies. As a result, withered canopies exhibit lower near-infrared and red-edge band reflectance. The addition of this multispectral information will help to better differentiate withered canopies. In spectral analysis, distinguishing between healthy canopies, crops, and weeds is challenging, while the differentiation between healthy canopies and withered canopies is more apparent.
Figure 7. Spectral reflectance distribution of different land cover types (1. healthy canopy, 2. withered canopies, 3. crops, 4. bare land, 5. weeds).
Forests 15 00891 g007

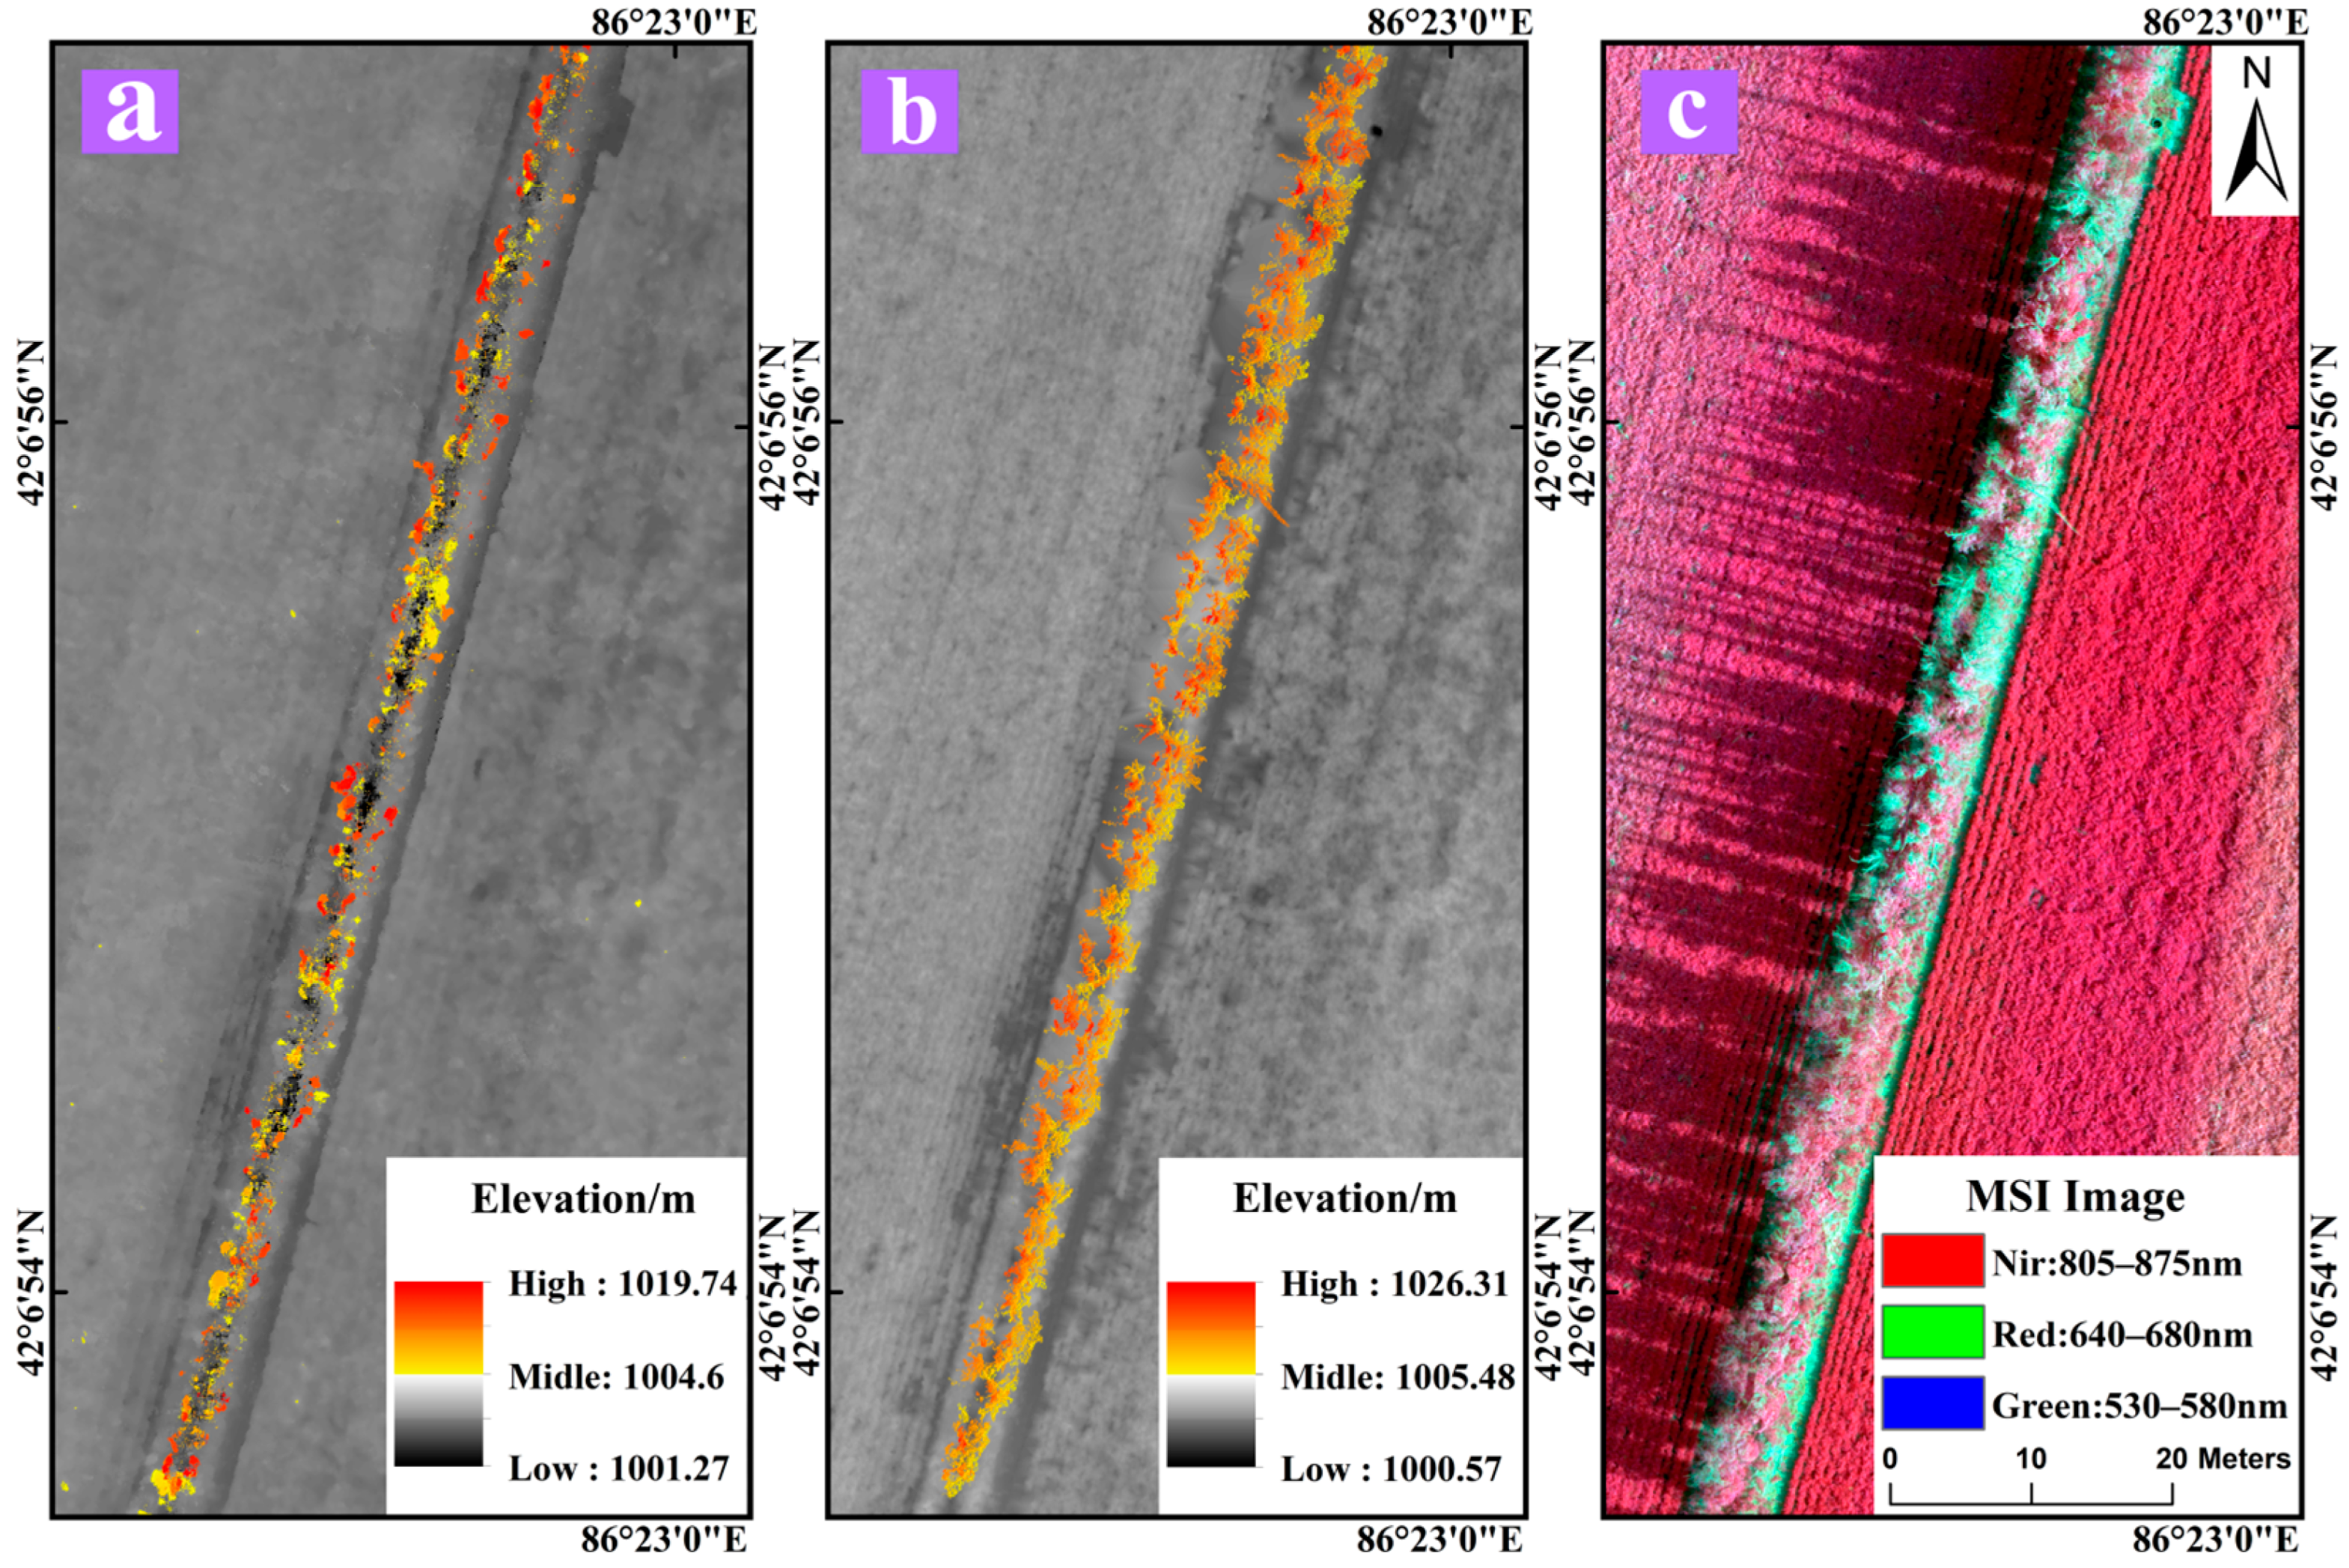
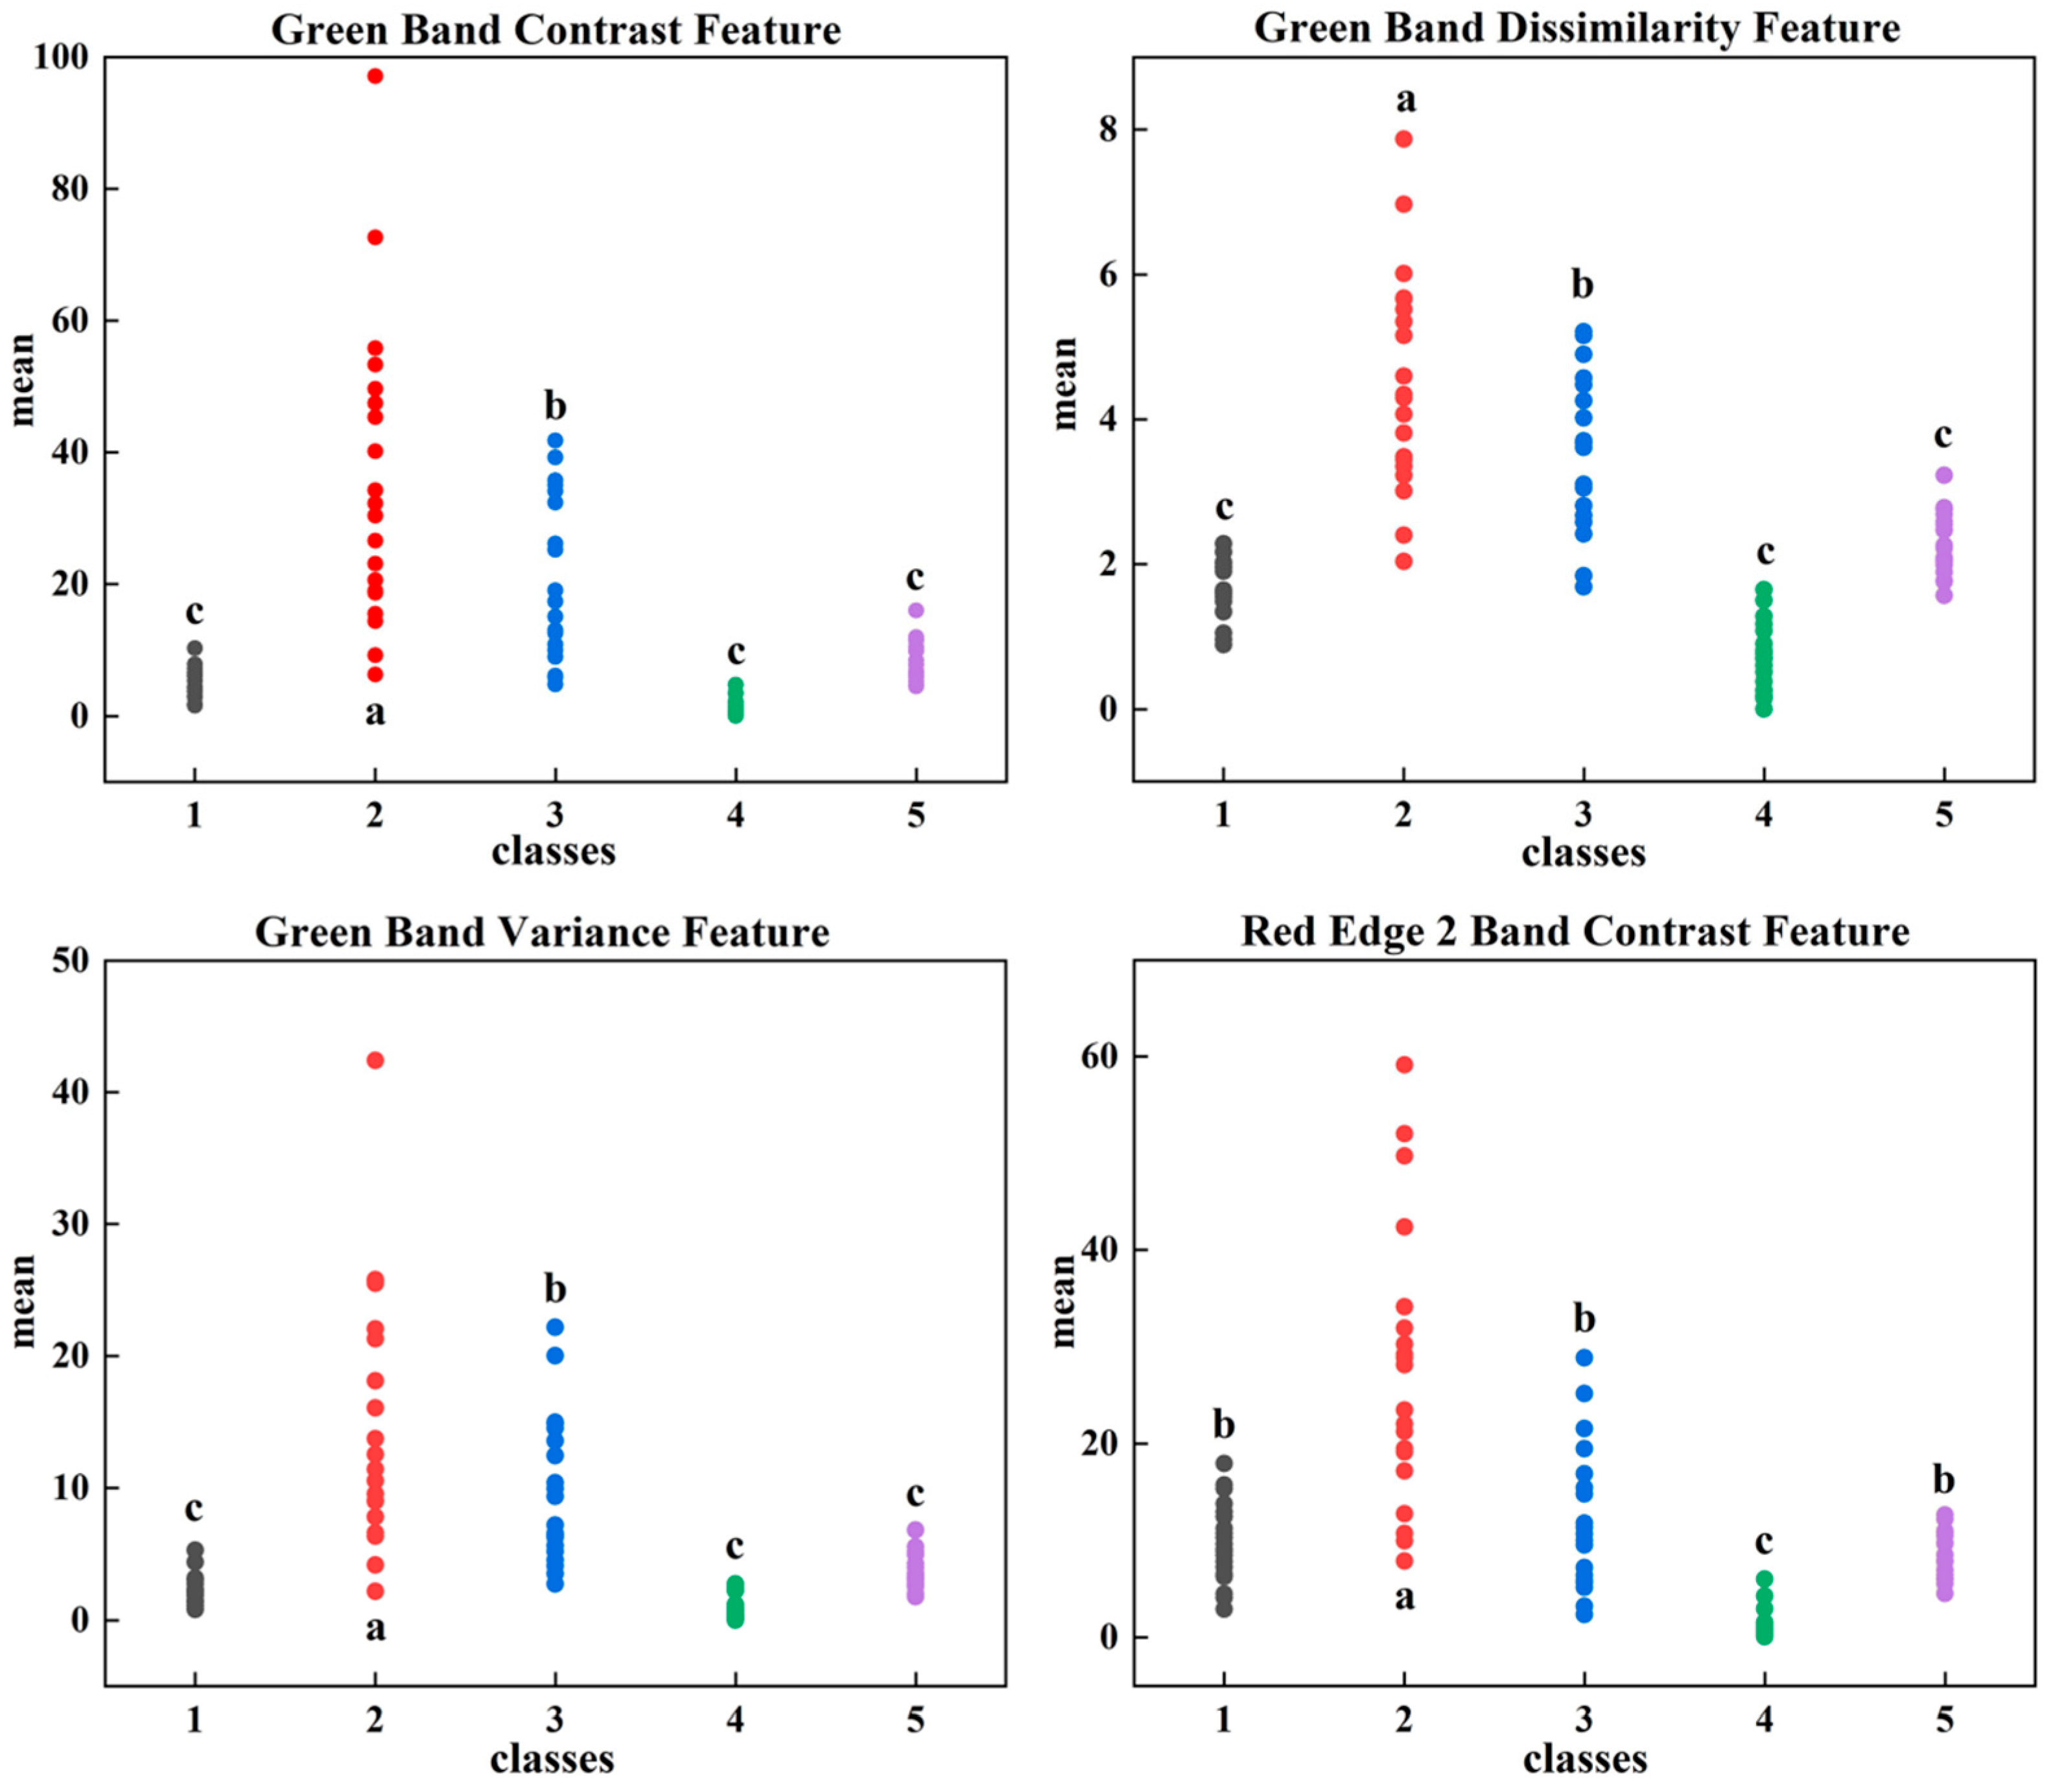
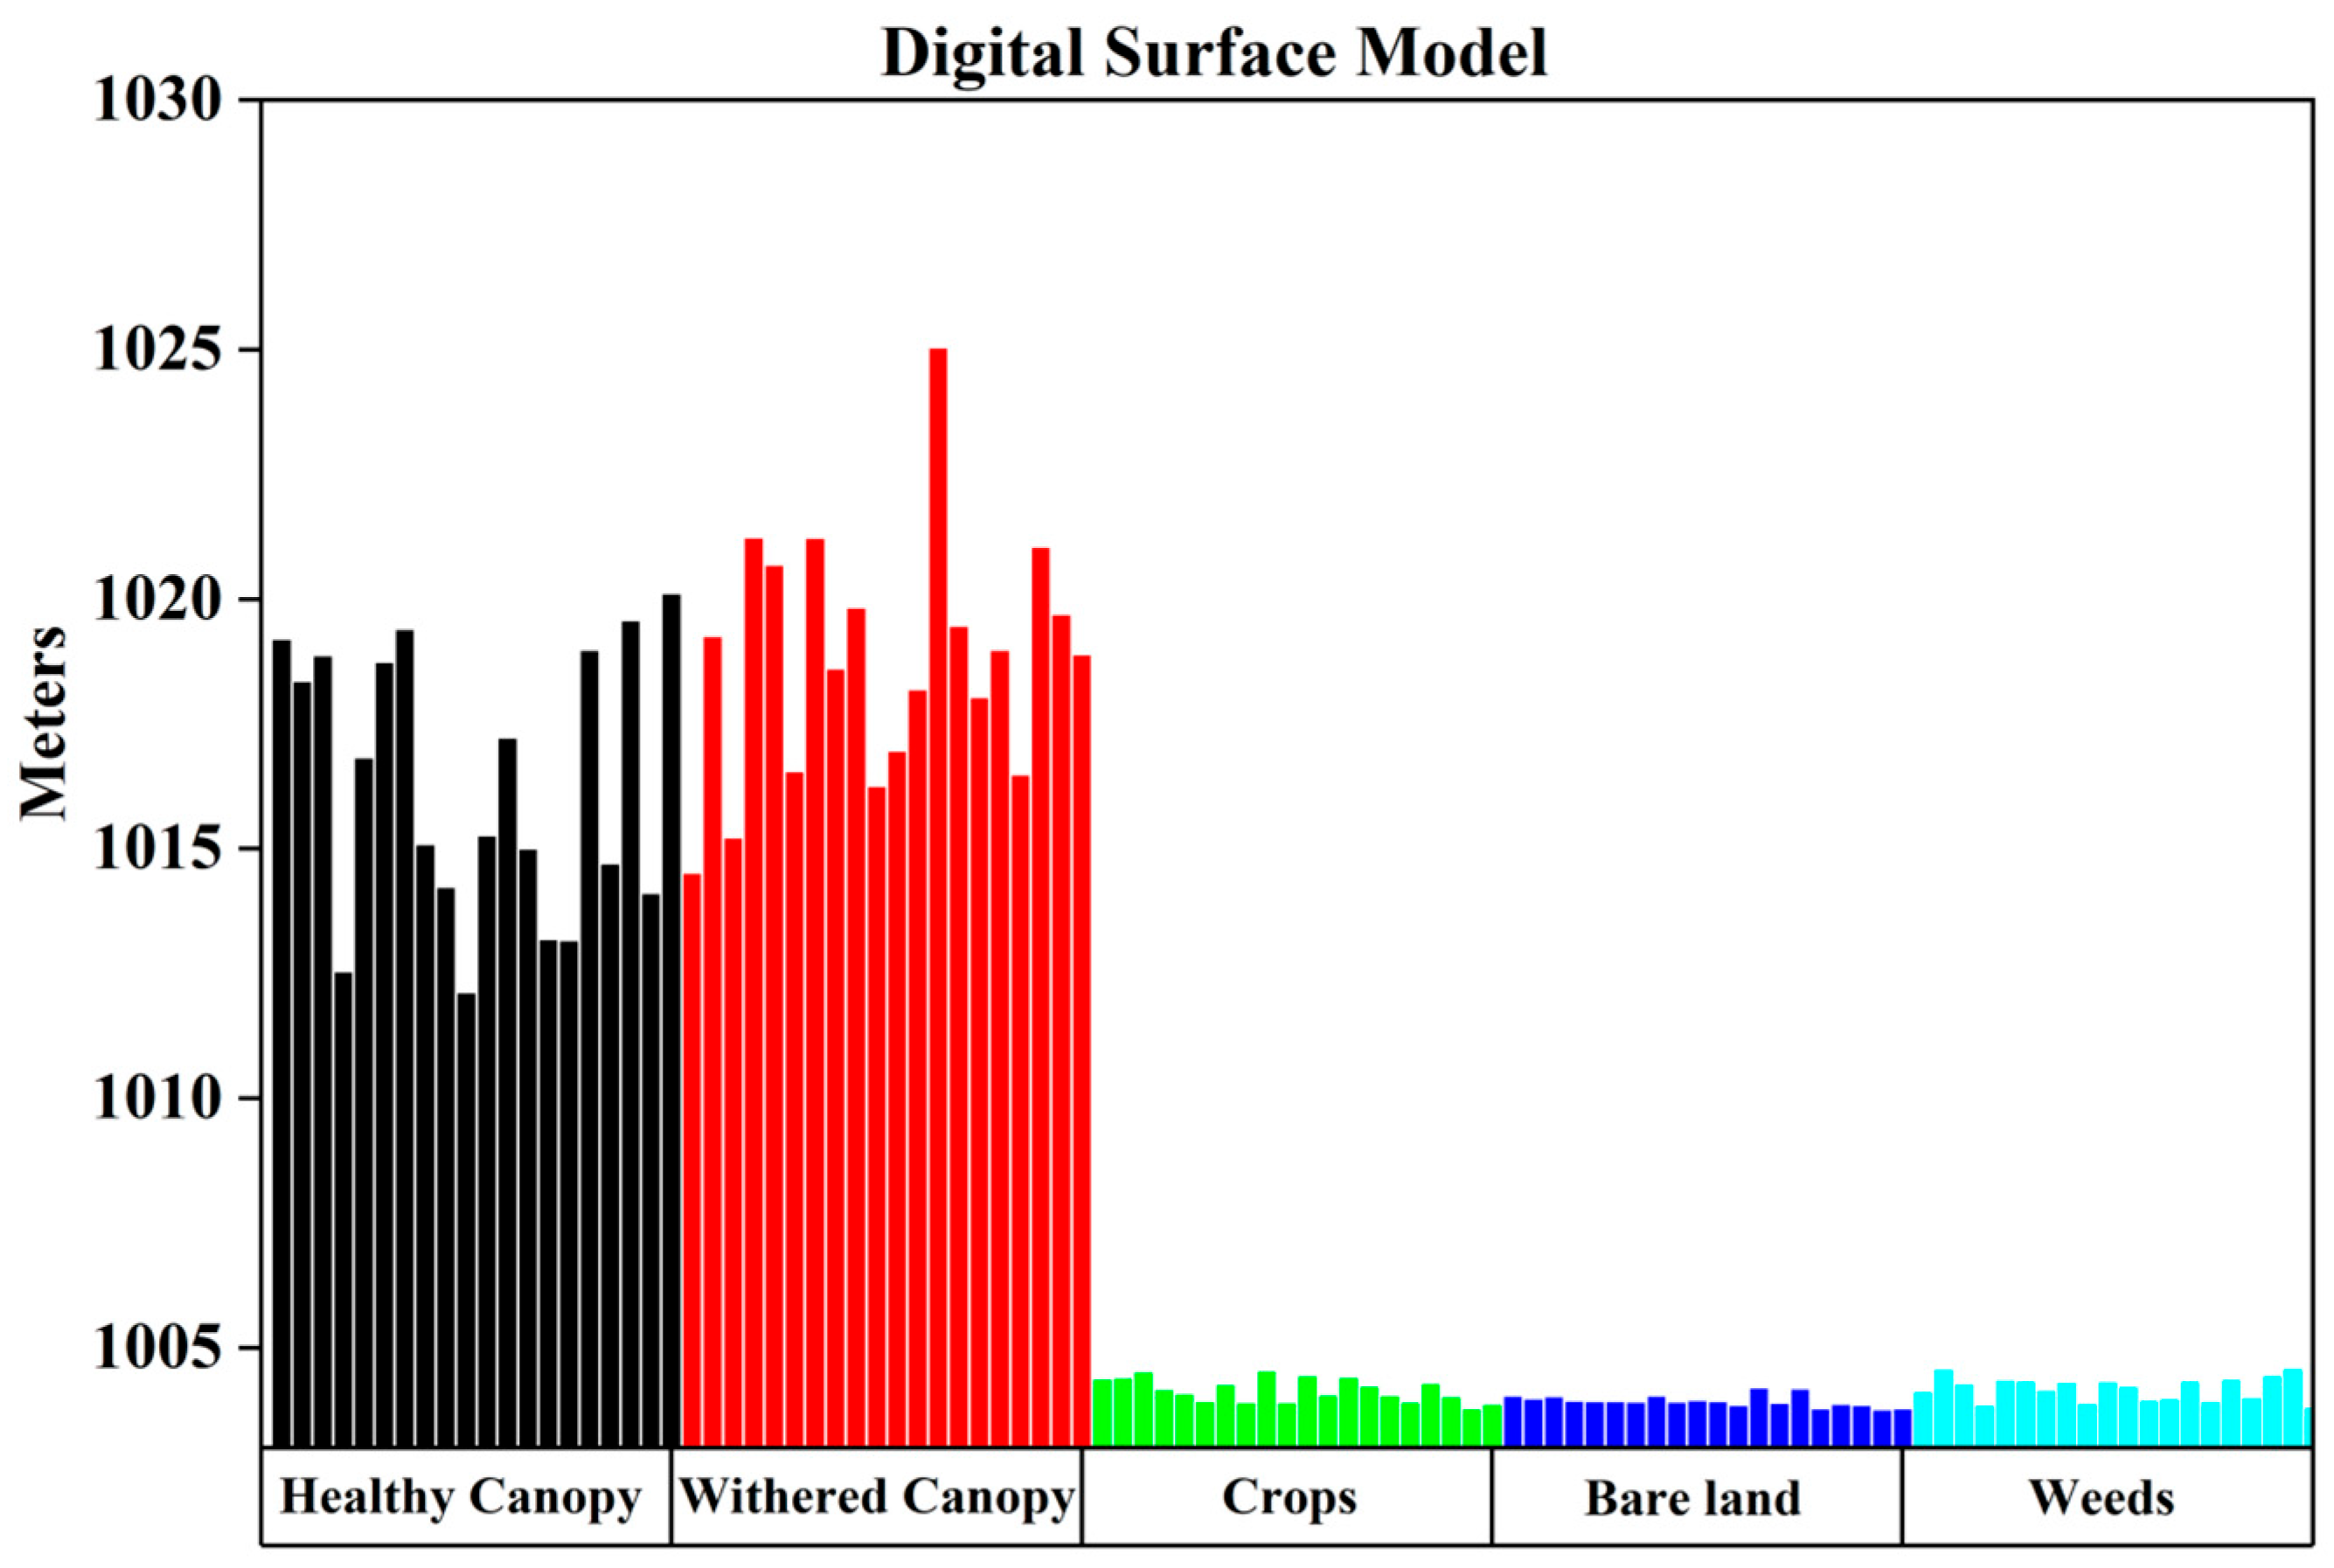
3.2. Texture Features and Elevation Analysis

In image classification, texture features describe spatial variations and grayscale distributions between pixels, reflecting the surface structures and organizational characteristics of objects. By selecting eight texture features, including mean, variance, homogeneity, contrast, dissimilarity, entropy, second moment, and correlation, we further analyzed interfering factors. Through Pearson correlation analysis of these eight texture features across six bands for five land cover types, we identified the top four correlated texture features, which are the variance, contrast, dissimilarity of the green band, and the variance of the red-edge 1 band. These were used to analyze interfering factors in canopy identification (Table 3).
Texture analysis reveals that within the visible-light range, green-band variance, green-band contrast, and dissimilarity show no significant relationships between healthy canopy, weeds, and bare land. The dissimilarity feature of the red-edge 1 band also indicates a lack of significant relationship between crops and healthy canopy texture characteristics (Figure 8).
In the elevation analysis (Figure 9), significant differences in the elevation characteristics among different types of land cover are evident. The heights of the healthy canopy and withered canopy are notably higher, by approximately 10–20 m, compared to bare land, weeds, and crops.

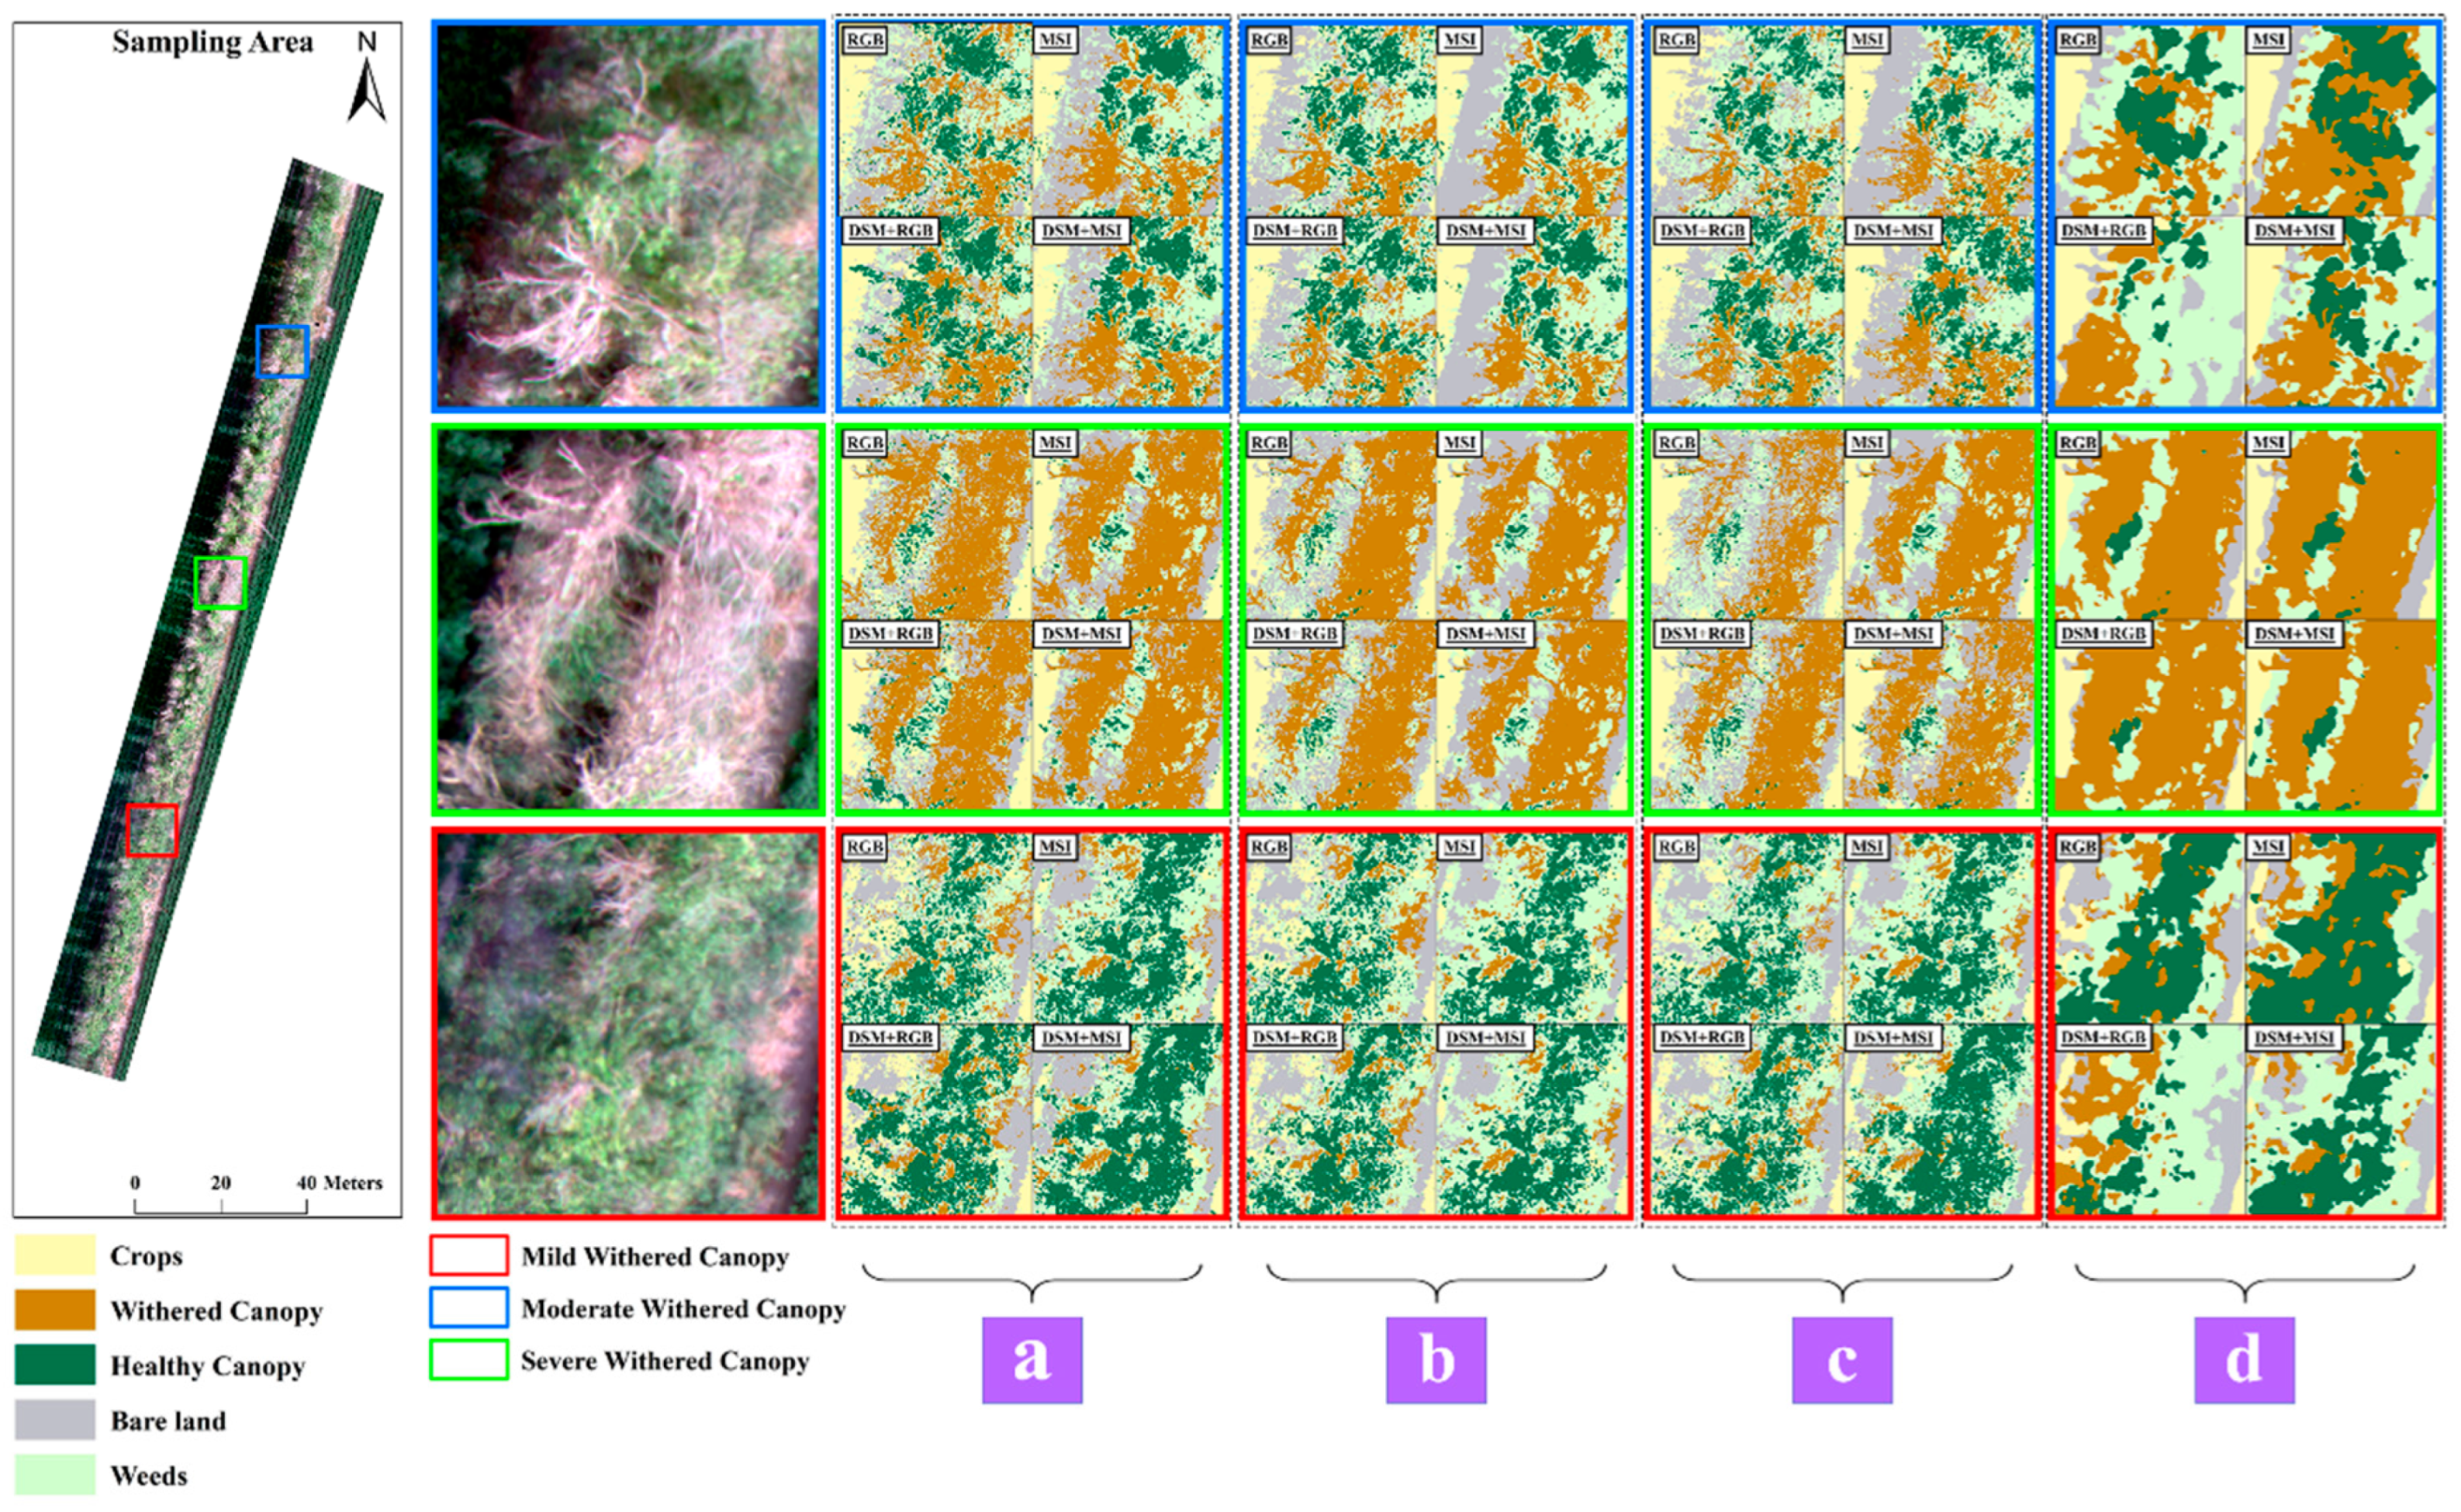
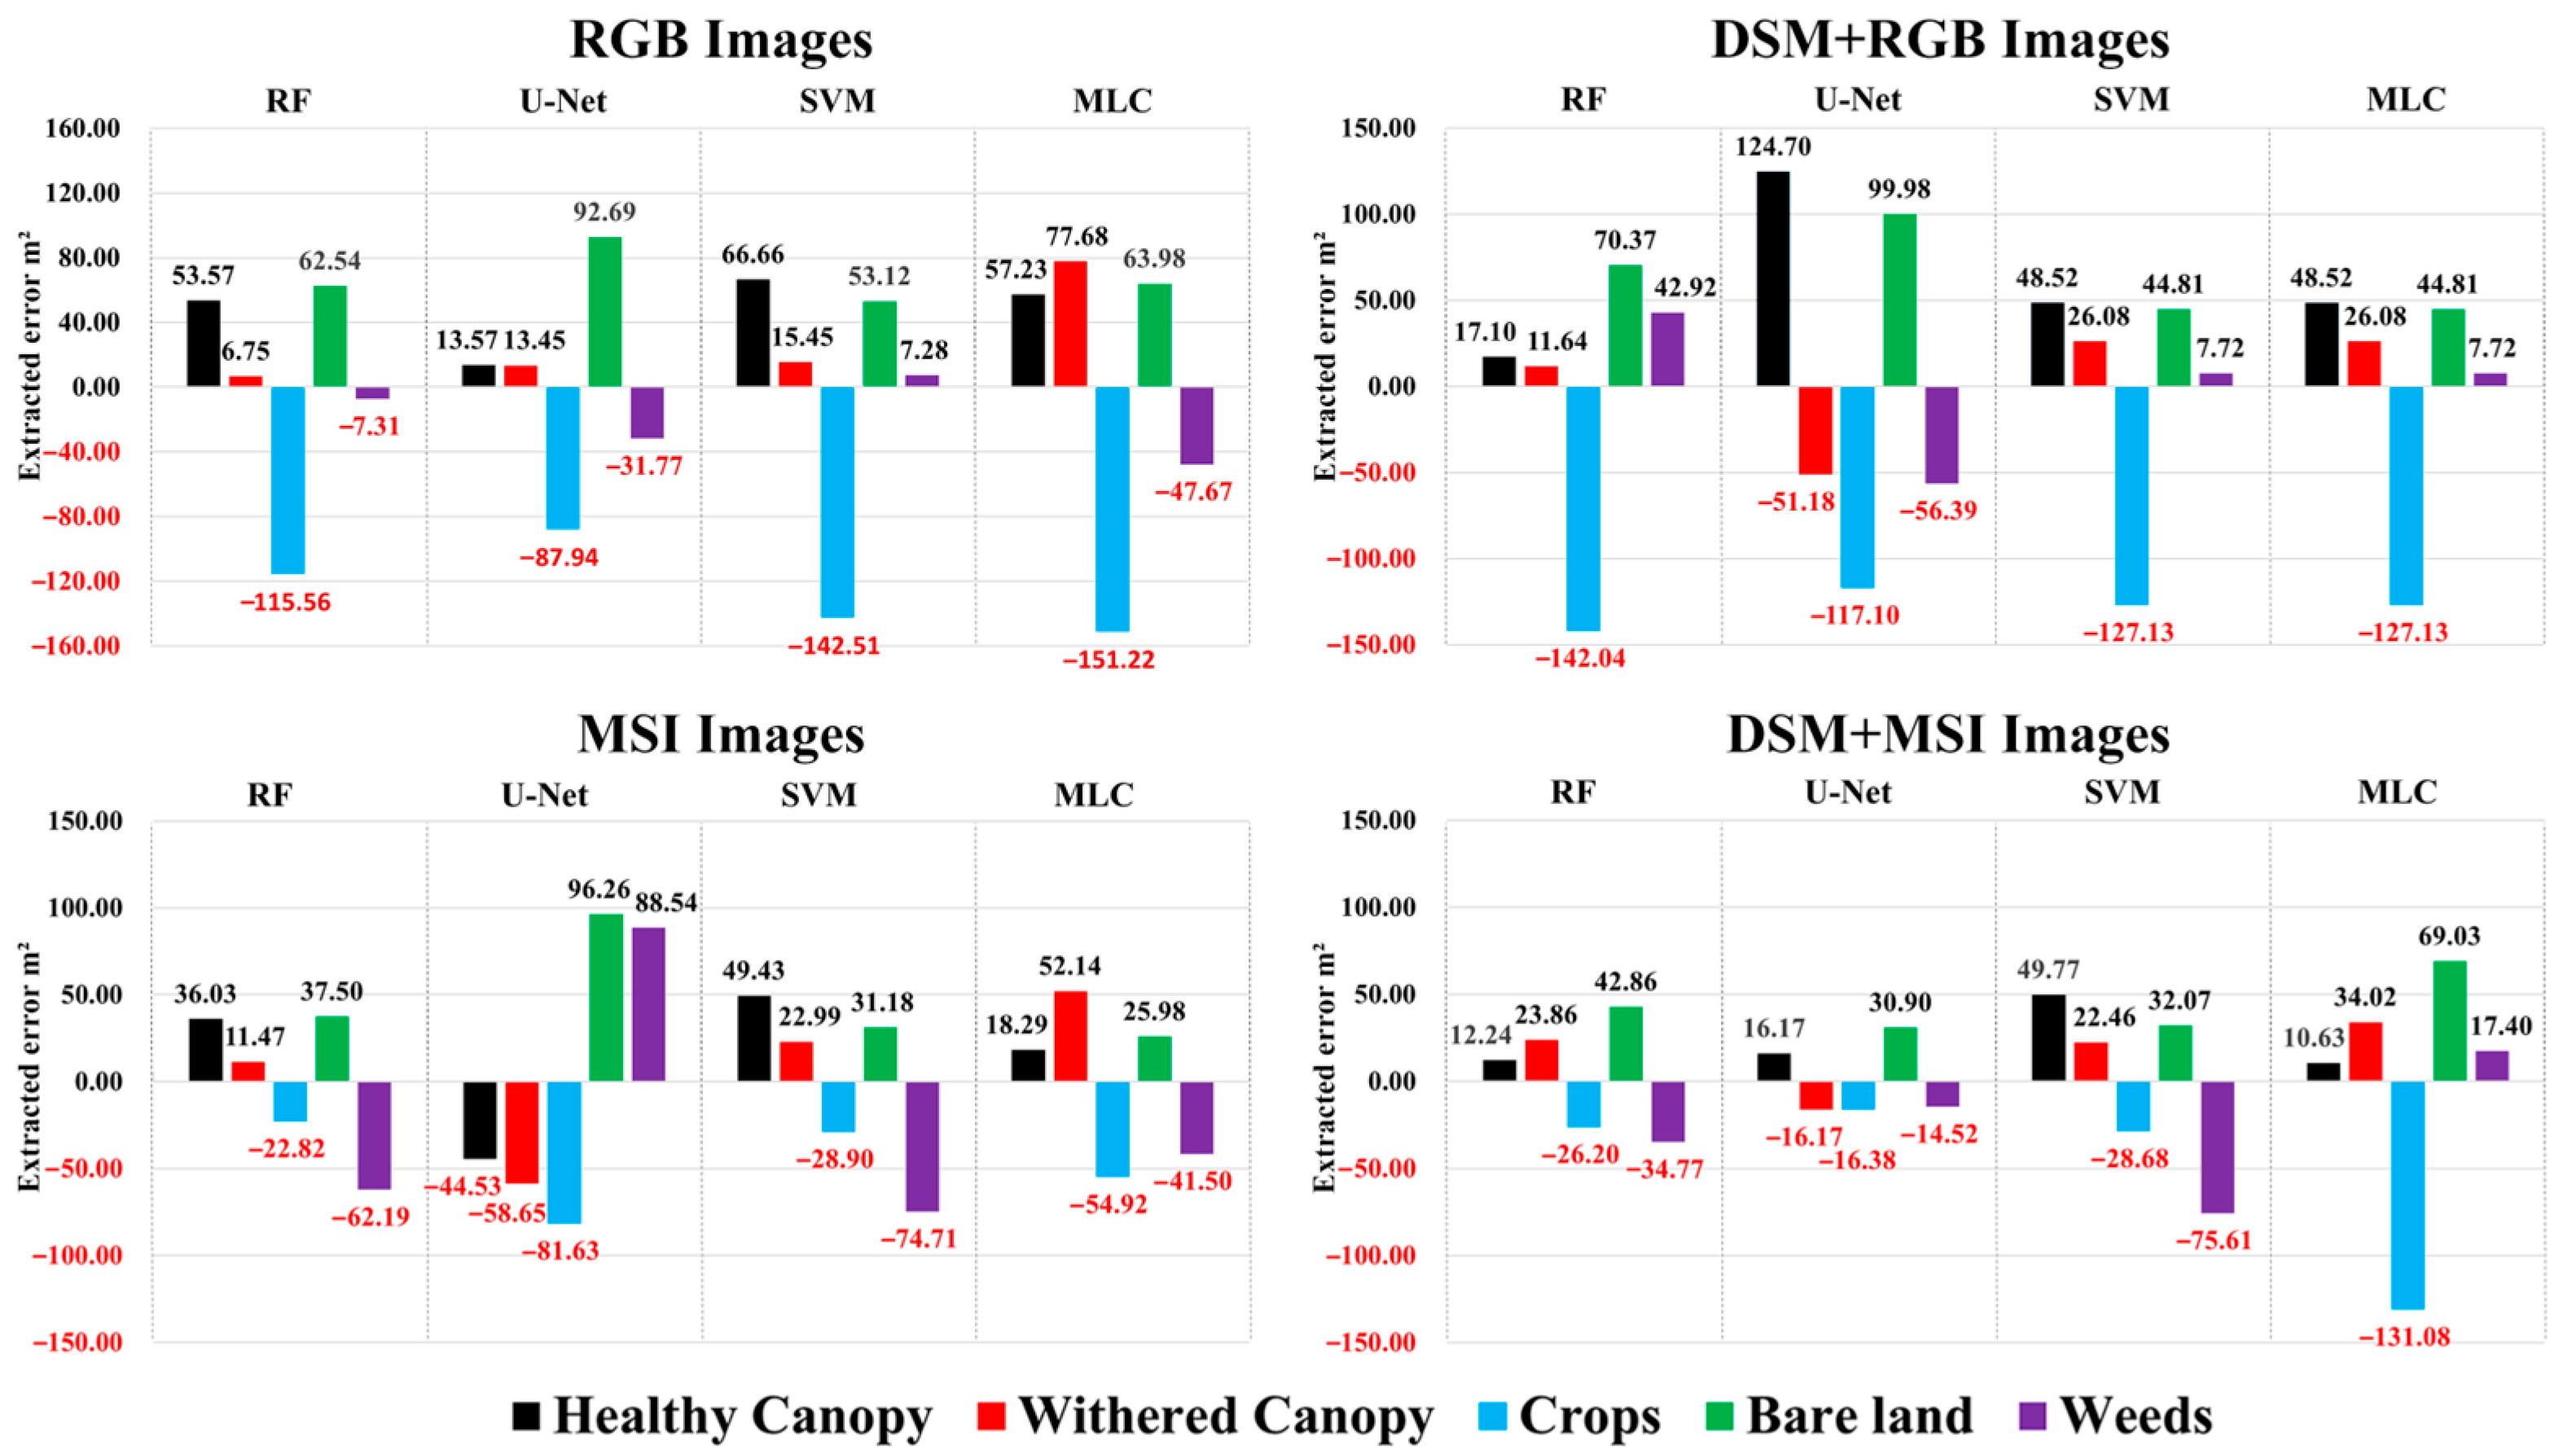
3.3. Classification Result Analysis

Based on ground surveys, the canopy porosity of the sample plot is 0.48, with a total shelterbelts area of 1582.18 square meters. The vertical-projection area of the healthy canopy is 244.96 square meters, while that of the withered canopy is 181.53 square meters. Crops cover an area of 594.09 square meters, bare land 289.05 square meters, and weeds 272.54 square meters. The area extraction results from different images are presented in Table 4, where MLC using DSM + MSI images demonstrates the smallest deviation, with an error of 10.63 square meters for the healthy canopy, closely matching the measured data. For the withered canopy, based on the RF method, DSM + RGB image extraction exhibits an error of 11.64 square meters, which is also close to the actual value.
From the area error extraction of feature fusion images (Figure 10), it is observed that both RGB images and DSM + RGB images, which incorporate elevation information, exhibit significant area deviations in crops and bare land. When near-infrared and red-edge information is added to RGB images, the error in crop area extraction decreases, but there is considerable fluctuation in the area error for weeds, which acts as interference. Furthermore, the addition of near-infrared and red-edge information along with elevation information significantly reduces the absolute value of error in crop and weed area extraction, both considered interference. However, MLC still exhibits a relatively high area error in crop identification.
Figure 11 shows the detailed local classification results. Weeds mainly grow at the edge of shelterbelts and field ridges. In the RGB image classification results, there were cases where healthy canopies were misclassified as weeds, and withered canopies and bare land were misclassified as each other. MSI images, incorporating near-infrared and red-edge spectral information, enhance the spectral reflection characteristics of different green plants, bare land, and dead branches, significantly improving the identification of healthy and damaged canopies.
Under natural conditions, canopies usually extend beyond 2 m above the ground. Due to the elevation differences between the canopy and the ground surface, the DSM + RGB images incorporates elevation information, resulting in significantly improved extraction of healthy canopies compared to RGB images alone. In the identification of disturbance features within forest stands, when comparing the RGB images with the MSI images, the misclassification of bare land as a withered canopy still occurs in areas closer to the forest edges. Additionally, within cultivated areas, crops and shadows from shelterbelt cover result in limited spectral information for fused image classification. As a consequence, there are instances where bare land within forest stands is incorrectly classified as crops.
From the classification results of the DSM + MSI images, it is evident that by adding feature factors, to some extent, the misclassification issue solely relying on MSI and RGB images is overcome, further improving the identification accuracy. However, there are also dead branches, as the area directly below their vertical projection is covered with a large expanse of crops. This leads to the misclassification of the surrounding area of the dead branches as a healthy canopy.
Regarding classification methods, upon comparing traditional classifiers with the deep learning U-Net model, it can be observed that the U-Net model exhibits certain cohesiveness, meaning its ability to depict details at the edges of objects is weaker than traditional classifiers, which retain strong detail preservation capabilities at the edges of objects. However, traditional classifiers may produce small and discrete patches of dirty data in different land classes, a situation significantly less pronounced in the deep learning classification results.
Figure 11. Detailed local classification results: (a) RF classification results; (b) SVM classification results; (c) MLC classification results; (d) U-Net classification results.
Forests 15 00891 g011

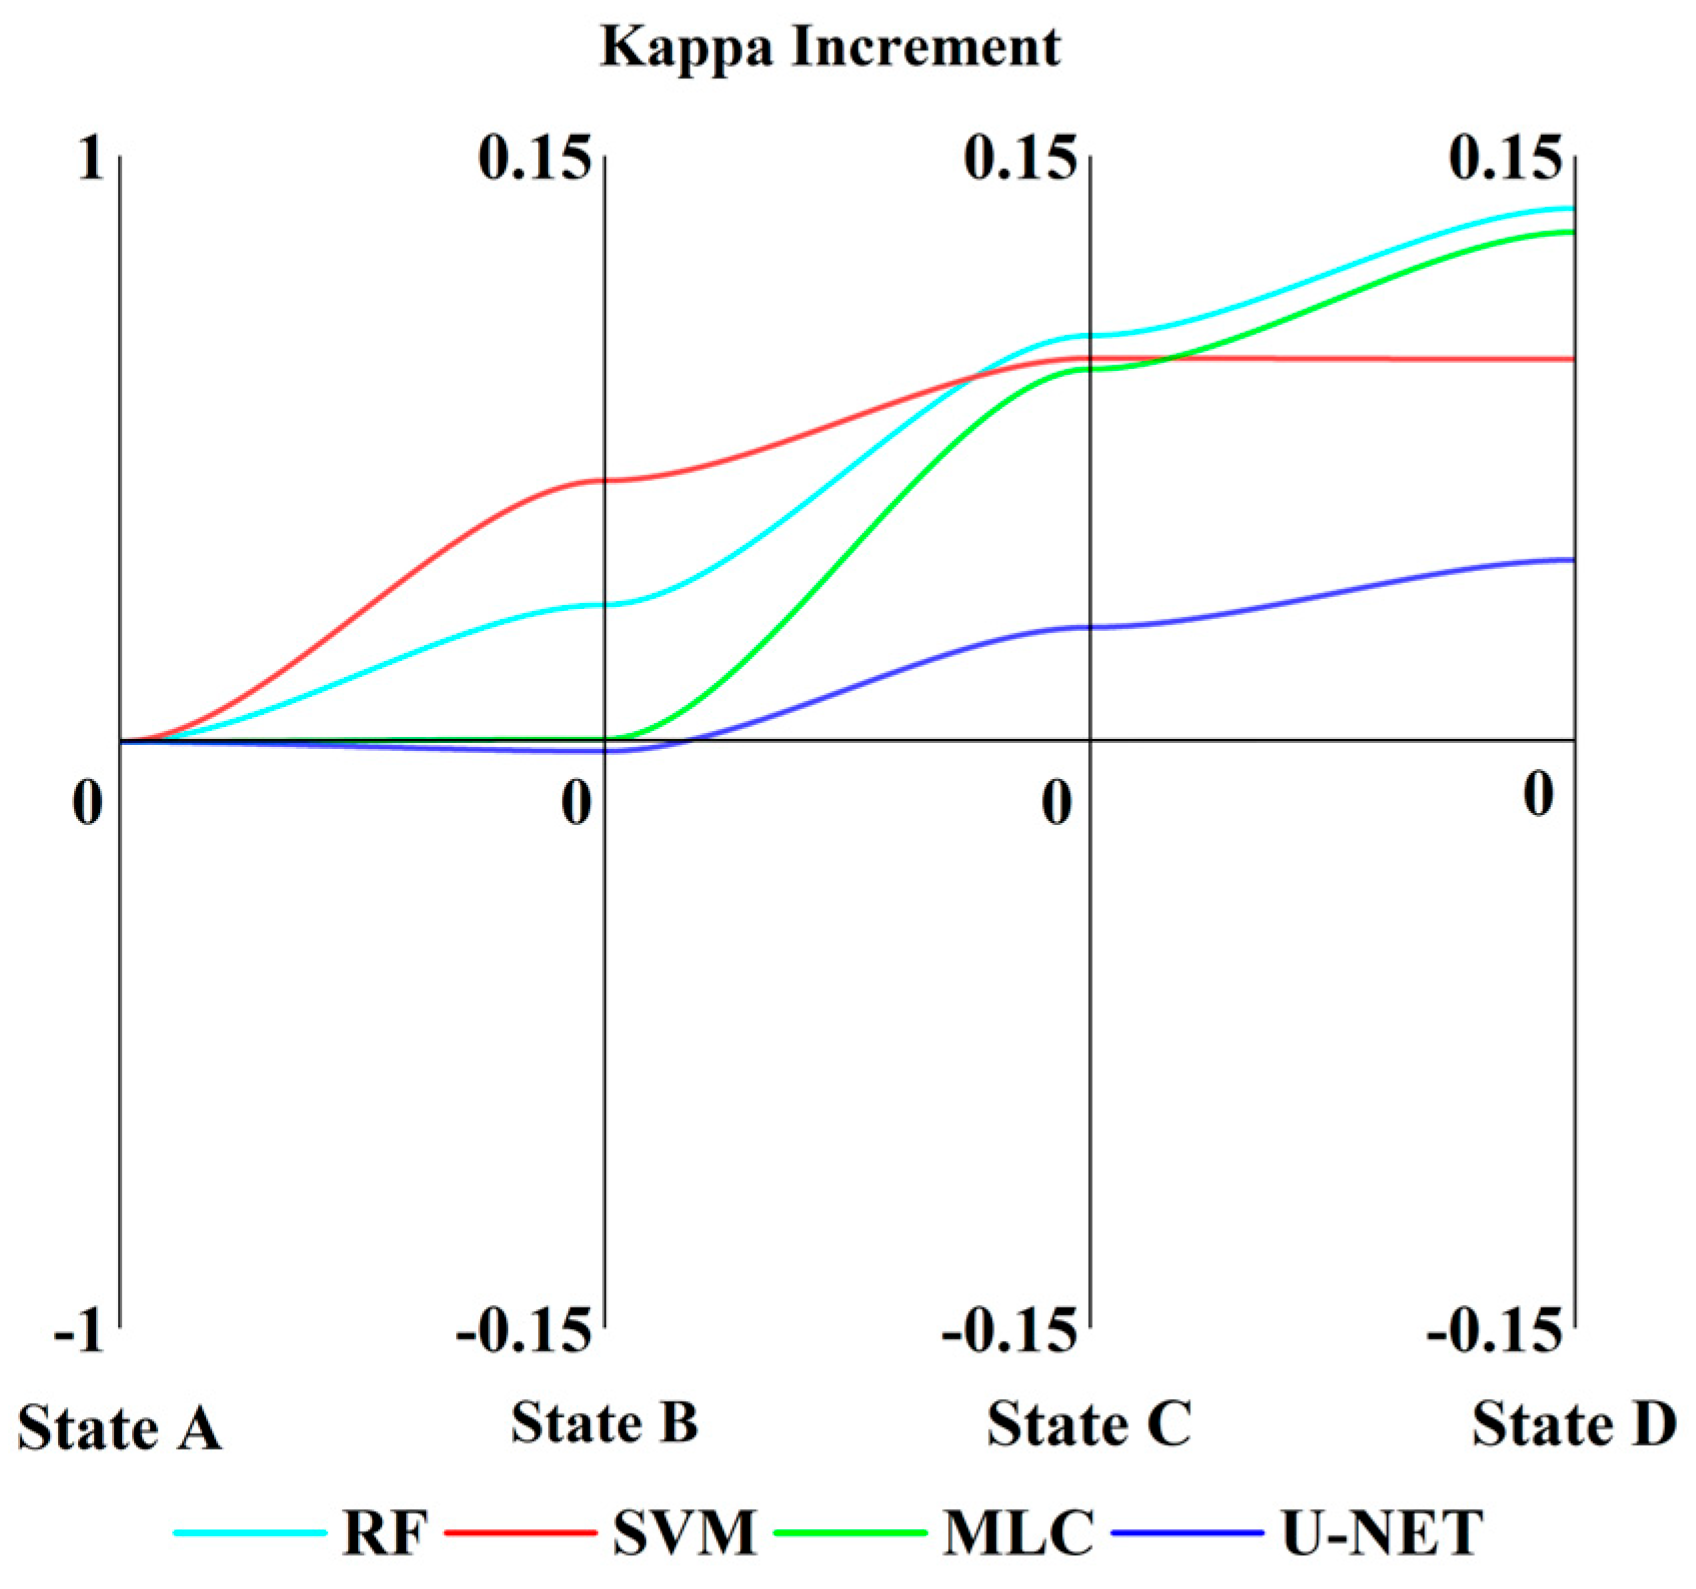
3.4. Comparison of Accuracy of Different Classification Models

In the classification results of traditional classifiers based on various feature fusion images (Table 5), RF exhibits superior classification accuracy compared to the SVM. Notably, MLC demonstrates the poorest performance among the four image classification accuracies. Figure 12 reveals that with an increase in feature information, traditional classifiers exhibit a gradual improvement in accuracy. Particularly, RF achieves the highest kappa coefficient increment of 0.1365 when incorporating DSM and near-infrared along with red-edge feature information into RGB images. Across various traditional classifiers, the increment in accuracy achieved by adding spectral gradients is observed to be higher than that achieved by adding elevation features.
The deep learning U-Net model demonstrates high accuracy even with fewer feature dimensions, with a kappa coefficient of 0.8292 achieved solely from RGB image classification, surpassing the other three traditional classifiers. However, a slight decrease in accuracy is observed in DSM + RGB image classification when incorporating elevation features, resulting in a kappa coefficient reduction of 0.0025. Nonetheless, a significant improvement in accuracy is noted upon adding spectral information. Furthermore, the increment in accuracy upon simultaneously integrating elevation with near-infrared and red-edge spectral gradient features is notably lower than that of traditional classifiers.
Deep learning achieves superior classification accuracy using fewer dimensions compared to traditional classifiers. However, when traditional classifiers are sufficiently supplemented with identifying features, RF demonstrates higher classification accuracy than the deep learning U-Net model under the same training dataset conditions.
Figure 12. Incremental kappa coefficients of image classification results with different feature fusion states (State A: RGB images; State B: RGB images fused with elevation information to form RGB + DSM images; State C: RGB images fused with near-infrared and red-edge spectral information to form MSI images; State D: RGB images simultaneously fused with elevation and near-infrared and red-edge spectral information to form DSM + MSI images).
Forests 15 00891 g012

3.5. Canopy Classification Accuracy Analysis

The canopy classification accuracies based on different classification models with fused images are illustrated in Figure 13. From the producer’s accuracy, it can be deduced that RF based on DSM + MSI images achieves the optimal identification of healthy canopies, with a PA of 91.15%. Following closely is the U-Net model, with a PA of 91.01%. The SVM based on RGB images has the lowest recognition accuracy of 76.63%. For identifying withered canopies, RF based on MSI images achieves the highest accuracy, with a PA of 96.93%, followed by RF based on DSM + MSI images, with a PA of 95.91%, slightly lower by 0.72% compared to the MSI images. The extraction results based on DSM + RGB images using MLC have the lowest producer’s accuracy at 78.82%.
Although MSI images achieve high accuracy in identifying withered canopies, their producer’s accuracy for healthy canopies is 5.03% lower than that of DSM + MSI images. Overall, DSM + MSI images demonstrate the best performance in identifying both healthy and withered canopies in shelterbelts, while RGB images exhibit the poorest overall identification performance.
In terms of classification methods (Figure 14), the U-Net model achieves high accuracy with fewer features. However, in the DSM + MSI images with feature gradient accumulation, as set in this study, the U-Net model attains a classification accuracy second only to RF, with a PA of 91.94% for healthy canopies and 90.01% for withered canopies.
Figure 13. Comparison of user’s accuracy (UA) and producer’s accuracy (PA) across different classification models.
Forests 15 00891 g013

4. Discussion

The aim of this study is to perform image feature fusion of different spectral feature data and lidar derivatives, combined with ground survey data, to construct four models for identifying damaged canopy distribution in farmland shelterbelts based on traditional classifiers and deep learning. It is well known that traditional machine learning and deep models are effective methods for forest monitoring and image recognition. In this study, the overall accuracy and Kappa coefficient of RF for identifying canopy health information are superior to SVM and MLC. The reason for this is that the total length of the shelterbelts in this study is 120 m, and there are many training samples selected, which is suitable for the application of the large-sample RF model for training and recognition. As image classification is divided into five categories, the SVM performs poorly in multiple classification scenarios and exhibits overfitting. When employing MLC with multi-band high-dimensional image data, the presence of numerous features within the image contributes to error accumulation, consequently leading to a decrease in classification accuracy, consistent with previous research results [31,68].
Unlike deep learning detection models, traditional machine learning algorithms flatten multidimensional data into one-dimensional vectors when applied to entire images. Therefore, traditional machine learning algorithms cannot directly identify desired objects from images, whereas deep learning can directly recognize them by training only one type. Numerous scholars have utilized deep learning for the remote sensing monitoring of forest health, achieving satisfactory identification results [69,70,71]. Deep learning can achieve higher recognition accuracy compared to traditional classifiers with fewer features. In this study, using only RGB images, the U-Net model achieved a classification accuracy of Kappa = 0.8147 and OA = 87.71%. However, deep learning also faces challenges such as network convergence due to insufficient node numbers or overfitting due to excessive node numbers [69]. In terms of economic and time costs, deep learning requires higher GPU configurations and training and recognition times compared to traditional classifiers.
DSM + MSI images demonstrate relatively high classification accuracy across four different classification methods. Our analysis reveals that classification accuracy based solely on RGB images is relatively low. In distinguishing between withered canopies and healthy canopies, misclassification occurs, with instances of misidentifying withered canopies as bare land and healthy canopy as weeds. Furthermore, certain crops within cultivated areas are identified as healthy canopies. This suggests that relying solely on RGB visible-light imagery makes it challenging to ensure the accurate identification of shelterbelt canopy condition and health information within complex agricultural environments.
Within traditional classifiers, incorporating DSM + RGB images slightly improves classification accuracy compared to using RGB images alone. This indicates that integrating elevation information enhances the characterization of shelterbelt canopies to some extent. However, due to the similarity in texture features among healthy canopies, weeds, and bare land in the green wavelength range of visible light, weeds remain the primary interference factor in identifying healthy canopies within farmland shelterbelts. The MSI images introduced the 840 nm near-infrared band along with the 720 nm and 750 nm red-edge bands, enhancing sensitivity to minor changes in chlorophyll content, thus effectively distinguishing between withered and healthy canopies, consistent with previous research findings [21]. Nevertheless, distinguishing healthy green vegetation, such as leaf surfaces, weeds, and agricultural crops, remains challenging based solely on differences in reflectance rates.
After integrating LiDAR elevation features into multispectral imagery, while enriching chlorophyll-sensitive spectral information, it also enhances height parameter information between canopies and surface-interfering objects, effectively distinguishing interfering objects and achieving higher accuracy in identifying the health status of canopies and damage in farmland shelterbelts. However, there are still some factors affecting the identification of Populus bolleana shelterbelt canopies in this study:
  • Although farmland shelterbelts have certain inter-tree spacing, there is often cohesion between the canopies of mature Populus bolleana, such as lower branches or overlapping canopies between trees, which may lead to missed detections and unrecognized instances during UAV vertical-projection-based identification processes.
  • Adult Populus bolleana typically grows to heights of 20–30 m, with canopies located more than 2 m above the ground. Due to their physiological characteristics, when affected by pests, diseases, growth decline, or dieback, the upper portions of the trees wilt first, while a significant number of healthy branches and leaves remain near the ground. Multispectral data acquisition from UAVs provides limited spectral characteristics for vertical cross-sections. Future exploration may involve increasing the tilt angle of UAVs or conducting the horizontal projection of vertical cross-sections, combined with radar information, to further enhance the identification of healthy canopy information in farmland shelterbelts.

5. Conclusions

In this study, we primarily utilize the YUSENSE MS600 Pro multispectral camera and DJI Zenmuse L1 LiDAR mounted on a UAV platform to investigate the ability of different feature fusion images in identifying the distribution of damaged canopies in farmland shelterbelts. Due to the ability of UAVs to acquire data with ultra-high spatial and temporal resolutions, our approach can promptly and accurately map the distribution of damaged canopies in shelterbelts, supporting precise forest management and the renewal of shelterbelts in the Three-North Shelter Forest Program.
By employing a feature fusion method, combining RGB images with near-infrared and red-edge spectral features and elevation features, we classify the canopy condition of shelterbelts, thus avoiding the problem of low accuracy in canopy health information under a single data feature. Additionally, our objective is to identify the conditions of all objects within the buffer zone of shelterbelts surrounding adjacent farmland. To adapt to the varying conditions of shelterbelts in farmland settings, we chose to not only identify damaged canopies. The results indicate satisfactory outcomes, with the highest producer’s accuracy for withered canopies reaching 96.93% and for healthy canopies reaching 91.15%. Through different gradients of feature fusion, we observe that the classification accuracy of MSI images, after adding information from the red-edge and near-infrared bands to RGB images, increases more significantly than that of RGB + DSM images with only added elevation information. The optimal identification performance is achieved when both are fused simultaneously. This presents forestry surveyors with a new approach, relying solely on obtaining spectral reflectance data combined with the LiDAR-derived DSM, rather than calculating complex vegetation indices and conducting feature selection, to achieve the accurate and rapid identification of damaged canopies.
The performance of the same classification model varies greatly under different feature fusion variables. By comparing three classic classifiers—random forest, support vector machine, and maximum likelihood classification—and a deep learning U-Net model, we confirm the higher classification accuracy of the RF model with sufficient features. In random forests, incorporating spectral information from near-infrared and red-edge into RGB images, followed by the addition of the DSM, resulted in increases in the Kappa coefficients of 0.1039 and 0.1365, respectively. The deep learning U-Net model achieves good results with fewer features. However, the increment in the Kappa coefficient with the addition of spectral and DSM information is lower compared to traditional classifiers. Finally, the results of this study also showed that healthy green crops in the field, weeds in the ridges and vegetation within the forest belt exhibited similar textural characteristics and spectral reflectance. These features were the main interfering factors in identifying the health of the canopies of the farmland shelterbelts. The method proposed in this study combines multispectral imagery retaining complete spectral reflectance information with the LiDAR-derived DSM. Through feature fusion and image recognition techniques, it more accurately identifies the distribution of healthy and damaged canopies. This approach offers a novel pathway for monitoring farmland shelterbelts.

Author Contributions

H.W.; Methodology, H.W.; Validation, T.L.; Formal Analysis, T.L.; Investigation, T.L. and Y.L.; Resources, Y.L.; Data Curation, T.L., R.W., T.S., and Y.G.; Writing—Original Draft, Z.X.; Writing—Review and Editing, Z.X.; Supervision, H.W.; Project Administration, H.W. All authors have read and agreed to the published version of the manuscript.

Funding

This research received no external funding.

Informed Consent Statement

Informed consent was obtained from all subjects involved in this study.

Data Availability Statement

The data are contained within the article.

Conflicts of Interest

The authors declare no conflicts of interest.

References

  1. Xue, B.; Jiang, Y.; Wang, Q.J.; Ma, B.; Hou, Z.A.; Liang, X.; Gui, Y.R.; Li, F.F. Seasonal transpiration dynamics and water use strategy of a farmland shelterbelt in Gurbantunggut Desert oasia, northwestern China. Agric. Water Manag. 2024, 295, 108777. [Google Scholar] [CrossRef]
  2. Zhou, S.H.; Ge, T.J.; Xing, C.L.; Xu, X.X.; Yang, L.Y.; Lü, R.H. Analysis on stoichiometric characteristics of a populus Alba L. var pyramidalis protective forest in Alar Reclamation Area. Bull. Soil Water Conserv. 2022, 42, 82–89. [Google Scholar]
  3. Lin, W.W.; Tian, C.M.; Xiong, D.G.; Ryhguli, S.; Liang, Y.M. Influencing factors of spider community diversity in poplar plantations in XinJiang, China. Biodivers. Sci. 2023, 31, 95–108. [Google Scholar] [CrossRef]
  4. Shao, P.P.; Yang, B.J.; Su, Z.; Sun, Z.X.; Wang, Z.; Liu, Y.T.; Wei, J.R. Preference of Anoplophora glabripennis to Populus alba var. pyramidalis and Elaeagnus angustifolia. For. Res. 2023, 36, 122–128. [Google Scholar]
  5. Liu, D.Q.; Zhang, T.Y.; Zhang, X.L.; Zong, S.X.; Huang, J.X. Spatial stratified heterogeneity and driving force of Anoplophora glabripennis in North China. Trans. Chin. Soc. Agric. Mach. 2022, 53, 215–223+369. [Google Scholar]
  6. Luo, Y.Q. Theory and Techniques of Ecological Regulation of Poplar Longhorned Beetle Disaster in Shelter-Forest. Ph.D. Thesis, BeiJing Forestry University, Beijing, China, 2005. [Google Scholar]
  7. Lausch, A.; Borg, E.; Bumberger, J.; Dietrich, P.; Heurich, M.; Huth, A.; Jung, A.; Klenke, R.; Knapp, S.; Mollenhauer, H.; et al. Understanding forest health with Remote Sensing, Part Ⅲ: Requirements for a scalable Multi-Source forest health monitoring network based on data science approaches. Remote Sens. 2018, 10, 1120. [Google Scholar] [CrossRef]
  8. Juha, H.; Hannu, H.; Mikko, I.; Marcus, E.; Susan, L.; Zhu, Y.H. Accuracy comparison of various remote sensing data sources in the retrieval of forest stand attributes. For. Ecol. Manag. 2000, 128, 109–120. [Google Scholar]
  9. Lu, D.S.; Chen, Q.; Wang, G.X.; Moran, E.; Batistella, M.; Zhang, M.Z.; Vaglio, L.G.; Saah, D. Aboveground Forest Biomass Estimation with Landsat and LiDAR Data and Uncertainty Analysis of the Estimates. Int. J. For. Res. 2012, 12, 436537. [Google Scholar] [CrossRef]
  10. Zhou, P.; Sun, Z.B.; Zhang, X.Q.; Wang, Y.X. A framework for precisely thinning planning in a managed pure Chinese fir forest based on UAV remote sensing. Sci. Total Environ. 2023, 860, 160482. [Google Scholar] [CrossRef] [PubMed]
  11. Chen, Y.W.; Teemu, H.; Mika, K.; Feng, Z.Y.; Tang, J.; Paula, L.; Antero, K.; Anttoni, J.; Juha, H. UAV-Borne Profiling Radar for Forest Research. Remote Sens. 2017, 9, 58. [Google Scholar] [CrossRef]
  12. Roope, N.; Eija, H.; Päivi, L.; Minna, B.; Paula, L.; Teemu, H.; Niko, V.; Tuula, K.; Topi, T.; Markus, H. Using UAV-Based Photogrammetry and Hyperspectral Imaging for Mapping Bark Beetle Damage at Tree-Level. Remote Sens. 2015, 7, 15467–15493. [Google Scholar]
  13. Hall, R.J.; Castilla, G.; White, J.C.; Cooke, B.J.; Skakun, R.S. Remote sensing of forest pest damage: A review and lessons learned from a Canadian perspective. Can. Entomol. 2016, 148, 296–356. [Google Scholar] [CrossRef]
  14. Marian-Daniel, I.; Vasco, M.; Elsa, B.; Klaas, P.; Nicolas, L. A Machine Learning Approach to Detecting Pine Wilt Disease Using Airborne Spectral Imagery. Remote Sens. 2020, 12, 2280. [Google Scholar]
  15. del-Campo-Sanchez, A.; Ballesteros, R.; Hernandez-Lopez, D.; Ortega, J.F.; Moreno, M.A.; Agroforestry and Cartography Precision Research Group. Quantifying the effect of Jacobiasca lybica pest on vineyards with UAVs by combining geometric and computer vision techniques. PLoS ONE 2019, 14, 0215521. [Google Scholar] [CrossRef] [PubMed]
  16. Zhang, X.L.; Zhang, F.; Qi, Y.X.; Deng, L.F.; Wang, X.L.; Yang, S.T. New research methods for vegetation information extraction based on visible light remote sensing images from an unmanned aerial vehicle (UAV). Int. J. Appl. Earth Obs. Geoinf. 2019, 78, 215–226. [Google Scholar] [CrossRef]
  17. You, Z.Y.; Wang, W.J.; Shao, L.J.; Guo, D.; Wu, S.Q.; Huang, S.G.; Zhang, F.P. Dead pine detection by mulit-color space based YOLOv5. J. Biosaf. 2023, 32, 282–289. [Google Scholar]
  18. Leidemer, T.; Gonroudobou, O.B.H.; Nguyen, H.T.; Ferracini, C.; Burkhard, B. Classifying the Degree of Bark Beetle-Induced Damage on Fir (Abies mariesii) Forests, from UAV-Acquired RGB Images. Computation 2022, 10, 63. [Google Scholar] [CrossRef]
  19. Bai, L.; Huang, X.; Dashzebeg, G.; Ariunaa, M.; Yin, S.; Bao, Y.; Bao, G.; Tong, S.; Dorjsuren, A.; Davaadorj, E. Potential of Unmanned Aerial Vehicle Red–Green–Blue Images for Detecting Needle Pests: A Case Study with Erannis jacobsoni Djak (Lepidoptera, Geometridae). Insects 2024, 15, 172. [Google Scholar] [CrossRef] [PubMed]
  20. Haidi, A.; Roshanak, D.; Andrew, K.S.; Thomas, A.G.; Marco, H. European spruce bark beetle (Ips typographus, L.) green attack affects foliar reflectance and biochemical properties. Int. Appl. Earth Obs. Geoinf. 2018, 64, 199–209. [Google Scholar]
  21. Abdollahnejad, A.; Panagiotidis, D. Tree Species Classification and Health Status Assessment for a Mixed Broadleaf-Conifer Forest with UAS Multispectral Imaging. Remote Sens. 2020, 12, 3722. [Google Scholar] [CrossRef]
  22. Li, P.L.; Huang, X.J.; Yin, S.; Bao, Y.H.; Bao, G.; Tong, S.Q.; Dashzeveg, G.; Nanzad, T.; Dorjsuren, A.; Enkhnasan, D.; et al. Optimizing spectral index to estimate the relative chlorophyll content of the forest under the damage of Erannis jacobsoni Djak in Mongolia. Ecol. Indic. 2013, 154, 110714. [Google Scholar] [CrossRef]
  23. Jiang, X.P.; Zhen, J.N.; Miao, J.; Zhao, D.M.; Wang, J.J.; Jia, S. Assessing mangrove leaf traits under different pest and disease severity with hyperspectral imaging spectroscopy. Ecol. Indic. 2021, 129, 10791. [Google Scholar] [CrossRef]
  24. Ding, R. Research on the Early Diagnosis of Poplar Rust Based on Spectral Remote Sensing. Ph.D. Thesis, Nanjing Forestry University, Nanjing, China, 2021. [Google Scholar]
  25. Li, H.; Xu, H.H.; Zheng, H.Y.; Chen, X.Y. Research on pine wood nematode surveillance technology based on unmanned aerial vehicle remote sensing image. J. Chin. Agric. Mech. 2020, 41, 170–175. [Google Scholar]
  26. Jung-il, S.; Won-woo, S.; Taejung, K.; Joowon, P.; Choong-shik, W. Using UAV Multispectral Images for Classification of Forest Burn Severity—A Case Study of the 2019 Gangneung Forest Fire. Forests 2019, 10, 1025. [Google Scholar]
  27. Sarkar, C.; Gupta, D.; Gupta, U.; Hazarika, B.B. Leaf disease detection using machine learning and deep learning: Review and challenges. Appl. Soft Comput. J. 2023, 145, 110534. [Google Scholar] [CrossRef]
  28. Carnegie, A.J.; Eslick, H.; Barber, P.; Nagel, M.; Stone, C. Airborne multispectral imagery and deep learning for biosecurity surveillance of invasive forest pests in urban landscapes. Urban For. Green. 2023, 81, 127859. [Google Scholar] [CrossRef]
  29. Ye, W.J.; Lao, J.M.; Liu, Y.J.; Chang, C.C.; Zhang, Z.W.; Li, H.; Zhou, H.H. Pine pest detection using remote sensing satellite images combined with a multi-scale attention-UNet model. Ecol. Inform. 2022, 72, 101906. [Google Scholar] [CrossRef]
  30. Mutiara, S.; Sung-Jae, P.; Chang-Wook, L. Detection of the Pine Wilt Disease Tree Candidates for Drone Remote Sensing Using Artificial Intelligence Techniques. Engineering 2020, 6, 919–926. [Google Scholar]
  31. Yu, R.; Luo, Y.Q.; Zhou, Q.; Zhang, X.D.; Wu, D.W.; Ren, L.L. Early detection of pine wilt disease using deep learning algorithms and UAV-based multispectral imagery. For. Ecol. Manag. 2021, 497, 119493. [Google Scholar] [CrossRef]
  32. Masek, J.G.; Hayes, D.J.; Hughes, M.J.; Healey, S.P.; Turner, D.P. The role of remote sensing in process-scaling studies of managed forest ecosystems. For. Ecol. Manag. 2015, 355, 109–123. [Google Scholar] [CrossRef]
  33. Azadeh, A.; Dimitrios, P.; Lukáš, B. An Integrated GIS and Remote Sensing Approach for Monitoring Harvested Areas from Very High-Resolution, Low-Cost Satellite Images. Remote Sens. 2019, 11, 2539. [Google Scholar]
  34. Li, X.Y.; Tong, T.; Luo, T.; Wang, J.X.; Rao, Y.M.; Li, L.Y.; Jin, D.C.; Wu, D.W.; Huang, H.G. Retrieving the Infected Area of Pine Wilt Disease-Disturbed Pine Forests from Medium-Resolution Satellite Images Using the Stochastic Radiative Transfer Theory. Remote Sens. 2022, 14, 1526. [Google Scholar] [CrossRef]
  35. Kyle, M. Early Detection of Mountain Pine Beetle Damage in Ponderosa Pine Forests of the Black Hills Using Hyperspectral and WorldView-2 Data. Master’s Thesis, Minnesota State University, Mankato, MN, USA, 2016. [Google Scholar]
  36. Abdollahnejad, A.; Panagiotidis, D.; Surový, P.; Modlinger, R. Investigating the Correlation between Multisource Remote Sensing Data for Predicting Potential Spread of Ips typographus L. Spots in Healthy Trees. Remote Sens. 2021, 13, 4953. [Google Scholar] [CrossRef]
  37. Sapes, G.; Lapadat, C.; Schweiger, A.K.; Juzwik, J.; Montgomery, R.; Gholizadeh, H.; Townsend, P.A.; Gamon, J.A.; Cavender, B.J. Canopy spectral reflectance detects oak wilt at the landscape scale using phylogenetic discrimination. Remote Sens. Environ. 2022, 273, 112961. [Google Scholar] [CrossRef]
  38. Sarah, J.H.; Thomas, T.V. Detection of spruce beetle-induced tree mortality using high- and medium-resolution remotely sensed imagery. Remote Sens. Environ. 2015, 168, 134–145. [Google Scholar]
  39. Ali, S.; John, C.T.; Russell, T. Pine plantation structure mapping using WorldView-2 multispectral image. Int. J. Remote Sens. 2013, 34, 3986–4007. [Google Scholar]
  40. Joan, E.L.; Richard, A.F.; Olivier, R.L.; Mélodie, B. Extending ALS-Based Mapping of Forest Attributes with Medium Resolution Satellite and Environmental Data. Remote Sens. 2019, 11, 1092. [Google Scholar]
  41. Bolton, D.K.; Tompalski, P.; Coops, N.C.; White, J.C.; Wulder, M.A.; Hermosilla, T.; Queinnec, M.; Luther, J.E.; van Lier, O.R.; Fournier, R.A.; et al. Optimizing Landsat time series length for regional mapping of lidar-derived forest structure. Remote Sens. Environ. 2020, 239, 111645. [Google Scholar] [CrossRef]
  42. Giona, M.; Txomin, H.; Michael, A.W.; Joanne, C.W.; Nicholas, C.C.; Geordie, W.H.; Harold, S.J.Z. Large-area mapping of Canadian boreal forest cover, height, biomass and other structural attributes using Landsat composites and lidar plots. Remote Sens. Environ. 2018, 209, 90–106. [Google Scholar]
  43. Dalla Corte, A.P.; Rex, F.E.; Almeida, D.R.A.D.; Sanquetta, C.R.; Silva, C.A.; Moura, M.M.; Wilkinson, B.; Zambrano, A.M.A.; Cunha Neto, E.M.D.; Veras, H.F.; et al. Measuring Individual Tree Diameter and Height Using GatorEye High-Density UAV-Lidar in an Integrated Crop-Livestock-Forest System. Remote Sens. 2020, 12, 863. [Google Scholar] [CrossRef]
  44. Terryn, L.; Calders, K.; Bartholomeus, H.; Bartolo, R.E.; Brede, B.; D’hont, B.; Disney, M.; Herold, M.; Lau, A.; Shenkin, A.; et al. Quantifying tropical forest structure through terrestrial and UAV laser scanning fusion in Australian rainforests. Remote Sens. Environ. 2022, 271, 112912. [Google Scholar] [CrossRef]
  45. Panagiotidis, D.; Abdollahnejad, A.; Slavík, M. 3D point cloud fusion from UAV and TLS to assess temperate managed forest structure. Int. J. Appl. Earth Obs. Geoinf. 2022, 112, 102917. [Google Scholar] [CrossRef]
  46. Antti, P.; Ilkka, K.; Mikko, V.; Samuli, J. Detecting tree mortality using waveform features of airborne LiDAR. Remote Sens. Environ. 2024, 303, 114019. [Google Scholar]
  47. Huang, K. Integration of Lighter LiDAR and Multispectral Imagery for Estimation of Tree Dieback Rate on Ground. Ph.D. Thesis, Beijing Forestry University, Beijing, China, 2020. [Google Scholar]
  48. Zhao, X.; Qi, J.B.; Xu, H.F.; Yu, Z.X.; Yuan, L.J.; Chen, Y.W.; Huang, H.G. Evaluating the potential of airborne hyperspectral LiDAR for assessing forest insects and diseases with 3D Radiative Transfer Modeling. Remote Sens. Environ. 2023, 297, 113759. [Google Scholar] [CrossRef]
  49. Oblinger, B.W.; Bright, B.C.; Hanavan, R.P.; Simpson, M.; Hudak, A.T.; Cook, B.D.; Corp, L.A. Identifying conifer mortality induced by Armillaria root disease using airborne lidar and orthoimagery in south central Oregon. For. Ecol. Manag. 2022, 511, 120126. [Google Scholar] [CrossRef]
  50. He-Ya, S.; Huang, X.; Zhou, D.; Zhang, J.; Bao, G.; Tong, S.; Bao, Y.; Ganbat, D.; Tsagaantsooj, N.; Altanchimeg, D.; et al. Identification of Larch Caterpillar Infestation Severity Based on Unmanned Aerial Vehicle Multispectral and LiDAR Features. Forests 2024, 15, 191. [Google Scholar] [CrossRef]
  51. Yang, Y.L.; Xiao, H.J.; Xin, Z.M.; Fan, G.P.; Li, J.R.; Jia, X.X.; Wang, L.T. Assessment on the declining degree of farmland shelter forest in a desert oasis based on LiDAR and hyperspectrum imagery. Chin. J. Appl. Ecol. 2023, 34, 1043–1050. [Google Scholar]
  52. Thomas, H.; Martin, L.; Nicholas, C.C.; Michael, A.W.; Glenn, J.N.; David, L.B.J.; Darius, S.C. Comparing canopy metrics derived from terrestrial and airborne laser scanning in a Douglas-fir dominated forest stand. Trees 2010, 24, 819–832. [Google Scholar]
  53. LY/T 3179-2020; Technical Regulation for the Restoration of Degraded Protective Forest. State Forestry and Grassland Administration: Beijing, China, 2020.
  54. Yu, L.; He, J.L.; Ai, A.T.; Zhang, Y.; Wang, P.N. Characteristics of hydrogen and oxygen stable isotopes in groundwater of Tiemenguan city, Xinjiang. J. Arid Land Resour. Environ. 2023, 37, 58–64. [Google Scholar]
  55. John, W.G. A Statistical Examination of Image Stitching Software Packages for Use with Unmanned Aerial Systems. Photogramm. Eng. Remote Sens. 2016, 82, 419–425. [Google Scholar]
  56. Li, W.K.; Guo, Q.H.; Jakubowski, M.K.; Kelly, M. A New Method for Segmenting Individual Trees from the Lidar Point Cloud. Photogramm. Eng. Remote Sens. 2012, 78, 75–84. [Google Scholar] [CrossRef]
  57. Yang, J.Q.; Fan, D.S.; Yang, J.B.; Yang, X.B.; Ji, S. A large scale online UAV mapping algorithm for the dense point cloud and digital surface model generation. J. Geod. Geoinf. Sci. 2023, 10, 47–53. [Google Scholar]
  58. Zhu, J.F.; Liu, Q.W.; Cui, X.M. Extraction of individual tree parameters by combining terrestrial and UAV LiDAR. Trans. Chin. Soc. Agric. Eng. 2022, 38, 51–58. [Google Scholar]
  59. Philippe, L.; Stéphanie, B.; Marc, P.; Jonathan, L. A Photogrammetric Workflow for the Creation of a Forest Canopy Height Model from Small Unmanned Aerial System Imagery. Forests 2013, 4, 922–944. [Google Scholar]
  60. Andrew, F.; Richard, M. Hypertemporal Imaging Capability of UAS Improves Photogrammetric Tree Canopy Models. Remote Sens. 2020, 12, 1238. [Google Scholar]
  61. Winsen, M.; Hamilton, G. A Comparison of UAV-Derived Dense Point Clouds Using LiDAR and NIR Photogrammetry in an Australian Eucalypt Forest. Remote Sens. 2023, 15, 1694. [Google Scholar] [CrossRef]
  62. Delibasoglu, I.; Cetin, M. Improved U-Nets with inception blocks for building detection. J. Appl. Remote 2020, 14, 044512. [Google Scholar] [CrossRef]
  63. Li, Z.K.; Deng, X.L.; Lan, Y.B.; Liu, C.J.; Qing, J.J. Fruit tree canopy segmentation from UAV orthophoto maps based on a lightweight improved U-Net. Comput. Electron. Agric. 2024, 217, 108538. [Google Scholar] [CrossRef]
  64. Zeng, T.W.; Wang, Y.; Yang, Y.Q.; Liang, Q.F.; Fang, J.H.; Li, Y.; Zhang, H.M.; Fu, W.; Wang, J.; Zhang, X.R. Early detection of rubber tree powdery mildew using UAV-based hyperspectral imagery and deep learning. Comput. Electron. Agric. 2024, 220, 108909. [Google Scholar] [CrossRef]
  65. Lin, Q.N.; Huang, H.G.; Wang, J.X.; Chen, L.; Du, H.Q.; Zhou, G.M. Early detection of pine shoot beetle attack using vertical profile of plant traits through UAV-based hyperspectral, thermal, and lidar data fusion. Int. J. Appl. Earth Obs. Geoinf. 2023, 125, 103549. [Google Scholar] [CrossRef]
  66. Cao, J.J.; Leng, W.C.; Liu, K.; Liu, L.; He, Z.; Zhu, Y.H. Object-Based Mangrove Species Classification Using Unmanned Aerial Vehicle Hyperspectral Images and Digital Surface Models. Remote Sens. 2018, 10, 89. [Google Scholar] [CrossRef]
  67. da Silva, S.D.P.; Eugenio, F.C.; Fantinel, R.A.; de Paula Amaral, L.; dos Santos, A.R.; Mallmann, C.L.; dos Santos, F.D.; Pereira, R.S.; Ruoso, R. Modeling and detection of invasive trees using UAV image and machine learning in a subtropical forest in Brazil. Ecol. Inform. 2023, 74, 101989. [Google Scholar] [CrossRef]
  68. Lin, X.B.; Sun, J.H.; Yang, L.; Liu, H.; Wang, T.; Zhao, H. Application of UAV Multispectral Remote Sensing to Monitor Damage Level of Leaf-feeding Insect Pests of Oak. J. Northeast For. Univ. 2013, 51, 138–144. [Google Scholar]
  69. Julia, A.; Melanie, B.; Sebastian, P.; Tarek, N.; Marta, P. Evaluating Different Deep Learning Approaches for Tree Health Classification Using High-Resolution Multispectral UAV Data in the Black Forest, Harz Region, and Göttinger Forest. Remote Sens. 2024, 16, 561. [Google Scholar]
  70. Lei, S.H.; Luo, J.B.; Tao, X.J.; Qiu, Z.X. Remote Sensing Detecting of Yellow Leaf Disease of Arecanut Based on UAV Multisource Sensors. Remote Sens. 2021, 13, 4562. [Google Scholar] [CrossRef]
  71. Qin, J.; Wang, B.; Wu, Y.L.; Lu, Q.; Zhu, H.C. Identifying Pine Wood Nematode Disease Using UAV Images and Deep Learning Algorithms. Remote Sens. 2021, 13, 162. [Google Scholar] [CrossRef]
Figure 1. Overview of study area and landscape. (a) Location of Tiemenguan City; (b) remote sensing image of the 21st Regiment; (c) ground landscape of the sampling area; (d) wood-boring pests; (e) worm-holes; (f) dead tree.
Forests 15 00891 g001
Figure 2. (a) DJI Matrice M300 RTK unmanned aerial vehicle; (b) YUSENSE MS600 Pro multispectral camera; (c) DJI Zenmuse L1 LiDAR.
Forests 15 00891 g002
Figure 3. UAV data acquisition: (a) flight path and LiDAR data in .las format; (b) UAV digital orthophoto map.
Forests 15 00891 g003
Figure 4. (a) DSM generated by DAP optical imagery; (b) DSM generated by LiDAR; (c) standard false-color reference image.
Forests 15 00891 g004
Figure 5. Technical workflow diagram.
Forests 15 00891 g005
Figure 8. Post hoc analysis of texture feature analysis reveals the strength of associations between the five main categories (healthy canopy = 1, withered canopy = 2, crops = 3, bare land = 4, weeds = 5), and the most significant descriptive statistics of the four texture feature variables. Lowercase letters a, b, and c denote inter-group significant differences (p-value < 0.05).
Forests 15 00891 g008
Figure 9. DSM elevation distribution of land cover in the study area.
Forests 15 00891 g009
Figure 10. Area error extraction of feature fusion images.
Forests 15 00891 g010
Figure 14. Classification model confusion matrix results. (A) RF. (B) SVM. (C) MLC. (D) U-Net. (Yellow color on the diagonal of the confusion matrix indicates the proportion of predicted values equal to the true value, and the blue color on the off-diagonal indicates the proportion of incorrect predictions by the classifier. Light gray color indicates user’s accuracy and producer’s accuracy, respectively, dark gray color indicates overall accuracy).
Forests 15 00891 g014
Table 1. Band parameters of MS600 Pro multispectral sensor.
ChannelTitle 2 PropertiesCentral Wavelength/nm
Band 1
Band 2
Band 3
Band 4
Band 5
Band 6
Blue
Green
Near infrared
Red
Red-edge 1
Red-edge 2
450@35
555@25
840@35
660@20
720@10
750@15
Table 2. Confusion matrix schematic table.
Confusion MatrixTrue Value
PositiveNegative
Predicted valuePositiveTPFP
NegativeFNTN
Note: True Positive (TP): when the actual value is positive and the predicted value is positive. False Negative (FN): when the actual value is positive and the predicted value is negative. False Positive (FP): when the actual value is negative and the predicted value is positive. True Negative (TN): when the actual value is negative and the predicted value is negative.
Table 3. Pearson correlation analysis of texture features.
BandsMeanVarianceHomogeneityContrastDissimilarityEntropySecond MomentCorrelation
Blue Band−0.288 **−0.373 **0.413 **−0.390 **−0.432 **−0.391 **0.315 **0.466 **
Green Band−0.481 **−0.615 **0.487 **−0.620 **−0.639 **−0.357 **0.292 **0.322 **
Red Band−0.319 **−0.414 **0.388 **−0.433 **−0.444 **−0.353 **0.294 **0.471 **
Nir Band−0.282 **−0.0650.073−0.028−0.031−0.1890.1880.228 *
Re1 Band−0.442 **−0.591 **0.422 **−0.603 **−0.588 **−0.348 **0.304 **0.291 **
Re2 Band−0.328 **−0.290 **0.263 **−0.285 **−0.275 **−0.310 **0.294 **0.273 **
Note: For the level of significance, ** denotes highly significant correlation at the 0.01 (two-tailed) level, while * denotes a significant correlation at the 0.05 (two-tailed) level.
Table 4. Classified area results of shelterbelt using different images (Unit/m2).
ImagesClassGround
Measurement Area
Classification Model
RFU-NETSVMMLC
Extracted AreaExtracted AreaExtracted AreaExtracted Area
RGBHealthy Canopy244.96191.39231.39178.30187.73
Withered Canopy181.53174.78168.09166.08103.86
Crops594.09709.65682.03736.60745.31
Bare land289.05226.51196.37235.93225.07
Weeds272.54279.85304.31265.26320.22
DSM + RGBHealthy Canopy244.96227.86120.26196.44196.44
Withered Canopy181.53169.89232.71155.46155.46
Crops594.09736.13711.19721.22721.22
Bare land289.05218.68189.08244.24244.24
Weeds272.54229.62328.93264.82264.82
MSIHealthy Canopy244.96208.93289.49195.53226.67
Withered Canopy181.53170.06240.18158.54129.39
Crops594.09616.91675.73622.99649.01
Bare land289.05251.55192.79257.88263.07
Weeds272.54334.73184.00347.25314.04
DSM + MSIHealthy Canopy244.96232.72228.80195.20234.33
Withered Canopy181.53157.67197.70159.07147.51
Crops594.09620.29610.47622.77725.17
Bare land289.05246.19258.15256.99220.02
Weeds272.54307.31287.06348.15255.14
Table 5. Accuracy validation table based on different classification models.
ImagesRFSVMMLCU-Net
KappaOAKappaOAKappaOAKappaOA
RGB images0.729182.47%0.712681.35%0.704980.92%0.814787.71%
MSI images0.83389.37%0.810787.91%0.800287.31%0.844089.63%
Fusion images of DSM + RGB0.764285.02%0.779485.88%0.705580.96%0.812287.71%
Fusion images of DSM + MSI0.865691.55%0.810587.90%0.835389.61%0.861291.59%
Disclaimer/Publisher’s Note: The statements, opinions and data contained in all publications are solely those of the individual author(s) and contributor(s) and not of MDPI and/or the editor(s). MDPI and/or the editor(s) disclaim responsibility for any injury to people or property resulting from any ideas, methods, instructions or products referred to in the content.

