Article

How Social Media Data Mirror Spatio-Temporal Behavioral Patterns of Tourists in Urban Forests: A Case Study of Kushan Scenic Area in Fuzhou, China

1
Advertising School, Communication University of China, Beijing 100024, China
2
School of Architecture and Urban-Rural Planning, Fuzhou University, Fuzhou 350108, China
3
School of International Studies, Communication University of China, Beijing 100024, China
4
School of Architecture, South China University of Technology, Guangzhou 510640, China
5
Institute of Geography, Ruhr-Universität Bochum, 44801 Bochum, Germany
*
Authors to whom correspondence should be addressed.
These authors contributed equally to this work.
Forests 2024, 15(6), 1016; https://doi.org/10.3390/f15061016
Submission received: 8 May 2024 / Revised: 5 June 2024 / Accepted: 6 June 2024 / Published: 12 June 2024
(This article belongs to the Special Issue The Sustainable Use of Forests in Tourism and Recreation)

Abstract

:
Exploring the spatial distribution of tourist attractions and comprehending the spatio-temporal behaviors of tourists within tourist attractions can provide local planning agencies, destination marketing organizations, and government departments with essential evidence for decision-making processes. This study examines the spatio-temporal behavior patterns of tourists in the Kushan Scenic Area by analyzing GPS trajectory data acquired from social media platforms. The investigation primarily utilizes three research methodologies: grid analysis, Markov chain, and K-means clustering. The grid analysis results reveal three spatial distribution patterns within the scenic area, while the outcomes from the Markov chain and K-means clustering delineate six tourist movement patterns, along with three choices regarding travel time. This finding holds significant practical implications for enhancing the attractiveness of scenic areas, optimizing spatial layout, and improving tourists’ experiences.

1. Introduction

As living standards improve, there is a growing tendency for people to indulge in travel [1]. Among Chinese tourists, mountainous scenic areas have maintained their popularity [2]. Typically, these areas feature exceptional natural surroundings, marked by lush forest cover perfect for sightseeing and recreational pursuits, complemented by a diverse range of tourism amenities and services [3,4]. Moreover, mountain tourism is often intertwined with rich historical and cultural heritage, attracting numerous sightseers and recreational travelers [5,6,7]. Nevertheless, recent years have witnessed a substantial surge in tourist arrivals at scenic locales in China, driven by the sustained growth of cultural tourism, leading to significant challenges in visitor management. To effectively address this issue, forecasting tourist demand and analyzing their spatio-temporal behavior within tourist destinations are crucial [8].
Understanding tourist behavior relies heavily on analyzing their movement patterns, which are essential for gaining insights into their spatio-temporal behavior, thereby influencing the development of scenic locales and the crafting of marketing strategies [9].
Movement pattern analysis typically consists of three dimensions: inter-destination, intra-destination, and intra-attraction tourist behaviors [10,11,12].
The analysis of inter-destination tourist behavior focuses on tourists’ movement between origins and destinations, typically comprising countries, cities, and regions. For example, Chung et al. [13] utilized social media posts to gather data points and investigate the movement patterns of Korean tourists across various European countries and cities, offering insights for European tourism marketing organizations. Phithakkinukoon et al. [14] analyze tourist mobility in diverse Japanese cities and its correlation with travel behaviors by leveraging cell phone GPS records. Liu et al. [15] employed network analysis and questionnaires to examine tourists’ movement between scenic spots in the Xinjiang Uygur Autonomous Region, China, revealing competitive dynamics among attractions and the influence of strategic resources on attraction popularity. Similarly, Xu et al. [16] examined international tourists’ preferences for different cities in South Korea using mobile location data, uncovering varying destination preferences based on nationality and significant disparities in destination attractiveness.
The analysis of intra-destination tourist behaviors focuses on tourists’ movement patterns among scenic spots (attractions) within a specific area. For instance, Miah et al. [17] utilized a Flickr dataset to investigate tourists’ POIs at various attractions within the metropolitan area of Melbourne, Australia, and predict their behavioral tendencies. Hu et al. [18] employed a Twitter dataset to investigate tourists’ movement patterns among different attractions in the New York metropolitan area, identifying popular attractions within the city. Mou et al. [19] studied the spatial tourism patterns in Qingdao City based on tourists’ digital footprints, revealing the influence of distance and popularity on the spatial distribution of scenic areas. The uneven distribution of core tourism nodes within the city can lead to intense internal competition. Finally, Zhou and Chen [20] collected data from Instagram to analyze tourists’ movement patterns to attractions within various administrative districts of Hong Kong, classifying attractions into four types and exploring the characteristics of each type.
The analysis of intra-attraction tourist behaviors focuses on tourists’ movement among attractions within a scenic area. Xia et al. [21] utilized Semi-Markov processes to simulate tourist movement at Phillip Island Nature Park, Australia, and assessed the marketing potential of each attraction based on their duration of stay. Smallwood et al. [22] employed face-to-face interviews to investigate the mobility patterns of tourists within the Ningaloo Marine Park in Australia. Their study revealed a notable reliance among visitors on the scenic road network. Moreover, they identified substantial variances in travel distances between first-time international tourists and their domestic counterparts. Birenboim et al. [23] examined the spatio-temporal trajectories of tourists visiting the PortAventura theme park in Catalonia, Spain, employing GPS positioning technology. Their investigation reveals distinct spatio-temporal behavioral patterns within the theme park, reflecting variations in visitors’ duration of stay, time allocations, and intradiurnal temporal trends. Huang et al. [24] explored the spatio-temporal behavior of visitors at Hong Kong’s Ocean Park by utilizing handheld GPS devices. The study identified three distinct spatio-temporal behavioral patterns and introduced a mobile trajectory measurement method based on path length, travel time, area coverage, and ellipse circumference.
Drawing from the research discussed above, it is evident that analyzing tourist behavior operates on three distinct levels: macro, meso, and micro. At the macro level, the research scope extends to inter-destination tourist behavior analysis. Meanwhile, the meso level delves into intra-destination tourist behaviors. At the microlevel, the focus narrows to intra-attraction tourist behaviors. Historically, scholarly research has predominantly concentrated on the macro and meso levels, emphasizing the flows and behaviors of tourists between destinations or within specific destinations. However, in recent years, there has been a noticeable paradigm shift. With the increasing availability and diversity of social media data for analysis, more scholars are now directing their attention toward studying the spatio-temporal behaviors of visitors within individual attractions.
Thus, this study utilizes the Kushan Scenic Area in Fuzhou as a case study and collects data from the 2bulu social media platform to investigate the attraction of distinct zones within the urban forest, analyze tourist movement patterns, and discern preferences regarding travel duration. The study aims to answer the following questions: (1) how the spatial distribution of the Kushan Scenic Area can be categorized based on tourists’ movement trajectories; (2) what categories of patterns emerge from tourists’ movement behaviors within the Kushan Scenic Area; and (3) what preferences tourists exhibit regarding travel durations within the Kushan Scenic Area.

2. Methodology

2.1. Study Area: Kushan Mountain Area, Fuzhou, China

Situated on the southeast coast of China, Fuzhou City in Fujian Province spans 12,000 square kilometers, with a built-up area covering 416 square kilometers. The urbanization rate is 72.5%, while the forest coverage rate reaches 58.41%. Geographically, Fuzhou typifies an estuarine basin characterized by higher terrain in the northwest, gradually descending to lower elevations in the southeast. Mountains and hills collectively dominate 72.68% of the total land area, with mountains encompassing 32.41% and hills 40.27%. Fuzhou is encompassed by a ring of mountain ranges, featuring Kushan Mountain (919.1 m) to the east, Qishan Mountain (820 m) to the west, Wuhu Mountain (700 m) to the south, and Lotus Peak (605.3 m) to the north.
Kushan Mountain, nestled in the northeast of Jin’an District, Fuzhou City, stands as a renowned scenic area cherished for its leisure and recreational offerings, as illustrated in Figure 1. With a history spanning nearly 2200 years of urban development, Kushan Mountain has retained its natural beauty, preserved as an urban forest. Its peripheral location within Fuzhou has shielded it from the disruptions of urbanization, ensuring the preservation of its overall landscape. The forests in the Kushan Scenic Area are characterized by two main categories: the subtropical evergreen arborvitae species, Pinus massoniana, and the evergreen arborvitae, Acacia confusa Merr. Some deciduous broad-leaved, evergreen broad-leaved tree species and shrubs form transitional zones within the forest. There are many ancient and valuable tree species in Kushan Mountain, including Cryptomeria fortunei Hooibrenk, Pinus massoniana, Albizzia chinensis, Cinnamonum camphora, Bauhinia blakeana, Liquidambar formosana, Cycas revoluta, Osmanthus fragrans, Keteleeria fortunei, Lagerstroemia, etc. Rare and precious plants include Alsophila spinulosa, Rhododendron protistum, Dendrobium officinale Kimura et Migo, Cymbidium dayanum Rchb. F, and various ferns and Cymbidium sinense in the forest [25].
As outlined in the General Plan of Kushan Scenic and Historic Area (2022–2035), the total area spans 49.72 square kilometers, with the core scenic area covering 12.72 square kilometers. The area boasts 164 landscape sources (groups), comprising 48 cultural landscape resources and 116 natural landscape sources. Currently, the scenic areas comprise Cedar and Kuliang Scenic Area, Kushan and Yongquan Scenic Area, Phoenix Pool and White Cloud Scenic Area, Mo Brook and Sword Gorge Scenic Area, White Horses Crossing Shan Brook Scenic Area, and Nanyang Emerald Scenic Area. In order to ensure optimal tour route connectivity and visitor accessibility, this study focuses on analyzing the spatio-temporal behaviors of tourists within the Cedar and Kuliang Scenic Area, Kushan and Yongquan Scenic Area, Phoenix Pool and White Cloud Scenic Area, Mo Brook and Sword Gorge Scenic Area, and White Horses Crossing Shan Brook Scenic Area [26].

2.2. Data Source

2bulu (www.2bulu.com, accessed on 31 October 2023) is a social platform that integrates outdoor travel resource sharing and community interaction. It serves as a go-to tool for outdoor enthusiasts, offering a plethora of features and functionalities tailored to meet their needs. The app developed by this website offers professional outdoor maps, navigation, and trajectory route services for travel enthusiasts. Users can record various information, such as time, speed, elevation, photos, and text, while using the app. The platform provides two types of open data for users to download: GPS trajectory data and geotagged photo data. The former enables the determination of tourists’ spatio-temporal status by calculating speeds between trajectory points, thus revealing activity ranges and behavioral patterns within tourist attractions. Additionally, GPS trajectory data facilitates the analysis of tourists’ stay times in scenic areas and the examination of transfer patterns and spatio-temporal behaviors. The latter type consists of photographs taken by tourists, which, containing geographic coordinates, are spontaneously uploaded by tourists, showcasing the locations and areas of interest visited during the tour.

2.2.1. Data Acquisition and Cleaning

We utilized Python to develop a script for collecting GPS trajectory data and photo information uploaded by tourists visiting the Kushan Scenic Area. A total of 4669 GPS trajectory data points and 51,205 raw datasets of geotagged photos were acquired from the 2bulu social media platforms, covering the timespan from 22 January 2011 to 30 October 2023. Table 1 presents the raw datasets comprising tourist user IDs, longitude, latitude, elevation, and timestamps.
GPS trajectory data are frequently influenced by various factors, leading to deviations and incompleteness in user trajectories. We excluded four types of problematic GPS trajectories and trajectory points: (1) trajectories situated outside the study area; (2) repeated trajectories from the same user; (3) trajectories deviating from the intended scenic routes; and (4) trajectories not adhering to movement rules. To ensure accuracy in screening problematic trajectories and trajectory points, we implemented the following steps: (a) Given the relatively gentle travel route of Kushan Mountain Area, we utilized the findings from Liu et al. [27], which stated that the walking speed is 5 km/h, equivalent to 1.4 m/s. (b) We employed the transformed projected coordinates to calculate the time and distance between two points using the formula presented in Equation (1) [28]. In the formula, P n 1 = ( x i 1 , y i 1 ) represents the previous trajectory point of the user during movement, and P n = ( x i , y i ) represents the subsequent trajectory point. The formula used the absolute value of the difference between two adjacent points, and the distance between two points was calculated. (c) The user’s movement distance was determined by subtracting the arrival time at the previous point from the arrival time at the next point. (d) To assess the variance between the user’s theoretical and actual distance, we multiplied the resulting time by the speed (1.4 m/s). We removed the trajectory point if the actual distance exceeded the theoretical distance. This method allowed us to evaluate whether the user’s movement data adhered to the movement rules. Following data cleaning, we identified 2377 valid trajectory lines, 1,787,323 trajectory points, and 31,802 user-uploaded photos. Moreover, we used the point of interest (POI) acquisition tool from Guihuayun (http://guihuayun.com/poi/, accessed on 31 October 2023) to collect POI data for the primary attractions in the scenic area, obtaining POI information for 37 attractions. After finishing the data cleaning process, we will adhere to the procedures outlined in Figure 2.
d = i = 2 n   ( x i x i 1 ) 2 + ( y i y i 1 ) 2 2  

2.2.2. Tourist Route Reconstruction

To accurately count the number of tourists visiting various attractions, we employed Python to reconstruct the movement routes of each tourist in chronological order, following a thorough data-cleaning process. This facilitated the calculation of the transfer probabilities of tourists between attractions. Given the plethora of attractions within the scenic areas, visitation rates exhibit considerable variation. Consequently, we identified attractions with higher tourist flow as focal points for our statistical analysis. These attractions encompassed Xie Courtyard, Stone Gate Pavilion, Half-Mountain Pavilion, Observation Tower, Eighteen Scenes Park, Yongquan Temple, Lingyuan Cave, White Cloud Pavilion, Gratitude Pavilion, Buddhist Cave, Bore Nunnery, White Cloud Peak, White Cloud Cave, Jicui Nunnery, Mo Brook, Qingyangzuo, Shan Brook, Kuliang Club, Cryptomeria Fortunei Park, and Keping Reservoir. The ultimate length of the reconstructed tour routes depended on the variable number of attractions visited by tourists within the scenic area, as delineated in Table 2.

2.3. Spatio-Temporal Behavior Patterns Analysis

We propose an analytical approach to investigate the spatio-temporal behavioral patterns of tourists. In this phase, we analyzed tourists’ movement patterns within the Kushan Scenic Area using GPS trajectory data and geotagged photographs. By delving into both spatial and temporal dimensions, we aim to effectively uncover the travel preferences of tourists.
Specifically, this approach can be divided into three steps: (1) Spatial distribution of tourists. This initial step involves the spatial gridding of the area of interest (AOI) range within the Kushan Scenic Area to assess tourists’ stay time, number of photographs taken, and trajectory points within each grid. Subsequently, the spatial link function of ArcMap 10.8 is employed to visualize the data, identify tourists’ areas of interest, and clarify the spatial characteristics of tourist behavior. (2) Tourists’ movement laws and patterns. To analyze the movement laws and patterns of tourists, we utilize a Markov chain model to compute the transfer probabilities of tourists between attractions and acquire the final steady-state distribution. (3) Spatio-temporal behavior patterns of tourists. Given the extensive network of roads within the Kushan Scenic Area, tourists have a multitude of route options, and their points of entry may vary. Thus, we designate Xie Courtyard, Gratitude Pavilion, Mo Brook, Shan Brook, Jicui Nunnery, and Kuliang Club as both the starting and ending points for tourists. Recognizing that the Observation Tower and White Cloud Peak serve as essential waypoints along these routes, attracting a significant flow of tourists, we classify these two attractions as the midpoints of the six routes. Leveraging this framework, we performed a K-Means clustering analysis of the arrival and departure times of attractions to investigate the spatio-temporal behavioral patterns of tourists.

2.3.1. Spatial Distribution of Tourists

Spatial data gridding serves as a fundamental technique for geometrically counting and integrating heterogeneous data [29]. In this process, GPS trajectory points play a pivotal role, providing crucial spatial information. Leveraging ArcMap’s grid analysis tool, researchers can partition the study area into customizable grid cells, which enhances the processing of tourist trajectory data. By gridding the study area, researchers can effectively quantify various aspects of tourist behavior, including the duration of their stay, the frequency of geotagged photos, and the overall tourist count at specific locations. This systematic approach ensures a comprehensive analysis of spatio-temporal patterns within the tourist destination. In this study, we partitioned the Kushan Scenic Area into 100 m × 100 m grid cells using ArcMap’s grid tool. Subsequently, we employed the spatial connectivity function to link GPS trajectory points and geotagged photographs with these grid cells. This method facilitated the computation of total tourist stay time, photo count, and trajectory points across various grid cells, providing valuable insights into tourist behavior within the scenic area.

2.3.2. Tourists’ Movement Laws and Patterns

In studying tourist behavior, we employ the Markov transfer probability matrix to analyze the probability of tourists transitioning between various attractions [30]. This probability is computed as the ratio of the number of visitors transferring to other attractions from a specific one to the total number of visitors departing from all attractions within that specific site. We calculated the transfer probability using all available data from 2011 to 2023. Ultimately, the attractions most frequently visited are identified based on the steady-state distribution probability following convergence. In this study, a tour route is regarded as a Markov chain, with attractions connected based on the sequence of tourist visits. For example, a tour route might progress as follows: Xie Courtyard → Stone Gate Pavilion → Half-Mountain Pavilion → Observation Tower is considered. To illustrate this concept, we present the reconstructed tour routes in Table 2.
We hypothesize that tourists’ transfer between various attractions follows a Markov chain model. We define A = {a1, a2, a3… an} as the node representing tourist transfers, with transfer routes denoted by t1 < t2 < t3 <… <tk for any given time sequence T = ( a i t o , a i t 1 , a i t k ). Under the assumption of a steady-state Markov chain, the probability of a tourist transitioning from attraction a i t k 1 to attraction a i t k at time tk depends on the state and transfer probabilities at tk. This probability is independent of previously experienced routes and is calculated using the formula presented below in Equation (2).
p ( a i t k | a i t k 1 , a i t k 2 , a i t 0 ) = p ( a i t k | a i t k 1 )

2.3.3. Laplace Smoothing

During the computation of Markov transfer probability matrices, certain attractions (nodes) may have events with a visit frequency of zero. However, it would be unreasonable to assume that attractions with a visit probability of zero are necessarily unvisited solely based on this dataset. According to the actual situation, in the Kushan Scenic Area, within the road complex, tourists can start at any attraction and move to another attraction, which is strongly random. Considering the irreducible nature of the Markov chain, we adopt Laplace Smoothing for nodes with zero probability. In statistics, additive smoothing, also recognized as Laplace smoothing, aims to address zero-probability events by employing the “plus one” method to augment each count [31]. The formula is shown below in Equation (3). The count (tij) denotes the frequency of visitors transitioning from attraction i to j within the dataset. N signifies the total count of transfers, while A denotes the total count of attractions.
P t i j = c o u n t t i j + 1 N + A      

2.3.4. K-Means Clusters Analysis

Cluster analysis is utilized to identify the proximity of discrete data attributes and to uncover similarities and anomalies within the dataset. The K-Means clustering algorithm is employed for this purpose, which groups multiple informational data objects into several meaningful clusters. Each cluster’s centroid represents the mean value of its members. The primary goal is to maximize the similarity within each cluster while minimizing the dissimilarity between clusters [32]. The K-means clustering method operates on a dataset comprising n data points {x1, x2, x3xa} and a set of k cluster centers {c1, c2, c3ck}. It calculates the Euclidean distance from each point to the centroid, assigning points to the cluster whose centroid is closest. This process iterates until the cluster centers converge [33]. The formula is shown below in Equation (4):
d = i = 1 n   m i n 1 j k   x i c j 2

3. Results

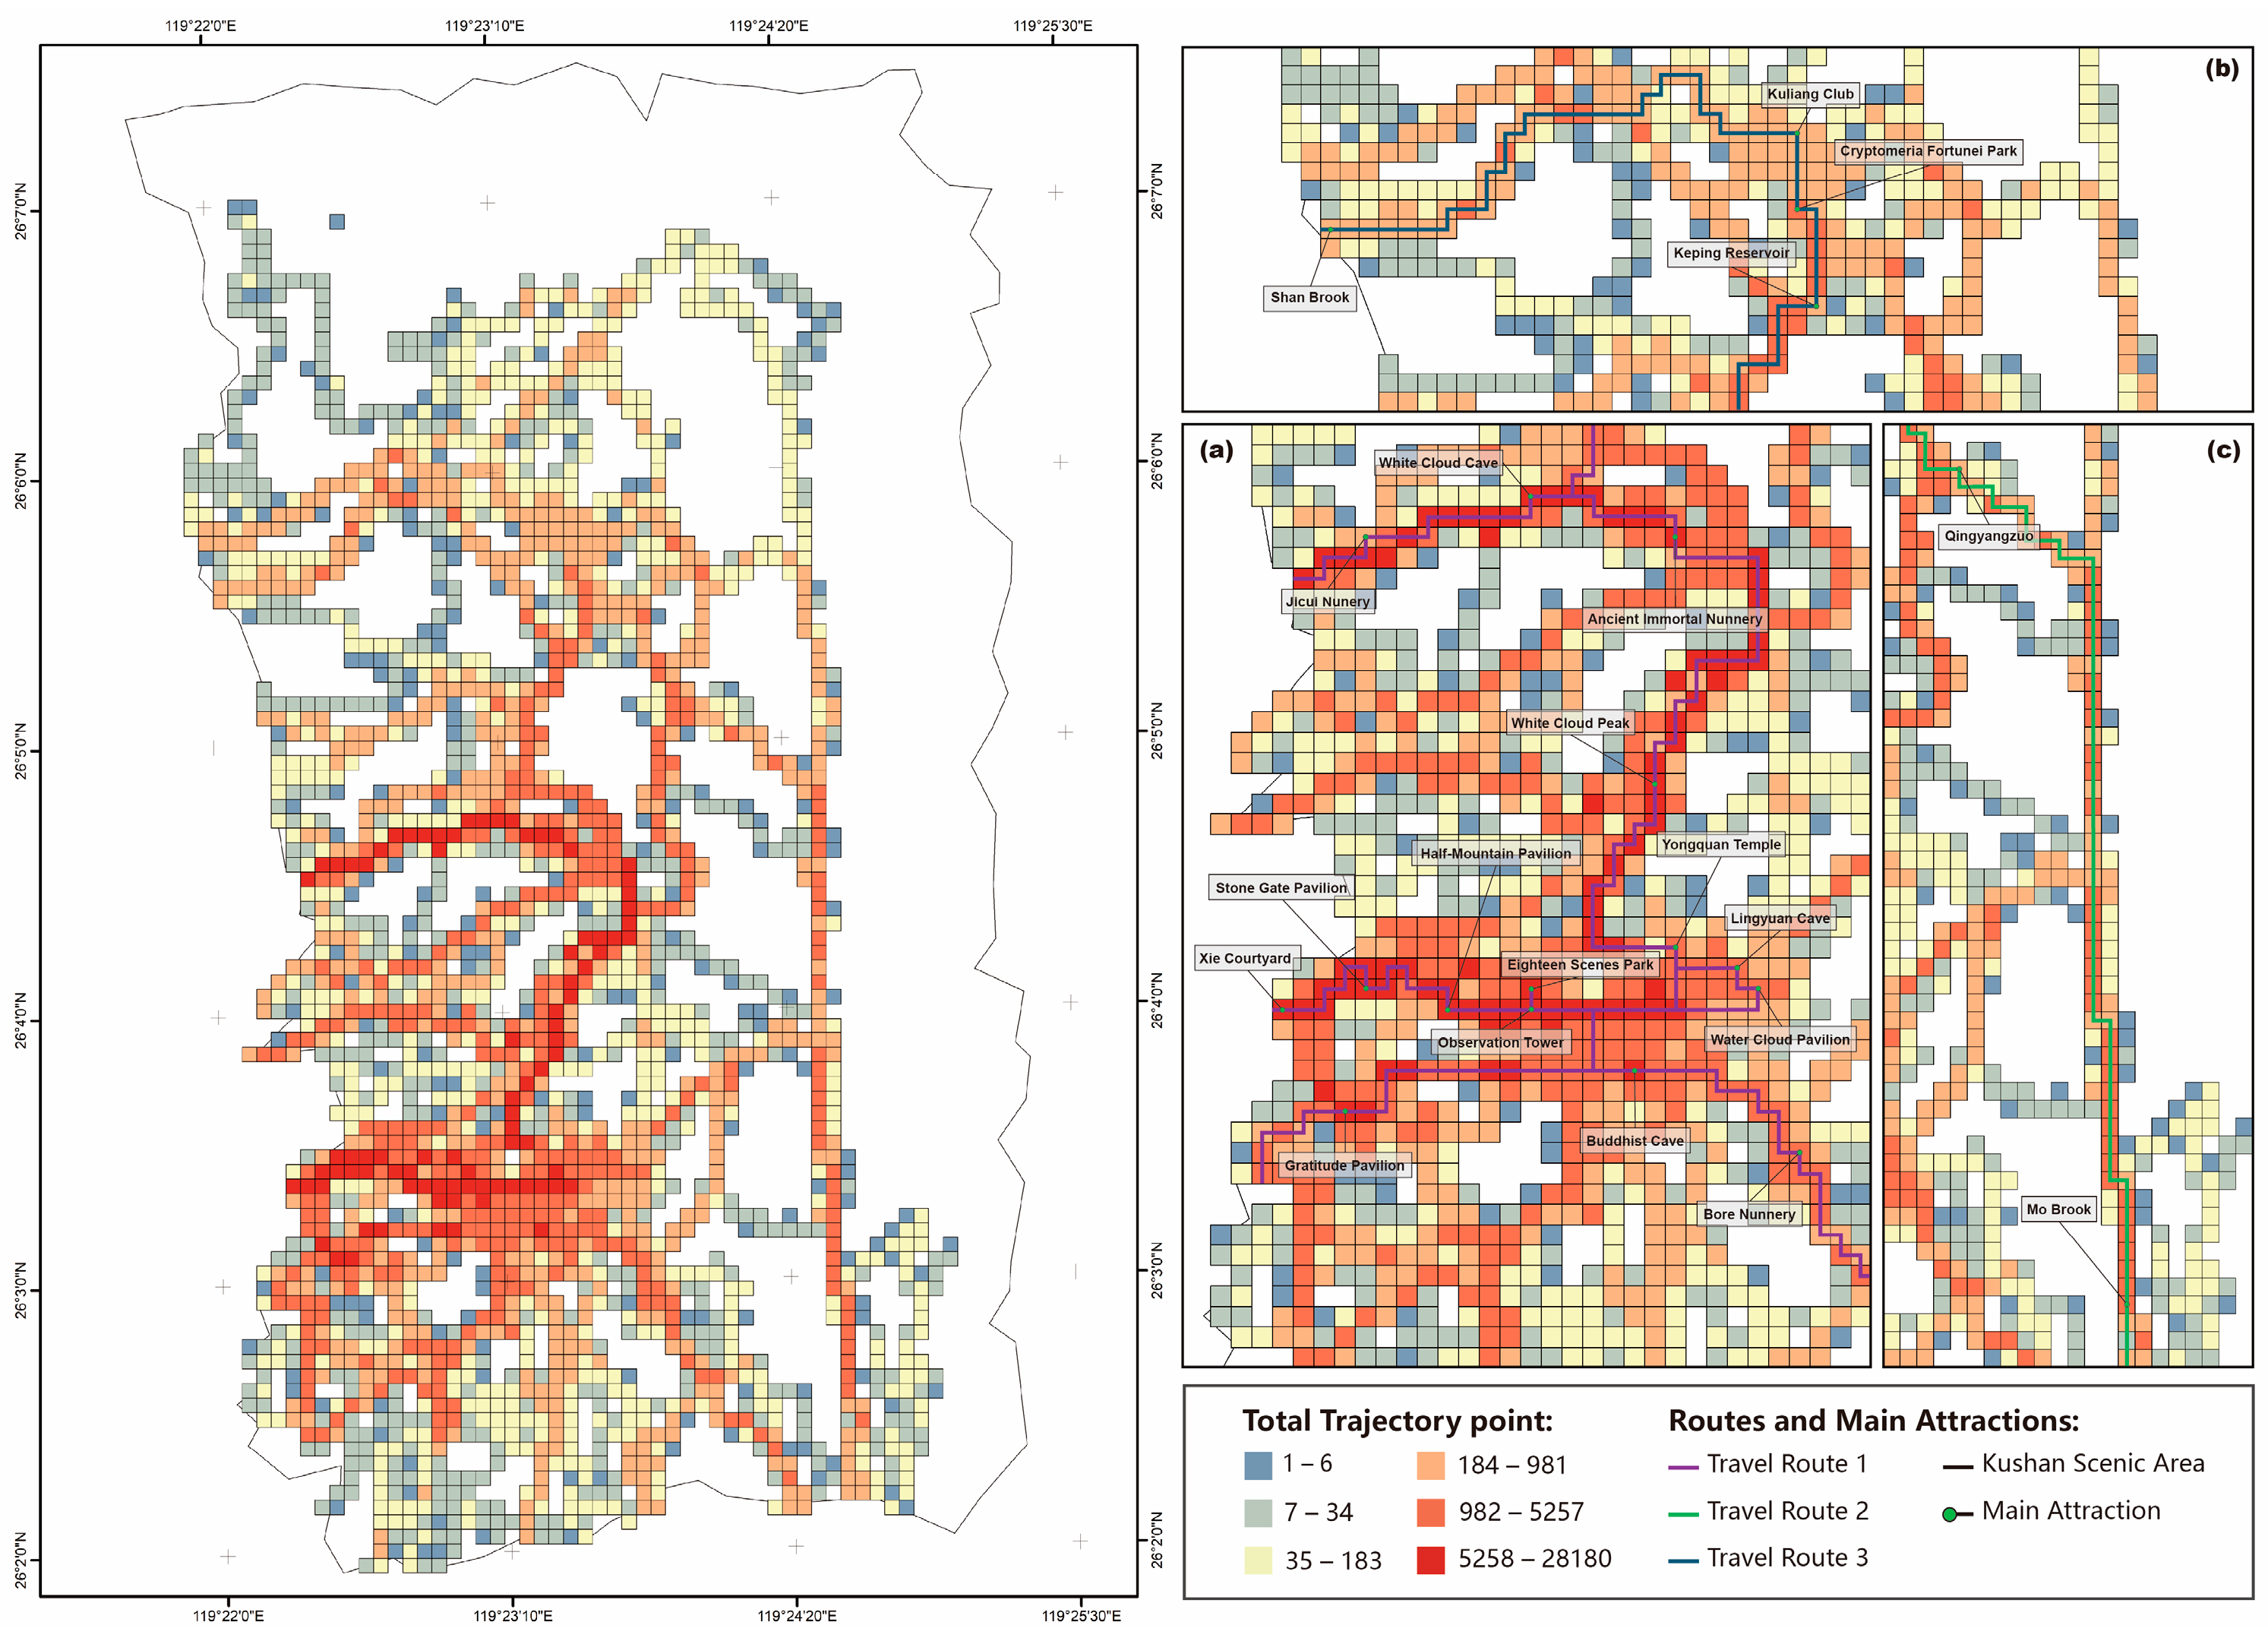
3.1. Spatial Distribution of Tourists in the Scenic Area

The various colored grids depicted in Figure 3. illustrate the total length of tourists’ stays in different areas of the Kushan Scenic Area. This visualization offers valuable insights into tourists’ preferences and areas of interest. Specifically, Figure 3. highlights three distinct areas within the Kushan Scenic Area that attract tourists. They are designated as the Traditional Tourist Area, the Recent Development Area, and the Outdoor Adventure Area, as shown in Figure 3a–c, respectively.
(1)
The Traditional Tourist Area encompasses well-established scenic spots such as Kushan and Yongquan Scenic Areas, Phoenix Pool, and the White Cloud Scenic Area, as well as well-preserved historical sites such as the Stone Gate Pavilion, Half-Mountain Pavilion, Eighteen Scenes Park, and the Yongquan Temple. As a result of these attractions, tourists exhibit the longest total stay times in this area, as indicated by the predominant orange-red coloring on the grid, reflecting the allure of historical and cultural sites.
(2)
The Recent Development Area is a newly emerged tourist destination that includes the Cedar and Kuliang Scenic Area and the White Horses Crossing Shan Brook Scenic Area. Historically, this area served as a summer resort for Westerners; now, there are numerous architectural heritages from modern times, some meticulously restored while others lie in ruins. Unlike the Traditional Tourist Area, this area is farther away, prompting most tourists to opt for scenic bus tours. Additionally, access to this area via Shan Brook involves traversing steep, challenging terrain. Consequently, the grid of the Recent Development Area in Figure 3. shows a lighter orange hue, indicative of comparatively shorter total stay times for tourists.
(3)
The Outdoor Adventure Area has gained popularity in recent years as a hiking route, and it involves the Mo Brook and Sword Gorge Scenic Area. Characterized by its natural scenery, tourists frequent this area primarily for hiking and exercise. The grid representation of the Outdoor Adventure Area in Figure 3. shows a predominantly lighter orange-red hue, with select sections displaying a darker orange shade, indicative of faster user traversal without planned stays.
Geotagged photos serve as a crucial indicator of an attraction’s allure. An area with a substantial user base eager to share and communicate photos of its attractions stands a chance to emerge as a hotspot for tourism marketing [34]. By analyzing the spatial distribution of tourist photos, we have pinpointed areas with a greater concentration of photographs, indicative of popular tourist zones. Figure 4 reveals six concentrated areas of tourist photography, all situated within the Traditional Tourist Area.
(1)
Attractive Area 1 involves attractions such as Xie Courtyard, Dongji Pavilion, and Stone Gate Pavilion, situated near the entrance of the scenic area.
(2)
Attractive Area 2 involves attractions such as the Observation Tower, Yongquan Temple, Lingyuan Cave, Drinking Rock, etc. Situated in the core of the Kushan and Yongquan Scenic Area, this area holds significant historical and cultural importance, reflecting the rich cultural heritage of Kushan Mountain.
(3)
Attractive Area 3 involves the Bore Nunnery, situated at the southern foot of Kushan Mountain, boasting a long history.
(4)
Attractive Area 4 involves White Cloud Summit, situated beneath the Lize Summit of Kushan Mountain, the highest peak in the region. This area offers excellent vantage points, allowing tourists to enjoy panoramic views of Fuzhou City from a distance.
(5)
Attractive Area 5 involves the Ancient Immortal Nunnery, which frequently serves as a tourist resting spot.
(6)
Attractive Area 6 is located within the Phoenix Pool and White Cloud Scenic Area, features attractions such as White Cloud Cave and Haiyin Cave. The topography of this region is characterized by rugged terrain, providing spectacular vistas that attract numerous tourists eager to capture memorable photographs.
The density of trajectory points on the grid can depict the primary routes taken by tourists within the scenic area. The gridding statistics results for the scenic area are illustrated in Figure 5, which depicts the three principal movement routes of tourists within the scenic area.
(1)
Travel Route 1 has the highest number of trajectories, making it the most favorite route. It shows the movement of tourists between the Kushan and Yongquan Scenic Area and the Phoenix Pool and White Cloud Scenic Area. Additionally, after visiting these two locations, certain tourists move towards the Cedar and Kuliang Scenic Area and the White Horses Crossing Shan Brook Scenic Area.
(2)
Travel Route 2 shows the linear movement rule of tourists within the Mo Brook Sword Gorge Scenic Area, known for outdoor exploration and featuring a relatively fixed route. After touring these two scenic areas, most tourists choose to visit the Cedar and Kuliang Scenic Area, Phoenix Pool and White Cloud Scenic Area, and Kushan and Yongquan Scenic Area.
(3)
Travel Route 3 features fewer trajectories compared to the preceding routes, documenting tourist movement within the White Horses Crossing Shan Brook Scenic Area and the Cedar and Kuliang Scenic Area. The trajectory density within the Cedar and Kuliang Scenic Area surpasses the White Horses Crossing Shan Brook Scenic Area. In general, a significant portion of tourists proceed to the Phoenix Pool and White Cloud Scenic Area and the Kushan and Yongquan Scenic Area following their visit to these two areas.

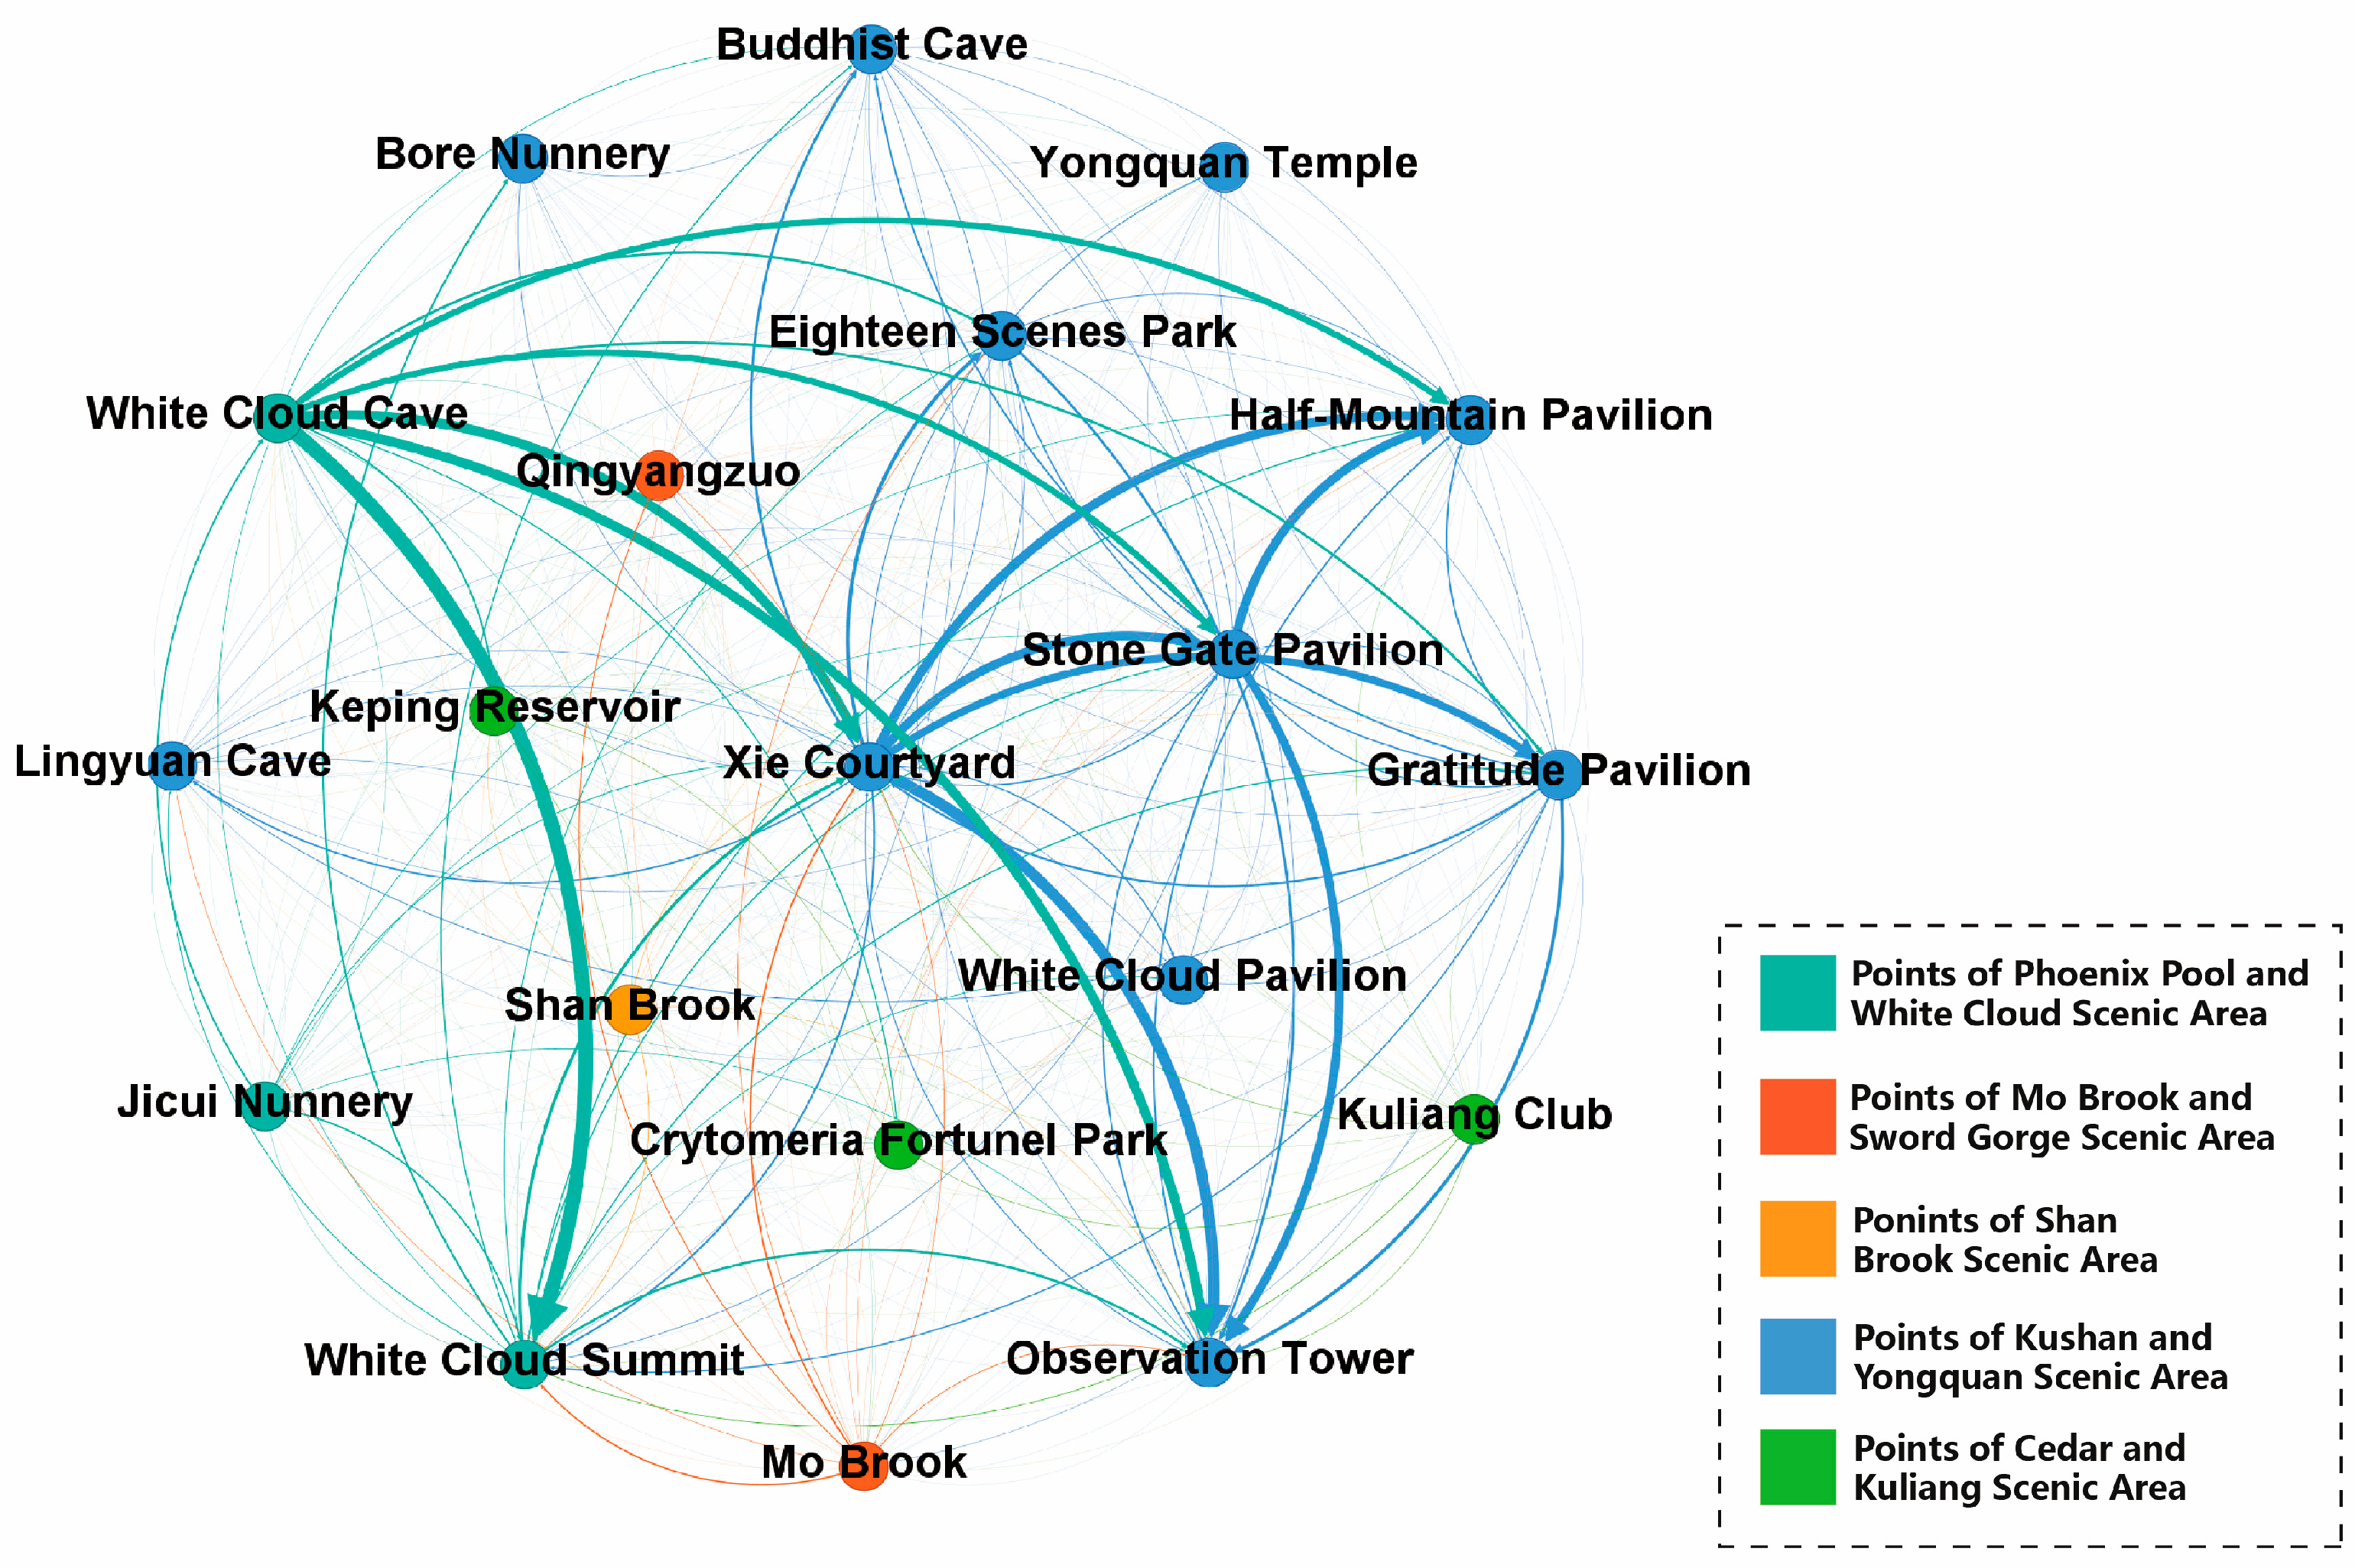
3.2. Tourists’ Movement Laws and Patterns in the Scenic Area

In analyzing the movement patterns of tourists among different attractions, we initially encoded the attraction names, as shown in Table 3. Subsequently, employing the Laplace smoothing technique, we augmented the transfer frequency of each attraction by adding one to the attractions with a zero probability, as shown in Table 4. Finally, we employed the Markov chain to compute the transfer probability of tourists’ GPS trajectory data between each attraction, as shown in Table 5.
Combining the statistical results of Table 4, we can calculate the initial transfer probability of each attraction and the transfer probability of each attraction after convergence, as shown in Table 6. We believe that the tourists of attractions higher than 10% have a strong willingness to transfer, and according to the transfer probability of attractions after convergence, the attractions higher than 10% include Xie Courtyard (11.6%), Stone Gate Pavilion (12.2%), Half-Mountain Pavilion (14.8%), and Observation Tower (15.9%). It means that most tourists have more than a 10% probability of choosing to transfer to these attractions when they travel in the Kushan Scenic Area.
Meanwhile, we charted the in-degree and out-degree tourist flow among attractions based on the transfer frequency statistics in Table 4, depicted in Figure 6. There is a greater mutual transfer of tourists between attractions in the Kushan and Yongquan Scenic Area and the Phoenix Pool and White Cloud Scenic Area. The results indirectly indicate that attractions in the Kushan and Yongquan Scenic Area and the Phoenix Pool and White Cloud Scenic Area exhibit higher competitiveness and are more recognized by tourists regarding tourism appeal.
To summarize the transfer patterns of tourists within scenic areas, we further visualized the transfer probability outcomes. Given the potential probability of low tourist flow at attractions but a high transfer probability, we focused exclusively on instances where the transfer probability exceeded 0.10 and the tourist flow exceeded 10. The comprehensive visualization is presented in Figure 7a.
Based on the above visualization results, we categorized tourists’ travel areas into three types: Long-distance Travel Area, Short-distance Travel Area, and Outdoor Adventure Travel Area. Additionally, we classified tourists’ transfer patterns into six types, starting from Xie Courtyard, Gratitude Pavilion, Jicui Nunnery, Shan Brook, Kuliang Club, and Mo Brook, respectively: Traditional Mountaineering and Sightseeing Pattern; Short-distance Mountaineering Pattern; Sightseeing and Mountaineering Pattern; Outdoor Exploration Pattern; Long-distance and Sightseeing Pattern; Long-distance Mountaineering Pattern.
(1)
The Traditional Mountaineering and Sightseeing Pattern involves the following tourist routes: Xie Courtyard → Stone Gate Pavilion → Half-Mountain Pavilion → Observation Tower → Gratitude Pavilion. Meanwhile, the Short-Distance Mountaineering and Fitness Pattern includes the following tourist routes: Gratitude Pavilion → Observation Tower → Xie Courtyard, as shown in Figure 7b. The above two transfer patterns are characterized by shorter routes and a higher concentration of historical and cultural resources, making them ideal for hiking and sightseeing. These two transfer patterns are within the Kushan and Yongquan Scenic Area, belonging to the Short-Distance Travel Area.
(2)
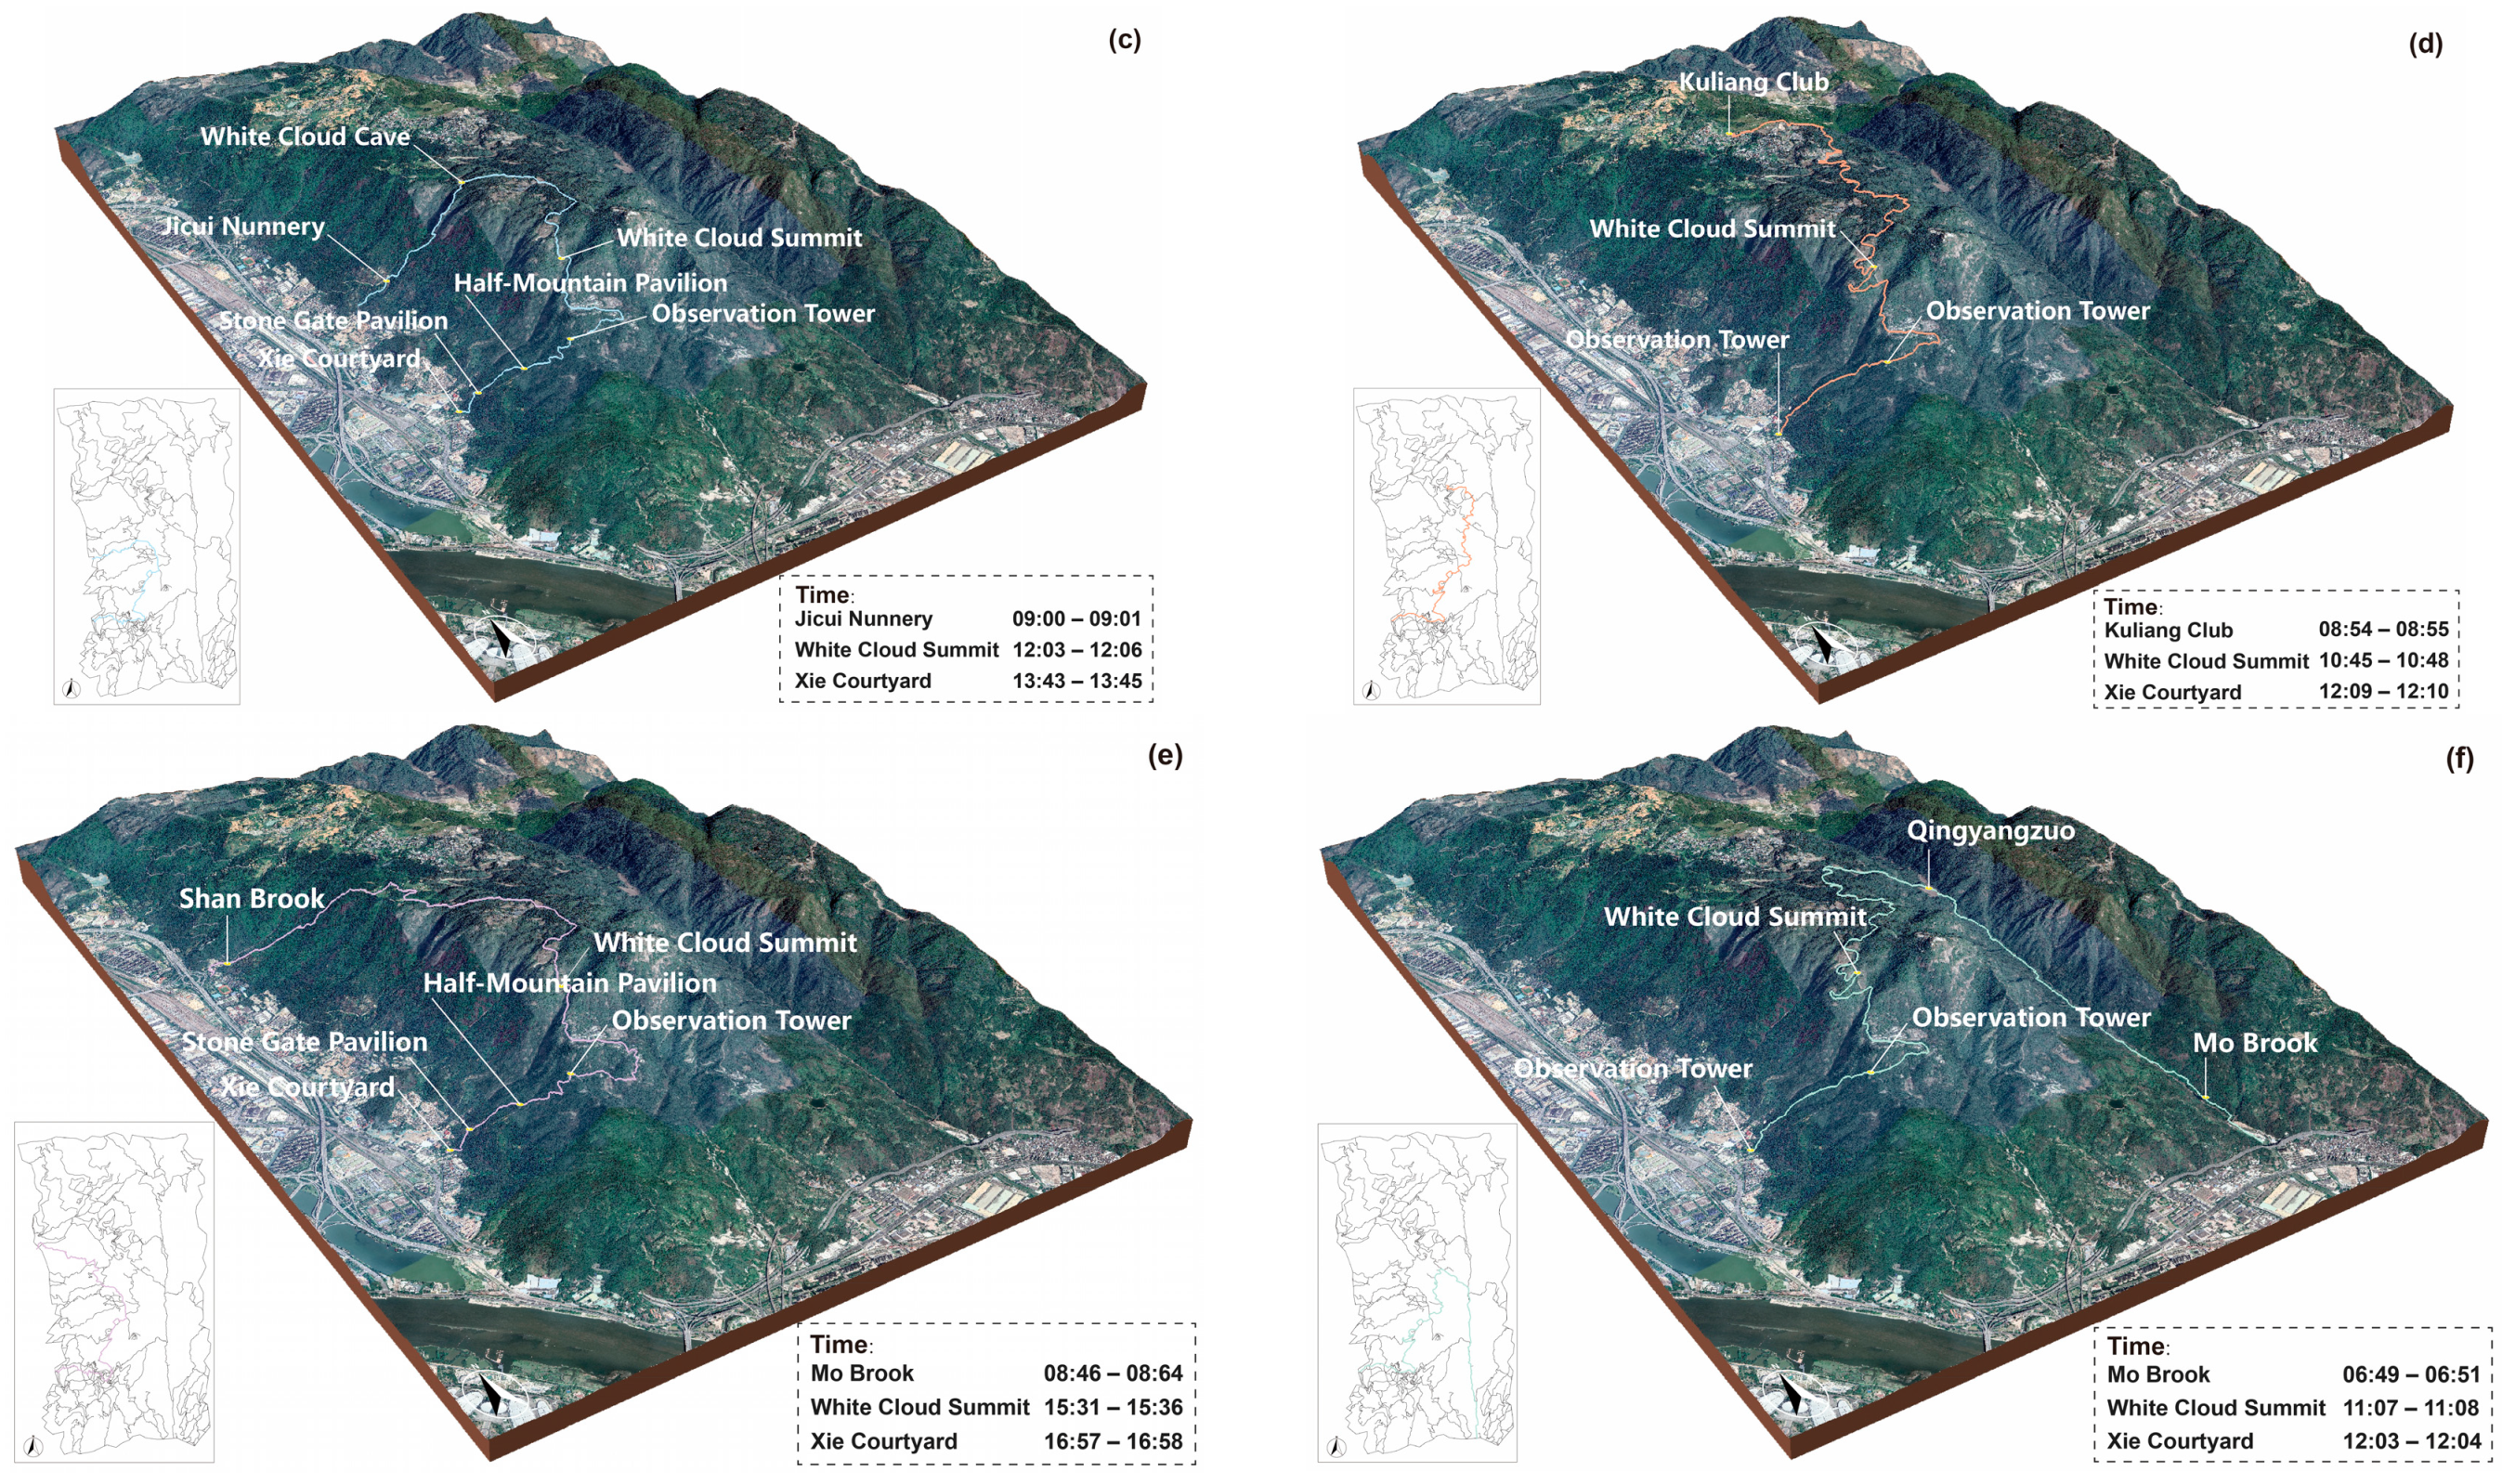
The Sightseeing and Mountaineering Pattern involves the following tourist routes: Jicui Nunnery → White Cloud Cave → White Cloud Summit → Xie Courtyard; the Long-Distance and Sightseeing Pattern includes routes: Shan Brook → White Cloud Summit → Observation Tower → Xie Courtyard; the Long-Distance Mountaineering Pattern covers routes: Kuliang Club → Cryptomeria Fortunel Park → White Cloud Summit → Observation Tower → Xie Courtyard, as illustrated in Figure 7c. The above three transfer patterns have longer distances, except for the Long-Distance Mountaineering Pattern. The other two have steeper routes during the transfer process. Overall, these transfer patterns provide the opportunity to appreciate the scenic areas’ natural and cultural landscapes. The three transfer patterns are within the Cedar and Kuliang Scenic Area, the Phoenix Pool and White Cloud Scenic Area, and the White Horse Crossing Shan Brook Scenic Area, which all pertain to the Long-Distance Travel Area.
(3)
The Outdoor Exploration Pattern involves a touring route: Mo Brook → Qingyangzuo → White Cloud Summit → Xie Courtyard, as illustrated in Figure 7d. This route is favored by outdoor enthusiasts due to its focus on natural landscapes. Situated within the Mo Brook and Sword Gorge Scenic Area, this transfer pattern operates in an area with underdeveloped infrastructure and belongs to the Outdoor Adventure Travel Area.

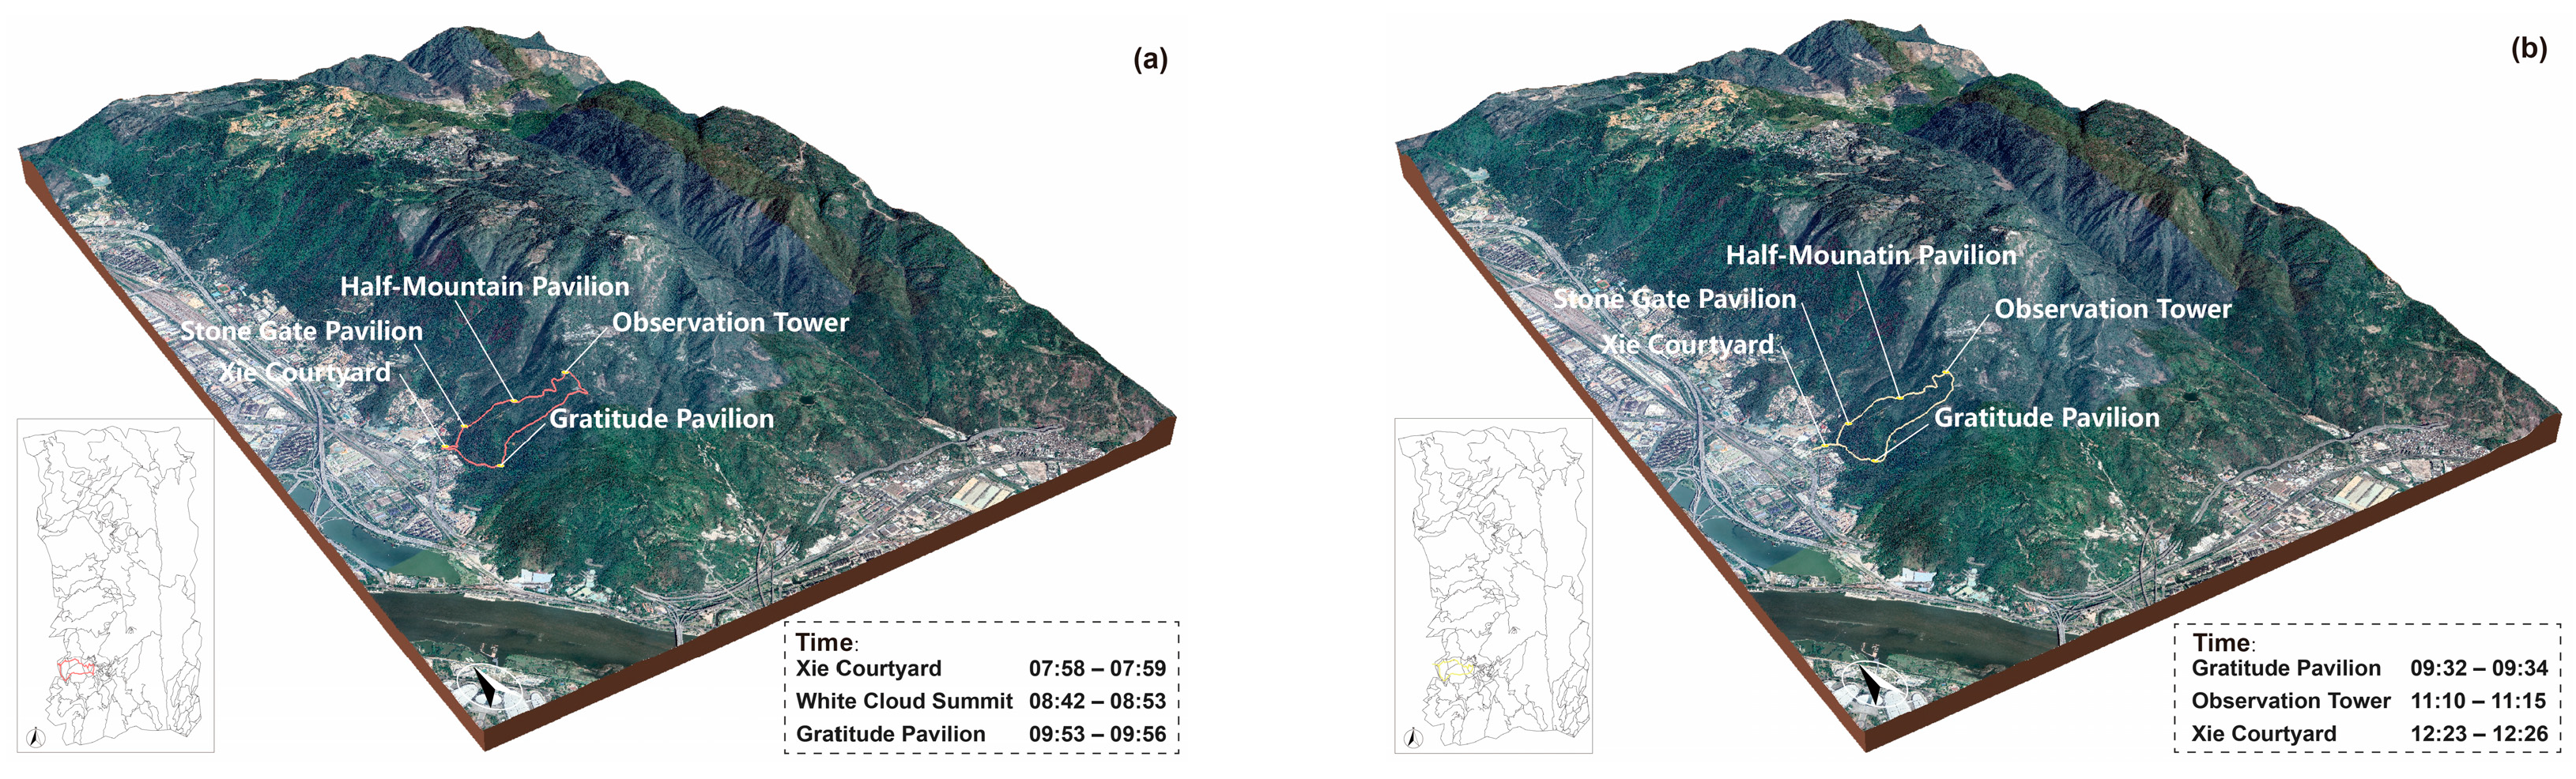
3.3. Spatio-Temporal Behavior Patterns of Tourists in the Scenic Area

Concerning the analysis of spatio-temporal behavior, we applied the K-means clustering method to categorize tourists’ spatio-temporal behavior within the Kushan Scenic Area. As depicted in Figure 7a, the White Cloud Summit and the Observation Tower are midpoints along six distinct movement routes. We identified the arrival and departure times of starting, mid, and endpoints as the clustering objects. Following the temporal information of the six movement patterns mentioned above, we clustered each pattern into three categories to observe the temporal nodes of tourists along various routes. The clustering outcomes are shown in Table 7. In addition, Figure 8 further shows the most common routes traveled by tourists in each of the six modes of movement.
(1)
Traditional Mountaineering and Sightseeing Patterns: 58% of the tourists chosen to depart from the Xie Courtyard at 07:58 a.m., arrive at the Observation Tower at 08:42 a.m., and leave from the Gratitude Pavilion at 09:56 a.m., as shown in Figure 8a.
(2)
Short-Distance Mountaineering Pattern: 50% of the tourists chosen to depart from the Gratitude Pavilion at 09:32 a.m., arrive at the Observation Tower at 11:10 a.m., and leave from the Xie Courtyard at 12:26 p.m., as shown in Figure 8b.
(3)
Sightseeing and Mountaineering Patterns: 52% of the tourists chosen to depart from the Jicui Nunnery at 09:00 a.m., arrive at the White Cloud Summit at 12:03 p.m., and leave from the Xie Courtyard at 1:45 p.m., as shown in Figure 8c.
(4)
Long-Distance Mountaineering Pattern: 46% of the tourists chosen to depart from the Kuliang Club at 08:54 a.m., arrive at the White Cloud Summit at 10:45 a.m., and leave from the Xie Courtyard at 12:10 p.m., as shown in Figure 8d.
(5)
Long-Distance Mountaineering and Sightseeing Patterns: 55% of the tourists chosen to depart from Shan Brook at 08:46 a.m., arrive at the White Cloud Summit at 15:31 a.m., and leave from the Xie Courtyard at 16:58 p.m., as shown in Figure 8e.
(6)
Outdoor Exploration Pattern: 90% of the tourists chosen to depart from Mo Brook at 06:49 a.m., arrive at the White Cloud Summit at 11:07 a.m., and leave from the Xie Courtyard at 12:03 p.m., as shown in Figure 8f.
Overall, the analysis indicates that the majority of tourists tend to prefer morning departures from various starting points within the Kushan Scenic Area. However, departure times vary depending on the length of the chosen route. Tourists embarking on the outdoor adventure route typically set out slightly earlier than those selecting the other five routes. It is worth noting that only a small number of tourists opt for evening departures, likely ascending to enjoy the nighttime panorama of Fuzhou city.

4. Discussion

4.1. Unbalanced Potential of Tourist Resources within the Scenic Area

The spatial distribution of tourists was examined by analyzing both the total stay times and geotagged photos, facilitating an understanding of the tourism potential across various zones within the scenic area. Analysis of Figure 3 and Figure 4 reveals a notable inclination of tourists towards the Traditional Tourist Area. In contrast, the Recent Development Area and Outdoor Adventure Area exhibit considerably shorter stay times and fewer shared photos than the Traditional Tourist Area. This discrepancy underscores an imbalance in the distribution of tourism resources within the Kushan Scenic Area. There exists a substantial gap between tourists’ inclination to visit and their propensity to share experiences from these distinct zones. Meanwhile, we obtained the POI data of the Kushan Scenic Area from 2011 to 2023 through Gaode Map (https://www.amap.com, accessed on 2 June 2024), totaling 3307 POIs. Points of Interest (POI) record users’ location semantic information, including type, name, and geographic coordinates (longitude, latitude), which can provide researchers with a data set to analyze geographical and spatial features. Subsequently, we divided the number of 2bulu App users using the Kushan Scenic Area, 2377 (after data cleaning), by the number of POIs obtained from the Gaode Map. The results show that 71.8% of tourists in the scenic area use the 2bulu app. This indirectly indicates that tourists in the scenic area tend to record and share their travel experiences. Consequently, we posit that the local government stands at a pivotal juncture with ample opportunities to enhance tourism marketing and strategic planning initiatives. By leveraging these insights, stakeholders can effectively address the existing disparities and optimize the utilization of resources to bolster overall tourism development within the region.
The Recent Development Area within the Kushan Scenic Area, while lacking the historical depth of the Traditional Tourist Area, holds significance as a representation of Fuzhou’s contemporary port-opening culture. Historically, due to its unique natural environment, it attracted Western missionaries and became home to numerous Western-style villas during the early 20th century [35]. Figure 9a–c depict the historical appearance of Kuliang in the modern era. However, the ravages of World War II resulted in significant damage to its architectural heritage, transforming many original vacation villas into ruins. Despite efforts post-2010 by the local government to explore its cultural and touristic potential, the Recent Development Area still struggles to attract tourists effectively. Through investigating the scenic area, we suggest that identifying the popular tourist attractions can effectively disclose the primary tourist activity areas, serving as evidence for the development of spatial planning and the recreational and entertainment amenities in urban forests. The research found that while the historical periods of the Recent Development Area are not as long as those of the Traditional Tourist Area, the cultural heritage of the Recent Development Area epitomizes Fuzhou’s modern and contemporary opening-up culture and has potential for educational and research purposes. Consequently, effective management of urban forest resources, land, and cultural heritage can advance the sustainable development of urban forests and improve the physical and psychological well-being of the public in natural environments.
Our analysis of the spatio-temporal behavior of tourists reveals a considerable disparity in the tourism resource potential between the Recent Development Area and the Traditional Tourist Area, with the former exhibiting notably weak attractiveness to tourists. Several factors contribute to this deficiency: (1) The distance from different starting points to reach the Recent Development Area is relatively long. (2) For its historical development, the Recent Development Area has been subjected to the ravages of war and other adverse factors, leading to the destruction of numerous historical architectures and the dispersal of attractions throughout the scenic area. (3) Destination marketing organizations lack effective promotional strategies and fail to convey the historical narratives associated with various attractions successfully. To strengthen the area’s tourism potential, local planning and promotional organizations must prioritize enhancing accessibility between attractions. Additionally, it is imperative to devise a coherent plan delineating the narrative framework of the attractions and tour routes, thereby enriching the cultural experience for tourists, augmenting the overall attractiveness of the urban forest’s tourism offerings, and achieving its sustainable development.

4.2. The Impact of Historical and Cultural Heritage Concentration on Tourists’ Travel Experience

The convergence of the Markov chain suggests that the transfer probabilities for the four attractions—Xie Courtyard, Stone Gate Pavilion, Half-Mountain Pavilion, and Observation Tower—are all above 10%. This suggests that regardless of tourists’ departure or arrival points, most will traverse these four attractions. Their placement along classic tourist routes makes them preferred nodes for visitors. Moreover, the area’s concentration of historical and cultural attractions adds to its allure, drawing tourists to explore further. Consequently, it can be concluded that historical-cultural sites within forest-based scenic areas hold significant appeal for tourists, influencing their inclination to transfer and enriching their overall experience within the scenic area.
The Traditional Tourist Area, historically significant according to the Kushan Chronicle and the writings of Qing scholar Zhang Tianlu, has long been a favored destination for travelers. Ancient records document visits to landmarks such as Xie Courtyard, Stone Gate Pavilion, Half-Mountain Pavilion, Yongquan Temple, Drinking Rock, and Lingyuan Cave, emphasizing the area’s rich cultural and historical heritage (Figure 10a–c). This legacy enhances tourists’ experiences, distinguishing it as a destination of enduring appeal within the scenic area.
The study’s findings underscore the enduring appeal of historical heritage in attracting tourists to mountain tourist attractions, influencing their visitation preferences, and evoking a sense of nostalgia [38,39]. Notably, attractions intertwined with mythological narratives hold a particular allure for visitors [40]. This insight helps explain why the Traditional Tourist Area tends to outshine the Recent Development Area: their deeper historical roots inherently captivate tourists more than newer developments. These observations provide valuable context for understanding tourists’ behavior within the Traditional Tourist Area. They are inclined to allocate more time and share more photos in this area due to its rich historical backdrop, concentrated points of interest, established routes, and compelling narratives. These attributes collectively contribute to a more enriching travel experience, elucidating tourists’ preference for these areas over others. This study utilizes trajectory data and geotagged photos derived from social media, which, in contrast to the comments, blogs, photos, and related content within social media [41,42,43], allows for a more precise summary of tourists’ spatio-temporal behavior patterns. Moreover, it facilitates the identification of spatial patterns and popular scenic spots in tourist areas [44], providing a strategic foundation for urban forest tourism marketing and planning.
Figure 10. Old photos of attractions in the Traditional Tourist Area. (a) Xie courtyard at the southwestern foothills of Kushan Mountain. (b) The half-mountain pavilion and pagoda on Kushan Mountain. (c) The panoramic view of Yongquan Temple on Kushan Mountain [45].
Forests 15 01016 g010

4.3. Diverse Time Offerings Vital in Mountain Tourism

The K-means clustering analysis indicates that the majority of tourists visiting the Kushan Scenic Area, whether inclined towards long-distance, short-distance, or outdoor tourism, prefer to begin their journeys in the morning or early afternoon. This highlights the attractiveness of daytime tourism to visitors. However, there is also a growing trend towards implementing strategic plans for nighttime tourism in mountainous scenic areas. In essence, embracing 24/7 tourism patterns emerges as a crucial marketing strategy for mountain tourist destinations [46,47].
For the Kushan Scenic Area, nighttime tours were a more popular way for the ancients. According to Kushan’s Cultural and Artistic Records, certain ancient travelers enjoyed ascending the mountain in the evening to gaze upon the night panorama of Fuzhou City [48]. Additionally, some ancients preferred lodging at Yongquan Temple, where they would contemplate the night sky, engage in stargazing, and partake in Zen meditation. For instance, in the late Qing Dynasty, the poet Su Nan employed the phrase “Overlooking the city and mountains, with the Ma River in the distance” while ascending Kushan in the evening to portray the night panorama of Fuzhou City. Similarly, during the Ming Dynasty, the poet He Jiuyun lodged at the Kushan Temple overnight, and he penned the verse, “The sky draws close, the stars chill, mountains abound, and the Milky Way veers.” It is evident that the Kushan Scenic Area holds significant potential for nighttime tourism. However, due to urban development and shifts in the area’s tourism focus, nighttime tourism in Kushan is no longer a prevalent choice for tourists.
Drawing on comparisons between ancient and modern situations, we contend that tourists hold a heightened appreciation of the environment and night views in mountainous areas [49]. Tourist activities or lodging at night in mountainous areas can facilitate the observation of astronomical phenomena such as the sun, moon, and stars [50,51]. Simultaneously, it allows tourism marketing organizations to advertise the city’s nightscape. These potential spatio-temporal behaviors can, in turn, become important movement patterns for tourists visiting scenic areas [47], thereby serving as a foundation for maximizing the tourism potential across various zones within the scenic area. As argued by Huang and Wang [52], the nightscape of mountainous scenic areas exudes a sense of mystery and imagination surpassing that of the daytime. Consequently, within the policy of China’s proposed nighttime economy, nighttime tourism emerges as a crucial tool for mountainous tourism marketing [53]. Currently, the potential for nighttime tourism in the Kushan Scenic Area is still in its infancy. Despite efforts from local governments, destination marketing organizations, and social media users to promote Kushan’s nightscape, tourists exhibit limited enthusiasm for nighttime hiking and sightseeing during their travel itineraries. Hence, there remains ample opportunity to dig into the nighttime tourism potential of the Kushan Scenic Area, with the all-weather tourism pattern presenting a novel approach to tourism marketing strategy.

5. Conclusions

This study analyzed the spatio-temporal behavioral patterns of tourists in the Kushan Scenic Area by examining their movement trajectory data and geotagged photographs. Research findings: (1) The grid analysis categorizes the scenic area into three distinct zones: the Traditional Tourist Area, the Recent Development Area, and the Outdoor Adventure Area. (2) Analysis of tourists’ movement trajectories identifies six patterns: (a) Traditional Mountaineering and Sightseeing Patterns; (b) Short-Distance Mountaineering Patterns; (c) Sightseeing and Mountaineering Patterns; (d) Long-Distance Mountaineering Patterns; (e) Long-Distance Mountaineering and Sightseeing Patterns; (f) Outdoor Exploration Pattern. (3) Upon convergence, the steady-state distribution results of the Markov chain reveal that tourists predominantly transfer towards attractions located within the Traditional Tourist Area. (4) Many tourists engage in daytime activities within the scenic area, primarily departing in the morning, while nighttime activities attract fewer visitors. In conclusion, this study aids government departments, scenic area planners, and destination marketing organizations in identifying popular attractions and areas within scenic regions. It also facilitates tourism-related departments’ efforts to enhance the environment and quality of scenic areas, building upon existing infrastructure and enriching tourists’ experiences within the urban forest.
However, this study also possesses certain limitations. Specifically, it focuses on the mountainous and forested scenic area, which differs somewhat from other scenic areas regarding the tourism experience. It remains uncertain whether the differences extend to the applicability of the methodology of this study to other types of research. Meanwhile, this study lacks a stringent demographic stratification standard compared to survey research. The GPS trajectory data solely reflects the overall spatio-temporal behavior of tourists within scenic areas, leaving unexplored the potential differences resulting from variables such as gender, education, age, and others. Therefore, further research on mountain scenic areas requires more advanced technical methods to analyze tourists’ spatio-temporal behavior patterns.

Author Contributions

Conceptualization, H.L. and H.W.; Methodology, D.-Y.Z.; Software, H.L., H.W. and D.-Y.Z.; Validation, C.W.; Investigation, H.W. and X.-C.H.; Resources, X.-C.H.; Data curation, H.L.; Writing—original draft, H.L. and H.W.; Writing—review & editing, H.L., L.Y., X.-C.H. and C.W.; Visualization, H.L. and D.-Y.Z.; Supervision, L.Y., X.-C.H. and C.W. All authors have read and agreed to the published version of the manuscript.

Funding

This work was supported by the National Natural Science Foundation of China (Grant No. 52208052), the Program of Humanities and Social Science Research Program of the Ministry of Education of China (Grant No. 21YJCZH038), the research and innovation outcomes of the Brand Discipline Research Project at the Advertising School and Boya Brand Research Institute of Communication University of China (Grant No. BYYB2311), and the Fujian Natural Science Foundation, of China (Grant No. 2023J05108).

Data Availability Statement

Data is contained within the article.

Acknowledgments

The authors draw all the figures and tables. The old photos referenced in the manuscript are sourced from the Yale University Digital Library and the University of Southern California Digital Library, as well as the photographic works of Daij and Tei (1926).

Conflicts of Interest

The authors declare no conflicts of interest.

References

  1. Chen, X.; Cheng, Z.; Kim, G.-B. Make It Memorable: Tourism Experience, Fun, Recommendation and Revisit Intentions of Chinese Outbound Tourists. Sustainability 2020, 12, 1904. [Google Scholar] [CrossRef]
  2. Guo, S.; Sun, W.; Chen, W.; Zhang, J.; Liu, P. Impact of Artificial Elements on Mountain Landscape Perception: An Eye-Tracking Study. Land 2021, 10, 1102. [Google Scholar] [CrossRef]
  3. Zeng, L.; Li, R.Y.M.; Huang, X. Sustainable Mountain-Based Health and Wellness Tourist Destinations: The Interrelationships between Tourists’ Satisfaction, Behavioral Intentions, and Competitiveness. Sustainability 2021, 13, 13314. [Google Scholar] [CrossRef]
  4. Sun, Q.; Zhang, N.; Liu, Z.; Liao, B. Tourism Resources and Carrying Capacity of Scenic Tourism Areas Based on Forest Ecological Environment. South. For. J. For. Sci. 2020, 82, 10–14. [Google Scholar] [CrossRef]
  5. Lin, C.H.; Wang, W.C.; Nyaupane, G.P. The Intersection of Landscape Values for Tourists and Residents in a Mining Heritage Destination: A Case Study of Jiufen in Taiwan. Int. J. Herit. Stud. 2024, 30, 298–317. [Google Scholar] [CrossRef]
  6. Cai, Z.; Fang, C.; Zhang, Q.; Chen, F. Joint Development of Cultural Heritage Protection and Tourism: The Case of Mount Lushan Cultural Landscape Heritage Site. Herit. Sci. 2021, 9, 86. [Google Scholar] [CrossRef]
  7. Chrobak, A.; Ugolini, F.; Pearlmutter, D.; Raschi, A. Thermal Tourism and Geoheritage: Examining Visitor Motivations and Perceptions. Resources 2020, 9, 58. [Google Scholar] [CrossRef]
  8. Wang, Y.; Bramwell, B. Heritage Protection and Tourism Development Priorities in Hangzhou, China: A Political Economy and Governance Perspective. Tour. Manag. 2012, 33, 988–998. [Google Scholar] [CrossRef]
  9. Liao, Z.; Zhang, L. Spatial Distribution Evolution and Accessibility of A-Level Scenic Spots in Guangdong Province from the Perspective of Quantitative Geography. PLoS ONE 2021, 16, e0257400. [Google Scholar] [CrossRef]
  10. Żemła, M. Inter-Destination Cooperation: Forms, Facilitators and Inhibitors—The Case of Poland. J. Destin. Mark. Manag. 2014, 3, 241–252. [Google Scholar] [CrossRef]
  11. Li, L.; Pei, Z.; Li, Q.; Hao, F.; Chen, X.; Chen, J. Identifying Tourism Attractiveness Based on Intra-Destination Tourist Behaviour: Evidence from Wi-Fi Data. Curr. Issues Tour. 2023, 39, 1–19. [Google Scholar] [CrossRef]
  12. Huang, X.T.; Wu, B.H. Intra-Attraction Tourist Spatial-Temporal Behaviour Patterns. Tour. Geogr. 2012, 14, 625–645. [Google Scholar] [CrossRef]
  13. Chung, H.C.; Chung, N.; Nam, Y. A Social Network Analysis of Tourist Movement Patterns in Blogs: Korean Backpackers in Europe. Sustainability 2017, 9, 2251. [Google Scholar] [CrossRef]
  14. Phithakkitnukoon, S.; Horanont, T.; Witayangkurn, A.; Siri, R.; Sekimoto, Y.; Shibasaki, R. Understanding Tourist Behavior Using Large-Scale Mobile Sensing Approach: A Case Study of Mobile Phone Users in Japan. Pervasive Mob. Comput. 2015, 18, 18–39. [Google Scholar] [CrossRef]
  15. Liu, B.; Huang, S.; Fu, H. An Application of Network Analysis on Tourist Attractions: The Case of Xinjiang, China. Tour. Manag. 2017, 58, 132–141. [Google Scholar] [CrossRef]
  16. Xu, Y.; Li, J.; Belyi, A.; Park, S. Characterizing Destination Networks through Mobility Traces of International Tourists—A Case Study Using a Nationwide Mobile Positioning Dataset. Tour. Manag. 2021, 82, 104195. [Google Scholar] [CrossRef]
  17. Miah, S.J.; Vu, H.Q.; Gammack, J.; McGrath, M. A Big Data Analytics Method for Tourist Behaviour Analysis. Inf. Manag. 2017, 54, 771–785. [Google Scholar] [CrossRef]
  18. Hu, F.; Li, Z.; Yang, C.; Jiang, Y. A Graph-Based Approach to Detecting Tourist Movement Patterns Using Social Media Data. Cartogr. Geogr. Inf. Sci. 2019, 46, 368–382. [Google Scholar] [CrossRef]
  19. Mou, N.; Zheng, Y.; Makkonen, T.; Yang, T.; Tang, J.; Song, Y. Tourists’ Digital Footprint: The Spatial Patterns of Tourist Flows in Qingdao, China. Tour. Manag. 2020, 81, 104151. [Google Scholar] [CrossRef]
  20. Zhou, X.; Chen, Z. Destination Attraction Clustering: Segmenting Tourist Movement Patterns with Geotagged Information. Tour. Geogr. 2023, 25, 797–819. [Google Scholar] [CrossRef]
  21. Xia, J.; Zeephongsekul, P.; Packer, D. Spatial and Temporal Modelling of Tourist Movements Using Semi-Markov Processes. Tour. Manag. 2011, 32, 844–851. [Google Scholar] [CrossRef]
  22. Smallwood, C.B.; Beckley, L.E.; Moore, S.A. An Analysis of Visitor Movement Patterns Using Travel Networks in a Large Marine Park, North-Western Australia. Tour. Manag. 2012, 33, 517–528. [Google Scholar] [CrossRef]
  23. Birenboim, A.; Anton-Clavé, S.; Russo, A.P.; Shoval, N. Temporal Activity Patterns of Theme Park Visitors. Tour. Geogr. 2013, 15, 601–619. [Google Scholar] [CrossRef]
  24. Huang, X.; Li, M.; Zhang, J.; Zhang, L.; Zhang, H.; Yan, S. Tourists’ Spatial-Temporal Behavior Patterns in Theme Parks: A Case Study of Ocean Park Hong Kong. J. Destin. Mark. Manag. 2020, 15, 100411. [Google Scholar] [CrossRef]
  25. Huang, L. Evaluation of Eco-Tourism Resources and Environment Bearing Capacity Analysis about Mountain Gu Scenery District. Master’s Thesis, Fujian Agriculture and Forestry University, Fuzhou, China, 2009. [Google Scholar]
  26. Kushan Mountain Scenic Area General Planning (2022–2035). Available online: https://gl.fuzhou.gov.cn/zz/zjgl/glgh/202206/t20220616_4380771.htm (accessed on 15 March 2024).
  27. Liu, J.; Yang, L.; Zhou, H.; Wang, S. Impact of Climate Change on Hiking: Quantitative Evidence through Big Data Mining. Curr. Issues Tour. 2021, 24, 3040–3056. [Google Scholar] [CrossRef]
  28. Liu, Q.; Tang, X.; Li, K. Do Historic Landscape Images Predict Tourists’ Spatio-Temporal Behavior at Heritage Sites? A Case Study of West Lake in Hangzhou, China. Land 2022, 11, 1643. [Google Scholar] [CrossRef]
  29. Li, D.; Zhu, X.; Gong, J. From Digital Map to Spatial Information Multi-grid—A Thought of Spatial Information Multi-grid Theory. Geomat. Inf. Sci. Wuhan Univ. 2003, 5, 642–650. [Google Scholar]
  30. Vu, H.Q.; Li, G.; Law, R.; Ye, B.H. Exploring the Travel Behaviors of Inbound Tourists to Hong Kong Using Geotagged Photos. Tour. Manag. 2015, 46, 222–232. [Google Scholar] [CrossRef]
  31. Manning, C.D.; Raghavan, P.; Schütze, H. Introduction to Information Retrieval; Cambridge University Press: New York, NY, USA, 2008; ISBN 978-0-521-86571-5. [Google Scholar]
  32. Zhang, W. SPSS Statistical Analysis Advanced Tutorial, 3rd ed.; Higher Education Press: Beijing, China, 2017; ISBN 978-7-04-047460-2. [Google Scholar]
  33. Xu, D.; Cong, L.; Wall, G. Tourists’ Spatio-Temporal Behaviour and Concerns in Park Tourism: Giant Panda National Park, Sichuan, China. Asia Pac. J. Tour. Res. 2019, 24, 924–943. [Google Scholar] [CrossRef]
  34. Lau, G.; McKercher, B. Understanding Tourist Movement Patterns in a Destination: A GIS Approach. Tour. Hosp. Res. 2006, 7, 39–49. [Google Scholar] [CrossRef]
  35. Hu, J. The Research on Western Architecture and Its Influence in Modern Fuzhou City (1840–1949). Ph.D. Thesis, Fujian Normal University, Fuzhou, China, 2022. [Google Scholar]
  36. Kuliang Mt. Resort, Fujian, China, China, ca.1920–1930. Available online: https://digitallibrary.usc.edu/CS.aspx?VP3=SearchResult&VBID=2A3BXZ8N31OMY&PN=2&WS=SearchResults#/SearchResult&VBID=2A3BXZ8I2SA2W&PN=1&WS=SearchResults (accessed on 15 March 2024).
  37. Willard Livingstone Beard Family Papers. Available online: https://divinity-adhoc.library.yale.edu/BeardPapers/ (accessed on 15 March 2024).
  38. Opačić, V.T.; Banda, A. Alternative Forms of Tourism in Mountain Tourism Destination: A Case Study of Bjelašnica (Bosnia and Herzegovina). Geogr. Pannonica 2018, 22, 40–53. [Google Scholar] [CrossRef] [PubMed]
  39. Verma, A.; Rajendran, G. The Effect of Historical Nostalgia on Tourists’ Destination Loyalty Intention: An Empirical Study of the World Cultural Heritage Site–Mahabalipuram, India. Asia Pac. J. Tour. Res. 2017, 22, 977–990. [Google Scholar] [CrossRef]
  40. Pijet-Migoń, E.; Migoń, P. Geoheritage and Cultural Heritage—A Review of Recurrent and Interlinked Themes. Geosciences 2022, 12, 98. [Google Scholar] [CrossRef]
  41. Ding, T.; Sun, W.; Wang, Y.; Yu, R.; Ge, X. Comparative Evaluation of Mountain Landscapes in Beijing Based on Social Media Data. Land 2022, 11, 1841. [Google Scholar] [CrossRef]
  42. Kim, J.; Son, Y. Assessing and Mapping Cultural Ecosystem Services of an Urban Forest Based on Narratives from Blog Posts. Ecol. Indic. 2021, 129, 107983. [Google Scholar] [CrossRef]
  43. Zhang, J.; Zhao, Z. Tourists’ Perceptual Presentation of National Forest Park—A Case Study of Wujin Mountain National Forest Park. J. For. Res. 2022, 27, 15–19. [Google Scholar] [CrossRef]
  44. Norman, P.; Pickering, C.M. Factors Influencing Park Popularity for Mountain Bikers, Walkers and Runners as Indicated by Social Media Route Data. J. Environ. Manag. 2019, 249, 109413. [Google Scholar] [CrossRef]
  45. Daij, T.; Tei, S. Chinese Historical Sites of the Late Qing Dynasty and the Republic of China; China Pictorial Press: Beijing, China, 2017; ISBN 978-7-5146-1726-9. [Google Scholar]
  46. Gwiazdzinski, L.; Straw, W. Nights and Mountains. Preliminary Explorations of a Double Frontier. J. Alp. Res. Rev. Géogr. Alp. 2018. [Google Scholar] [CrossRef]
  47. Liu, W.; Wang, B.; Yang, Y.; Mou, N.; Zheng, Y.; Zhang, L.; Yang, T. Cluster Analysis of Microscopic Spatio-Temporal Patterns of Tourists’ Movement Behaviors in Mountainous Scenic Areas Using Open GPS-Trajectory Data. Tour. Manag. 2022, 93, 104614. [Google Scholar] [CrossRef]
  48. Zhang, T. Kushan’s Cultural and Artistic Records, 1st ed.; Sea Breeze Publishing House: Fuzhou, China, 2001. [Google Scholar]
  49. Xu, J.; Xu, J.; Gu, Z.; Chen, G.; Li, M.; Wu, Z. Network Text Analysis of Visitors’ Perception of Multi-Sensory Interactive Experience in Urban Forest Parks in China. Forests 2022, 13, 1451. [Google Scholar] [CrossRef]
  50. Mocior, E.; Nowak-Olejnik, A.; Rechciński, M.; Franczak, P.; Hibner, J.; Krąż, P.; Tokarczyk, N. Sunrise as a Tourist Attraction in the Context of Tourist Motivation Theory: A Case Study of the Peak of Babia Góra (Western Carpathians). Bull. Geogr. Socio-Econ. Ser. 2015, 30, 109–121. [Google Scholar] [CrossRef]
  51. Guo, L.H.; Cheng, S.; Liu, J.; Wang, Y.; Cai, Y.; Hong, X.C. Does Social Perception Data Express the Spatio-Temporal Pattern of Perceived Urban Noise? A Case Study Based on 3,137 Noise Complaints in Fuzhou, China. Appl. Acoust. 2022, 201, 109129. [Google Scholar] [CrossRef]
  52. Huang, W.J.; Wang, P. “All That’s Best of Dark and Bright”: Day and Night Perceptions of Hong Kong Cityscape. Tour. Manag. 2018, 66, 274–286. [Google Scholar] [CrossRef]
  53. Shang, K.; Zhang, Y.; Li, X.; Li, W.; Zhou, G. Spatial Characteristics and Influencing Factors of Night Cultural and Tourism Consumption Agglomeration Areas in China. IEEE J. Sel. Top. Appl. Earth Obs. Remote Sens. 2023, 17, 261–273. [Google Scholar] [CrossRef]
Figure 1. Location of the case study area.
Forests 15 01016 g001
Figure 2. Research process.
Forests 15 01016 g002
Figure 3. Spatio-temporal distribution of total tourists’ stay time. (a) The distribution of total tourists’ stay time in the Traditional Tourist Area. (b) The distribution of total tourists’ stay time in the Recent Development Area. (c) The distribution of total tourists’ stay time in the Outdoor Adventure Area.
Forests 15 01016 g003
Figure 4. Spatio-temporal distribution of the total tourists’ photographs. (a) The distribution of total tourists’ photographs in the Traditional Tourist Area. (b) The distribution of total tourists’ photographs in the Recent Development Area. (c) The distribution of total tourists’ photographs in the Outdoor Adventure Area.
Forests 15 01016 g004
Figure 5. Spatio-temporal distribution of total tourists’ trajectory count. (a) The distribution of total trajectory points in the Traditional Tourist Area. (b) The distribution of total trajectory points in the Recent Development Area. (c) The distribution of total trajectory points in the Outdoor Adventure Area.
Forests 15 01016 g005
Figure 6. The in-degree and out-degree situations of various attractions within the scenic area.
Forests 15 01016 g006
Figure 7. Analysis of tourist movement patterns between different attractions. (a) The overall movement of tourists between attractions in the Kushan Scenic Area. (b) Tourists showed two movement patterns in the Traditional Tourist Area. (c) Tourists showed three movement patterns between the Recent Development Area and the Traditional Tourist Area. (d) Tourists showed one movement pattern between the Outdoor Adventure Area, the Recent Development Area, and the Traditional Tourist Area.
Forests 15 01016 g007
Figure 8. Main routes for tourists. (a) Traditional Mountaineering and Sightseeing Patterns. (b) Short-Distance Mountaineering Pattern. (c) Sightseeing and Mountaineering Patterns. (d) Long-Distance Mountaineering Pattern. (e) Long-Distance Mountaineering and Sightseeing Patterns. (f) Outdoor Exploration Pattern.
Forests 15 01016 g008aForests 15 01016 g008b
Figure 9. Old photos of Kuliang Resort Area. (a) Overlooking Kuliang from the intersection of Jacob’s Ladder and West Road. (b) Resort villas in Kuliang Resort Area. (c) An aerial view of the Guling Resort Area [36,37].
Forests 15 01016 g009
Table 1. KML Data Sorting.
NIDLongitudeLatitudeAltitudeTimeSecMinActual DistanceTheoretical Distance
148605960119.371913926.056007221.5816:17:290000
148605960119.372038726.055990821.5816:17:3120.03312.6242.8
148605960119.372065126.055947727.2416:17:3540.0675.4585.6
148605960119.372097626.055961327.7116:17:4160.13.5858.4
148605960119.372081426.056008826.2916:17:4760.15.5088.4
148605960119.372027626.056031324.1716:17:5140.0675.9355.6
“…” represents the same data type but is omitted due to the large amount of data.
Table 2. Main route reconstruction.
NTimeAttractionTimeAttractionTimeAttractionTimeAttractionTimeAttraction
116:17:29Xie Courtyard16:29:04Stone Gate Pavilion16:47:55Half-Mountain Pavilion17:14:37Observation Tower//
213:02:00White Cloud Cave14:21:46White Cloud Summit14:59:08Observation Tower14:59:48Eighteen Scenes Park//
315:48:38Xie Courtyard17:39:47Eighteen Scenes Park17:45:53Observation Tower19:06:01Half-Mountain Pavilion19:27:07Stone Gate Pavilion
414:32:05Xie Courtyard14:41:27Stone Gate Pavilion14:51:04Half-Mountain Pavilion15:08:00Observation Tower16:03:56Gratitude Pavilion
517:34:12Observation Tower17:34:22Eighteen Scenes Park18:08:36Xie Courtyard////
“…” represents the same data type but is omitted due to the large amount of data. “/” represents that there are no other attractions after the point.
Table 3. Attraction List.
Attraction NameCodingAttraction NameCodingAttraction NameCodingAttraction NameCoding
Xie CourtyardXCYongquan TempleYQTBore NunneryBRNQingyangzuoQYZ
Stone Gate PavilionSGPLingyuan CaveLYCWhite Cloud SummitWCSShan BrookSB
Half-Mountain PavilionHMPWhite Cloud PavilionWCPWhite Cloud CaveWCCKuliang ClubKC
Observation TowerOTGratitude PavilionGPJicui NunneryJCNCrytomeria Fortunel ParkCFP
Eighteen Scenes ParkESPBuddhist CaveBCMo BrookMBKeping ReservoirKPR
Table 4. Transfer frequency of each attraction.
O/DXCSGPHMPOTESPYQTLYCWCPGPBCBRNWCSWCCJCNMBQYZSBKCCFPKPR
XC023023728798294538197702051182411274
SGP40023022213101412261772131212363
HMP88082122521111111121
OT304547020211633311111111
ESP24222569014216531061111122
YQT11111012112211111111
LYC1710111566018632211211111
WCP455514100121111211111
GP5738479241152620049133952131239114
BC23121319731317170151721421122
BRN11111111110111111111
WCS81343463268252134344901811134294
WCC24716416724768544682253670116111233345
JCN25171918536482242440222334
MB40882016114647139110251163
QYZ322322431211111501111
SB14661141116211641210359
KC146814611265120211110146
CFP75552111111742132407
KPR633641211118224514130
Table 5. Transition probability matrix of each attraction.
O/DXCSGPHMPOTESPYQTLYCWCPGPBCBRNWCSWCCJCNMBQYZSBKCCFPKPR
XC0.0000.1720.1770.2140.0730.0220.0340.0280.1470.0520.0150.0380.0130.0010.0030.0010.0010.0010.0050.003
SGP0.0630.0000.3630.3510.0210.0160.0220.0190.0410.0270.0110.0330.0050.0020.0030.0020.0030.0050.0090.005
HMP0.1630.1630.0000.1630.0410.0200.0410.0410.1020.0410.0200.0200.0200.0200.0200.0200.0200.0200.0410.020
OT0.1780.2660.2780.0000.1180.0120.0060.0060.0360.0180.0180.0180.0060.0060.0060.0060.0060.0060.0060.006
ESP0.1220.1120.1280.3520.0000.0050.0200.0100.0820.0260.0150.0510.0310.0050.0050.0050.0050.0050.0100.010
YQT0.0450.0450.0450.0450.0450.0000.0450.0910.0450.0450.0910.0910.0450.0450.0450.0450.0450.0450.0450.045
LYC0.1620.0950.1050.1430.0570.0570.0000.1710.0570.0290.0190.0190.0100.0100.0190.0100.0100.0100.0100.010
WCP0.0830.1040.1040.1040.0210.0830.2080.0000.0210.0420.0210.0210.0210.0210.0420.0210.0210.0210.0210.021
GP0.1150.0770.0950.1850.0830.0300.0520.0400.0000.0990.0260.0790.0100.0040.0260.0240.0060.0180.0220.008
BC0.1350.0700.0760.1110.0410.0180.0760.0990.0990.0000.0880.0990.0120.0060.0230.0120.0060.0060.0120.012
BRN0.0530.0530.0530.0530.0530.0530.0530.0530.0530.0530.0000.0530.0530.0530.0530.0530.0530.0530.0530.053
WCS0.1760.0740.0740.1370.0560.0170.0540.0460.0740.0740.1060.0000.0390.0240.0020.0070.0090.0040.0200.009
WCC0.1660.1100.1120.1660.0460.0030.0030.0030.0460.0150.0030.2460.0000.0070.0040.0070.0080.0020.0220.030
JCN0.1180.0810.0900.0850.0240.0140.0280.0190.0380.0090.0090.1990.2090.0000.0090.0090.0090.0140.0140.019
MB0.1980.0400.0400.0990.0790.0050.0690.0300.0200.0350.0050.1930.0050.0050.0000.1240.0050.0050.0300.015
QYZ0.0640.0430.0430.0640.0430.0430.0850.0640.0210.0430.0210.0210.0210.0210.3190.0000.0210.0210.0210.021
SB0.1490.0640.0640.1170.0430.0110.0110.0110.0640.0210.0110.1700.0430.0110.0210.0110.0000.0320.0530.096
KC0.1270.0550.0730.1270.0550.0090.0090.0180.0550.0450.0090.1820.0180.0090.0090.0090.0090.0000.1270.055
CFP0.1170.0830.0830.0830.0330.0170.0170.0170.0170.0170.0170.1170.0670.0330.0170.0500.0330.0670.0000.117
KPR0.0880.0440.0440.0880.0590.0150.0290.0150.0150.0150.0150.1180.0290.0290.0590.0740.0150.0590.1910.000
Table 6. Steady-state distribution of each attraction.
A/PXCSGPHMPOTESPYQTLYCWCPGPBCBRNWCSWCCJCNMBQYZSBKCCFPKPR
Initial Probability0.2230.1060.0080.0280.0330.0040.0180.0080.0830.0290.0030.0770.2480.0350.0340.0080.0160.0180.0100.011
Steady-State
Distribution
0.1160.1220.1480.1590.0570.0210.0370.0340.0640.0380.0250.0510.020.0120.0190.0150.0110.0130.0220.016
Table 7. The clustering results are based on tourists’ movement times.
O/DCluster 1Cluster 2Cluster 3FSig.O/DCluster 1Cluster 2Cluster 3FSig.
58%33%9%50%27%23%
XC07:5813:1018:40210.0380.001GP09:3213:5618:2489.2610.001
07:5913:1218:41211.6420.00109:3413:5918:2689.0470.001
OT08:4214:1019:34254.4020.001OT11:1015:1519:1682.1060.001
08:5314:2219:40194.6600.00111:1515:1819:3379.9330.001
GP09:5316:1120:21146.8810.001XC12:2316:3920:0045.5290.001
09:5616:1720:23150.1380.00112:2616:4120:0144.6940.001
O/DCluster 1Cluster 2Cluster 3FSig.O/DCluster 1Cluster 2Cluster 3FSig.
52%35%13%46%31%23%
JCN09:0010:2116:2428.6690.001KC08:5411:1212:2231.6860.001
09:0110:2416:2929.4510.00108:5511:3412:2221.4230.001
WCS12:0315:2119:3669.1930.001WCS10:4514:0415:3367.2470.001
12:0615:3119:4465.4920.00110:4814:0815:4470.6820.001
XC13:4317:2221:0946.3820.001XC12:0915:3117:5573.5460.001
13:4517:2421:1146.3410.00112:1015:3317:5672.5290.001
O/DCluster 1Cluster 2Cluster 3FSig.O/DCluster 1Cluster 2Cluster 3FSig.
36%55%9%90%3%7%
SB08:3508:4614:0211.1400.005MB06:4908:4009:25140.2300.001
08:3608:5414:0410.1860.00606:5108:4309:27146.2080.001
WCS11:3415:3118:4717.4000.001WCS11:0714:1614:22110.4970.001
11:3615:3618:4717.6310.00111:0814:2014:27110.5730.001
XC12:4716:5722:0229.6570.001XC12:0315:4217:03313.3020.001
12:4816:5822:0329.8750.00112:0415:4517:05315.5500.001
Disclaimer/Publisher’s Note: The statements, opinions and data contained in all publications are solely those of the individual author(s) and contributor(s) and not of MDPI and/or the editor(s). MDPI and/or the editor(s) disclaim responsibility for any injury to people or property resulting from any ideas, methods, instructions or products referred to in the content.

