
Methods of Rut Depth Measurements on Forwarder Trails in Lowland Forest
 , , ,
, , ,
Abstract
:1. Introduction
2. Materials and Methods
2.1. Research Area
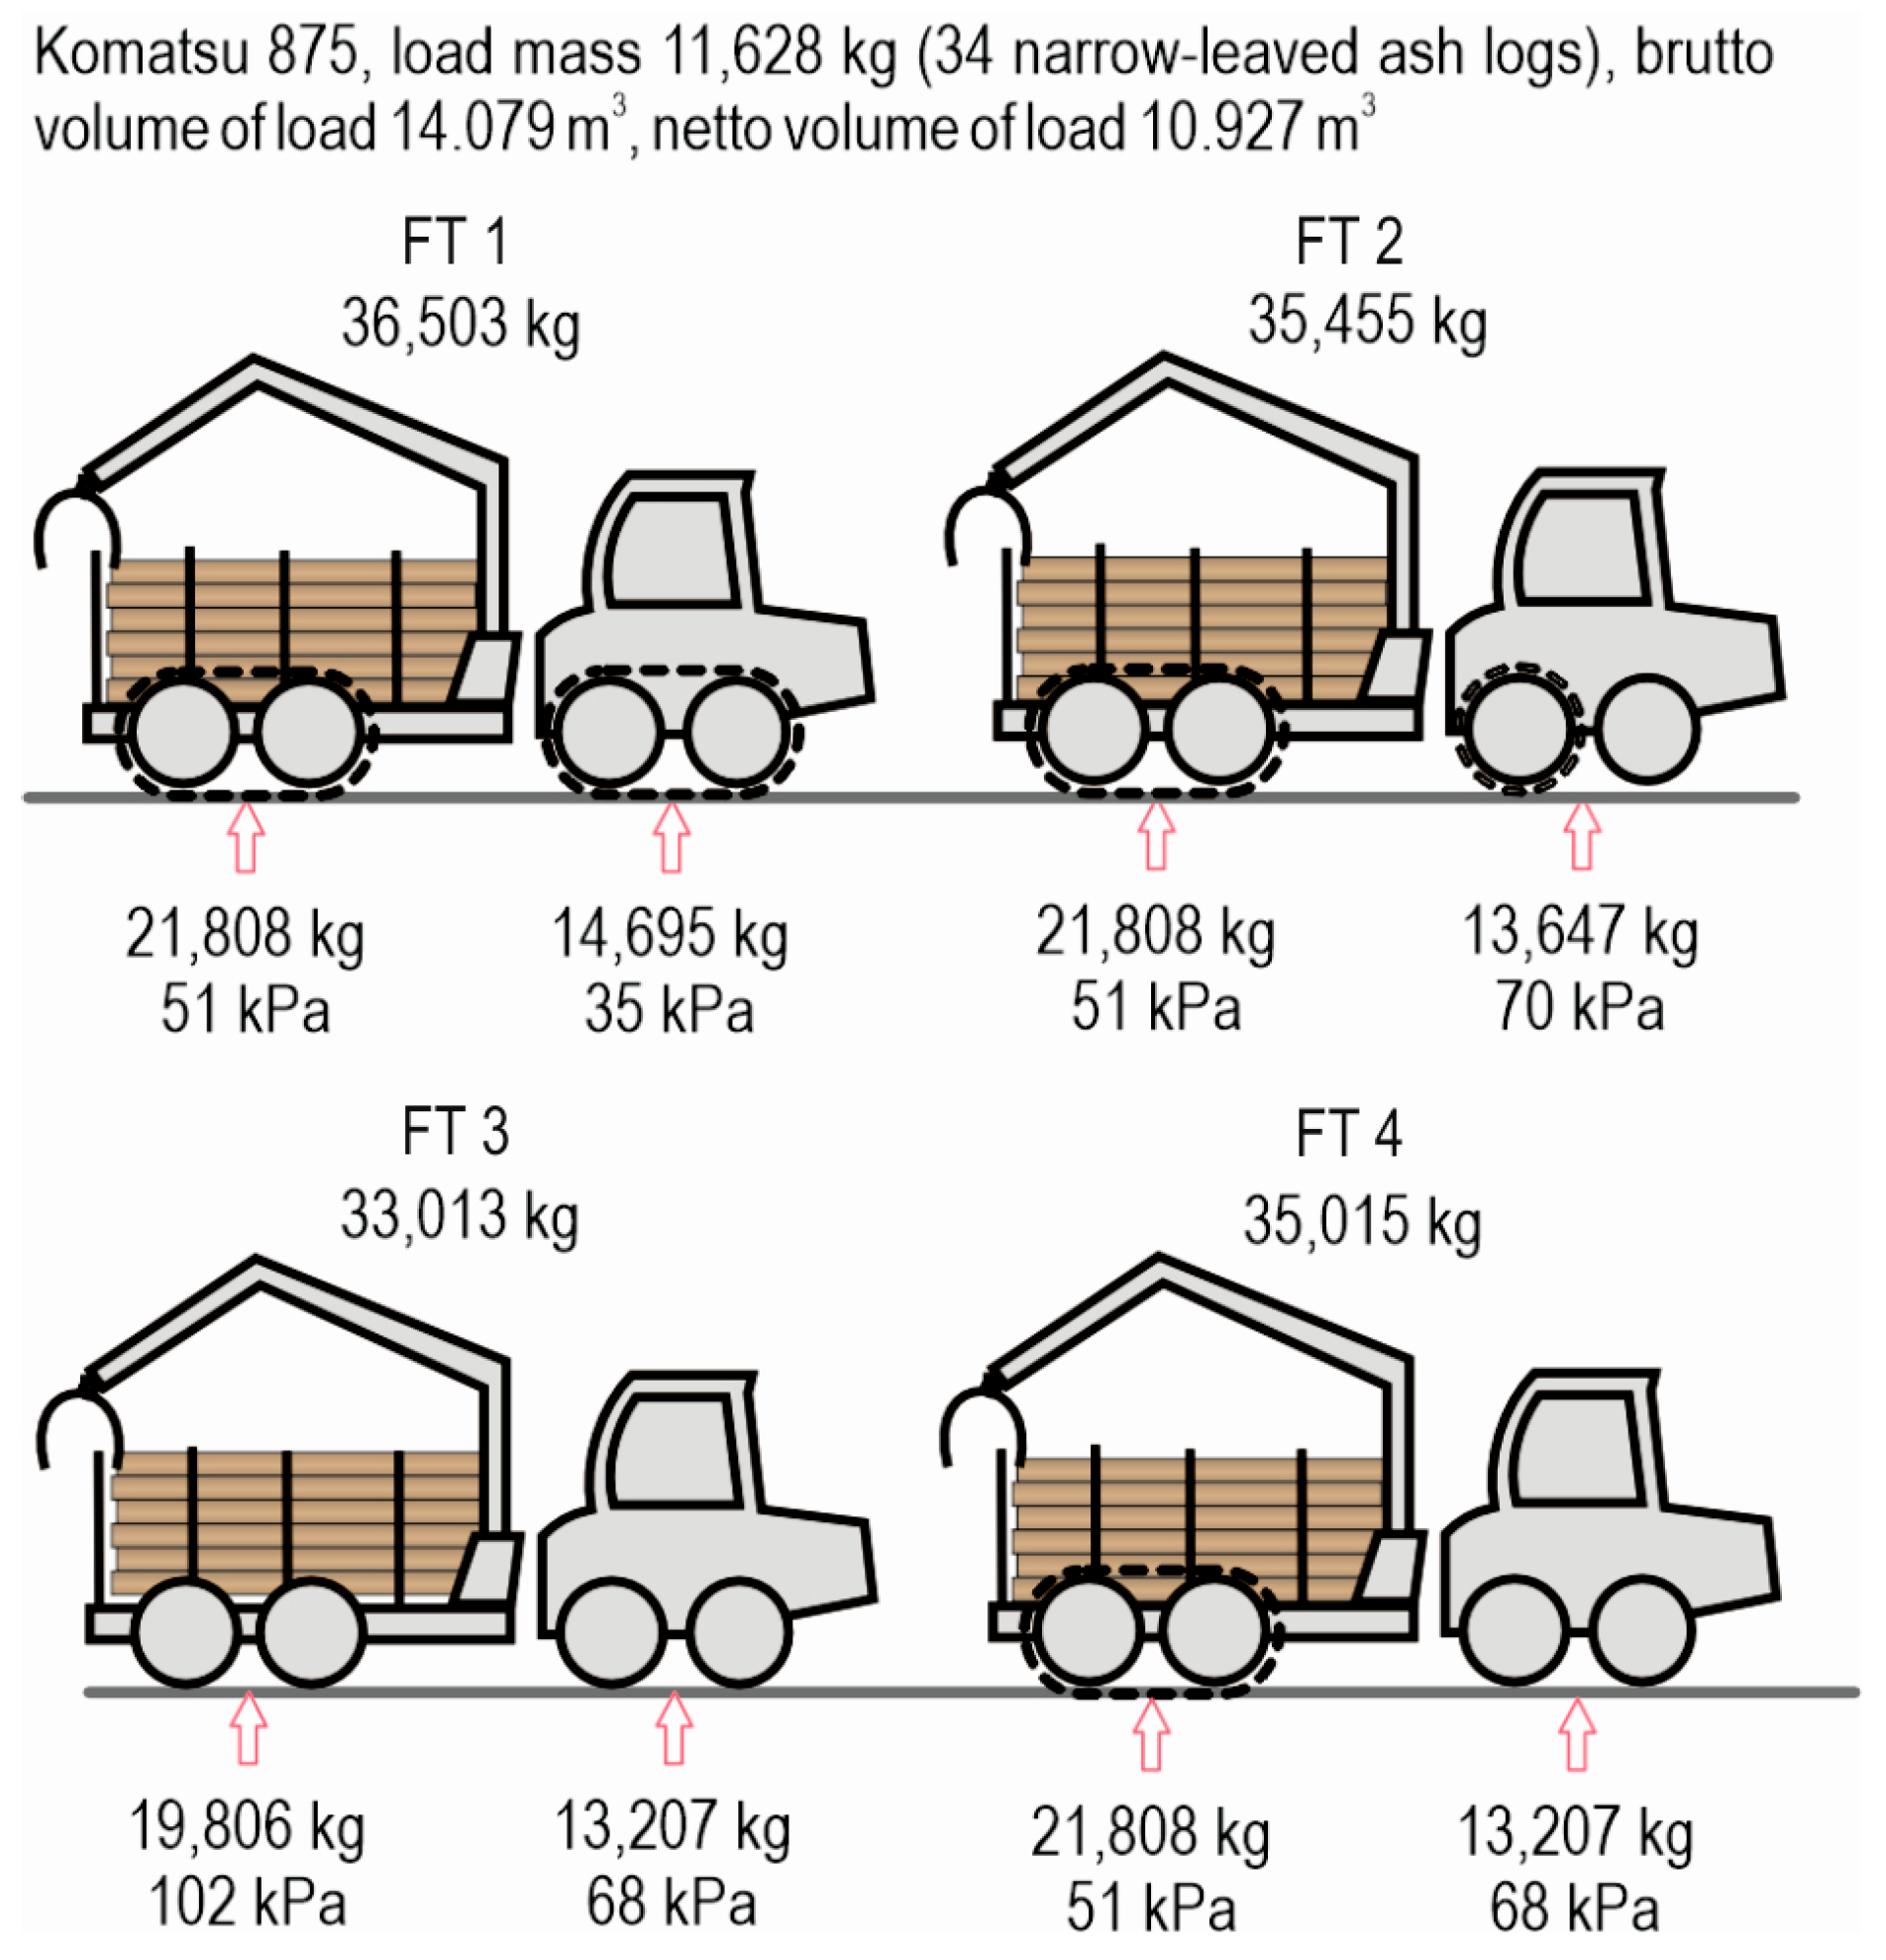
2.2. Rut Formation
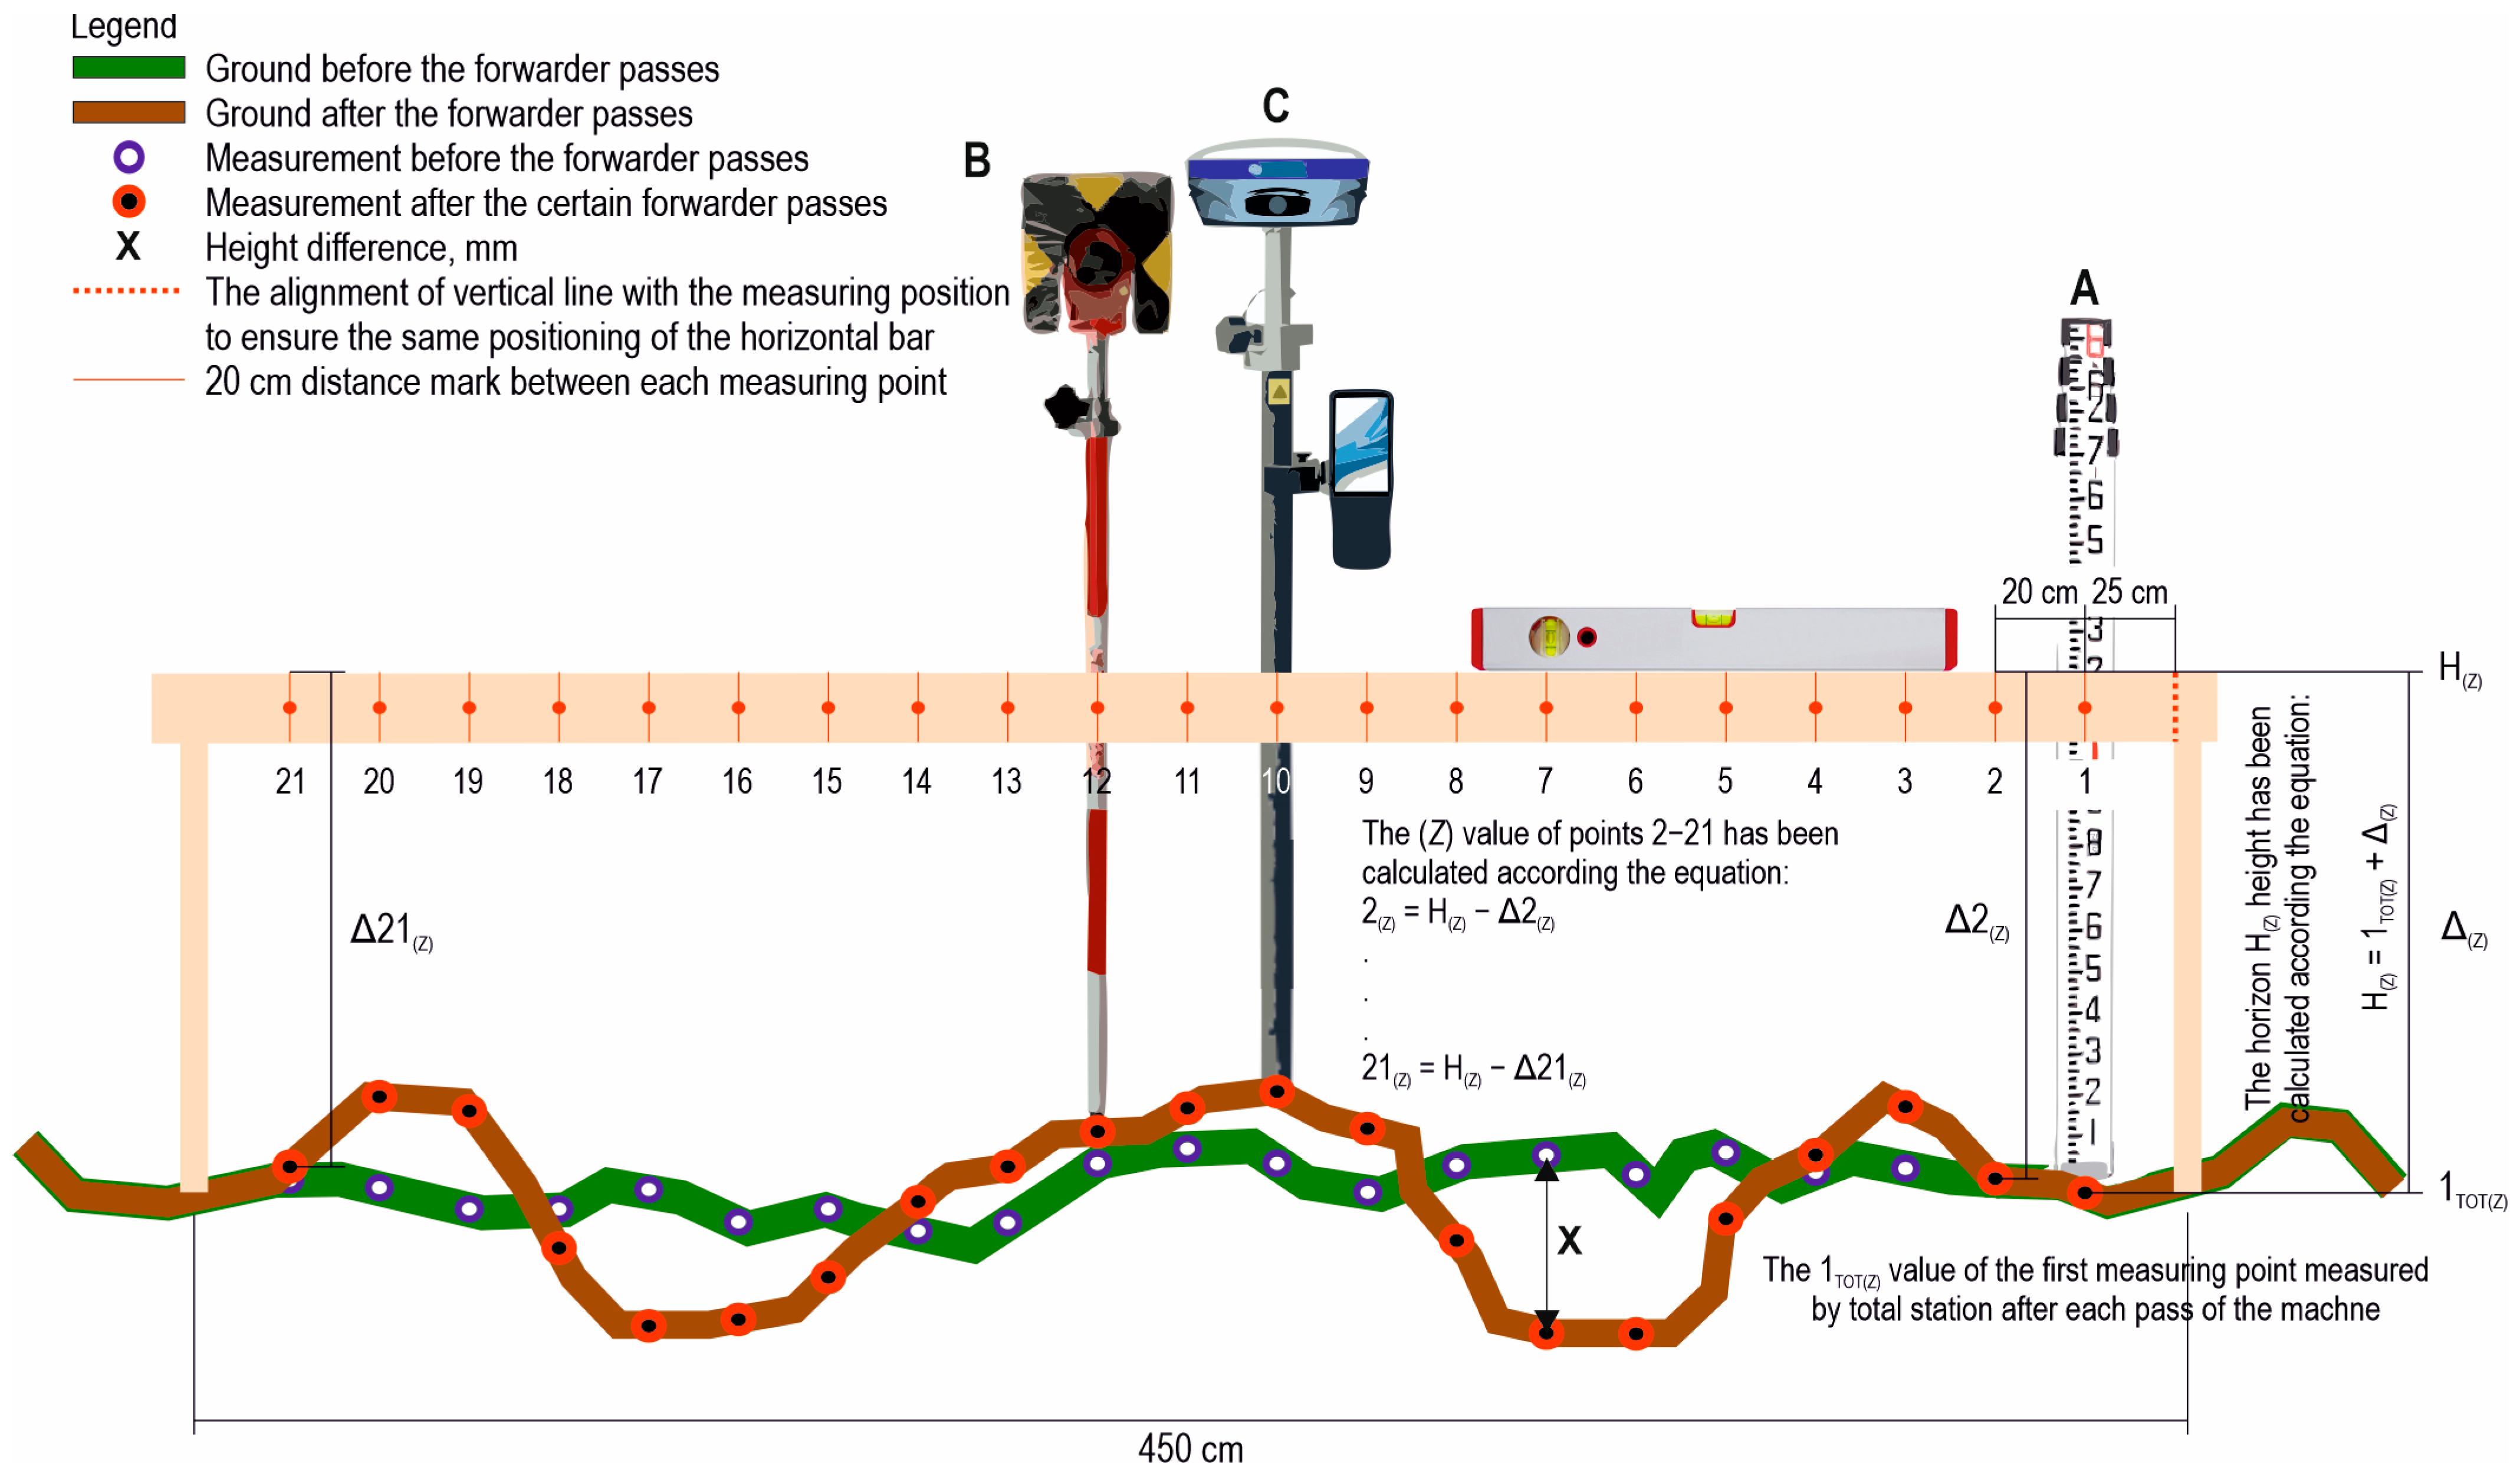
2.3. Rut Measurement
2.4. Data Analysis
3. Results
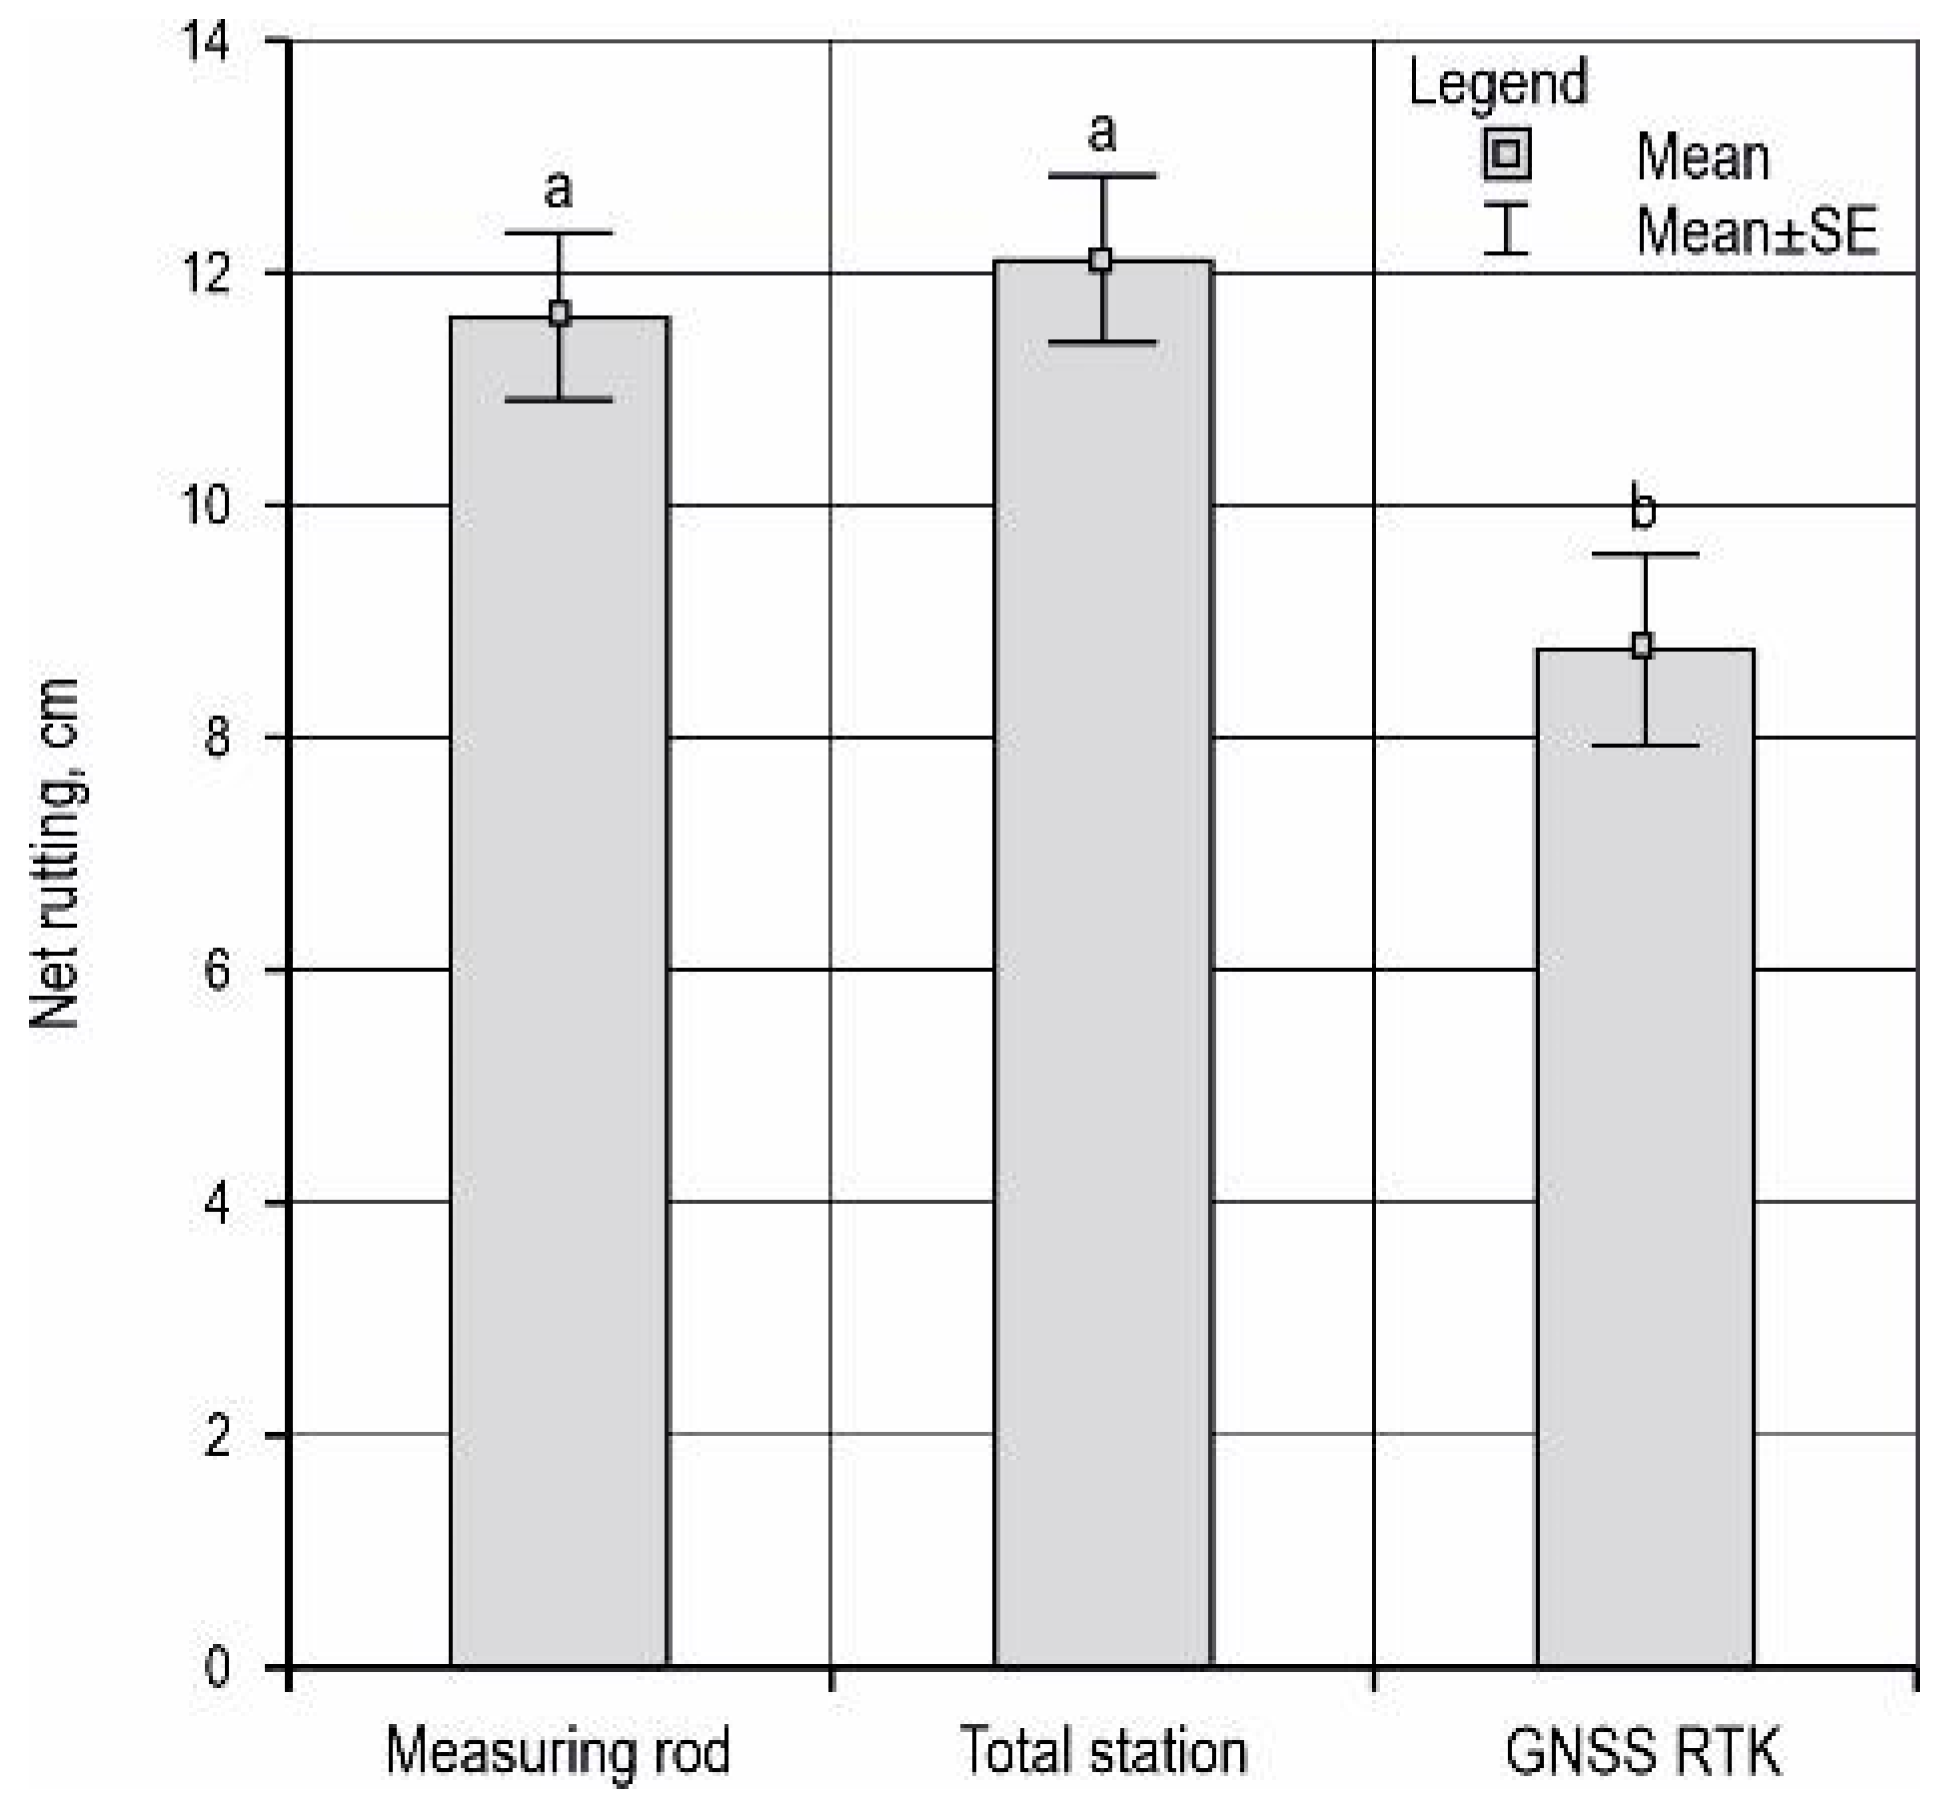
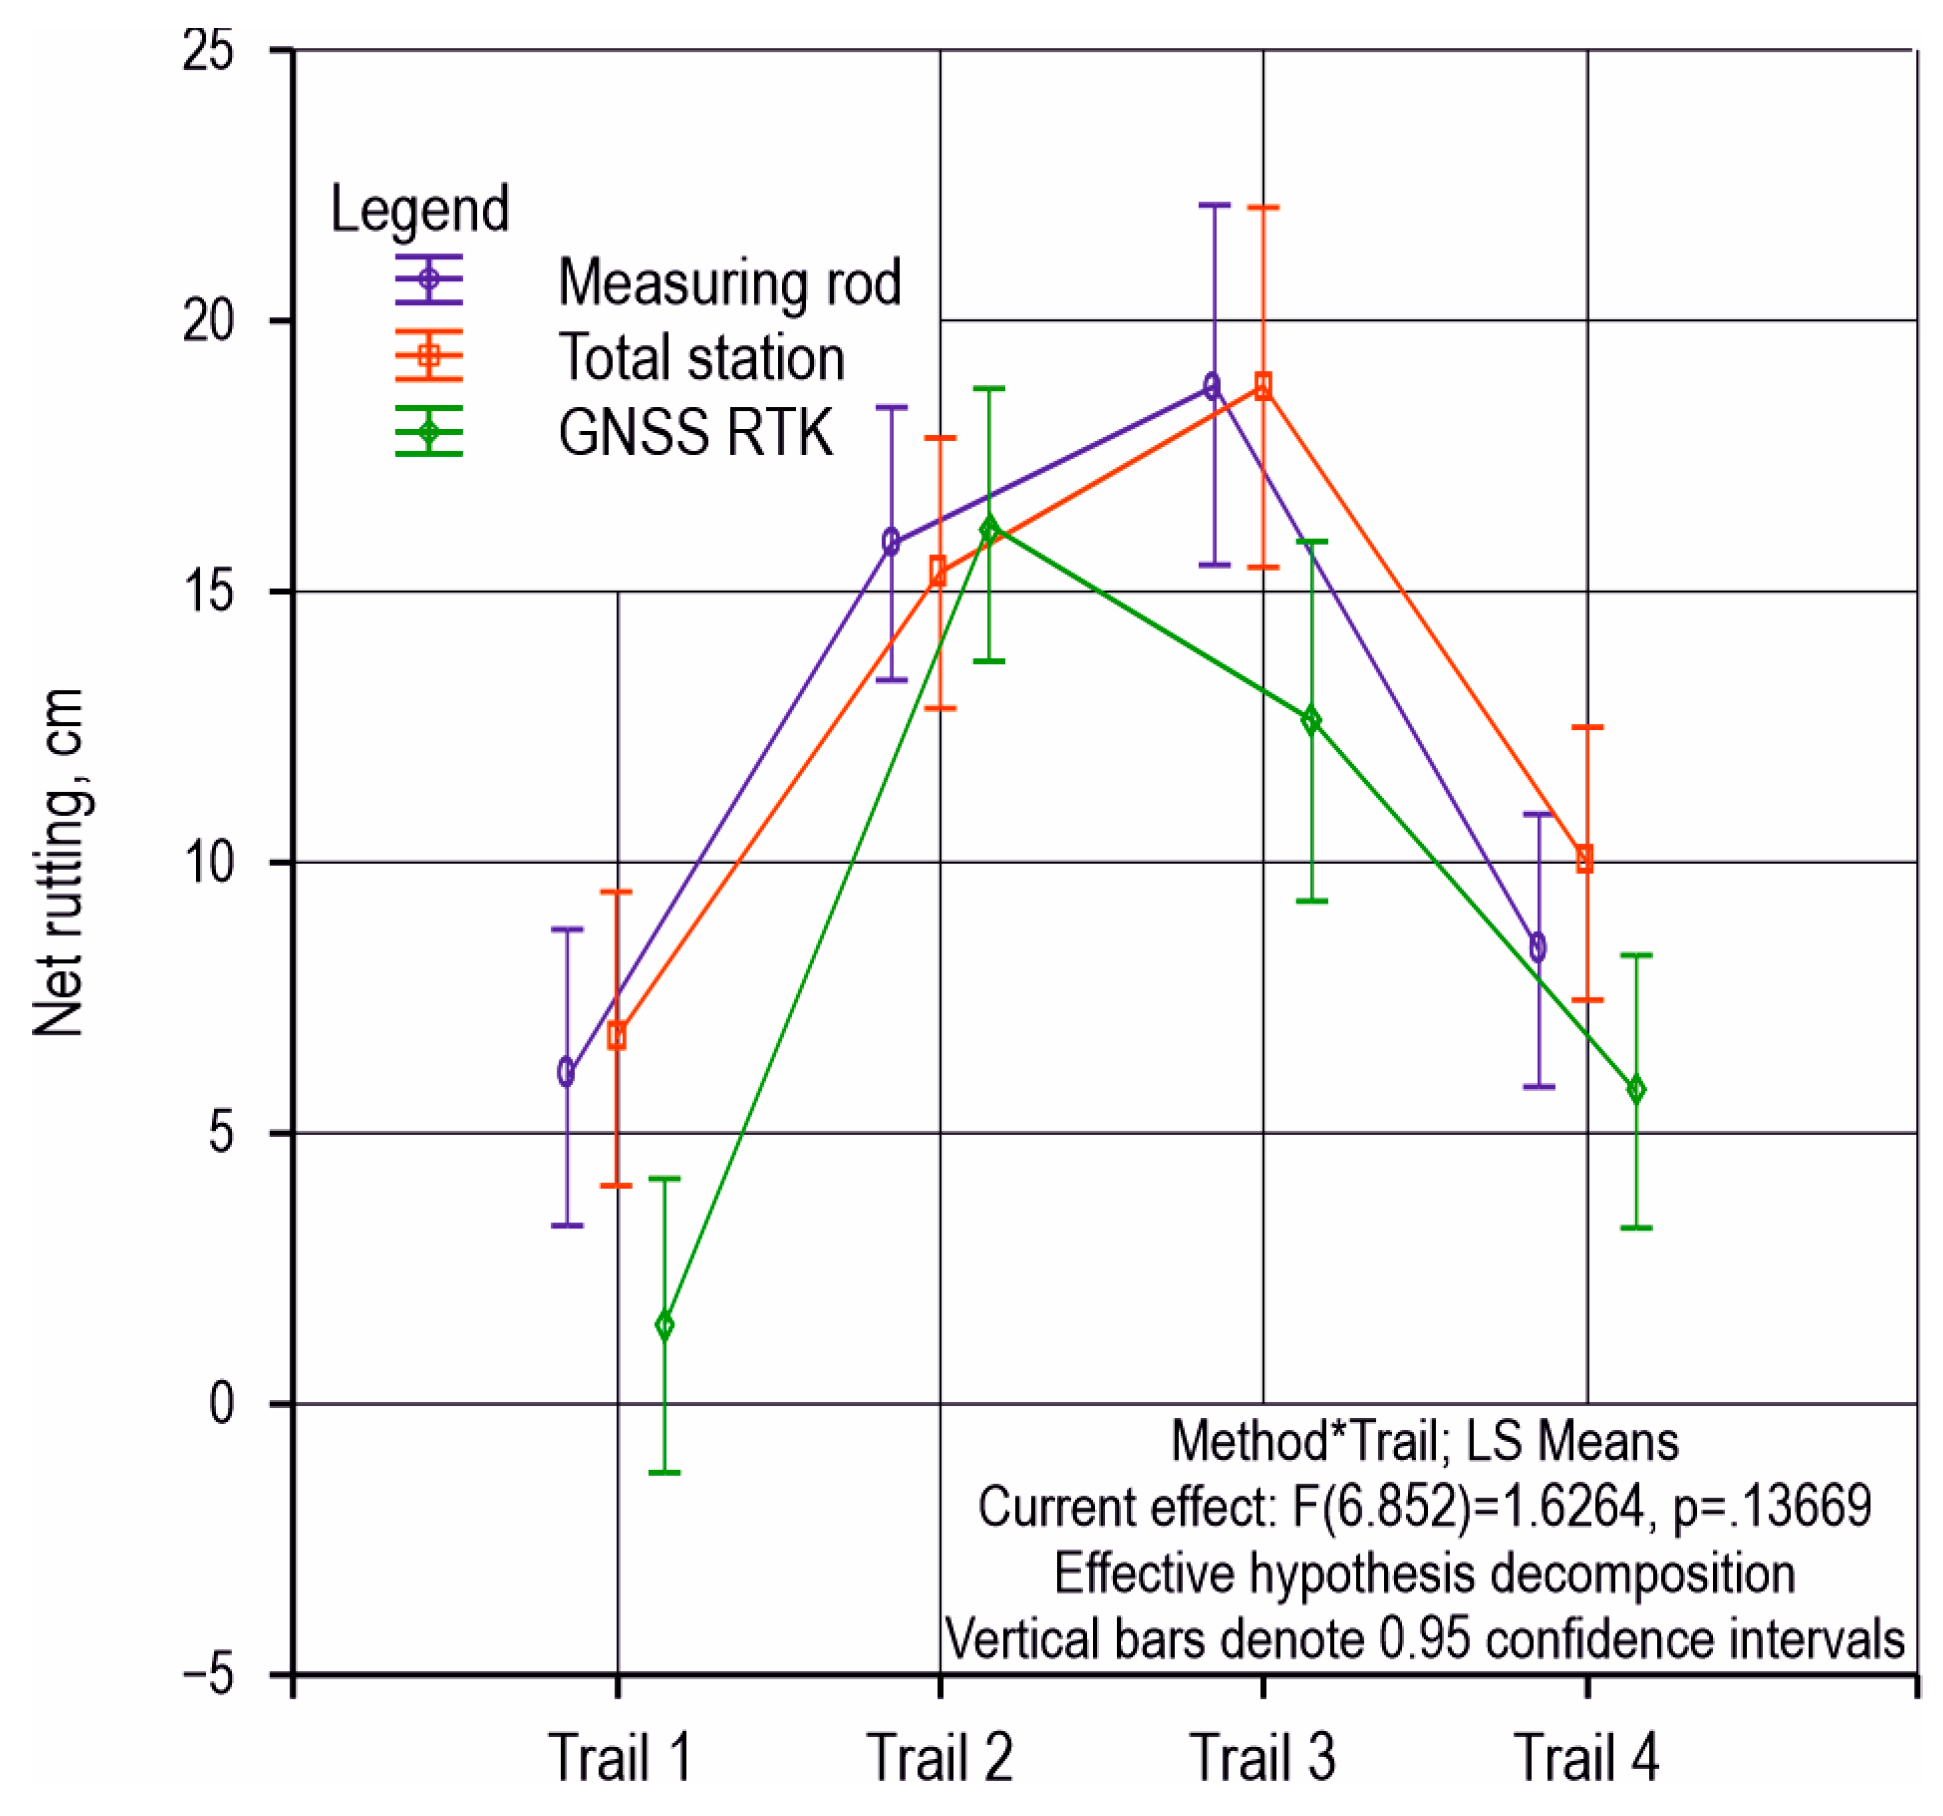
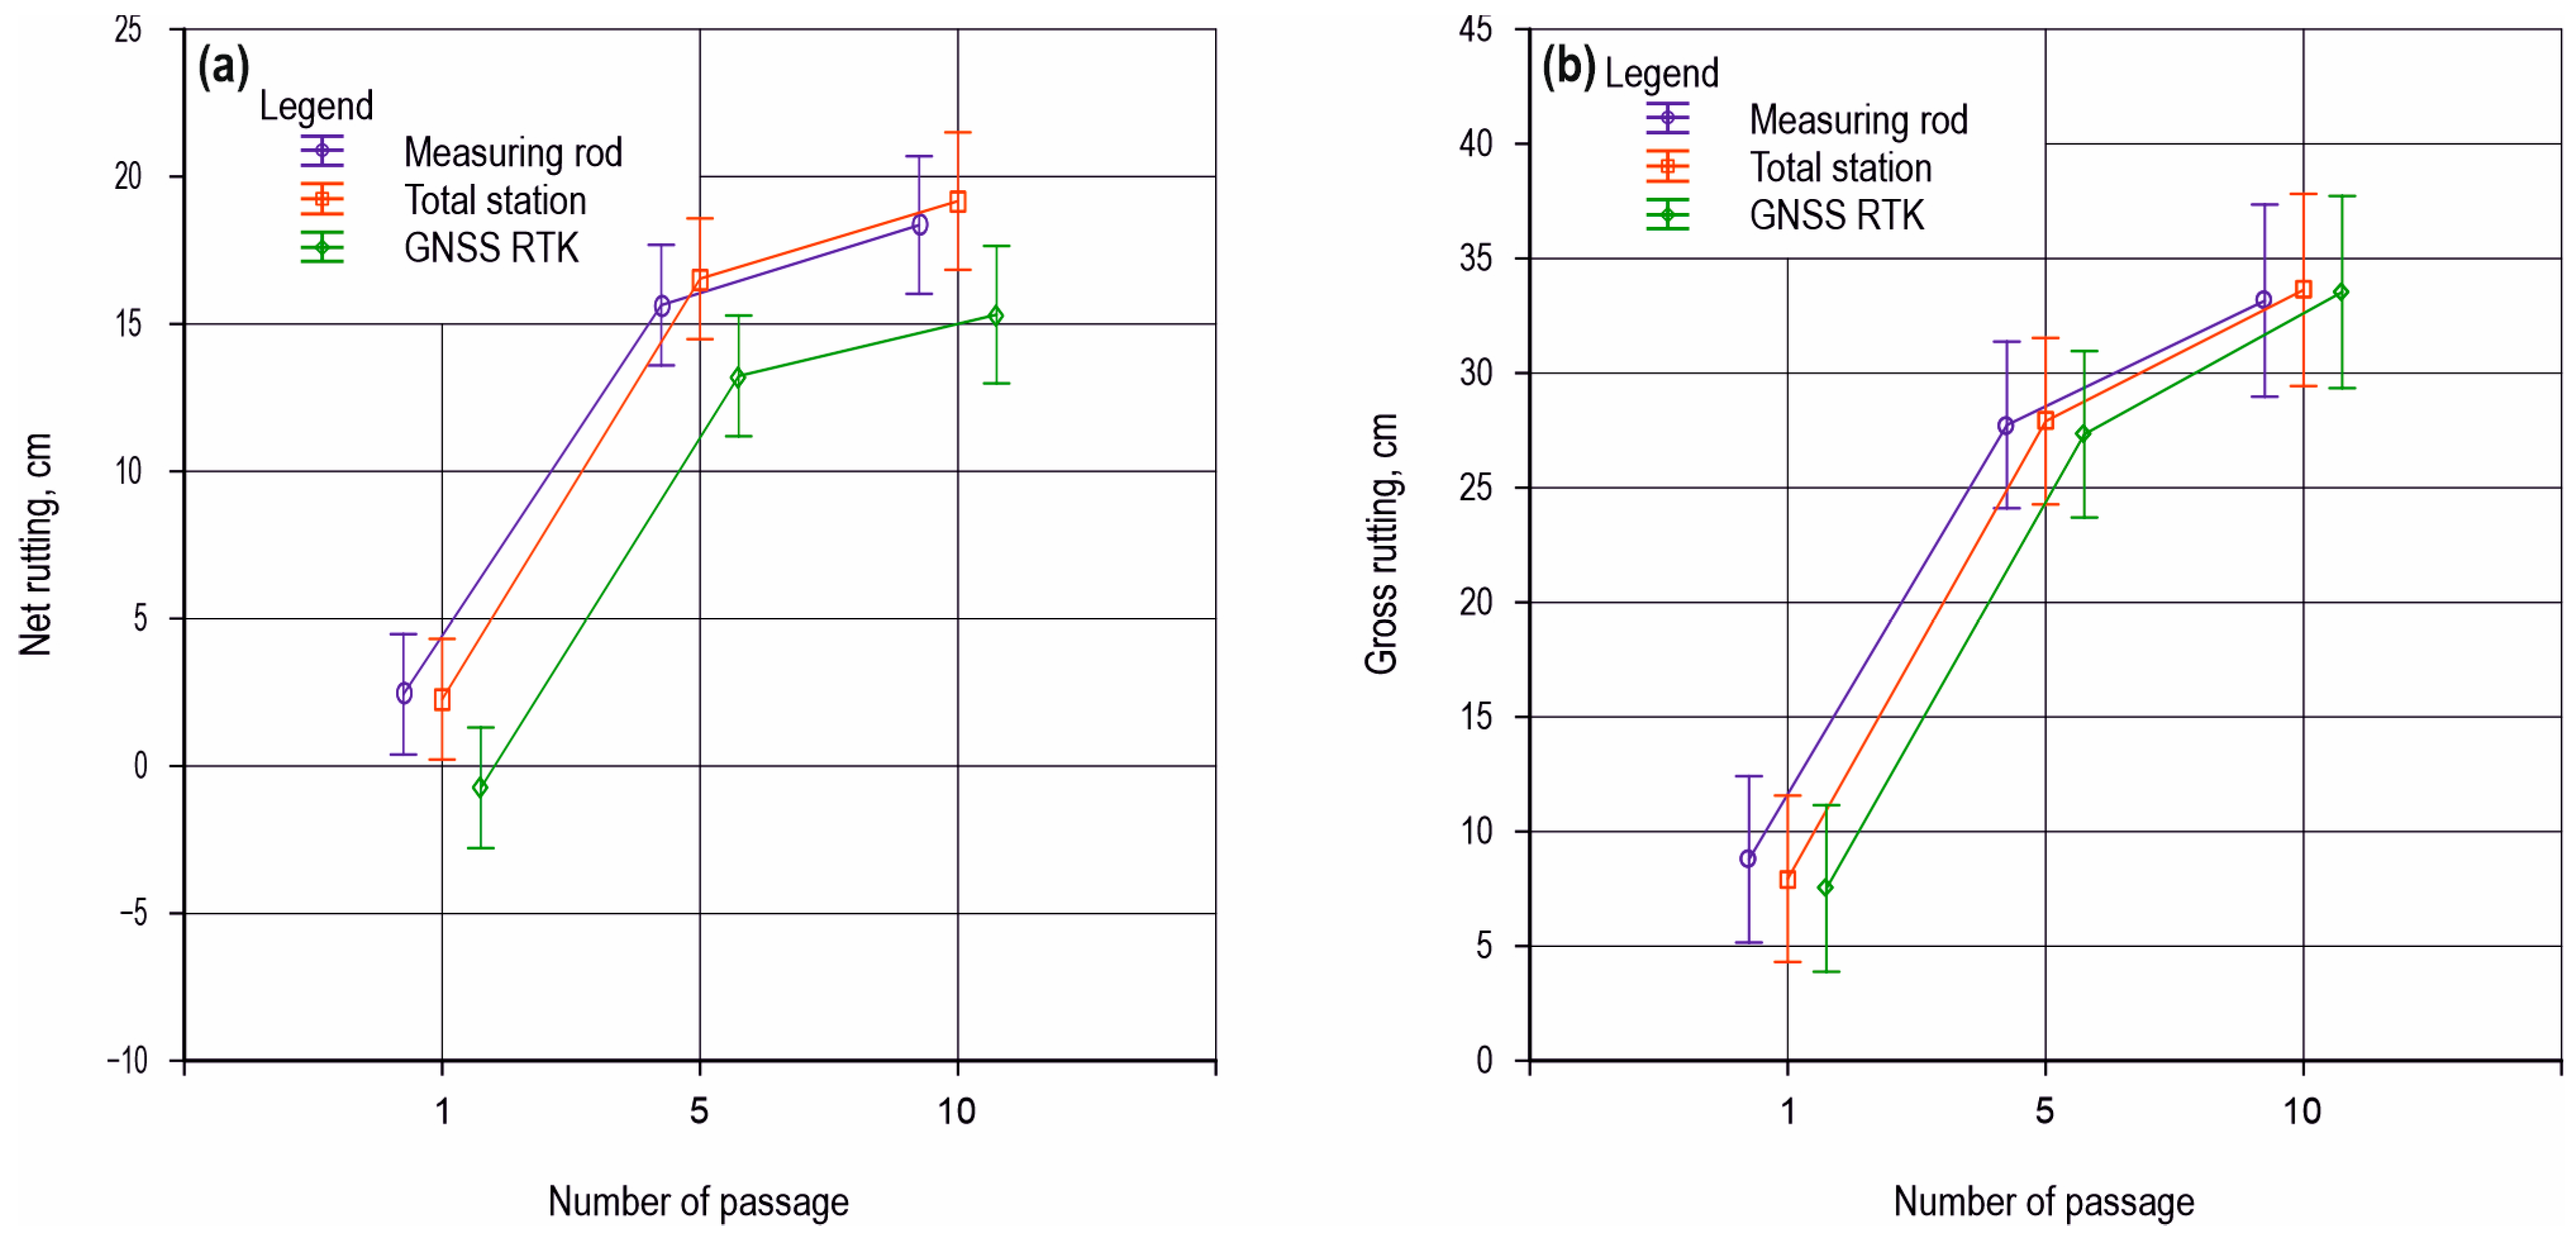
3.1. Net Rutting
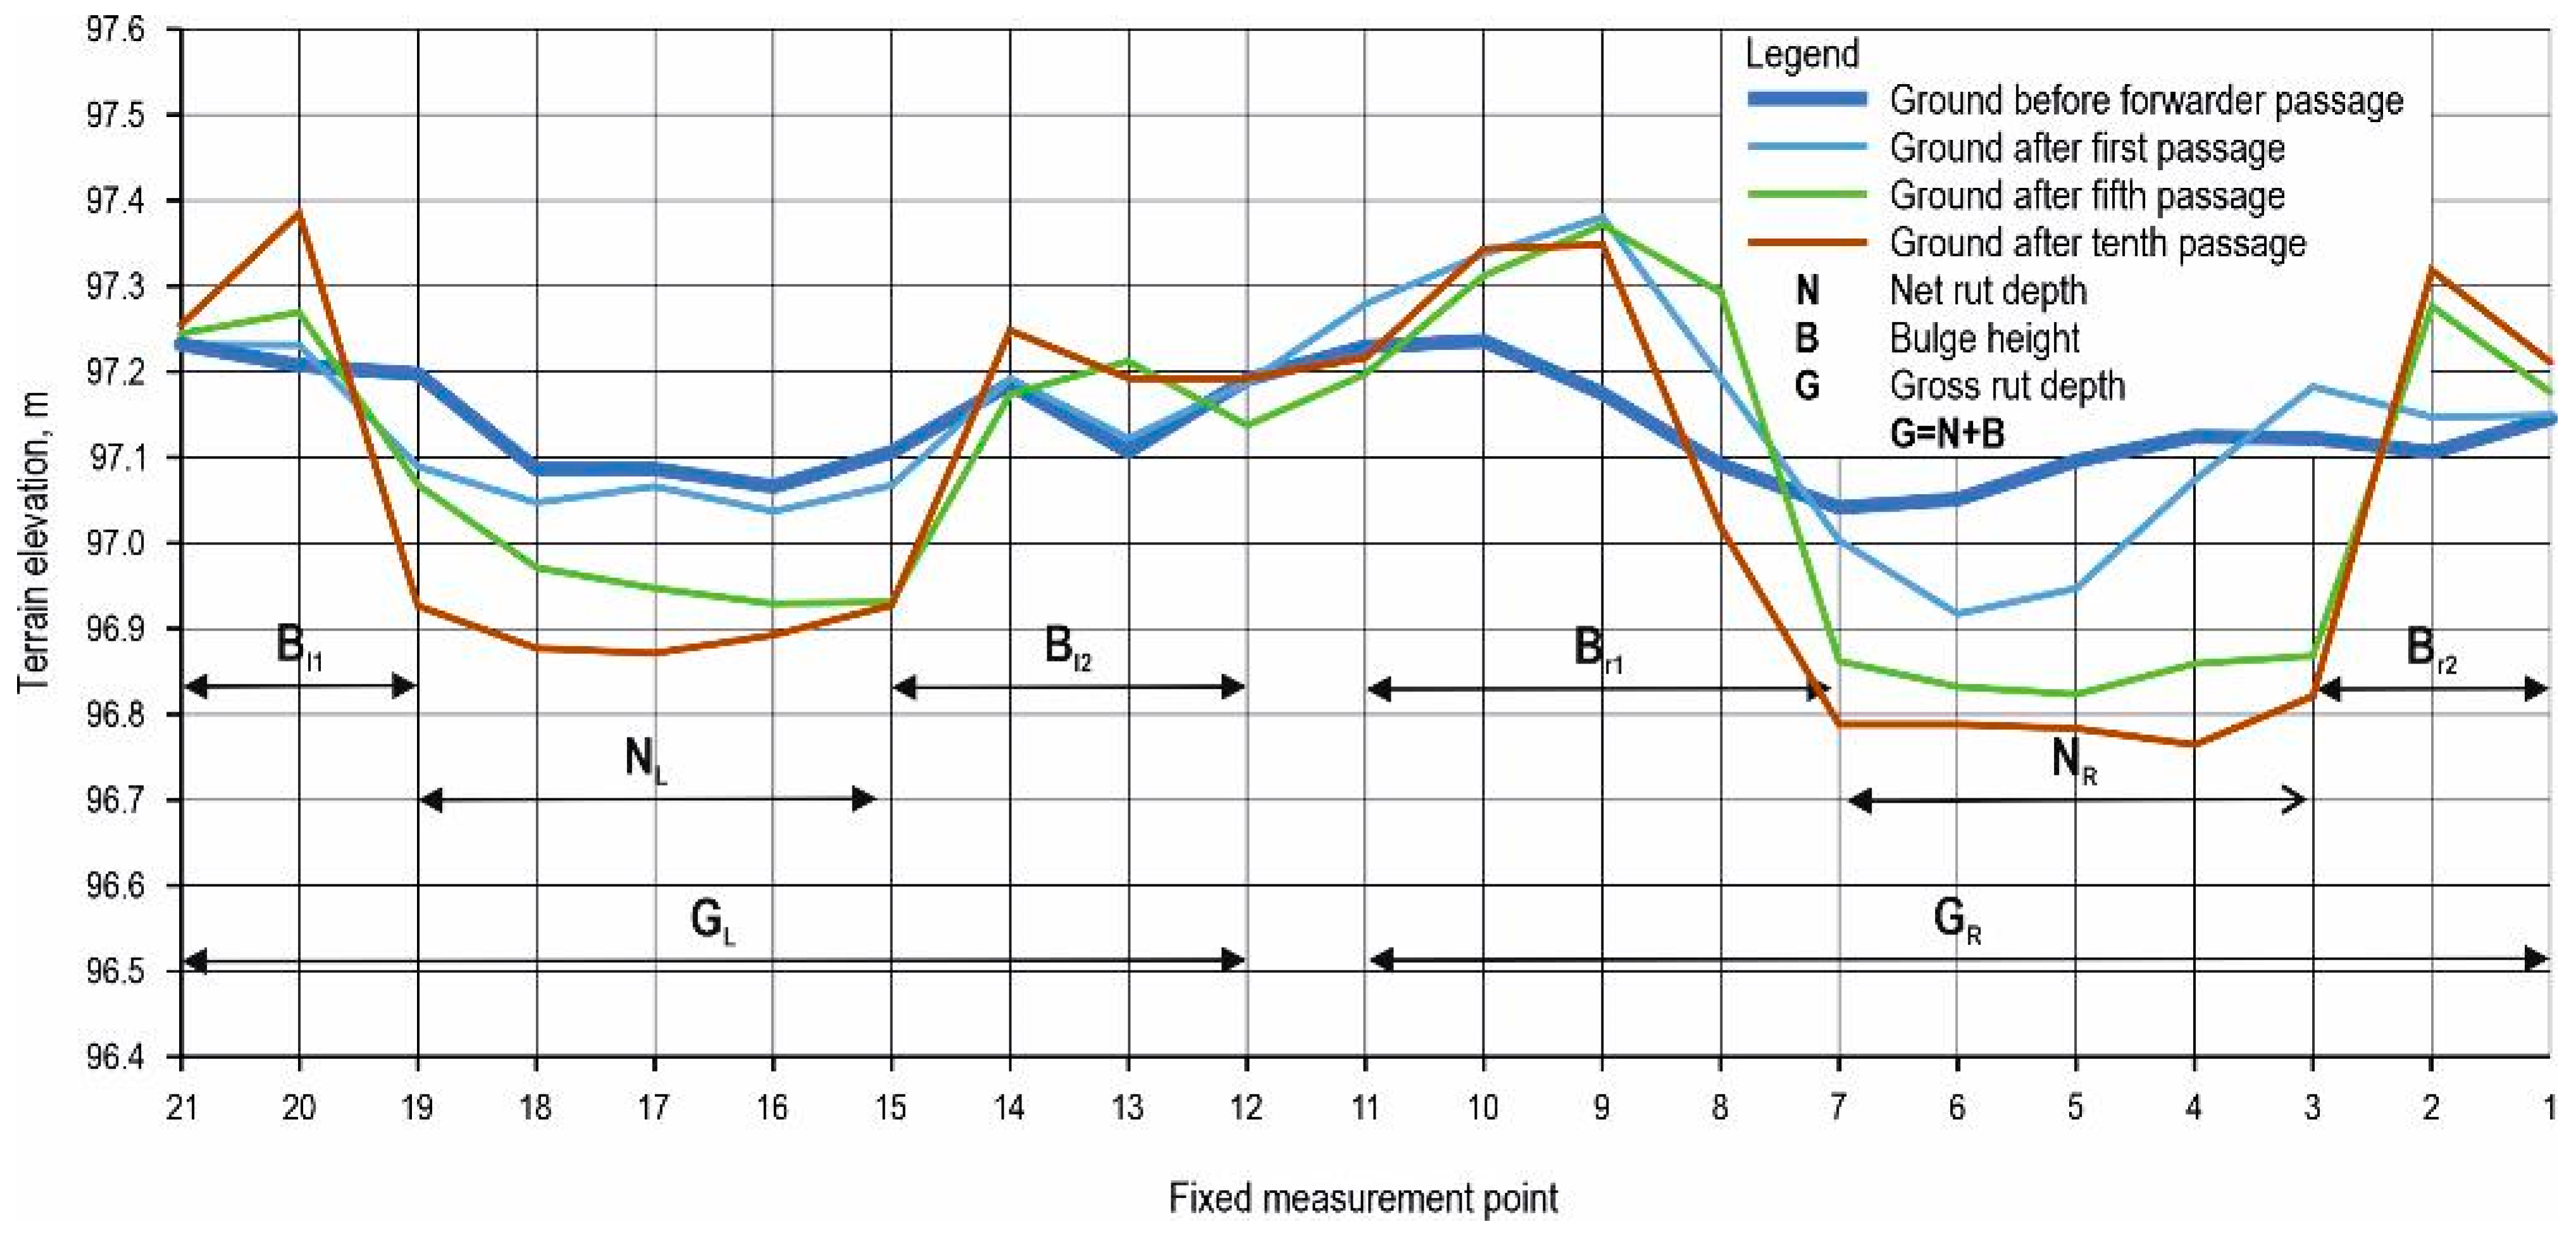
3.2. Gross Rutting
3.3. Bulge Height
3.4. Rut Depth Increase
4. Discussion
5. Conclusions
Author Contributions
Funding
Data Availability Statement
Acknowledgments
Conflicts of Interest
References
- Pentek, T.; Poršinsky, T. Forest Transportation Systems as a Key Factor in Quality Management of Forest Ecosystems. In Forest Ecosystems—More than Just Trees, 1st ed.; Blanco, J.A., Ed.; InTech: London, UK, 2012; pp. 433–464. [Google Scholar]
- Bumber, Z. Primjena GIS-a Pri Analizi Otvorenosti GJ Šiljakovačka Dubrava II Kroz Strukturu Prihoda Drva u Prostoru i Vremenu. Master’s Thesis, Šumarski Fakultet, Sveučilište u Zagrebu, Zagreb, Croatia, 2011. [Google Scholar]
- Greulich, F. Transportation Networks in Forest Harvesting: Early Development of the Theory. In Proceedings of the International Seminar on New Roles of Plantation Forestry Requiring Appropriate Tending and Harvesting Opreations, Tokyo, Japan, 29 September–5 October 2002. [Google Scholar]
- Pentek, T.; Nevečerel, H.; Ecimović, T.; Lepoglavec, K.; Papa, I.; Tomašić, Ž. Strategijsko planiranje šumskih prometnica u Republici Hrvatskoj–raščlamba postojećega stanja kao podloga za buduće aktivnosti. Nova Meh. Sumar. 2014, 35, 63–78. [Google Scholar]
- Picchio, R.; Mederski, P.S.; Tavankar, F. How and how much, do harvesting activities affect forest soil, regeneration and stands? Curr. For. Rep. 2020, 6, 115–128. [Google Scholar] [CrossRef]
- Cambi, M.; Certini, G.; Neri, F.; Marchi, E. The impact of heavy traffic on forest soils: A review. For. Ecol. Manag. 2015, 338, 124–138. [Google Scholar] [CrossRef]
- Nadezhdina, N.; Prax, A.; Čermák, J.; Nadezhdin, V.; Ulrich, R.; Neruda, J.; Schlaghamersky, A. Spruce roots under heavy machinery loading in two different soil types. For. Ecol. Manag. 2012, 282, 46–52. [Google Scholar] [CrossRef]
- Poršinsky, T. Djelotvornost i Ekološka Pogodnost Forvardera Timberjack 1710 pri Izvoženju Oblovine iz Nizinskih Šuma Hrvatske. Ph.D. Thesis, Šumarski Fakultet, Sveučilište u Zagrebu, Zagreb, Croatia, 2005; pp. 1–170. [Google Scholar]
- Latterini, F.; Venanzi, R.; Picchio, R.; Jagodziński, A.M. Short-term physicochemical and biological impacts on soil after forest logging in Mediterranean broadleaf forests: 15 years of field studies summarized by a data synthesis under the meta-analytic framework. Forestry 2023, 96, 547–560. [Google Scholar] [CrossRef]
- Mohieddinne, H.; Brasseur, B.; Spicher, F.; Gallet-Moron, E.; Buridant, J.; Kobaissi, A.; Horen, H. Physical recovery of forest soil after compaction by heavy machines, revealed by penetration resistance over multiple decades. For. Ecol. Manag. 2019, 449, 117472. [Google Scholar] [CrossRef]
- Sohrabi, H.; Jourgholami, M.; Jafari, M.; Shabanian, N.; Venanzi, R.; Tavankar, F.; Picchio, R. Soil recovery assessment after timber harvesting based on the Sustainable Forest Operation (SFO) perspective in Iranian temperate forests. Sustainability 2020, 12, 2874. [Google Scholar] [CrossRef]
- Labelle, E.R.; Hansson, L.; Högbom, L.; Jourgholami, M.; Laschi, A. Strategies to mitigate the effects of soil physical disturbances caused by forest machinery: A comprehensive review. Curr. For. Rep. 2022, 8, 20–37. [Google Scholar] [CrossRef]
- Edlund, J.; Bergsten, U.; Löfgren, B. Effects of two different forwarder steering and transmission drive systems on rut dimensions. J. Terramech. 2012, 49, 291–297. [Google Scholar] [CrossRef]
- Gerasimov, Y.; Katarov, V. Effect of bogie track and slash reinforcement on sinkage and soil compaction in soft terrains. Croat. J. For. Eng. 2010, 31, 35–45. [Google Scholar]
- Ring, E.; Andersson, M.; Hansson, L.; Jansson, G.; Högbom, L. Logging mats and logging residue as ground protection during forwarder traffic along till hillslopes. Croat. J. For. Eng. 2021, 42, 445–462. [Google Scholar] [CrossRef]
- Sirén, M.; Salmivaara, A.; Ala-Ilomäki, J.; Launiainen, S.; Lindeman, H.; Uusitalo, J.; Sutinen, R.; Hänninen, P. Predicting forwarder rut formation on fine-grained mineral soils. Scand. J. For. Res. 2019, 34, 145–154. [Google Scholar] [CrossRef]
- Ilintsev, A.; Bogdanov, A.; Nakvasina, E.; Amosova, I.; Koptev, S.; Tretyakov, S. The natural recovery of disturbed soil, plant cover and trees after clear-cutting in the boreal forests, Russia. IFOREST J. 2020, 13, 531. [Google Scholar] [CrossRef]
- Toivio, J.; Helmisaari, H.-S.; Palviainen, M.; Lindeman, H.; Ala-Ilomäki, J.; Sirén, M.; Uusitalo, J. Impacts of timber forwarding on physical properties of forest soils in southern Finland. For. Ecol. Manag. 2017, 405, 22–30. [Google Scholar] [CrossRef]
- Feng, Y.; Wang, J. GPS RTK performance characteristics and analysis. Positioning 2008, 7, 1–8. [Google Scholar] [CrossRef]
- Luo, X.; Schaufler, S.; Branzanti, M.; Chen, J. Assessing the benefits of Galileo to high-precision GNSS positioning–RTK, PPP and post-processing. Adv. Space Res. 2021, 68, 4916–4931. [Google Scholar] [CrossRef]
- Brach, M.; Zasada, M. The effect of mounting height on gnss receiver positioning accuracy in forest conditions. Croat. J. For. Eng. 2014, 35, 245. [Google Scholar]
- Andreas, H.; Abidin, H.Z.; Sarsito, D.A.; Pradipta, D. Study the capabilities of RTK Multi GNSS under forest canopy in regions of Indonesia. E3S Web Conf. 2019, 94, 01021. [Google Scholar] [CrossRef]
- Feng, T.; Chen, S.; Feng, Z.; Shen, C.; Tian, Y. Effects of canopy and multi-epoch observations on single-point positioning errors of a GNSS in coniferous and broadleaved forests. Remote Sens. 2021, 13, 2325. [Google Scholar] [CrossRef]
- Abdi, O.; Uusitalo, J.; Pietarinen, J.; Lajunen, A. Evaluation of Forest Features Determining GNSS Positioning Accuracy of a Novel Low-Cost, Mobile RTK System Using LiDAR and TreeNet. Remote Sens. 2022, 14, 2856. [Google Scholar] [CrossRef]
- Talbot, B.; Pierzchała, M.; Astrup, R. Applications of remote and proximal sensing for improved precision in forest operations. Croat. J. For. Eng. 2017, 38, 327–336. [Google Scholar]
- Heppelmann, J.B.; Talbot, B.; Antón Fernandéz, C.; Astrup, R. Depth-to-water maps as predictors of rut severity in fully mechanized harvesting operations. Int. J. Eng. 2022, 33, 108–118. [Google Scholar] [CrossRef]
- Palander, T.; Kärhä, K. Utilization of image, LiDAR and gamma-ray information to Improve environmental sustainability of cut-to-length wood harvesting operations in peatlands: A management systems perspective. ISPRS Int. J. Geo-Inf. 2021, 10, 273. [Google Scholar] [CrossRef]
- Marra, E.; Wictorsson, R.; Bohlin, J.; Marchi, E.; Nordfjell, T. Remote measuring of the depth of wheel ruts in forest terrain using a drone. IJFE 2021, 32, 224–234. [Google Scholar] [CrossRef]
- Talbot, B.; Nowell, T.; Berg, S.; Astrup, R.; Routa, J.; Väätäinen, K.; Ala-Ilomäki, J.; Lindeman, H.; Prinz, R. Continuous surface assessments of wheel rutting compared to discrete point measurements—do the benefits justify the efforts? In Proceedings of the Nordic Baltic Conference on Forest Operations for the Future, Elsinore, Denmark, 22–24 September 2020. [Google Scholar]
- Pierzchała, M.; Talbot, B.; Astrup, R. Measuring wheel ruts with close-range photogrammetry. Forestry 2016, 89, 383–391. [Google Scholar] [CrossRef]
- Salmivaara, A.; Miettinen, M.; Finér, L.; Launiainen, S.; Korpunen, H.; Tuominen, S.; Uusitalo, J. Wheel rut measurements by forest machine-mounted LiDAR sensors–accuracy and potential for operational applications? IJFE 2018, 29, 41–52. [Google Scholar] [CrossRef]
- Marra, E.; Cambi, M.; Fernandez-Lacruz, R.; Giannetti, F.; Marchi, E.; Nordfjell, T. Photogrammetric estimation of wheel rut dimensions and soil compaction after increasing numbers of forwarder passes. Scand. J. For. Res. 2018, 33, 613–620. [Google Scholar] [CrossRef]
- Ferenčík, M.; Dudáková, Z.; Kardoš, M.; Sivák, M.; Merganičová, K.; Merganič, J. Measuring Soil Surface Changes after Traffic of Various Wheeled Skidders with Close-Range Photogrammetry. Forests 2022, 13, 976. [Google Scholar] [CrossRef]
- Gülci, S.; Şireli, S. The evaluation of SfM technique in the determination of surface deformation on skidding roads following timber harvesting. Eur. J. For. Eng. 2019, 5, 52–60. [Google Scholar] [CrossRef]
- Pernar, N.; Bakšić, D.; Perković, I.; Vrbek, B. Soil properties of narrow-leaved ash sites in Croatia. In Narrow-Leaved Ash in Croatia, 1st ed.; Anić, I., Ed.; Academy of Forestry Sciences: Zagreb, Croatia, 2022; pp. 179–222. [Google Scholar]
- Haas, J.; Ellhöft, K.H.; Schack-Kirchner, H.; Lang, F. Using photogrammetry to assess rutting caused by a forwarder—A comparison of different tires and bogie tracks. Soil. Tillage Res. 2016, 163, 14–20. [Google Scholar] [CrossRef]
- Meek, P. An evaluation of four methods for procesessing timber at the stump. For. Eng. Res. Inst. Can. (FERIC) Pointe-Claire Que. Tech. 1993, 1–8. [Google Scholar]
- Pandur, Z.; Đuka, A.; Šušnjar, M.; Bačić, M.; Ostović, K.; Lepoglavec, K. Analiza gaženja tla prilikom strojne sječe, izrade i izvoženja drva u prorednoj sastojini listača. Nova Meh. Sumar. 2018, 39, 1–12. [Google Scholar]
- Poršinsky, T.; Pandur, Z.; Bumber, Z.; Lovrinčević, M.; Ursić, B.; Đuka, A. Dimenzijske i masene značajke forvardera. Šumar. List 2022, 146, 387–401. [Google Scholar]
- ISO 13860; Machinery for Forestry—Forwarders—Terms, Definitions and Commercial Specifications. International Standard Organization: Geneva, Switzerland, 2016.
- Mihelič, J.; Robek, R.; Kobal, M. Determining bulk factors for three subsoils used in forest engineering in Slovenia. Croat. J. For. Eng. 2022, 43, 303–311. [Google Scholar]
- CROPOS—Državna Mreža Referentnih Stanica Republike Hrvatske. Available online: https://www.cropos.hr/ (accessed on 8 December 2023).
- Košir, B. Vpliv strojne sečnje na sestoj in gozdna tla. In Proceedings of the Strojna Sečnja v Sloveniji, Ljubljana, Slovenia, October 2002; pp. 66–82. [Google Scholar]
- Solgi, A.; Zenner, E.K.; Naghdi, R.; Masumian, A.; Shoja, R.; Behjou, F.K. Evaluating the Effectiveness of Mulching for Reducing Soil Erosion in Skid Trail Switchbacks. Croat. J. For. Eng. 2022, 43, 339–353. [Google Scholar] [CrossRef]
- Kremer, J.; Wolf, B.; Matthies, D.; Borchert, H. Bodenschutz beim Forstmaschineneinsatz, 3rd ed.; Bosch, T., Ed.; LWF: Freising, Germany, 2012. [Google Scholar]
- Eliasson, L.; Wästerlund, I. Effects of slash reinforcement of strip roads on rutting and soil compaction on a moist fine-grained soil. For. Ecol. Manag. 2007, 252, 118–123. [Google Scholar] [CrossRef]
- Han, H.S.; Page-Dumroese, D.; Han, S.K.; Tirocke, J. Effects of slash, machine passes, and soil moisture on penetration resistance in a cut-to-length harvesting. IJFE 2006, 17, 11–24. [Google Scholar] [CrossRef]
- Prinz, R.; Mola-Yudego, B.; Ala-Ilomäki, J.; Väätäinen, K.; Lindeman, H.; Talbot, B.; Routa, J. Soil, driving speed and driving intensity affect fuel consumption of forwarders Croat. J. For. Eng. 2023, 44, 31–43. [Google Scholar]


| Total Station Stonex R35 | RTK GNSS Receiver Stonex S900A | ||
|---|---|---|---|
| ANGLE MEASUREMENT (angle units) | DEG 360°/GON 400/MIL 6.400 | RECEIVER (satellite tracked) | GPS: L1 C/A, L1C, L1P, L2C, L2P, L5 |
| GLONASS: L1 C/A, L1P, L2C, L2P | |||
| BEIDOU: B1, B2, B3 | |||
| GALILEO: E1, E5a, E5b | |||
| QZSS: L1 C/A, L1C, L2C, L5 | |||
| SBAS: L1, L5 | |||
| DISTANCE MEASUREMENT RANGE | Standard mode prism 3.000 m | INTERNAL RADIO (range) | 3–4 Km in urban environment Up to 10 Km with optimal conditions |
| Long mode prism 5.000 m | |||
| DISTANCE MEASUREMENT ACCURACY | Standard mode prism 2 mm + 2 ppm | POSITIONING (real time kinematic) | Fixed RTK Horizontal (8 mm + 1 ppm RMS) |
| Long mode prism 2 mm + 2.5 ppm | Fixed RTK Vertical (15 mm + 1 ppm RMS) | ||
| LASER PLUMMET (laser type) | 635 nm semiconductor laser | COMMUNICATION (Bluetooth) | 2.1 + EDR, V4.0 |
| POWER SUPPLY (battery) | 7.4 V/3.400 mAh Li-ion | POWER SUPPLY (battery) | 2 rechargeable and replaceable 7.2 V—3400 mAh Intelligent lithium batteries |
| POWER SUPPLY (working time (angle + distance meas.)) | Up to 5 h | POWER SUPPLY (working time) | Up to 12 h (2 batteries hot swap) |
| PHYSICAL SPECIFICATION (dimensions) | 206 × 203 × 360 mm | PHYSICAL SPECIFICATION (dimensions) | Φ 157 mm × 76 mm |
| PHYSICAL SPECIFICATION (weight including battery and tribrach) | 6.1 kg | PHYSICAL SPECIFICATION (weight) | 1.19 kg (with one battery) 1.30 kg (with two batteries) |
| Rutting Values | Measuring Rod | Total Station | GNSS RTK |
|---|---|---|---|
| Max. net rutting | 38.76 cm | 42.82 cm | 37.19 cm |
| St. Dev. net rutting | 12.24 cm | 12.21 cm | 13.97 cm |
| Mean net rutting | 11.63 cm | 12.12 cm | 8.77 cm |
| Max. gross rutting | 57.79 cm | 59.13 cm | 55.23 cm |
| St. Dev. gross rutting | 13.80 cm | 14.07 cm | 14.39 cm |
| Mean gross rutting | 22.33 cm | 22.21 cm | 21.82 cm |
Disclaimer/Publisher’s Note: The statements, opinions and data contained in all publications are solely those of the individual author(s) and contributor(s) and not of MDPI and/or the editor(s). MDPI and/or the editor(s) disclaim responsibility for any injury to people or property resulting from any ideas, methods, instructions or products referred to in the content. |
© 2024 by the authors. Licensee MDPI, Basel, Switzerland. This article is an open access article distributed under the terms and conditions of the Creative Commons Attribution (CC BY) license (https://creativecommons.org/licenses/by/4.0/).
Share and Cite
Lovrinčević, M.; Papa, I.; Popović, M.; Janeš, D.; Poršinsky, T.; Pentek, T.; Đuka, A. Methods of Rut Depth Measurements on Forwarder Trails in Lowland Forest. Forests 2024, 15, 1021. https://doi.org/10.3390/f15061021
Lovrinčević M, Papa I, Popović M, Janeš D, Poršinsky T, Pentek T, Đuka A. Methods of Rut Depth Measurements on Forwarder Trails in Lowland Forest. Forests. 2024; 15(6):1021. https://doi.org/10.3390/f15061021
Chicago/Turabian StyleLovrinčević, Mihael, Ivica Papa, Maja Popović, David Janeš, Tomislav Poršinsky, Tibor Pentek, and Andreja Đuka. 2024. "Methods of Rut Depth Measurements on Forwarder Trails in Lowland Forest" Forests 15, no. 6: 1021. https://doi.org/10.3390/f15061021