Abstract
Dahurian larch (Larix gmelinii) is the dominant tree species in boreal forests, and its photosynthetic response to climate warming is important in modeling and predicting carbon cycling for boreal forest ecosystems. In 1983, seedlings of L. gmelinii from 11 provenances were transplanted into two common gardens with different climate conditions (control and warming climate). Forty years after the transplant, we investigated the response of leaf photosynthetic capacity to climate warming and its variation among provenances. The warming treatment significantly increased the maximum net photosynthetic rate (Pmax-a), photosynthetic nitrogen use efficiency (PNUE), maximum carboxylation rate (Vcmax), maximum electron transport rate (Jmax), triose phosphate utilization rate (TPU), mesophyll conductance (gm), leaf nitrogen content (Narea), and chlorophyll content (Chlm). Pmax-a was significantly positively associated with Vcmax, Jmax, TPU, gm, and Narea, and the slope of the linear regression between Pmax-a and Vcmax, Jmax, and TPU was greater in the warming treatment. The responses of Pmax-a, PNUE, Vcmax, Jmax, TPU, Narea, and Chlm to warming differed among provenances. As the aridity index of the original site increased, the magnitude of the warming treatment’s effect on Pmax-a, Vcmax, Jmax, and TPU represented a varying form of a bell-shaped curve. Overall, the warming treatment improved the photosynthetic capacity of L. gmelinii, but the extent of the improvement varied among provenances. These findings provide insights into the mechanisms underlying the responses of L. gmelinii to climate warming.
1. Introduction
Climate warming will change the structure and function of forest ecosystems, especially the growth of boreal forests [1]. Because of experimental limitations, it is still challenging to research the effects of climate warming on tree growth in boreal forests and to explore the mechanisms of such effects [2,3]. Photosynthesis is the physiological basis of tree growth. The response of photosynthesis to climate warming not only affects tree growth but also reflects the ability of trees to adapt to climate warming [4,5]. Many studies have examined the effect of climate warming on the photosynthetic capacity of trees, but these have obtained diverse results, ranging from a promoting effect [3] to an inhibiting effect [6] or no effect [7]. To understand the mechanisms underpinning the response of photosynthetic capacity to climate warming, previous studies have explored the factors that affect photosynthesis, such as leaf nitrogen content, chlorophyll content, and stomatal limitation [8,9,10,11]. Some other studies have shown that photosynthesis can acclimatize to a warming climate, and the photosynthetic capacity can change during the warming process [12,13]. If photosynthetic capacity can acclimatize to warming conditions, then climate warming can have a positive effect on photosynthetic capacity; otherwise, the effect is negative [3,14]. To date, most studies on this topic have focused on the response of photosynthetic capacity to a short-term warming treatment. It is still unknown how photosynthetic capacity changes in response to warming over a long period of time. Therefore, the response of photosynthetic capacity to a long-term warming treatment should be determined.
Some previous studies have analyzed interspecific differences in the responses of trees’ photosynthetic capacity to climate warming and found that the species in temperate forests near their cold range limit responded positively to a warming treatment [2,3,15]. Because they grow in different habitats, trees from the same species can be grouped into different provenances, i.e., populations containing local genetic variations. Provenances show intraspecific differences in a range of physiological characteristics [16]. However, it is still unknown whether the response of photosynthetic capacity to climate warming shows intraspecific differences, and if so, whether it follows the same pattern as interspecific differences, that is, whether trees near their cold range limit respond positively to climate warming. The mechanism underlying intraspecific differences in photosynthetic capacity is also unclear. Some studies have shown that photosynthetic capacity is mainly affected by the environment and that differences in photosynthetic capacity among provenances are attributable to phenotypic plasticity [17,18]. Other studies have found that differences in photosynthetic capacity among provenances may be attributed to ecotypic adaptation, where the differences are driven by genetic differentiation [19,20,21,22]. It is important, therefore, to determine whether the response of photosynthetic capacity to climate warming differs among provenances and to clarify whether this difference is controlled by phenotypic plasticity or by genetic adaptation.
Dahurian larch (Larix gmelinii) is a dominant tree species in boreal forests. This tree species is distributed over a wide geographical range and grows in diverse environments. According to the China Forest Resources Report (2014–2018), the area and stock volume of L. gmelinii forest accounts for 4.20% and 5.30% of the total in China, respectively [23]. Whether larch shows phenotypic plasticity to adapt to climate warming has important implications for carbon sequestration in forests. Some studies have suggested that larch cannot adapt to the warming environment and will disappear in China [24,25]. However, these results were predicted with statistical models and need to be verified by filed data. In 1983, we established a warming experiment by transplanting seedlings from 11 provenances into two common gardens that were located near the cold and warm range limits of larch. Forty years later, we examined the responses of photosynthetic capacity to this long-term climate warming treatment and explored the variations in responses among the 11 provenances. We tested the following hypotheses: (1) warming will enhance leaf photosynthetic capacity by increasing leaf nitrogen content and mesophyll conductance [26,27]; (2) the effects of warming on photosynthetic capacity will vary significantly among provenances, and those near their cold range limit will respond positively to warming [21,22].
2. Materials and Methods
2.1. Site Description and Experimental Design
The two common gardens were located at the Maoershan Forest Ecosystem Research Station (MES) (45°24′ N, 127°30′ E) and the Jiagedaqi Forest Silvicultural Station (JGDQ) (50°25′ N, 124°04′ E) (Table 1). At MES and JGDQ, the annual mean precipitation was 629.0 and 525.4 mm, respectively, and the annual mean air temperature was 3.1 and −1.2 °C, respectively. In the autumn of 1980, seeds were collected from the original sites of the 11 provenances in the natural distribution area of L. gmelinii in China (Table 2, Figure S1). The seeds were sown in the nursery early in the spring of 1981. In the spring of 1983, the 2-year-old seedlings of the 11 provenances were transplanted into the two common gardens. In each common garden, the experiment was established with a randomized complete block design, consisting of five blocks with a 10 m buffer in between. Each block contained 11 plots with a 4 m buffer in between. In each plot, 80 trees from one provenance were planted in double rows with 1.5 m × 2.0 m spacing. Trees in one row were cut down in 1997. In 2001, two out of three trees in the remaining row were cut down, so that the final spacing was 4.5 m × 4.0 m.

Table 1.
Geographic and climatic conditions of the two common garden sites (mean ± SD) *.
Table 2.
Geographic and climatic conditions of the origins of 11 provenances of Dahurian larch.
Compared with JGDQ, the temperature and precipitation in MES increased by 4.3 °C and 15%, respectively. This is similar to the IPCC sixth assessment report that the temperature in this region will increase by 3.0–7.8 °C and precipitation will increase by 10.3%–22.9% by the end of the 21st century [1]. Therefore, we sampled the trees growing in JGDQ as controls and the trees growing in MES as the warming treatments. It is impossible to distinguish the effects of temperature, precipitation, and soil nutrients on photosynthetic capacity, so climate warming represents a comprehensive effect in this study.
2.2. Measurements of Leaf Gas Exchange
The leaf gas exchange measurements were conducted in late July 2022. First, the diameter at breast height (DBH) of all trees in each common garden was measured, and the average DBH was calculated for each block and overall. The block with the average DBH closest to the overall average DBH was selected for further measurements. In the selected blocks, five standard trees were selected from each provenance. Three standard branches were cut from the middle canopy of each standard tree, and the needles from the 2–3 cm portion at the end of three short shoots of each standard branch were used for gas exchange measurements. The light and CO2 response curves were measured with a portable infrared gas analyzer (LI-6400, Li-Cor Inc., Lincoln, NE, USA) equipped with a red–blue LED light source (Li-6400-02B), a temperature controller (Li-6400-88), and a CO2 mixer/injector system (Li-6400-01). Before measurements were conducted, the leaves were allowed to equilibrate under the following environment-controlled conditions: chamber CO2 concentration, 400 μmol·mol−1; block temperature of the chamber, 25 °C; relative humidity in the chamber, 45%–65%; flow rate of air, 500 μmol·s−1. The light response curve of photosynthesis was measured over a range of photosynthetic photon flux density (2000, 1500, 1200, 800, 400, 200, 150, 100, 50, and 0 μmol photons·m−2·s−1). The CO2 response curve of photosynthesis was measured with a CO2 concentration gradient of 400, 200, 150, 100, 50, 600, 800, 1200, and 1500 μmol CO2·mol−1. From the light response curves, the area-based maximum net photosynthetic rate (Pmax-a) was derived from the model by Prado and De Moraes [28]. The CO2 response curves were fitted, and the maximum carboxylation rate (Vcmax), maximum electron transport rate (Jmax), triose phosphate utilization rate (TPU), and mesophyll conductance (gm) were calculated using the analysis software described in the article by Sharkey et al. [29].
2.3. Measurements of Leaf and Soil Traits
All needles sampled for gas exchange measurements were harvested and placed in a cooler at 4 °C. In the laboratory, the needles were scanned, dried to constant mass at 65 °C, and then weighed to calculate the specific leaf area (SLA = leaf area/leaf dry mass).
Needles (approximately 100 g) on the short shoot of each branch were sampled, randomly divided into two portions, and placed in a cooler at 4 °C. One portion was ground, extracted with a 1:1 mixture of acetone and ethanol, and then the absorbance of the solvent was determined at 645 nm and 663 nm using a spectrophotometer (Evolution300, Thermofisher Scientific Inc., Waltham, MA, USA). The other portion was heated in a 600 W microwave oven for 90 s, crushed, and then oven-dried at 65 °C to constant weight. The nitrogen concentration in the dried crushed needles (Nmass) was determined using an automatic nitrogen analyzer (Kjeltec 8400, Foss Tecator AB, Hillerød, Denmark). The leaf nitrogen concentration per unit area (Narea) was obtained by dividing the Nmass with SLA. The photosynthetic nitrogen use efficiency (PNUE) was obtained by dividing Pmax-a with Narea.
In the selected blocks in each common garden, 30 soil sampling points were arbitrarily selected, and three replicate soil cores of 0–10 cm depth were taken at each point. The three soil cores were mixed, and about 500 g of soil was collected by the four-fraction method. All soil samples were stored in a cooler at 4 °C and returned to the laboratory to determine the nitrogen concentration using the same method as that used for the leaves.
2.4. Data Analyses
The measured values of photosynthetic characteristics of trees in the JGDQ were used as the control, and the measured values of photosynthetic characteristics of trees in MES were used as the warming treatment. The effect size of warming treatment on photosynthetic characteristics for each provenance was calculated as follows:
where Xwarming and Xcontrol represent each variable (e.g., Pmax-a, Vcmax, Jmax, TPU) measured in MES and JGDQ, respectively, and i indicates each provenance.
ΔXi = (Xi-warming − Xi-control)/Xi-control × 100%
The genetic differentiation and phenotypic plasticity were estimated with the variance component feature using the restricted maximum likelihood method. The variances of the random effects (provenance σ2P, treatment σ2T, interaction between provenance and treatment σ2i, residual σ2ε) were calculated. The overall genetic differentiation (DG) among the provenances was estimated as σ2P/(σ2P + σ2i +σ2ε), and the phenotypic plasticity (PP) among treatments was estimated as σ2T/(σ2T + σ2i +σ2ε) [30].
All statistical analyses were conducted using R software (version 4.1.3, The R Foundation for Statistical Computing, Vienna, Austria). The data were subjected to analysis of variance (ANOVA) to test the main effects (warming treatment, provenance) on photosynthetic characteristics and related needle traits with the “agricolae” package. The data were tested for normal distribution and homogeneity of variance before ANOVA. Multiple comparisons of photosynthetic characteristics and related needle traits were conducted with the “multcomp” package. The regression model was applied to explore potential relationships between photosynthetic characteristics and needle traits or the climatic features of original sites with the “car” package. If the regression model coincided with the linear model, the slopes of the linear regression models were compared with an analysis of covariance. If the regression model coincided with the nonlinear model, the model was chosen by the Akaike information criterion (AIC).
3. Results
3.1. Comparison of Photosynthetic Characteristics
The warming treatment significantly (p < 0.05) affected the maximum net photosynthetic rate (Pmax-a), photosynthetic nitrogen use efficiency (PNUE), maximum carboxylation rate (Vcmax), maximum electron transport rate (Jmax), and triose phosphate utilization rate (TPU) (Table 3), and the interaction between the warming treatment and provenance was significant for all of these indexes. The effect of the warming treatment was significant (p < 0.01) for mesophyll conductance (gm) (Table 3). The overall average values of Pmax-a, PNUE, Vcmax, Jmax, TPU, and gm in the control were 6.23 ± 0.61 μmol·m−2·s−1, 4.06 ± 0.41 μmol g−1·s−1, 101.54 ± 7.10 μmol·m−2·s−1, 120.95 ± 5.87 μmol·m−2·s−1, 9.43 ± 0.52 μmol·m−2·s−1, and 1.18 ± 0.12 μmol·m−2·s−1, respectively, and were increased by 21.67%, 26.11%, 29.86%, 31.08%, 19.54%, and 55.93%, respectively, in the warming treatment (Figure 1).
Table 3.
Two-factor analysis of variance to determine the effects of provenance, treatment, and their interaction on the photosynthetic capacity and related needle traits of Dahurian larch *.
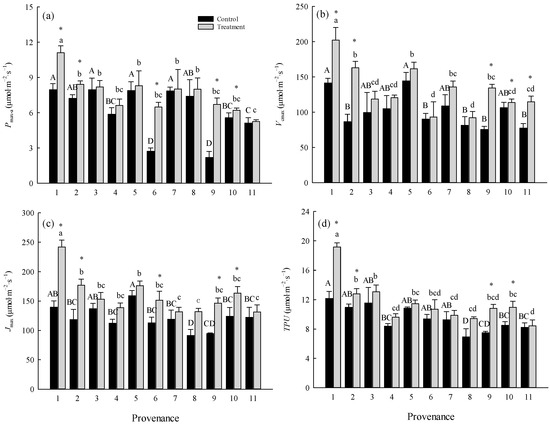
Figure 1.
Comparisons of (a) Pmax-a, (b) Vcmax, (c) Jmax, and (d) TPU between treatments and among provenances (mean ± SE). Different capital letters indicate significant differences among provenances in the control (p < 0.05), and different lowercase letters indicate significant differences among provenances in the warming treatment (p < 0.05). * indicates a significant difference in that provenance between the control and warming treatment (p < 0.05). Refer to Table 2 for provenance codes and Table 3 for abbreviations of photosynthetic characteristics.
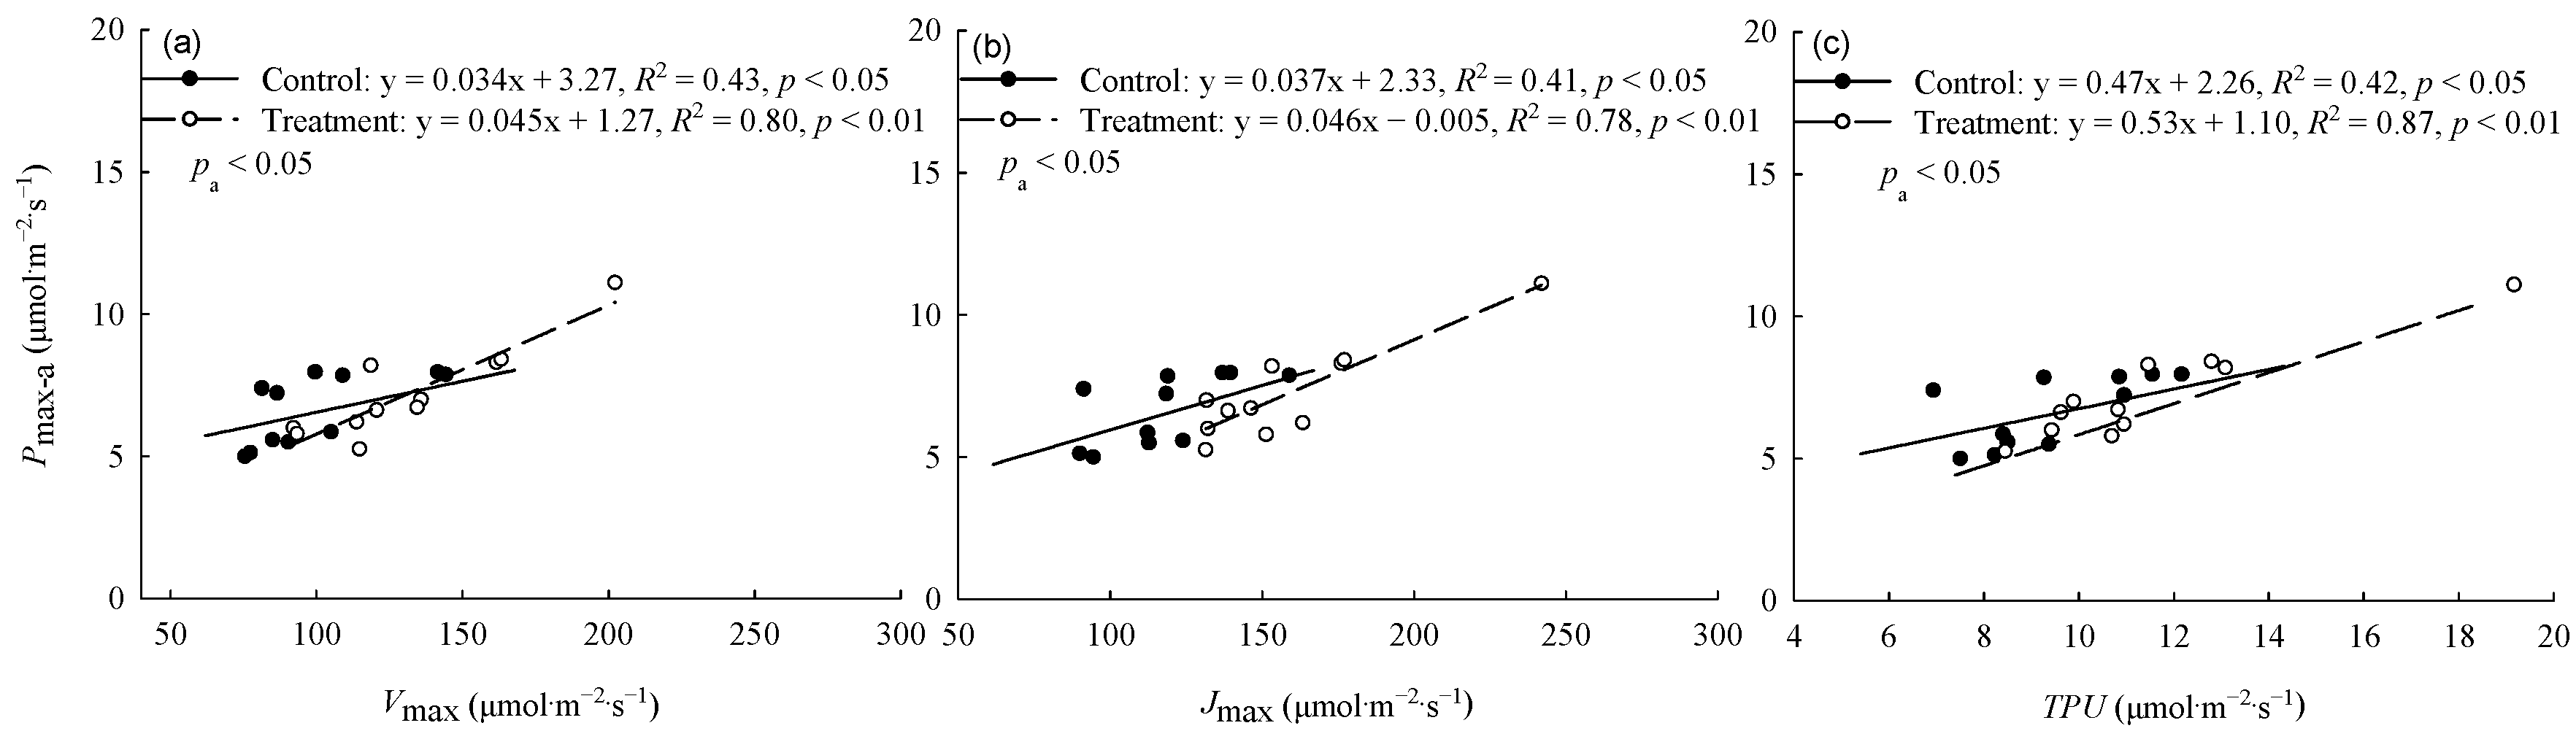
The warming treatment significantly (p < 0.05) increased the Pmax-a and Jmax of trees from Hebei, Wuyiling, Xinlin, Moerdaoga, and Genhe; increased the Vcmax of trees from Hebei, Wuyiling, Moerdaoga, Genhe, and Mangui; and increased the TPU of trees from Hebei, Wuyiling, Moerdaoga, and Genhe. Pooling the data for the 11 provenances in each common garden, Pmax-a was consistently (p < 0.05) and positively correlated with Vcmax, Jmax, and TPU, but the slope of the correlations was greater in the warming treatment than in the control (Figure 2).
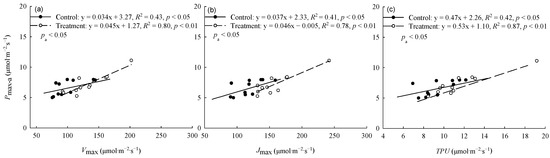
Figure 2.
Relationships between Pmax-a and (a) Vcmax, (b) Jmax, and (c) TPU. Pa represents the significance of the difference in slope between regression equations. Refer to Table 3 for abbreviations of photosynthetic characteristics.
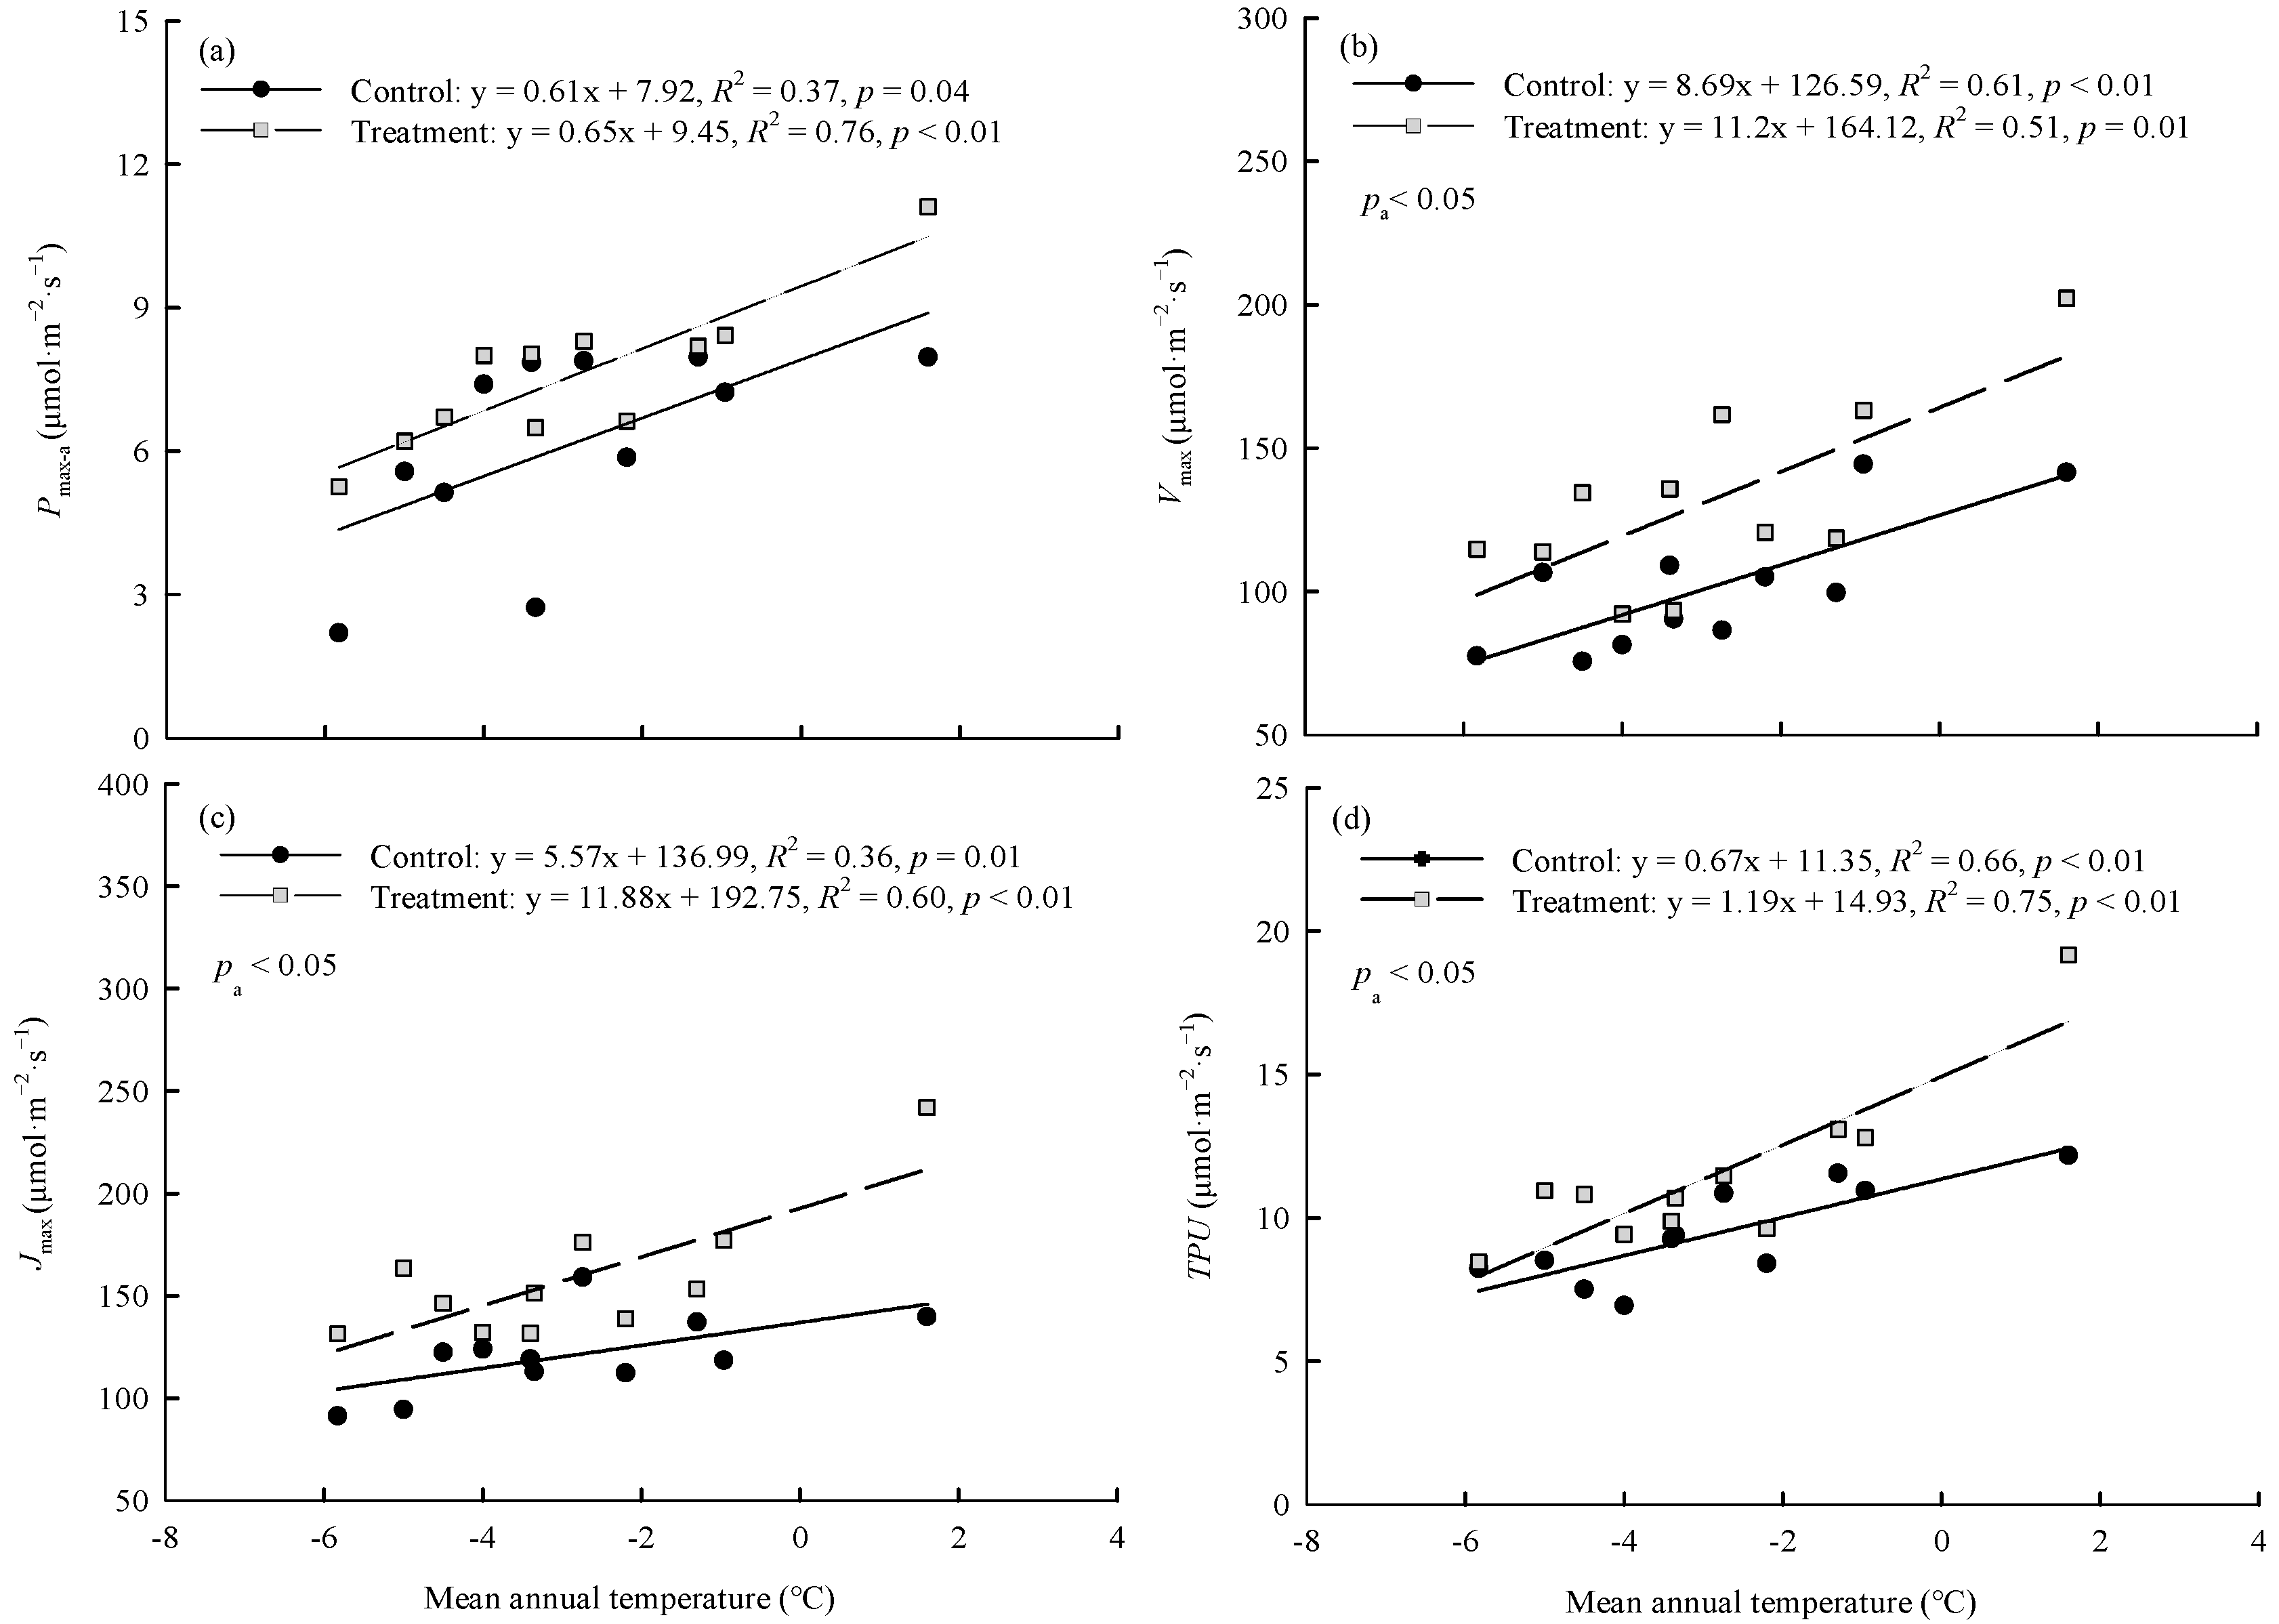
In the control and warming treatment, Pmax-a, Vcmax, Jmax, and TPU were significantly (p < 0.01) positively linearly correlated with the average annual temperature of the original site of the provenances (Figure 3). The magnitude of the warming treatment’s effect on photosynthetic capacity varied among provenances and was related to the climate of the original site of the provenances. ΔPmax-a, ΔVcmax, ΔJmax, and ΔTPU were significantly (p < 0.01) correlated with the aridity index of the original site. As the aridity index of the original site increased, the magnitude of the warming effect on each index first increased and then decreased (Figure 4).
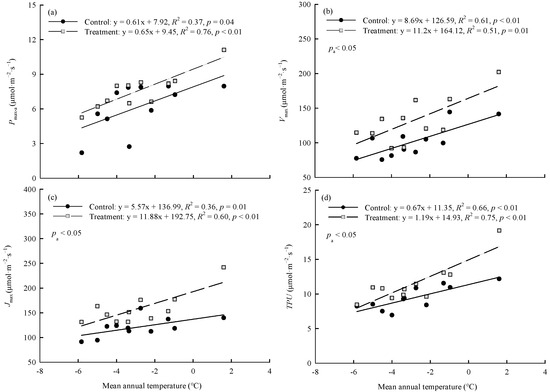
Figure 3.
Relationships between (a) Pmax-a, (b) Vcmax, (c) Jmax, (d) TPU and the mean annual temperature of original sites. Refer to Table 3 for abbreviations of photosynthetic characteristics.
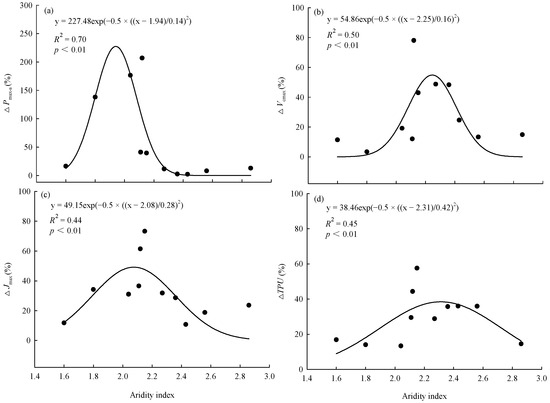
Figure 4.
Relationships between effect of warming on (a) maximum net photosynthetic rate (ΔPmax-a), (b) maximum carboxylation rate (ΔVcmax), (c) maximum electron transport rate (ΔJmax), (d) triose phosphate utilization rate (ΔTPU), and aridity index of the original sites. Aridity index = mean annual evaporation/mean annual precipitation.
The provenance effect accounted for 43.22%, 35.54%, 48.08%, 32.63%, and 51.51% of the total variance in Pmax-a, PNUE, Vcmax, Jmax, and TPU, respectively (Table 4). The environment effect accounted for 25.41%, 27.71%, 42.46%, 48.17%, and 34.73% of the total variance in Pmax-a, PNUE, Vcmax, Jmax, and TPU, respectively (Table 4).
Table 4.
Genetic differentiation and phenotypic plasticity of photosynthetic characteristics among 11 Dahurian larch provenances *.
3.2. Comparison of Factors Related to Photosynthetic Capacity
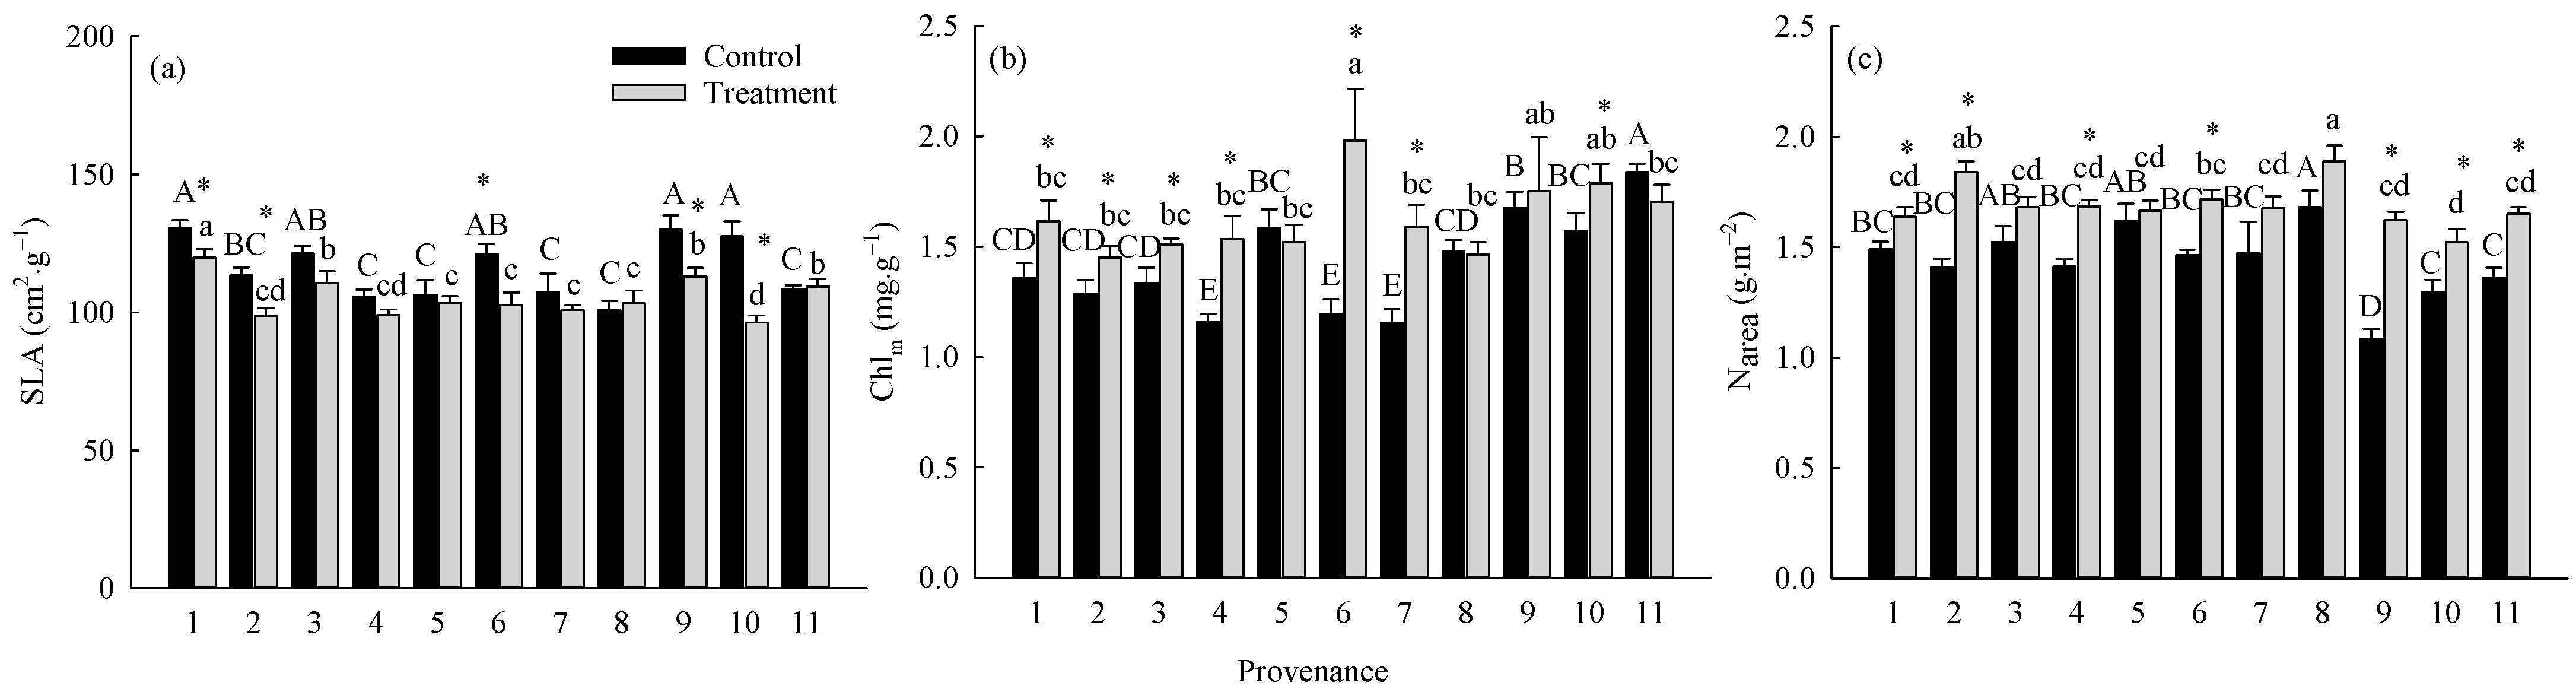
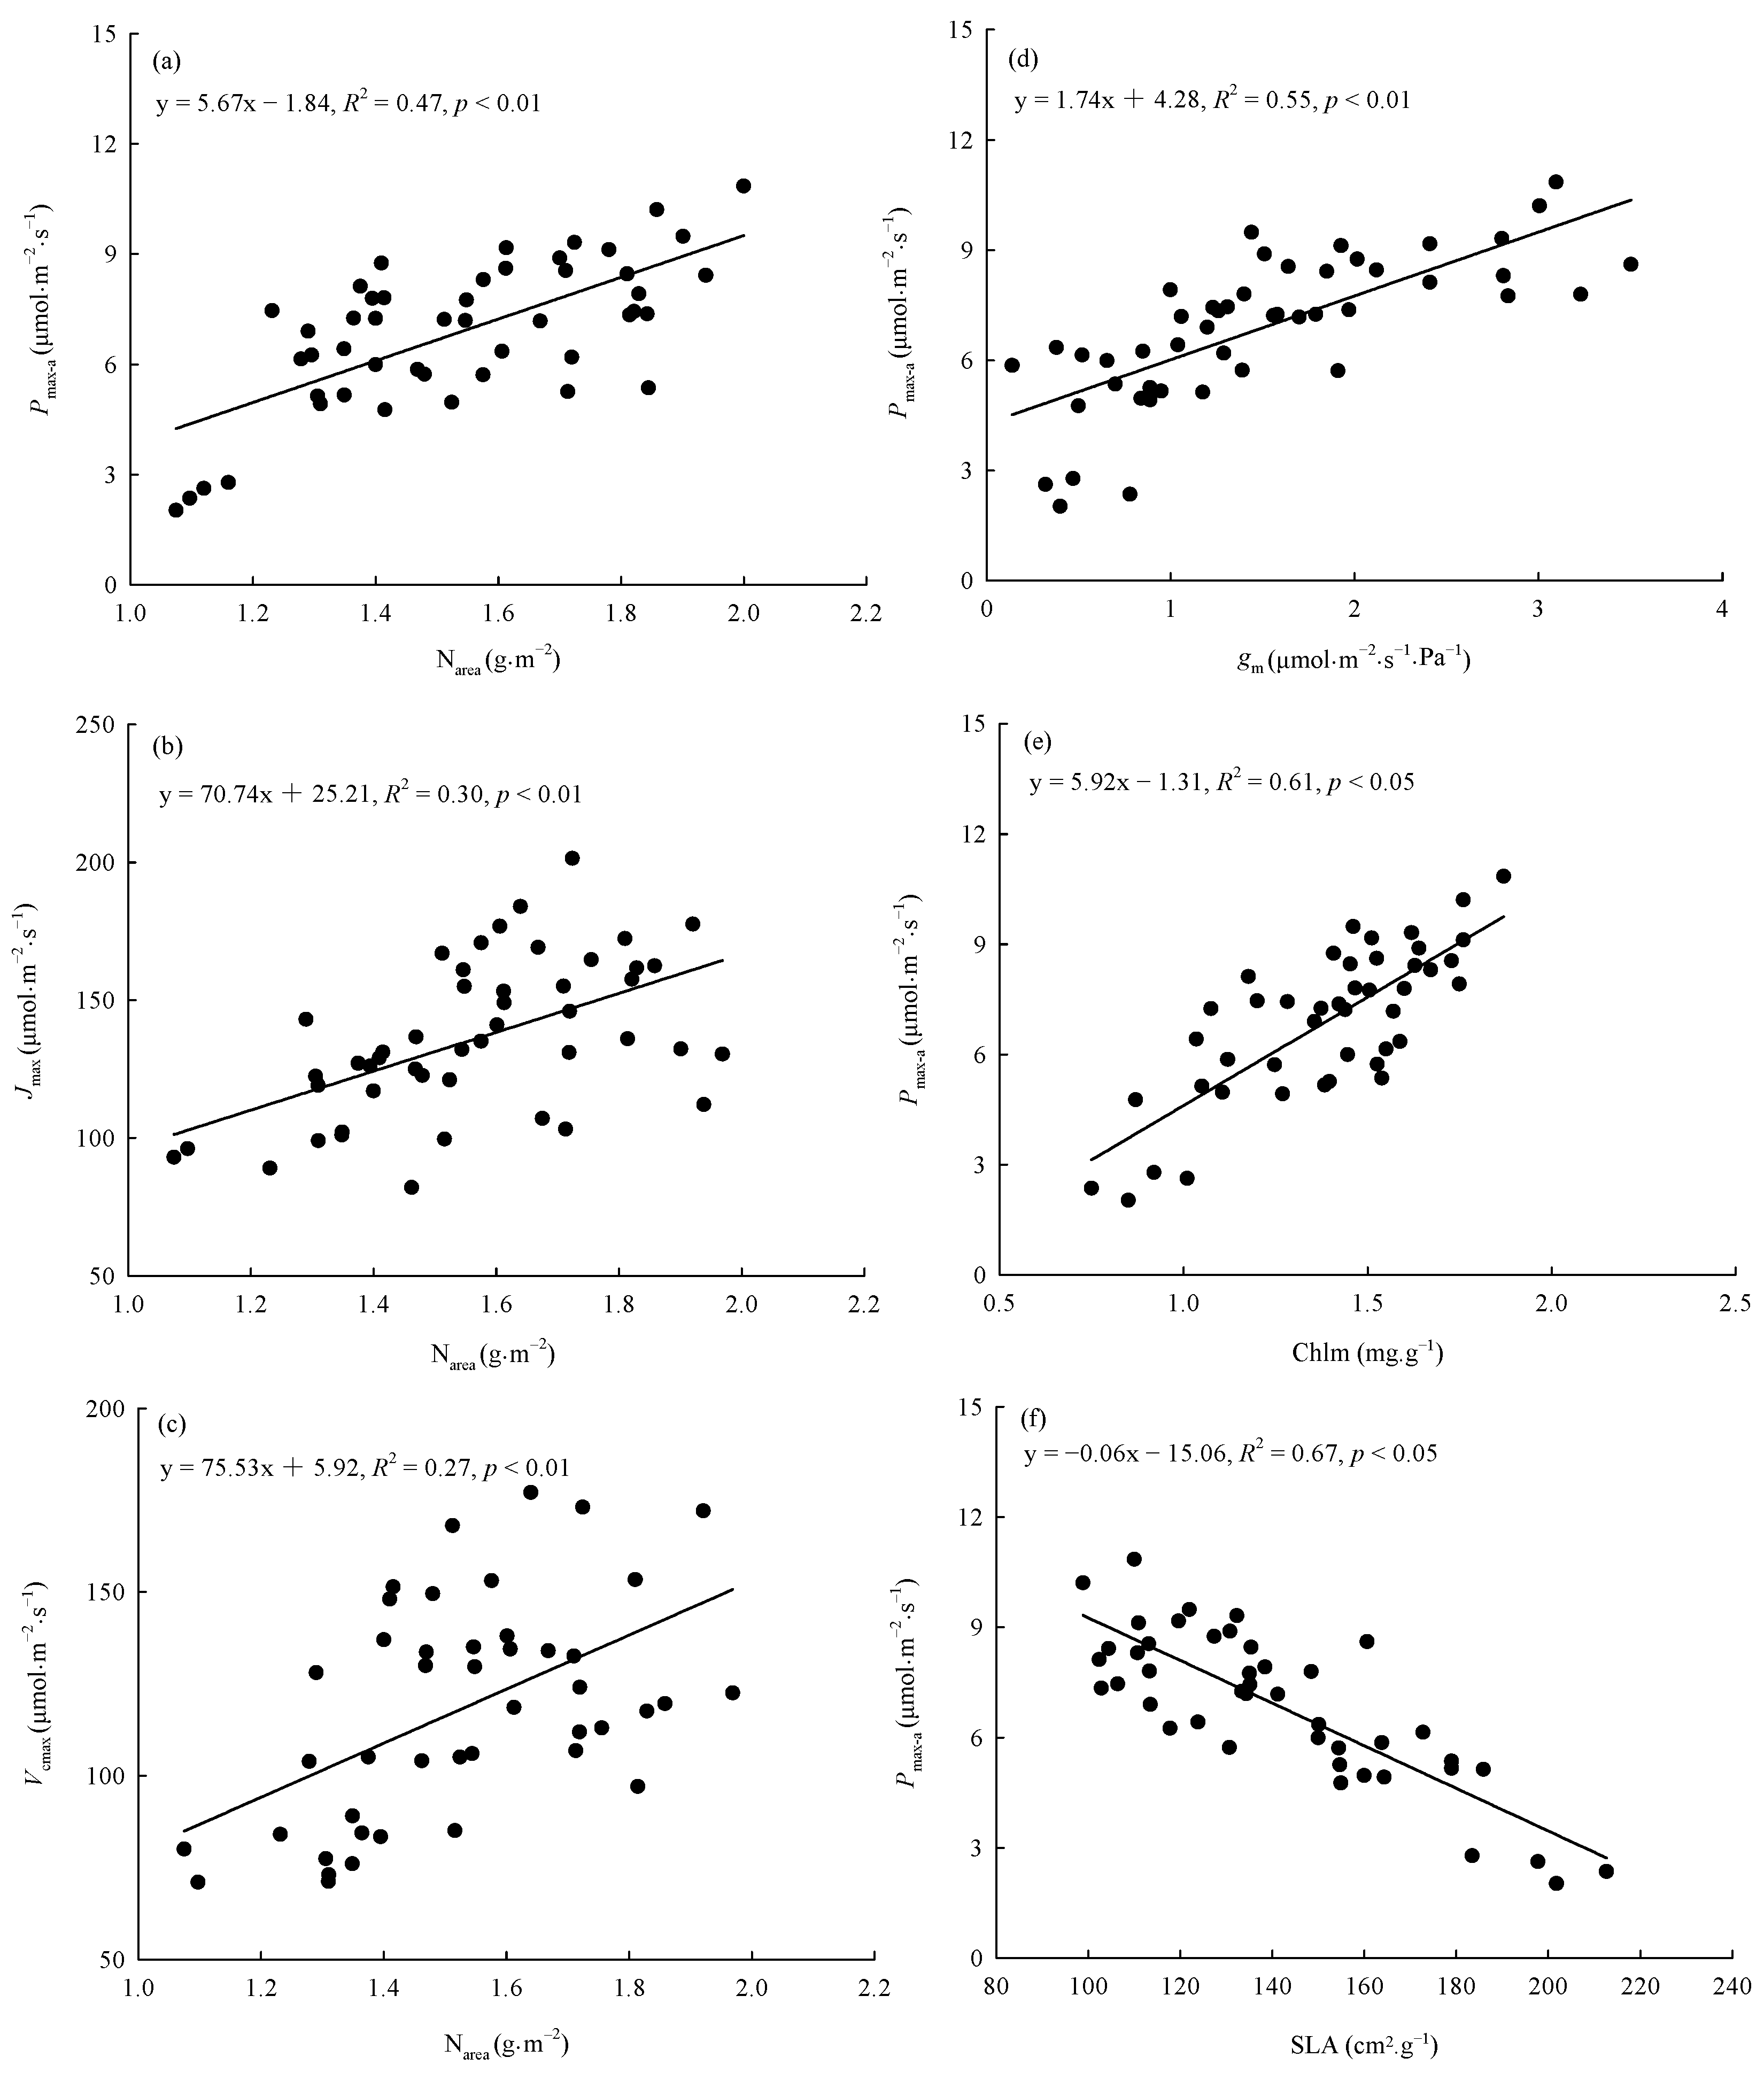
The warming treatment, the provenance, and their interaction significantly (p < 0.05) affected SLA, Chlm, and Narea (Table 3). The warming treatment decreased the overall average SLA by 10.95% and increased the overall average Chlm and Narea by 18.25% and 18.18%, respectively. There were significant differences (p < 0.05) among provenances in the responses of SLA, Chlm, and Narea to the warming treatment (Figure 5). The warming treatment significantly (p < 0.05) decreased the SLA of trees from Hebei, Wuyiling, Xinlin, Moerdaoga, and Genhe; increased the Chlm of trees from Hebei, Wuyiling, Sanzhan, Zhongyangzhan, Xinlin, Chuoer, and Genhe; and increased the Narea of trees from Hebei, Wuyiling, Zhongyangzhan, Xinlin, Moerdaoga, Genhe, and Mangui. Narea was significantly (p < 0.01) positively associated with Pmax-a, Vcmax, and Jmax, (Figure 6a–c), and Pmax-a was significantly (p < 0.01) positively associated with gm, Chlm, and SLA (Figure 6d–f).

Figure 5.
Comparisons of (a) SLA, (b) Chlm, and (c) Narea between treatments and among provenances (mean ± SE). Different capital letters indicate significant differences among provenances in the control (p < 0.05); different lowercase letters indicate significant differences among provenances in the warming treatment (p < 0.05); * indicates a significant difference between the treatment and control in that provenance (p < 0.05). Refer to Table 2 for provenance codes; refer to Table 3 for abbreviations of photosynthetic characteristics.
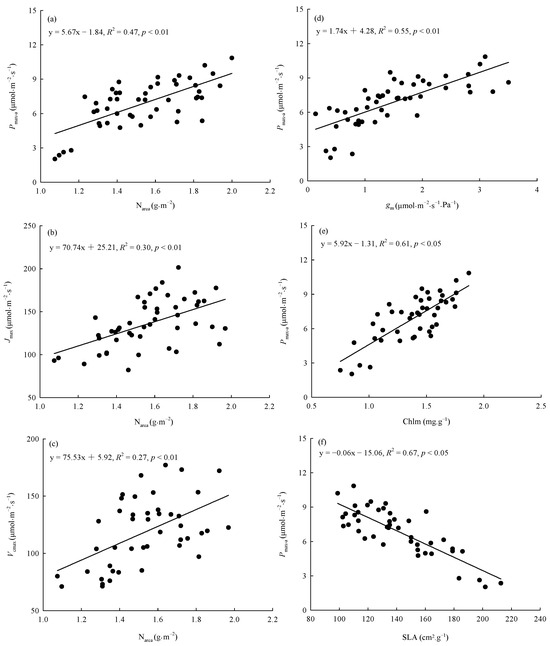
Figure 6.
Relationships between Narea and (a) Pmax-a, (b) Jmax, and (c) Vcmax, and between Pmax-a and (d) gm, (e) Chlm, and (f) SLA. Refer to Table 3 for abbreviations of photosynthetic characteristics.
4. Discussion
4.1. Effect of Warming on Photosynthetic Capacity
Consistent with our hypothesis, the warming treatment significantly increased the Pmax-a, Vcmax, Jmax, and TPU of L. gmelinii by 19.54%–28.47% and increased the slope of the linear correlation between Pmax-a and Vcmax, Jmax, and TPU. These results indicate that warming increased the activity of ribulose-1,5-bisphosphate carboxylase/oxygenase (Rubisco), the regeneration rate of 1,5-ribulose diphosphate, and the CO2 utilization capacity, and consequently improved Pmax-a. Meanwhile, Narea also increased under the warming treatment and was positively associated with Pmax-a, Vcmax, and Jmax, indicating that the increased nitrogen content in the leaves was one reason for the increased photosynthetic capacity. This is because Rubisco is the largest nitrogen sink in the leaves [31]. The increased nitrogen content in the leaves would increase the carboxylation rate by affecting the Rubisco protease content, which affects the photosynthetic capacity [32]. In addition, the PNUE increased significantly under the warming treatment. Trees allocate more nitrogen to the photosynthetic apparatus under a warming treatment [21,33], and increases in leaf nitrogen content and nitrogen-use efficiency can promote the photosynthetic capacity [27].
The increase in leaf nitrogen content might be related to changes in leaf structure. One of the most important leaf functional traits is SLA, which represents the resource utilization strategy of plants. A smaller SLA usually corresponds to higher Narea [34]. In this study, the SLA decreased significantly in the warming treatment, indicating that larch leaves became thicker in response to long-term warming. Further analyses of leaf anatomy indicated that the increase in leaf thickness was mainly caused by thickening of the mesophyll layer and an increase in the proportion of the mesophyll in the leaf (unpublished data). The increase in mesophyll thickness and proportion would lead to increased numbers of chloroplasts and increased nitrogen content, which was supported by the significant increase in Chlm and Narea. The leaf nitrogen content may also be related to soil nitrogen content, as reported in other studies [35,36]. The higher soil nitrogen content in the MES common garden than in the JGDQ common garden may have caused trees to absorb more nitrogen to meet their photosynthetic requirements. Some studies have shown that warming could increase soil nitrogen availability and pool [37,38]. In this study, the temperature, precipitation, and soil nitrogen in the MES common garden were higher than those in the JGDQ common garden. So, the warming treatment represents the combined effect and was more than an increase in temperature. How to separate the effects of temperature, precipitation, and soil nitrogen requires more common gardens to study. This is also the focus of our future research.
Previous studies have identified mesophyll conductance as one of the limiting factors of the photosynthetic rate [39] and found that mesophyll conductance limited photosynthesis to a similar extent to stomatal conductance and was affected by temperature [40]. Some other studies have reported that mesophyll conductance increased with increasing temperature [41,42]. Our results show that long-term warming significantly increased leaf gm, and there was a significant positive linear correlation between Pmax-a and gm. These findings indicate that warming promoted CO2 diffusion and conductance in the leaf of L. gmelinii, which was beneficial for photosynthetic carbon assimilation. In summary, our results show that the photosynthetic capacity of L. gmelinii significantly increased during a 40-year warming treatment. This indicates that the promoting effect of warming on the photosynthetic capacity can be sustained, and that the photosynthetic capacity of L. gmelinii can actively adapt to climate warming.
4.2. Differences among Provenances in the Response of Photosynthetic Capacity to Warming
Many studies have explored whether there are differences in photosynthetic capacity among provenances of various tree species and have tried to determine the regulatory mechanism underlying such differences [19,20,21,22]. Our results show that there were significant differences in Pmax-a, Vcmax, Jmax, and TPU among the 11 provenances in the control and the warming treatment, and the values of all these indexes increased with increasing annual mean temperature of the original sites of the provenances. Genetic differentiation among the provenances accounted for 32.63%–51.51% of the total phenotypic variation in the photosynthetic capacity. These findings confirm the existence of variation in photosynthetic capacity among the provenances and indicate that this variation is also driven by genes and is the result of long-term adaptation to the original habitats of the original sites of the provenances. In our study, the trees had grown in the common garden for 40 years and had suitable row spacing to attenuate competition among individuals. Therefore, our results are credible and support the viewpoint that differences among provenances are mainly under genetic control [19,20,21,22].
Consistent with our hypothesis, the responses of photosynthetic capacity to warming differed significantly among the 11 provenances. However, we found that warming only significantly increased the Pmax-a, Vcmax, and Jmax of five provenances and the TPU of four provenances. This indicated that the photosynthetic capacity of at least 50% of the provenances acclimatized to warming or was not sensitive to warming. To explore the mechanism by which warming affected the photosynthetic capacity, we calculated the differences in photosynthetic characteristics between the control and the warming treatment for each provenance and defined it as the warming effect. Although this definition has some limitations, it has certain indicative significance. The results show that the effects of warming on Pmax-a, Vcmax, Jmax, and TPU had significant nonlinear relationships with the aridity index of the original sites. As the aridity index of the original sites increased, the ΔPmax-a, ΔVcmax, ΔJmax, and ΔTPU increased first and then decreased, and the peak values appeared when the aridity index was between 2.1 and 2.2. As an appropriate indicator of climatic conditions, the aridity index is affected by both temperature and precipitation. Therefore, we believe that the responses of photosynthetic capacity to warming were jointly affected by both the temperature and precipitation of the original sites. This slightly differs from the hypothesis that trees growing near their cold range limit will respond positively to warming. Because of the minimal changes in temperature and precipitation conditions, the effect of climate warming on the photosynthetic capacity of trees from less arid sites was not significant. For the trees from more arid sites, the warming temperature might have exceeded the optimal photosynthetic temperature, so it did not significantly increase the photosynthetic capacity. Therefore, we should consider differences among provenances when studying the effects of climate warming on photosynthetic capacity.
5. Conclusions
A long-term (40-year) climate warming treatment increased the leaf chlorophyll content, leaf nitrogen content, and photosynthetic nitrogen use efficiency of L. gmelinii, which enhanced its photosynthetic capacity. The photosynthetic capacity varied significantly among the provenances, and this was explained by the climatic conditions at the provenances’ sites of origin. About half of the 11 provenances showed a significant increase in photosynthetic capacity under the warming treatment. The response of photosynthetic capacity to warming showed a single-peak curve as the aridity index of the site of origin increased. These results contribute to our understanding of how photosynthetic capacity will respond to climate warming and its regulatory mechanisms. Notably, the warming treatment in this study represented the combined effect of temperature, precipitation, and soil. Therefore, further research is required to quantify the contribution of each influencing factor.
Supplementary Materials
The following supporting information can be downloaded at: https://www.mdpi.com/article/10.3390/f15061024/s1, Figure S1: Locations of Larix gmelinii provenances and common gardens.
Author Contributions
C.W. conceived and designed the research. X.Q., R.T., L.L., D.Z. and J.Z. carried out the measurements. X.Q. and R.T. analyzed the data and wrote the manuscript. All authors have read and agreed to the published version of the manuscript.
Funding
This research was supported by the National Key Research and Development Program of China (No. 2021YFD220040107).
Data Availability Statement
The data presented in this study are available on request from the corresponding author.
Acknowledgments
We thank Yalong Liu and many colleagues for their assistance conducting fieldwork and Jennifer for word editing. The Maoershan Forest Ecosystem Research Station provided field logistic support for this research.
Conflicts of Interest
The authors declare no conflicts of interest.
References
- Lee, J.Y.; Marotzke, J.; Bala, G.; Cao, L.; Corti, S.; Dunne, J.P.; Engelbrecht, F.; Fischer, E.; Fyfe, J.C.; Jones, C.; et al. Future Global Climate: Scenario-Based Projections and Near-Term Information. In Climate Change 2021: The Physical Science Basis; Masson-Delmotte, V., Zhai, P., Pirani, A., Connors, S.L., Péan, C., Berger, S., Caud, N., Chen, Y., Goldfarb, L., Gomis, M.I., et al., Eds.; Cambridge University Press: Cambridge, UK; New York, NY, USA, 2021; pp. 553–672. [Google Scholar]
- Reich, P.B.; Sendall, K.M.; Rice, K.; Rich, R.L.; Stefanski, A.; Hobbie, S.E.; Montgomery, R.A. Geographic range predicts photosynthetic and growth response to warming in co-occurring tree species. Nat. Clim. Chang. 2015, 5, 148–152. [Google Scholar] [CrossRef]
- Sendall, K.M.; Reich, P.B.; Zhao, C.M.; Hou, J.H.; Wei, X.R.; Stefanski, A.; Rice, K.; Rich, R.L.; Montgomery, R.A. Acclimation of photosynthetic temperature optima of temperate and boreal tree species in response to experimental forest warming. Glob. Chang. Biol. 2015, 21, 1342–1357. [Google Scholar] [CrossRef]
- Reich, P.B.; Sendall, K.M.; Stefanski, A.; Wei, X.; Rich, R.L.; Montgomery, R.A. Boreal and temperate trees show strong acclimation of respiration to warming. Nature 2016, 531, 633–636. [Google Scholar] [CrossRef]
- Scafaro, A.P.; Xiang, S.; Long, B.M.; Bahar, N.H.A.; Weerasinghe, L.K.; Creek, D.; Evans, J.R.; Reich, P.B.; Atkin, O.K. Strong thermal acclimation of photosynthesis in tropical and temperate wet-forest tree species: The importance of altered Rubisco content. Glob. Chang. Biol. 2017, 23, 2783–2800. [Google Scholar] [CrossRef]
- Varhammar, A.; Wallin, G.; McLean, C.M.; Dusenge, M.E.; Medlyn, B.E.; Hasper, T.B.; Nsabimana, D.; Uddling, J. Photosynthetic temperature responses of tree species in Rwanda: Evidence of pronounced negative effects of high temperature in montane rainforest climax species. New Phytol. 2015, 206, 1000–1012. [Google Scholar] [CrossRef]
- Streit, K.; Siegwolf, R.T.W.; Hagedorn, F.; Schaub, M.; Buchmann, N. Lack of photosynthetic or stomatal regulation after 9 years of elevated CO2 and 4 years of soil warming in two conifer species at the alpine treeline. Plant Cell Environ. 2014, 37, 315–326. [Google Scholar] [CrossRef]
- Way, D.A.; Sage, R.F. Elevated growth temperatures reduce the carbon gain of black spruce [Picea mariana (Mill.) BSP]. Glob. Chang. Biol. 2008, 14, 624–636. [Google Scholar] [CrossRef]
- Aspinwall, M.J.; Drake, J.E.; Campany, C.; Vårhammar, A.; Ghannoum, O.; Tissue, D.T.; Reich, P.B.; Tjoelker, M.G. Convergent acclimation of leaf photosynthesis and respiration to prevailing ambient temperatures under current and warmer climates in Eucalyptus tereticornis. New Phytol. 2016, 212, 354–367. [Google Scholar] [CrossRef]
- Chang, H.; An, J.; Roh, Y.; Son, Y. Experimental warming and drought treatments reduce physiological activities and increase mortality of Pinus koraiensis seedlings. Plant Ecol. 2020, 221, 515–527. [Google Scholar] [CrossRef]
- Dusenge, M.E.; Madhavji, S.; Way, D.A. Contrasting acclimation responses to elevated CO2 and warming between an evergreen and a deciduous boreal conifer. Glob. Chang. Biol. 2020, 26, 3639–3657. [Google Scholar] [CrossRef]
- Togashi, H.F.; Prentice, I.C.; Atkin, O.K.; Macfarlane, C.; Prober, S.M.; Bloomfield, K.J.; Evans, B.J. Thermal acclimation of leaf photosynthetic traits in an evergreen woodland, consistent with the coordination hypothesis. Biogeosciences 2018, 15, 3461–3474. [Google Scholar] [CrossRef]
- Sage, R.F.; Kubien, D.S. The temperature response of C3 and C4 photosynthesis. Plant Cell Environ. 2007, 30, 1086–1106. [Google Scholar] [CrossRef]
- Gunderson, C.A.; O’Hara, K.H.; Campion, C.M.; Walker, A.V.; Edwards, N.T. Thermal plasticity of photosynthesis: The role of acclimation in forest responses to a warming climate. Glob. Chang. Biol. 2010, 16, 2272–2286. [Google Scholar] [CrossRef]
- Davis, M.B.; Shaw, R.G. Range Shifts and Adaptive Responses to Quaternary Climate Change. Science 2001, 292, 673–679. [Google Scholar] [CrossRef]
- Bresson, C.C.; Vitasse, Y.; Kremer, A.; Delzon, S. To what extent is altitudinal variation of functional traits driven by genetic adaptation in European oak and beech? Tree Physiol. 2011, 31, 1164–1174. [Google Scholar] [CrossRef]
- Drake, J.E.; Vårhammar, A.; Kumarathunge, D.; Medlyn, B.E.; Pfautsch, S.; Reich, P.B.; Tissue, D.T.; Ghannoum, O.; Tjoelker, M.G. A common thermal niche among geographically diverse populations of the widely distributed tree species Eucalyptus tereticornis: No evidence for adaptation to climate-of-origin. Glob. Chang. Biol. 2017, 23, 5069–5082. [Google Scholar] [CrossRef]
- Benomar, L.; Lamhamedi, M.S.; Pepin, S.; Rainville, A.; Lambert, M.-C.; Margolis, H.A.; Bousquet, J.; Beaulieu, J. Thermal acclimation of photosynthesis and respiration of southern and northern white spruce seed sources tested along a regional climatic gradient indicates limited potential to cope with temperature warming. Ann. Bot. 2018, 121, 443–457. [Google Scholar] [CrossRef]
- Robson, T.M.; Sanchez-Gomez, D.; Javier-Cano, F.; Aranda, I. Variation in functional leaf traits among beech provenances during a Spanish summer reflects the differences in their origin. Tree Genet. Genomes 2012, 8, 1111–1121. [Google Scholar] [CrossRef]
- Aspinwall, M.J.; Vårhammar, A.; Blackman, C.J.; Tjoelker, M.G.; Ahrens, C.; Byrne, M.; Tissue, D.T.; Rymer, P.D. Adaptation and acclimation both influence photosynthetic and respiratory temperature responses in Corymbia calophylla. Tree Physiol. 2017, 37, 1095–1112. [Google Scholar] [CrossRef]
- Quan, X.K.; Wang, C.K. Acclimation and adaptation of leaf photosynthesis, respiration and phenology to climate change: A 30-year Larix gmelinii common-garden experiment. For. Ecol. Manag. 2018, 411, 166–175. [Google Scholar]
- Tenkanen, A.; Suprun, S.; Oksanen, E.; Keinanen, M.; Keski-Saari, S.; Kontunen-Soppela, S. Strategy by latitude? Higher photosynthetic capacity and root mass fraction in northern than southern silver birch (Betula pendula Roth) in uniform growing conditions. Tree Physiol. 2021, 41, 974–991. [Google Scholar] [CrossRef]
- The National Forestry and Grassland Administration. China Forest Resources Report; China Forestry Publishing House: Beijing, China, 2019; pp. 275–365.
- Leng, W.F.; He, H.S.; Liu, H.J. Response of larch species to climate changes. J. Plant Ecol. 2008, 1, 203–205. [Google Scholar] [CrossRef]
- Li, F.; Zhou, G.S.; Cao, M.C. Responses of Larix gmelinii geographical distribution to future climate change: A simulation study China. J. Appl. Ecol. 2006, 17, 2255–2260. (In Chinese) [Google Scholar]
- Crous, K.Y.; Drake, J.E.; Aspinwall, M.J.; Sharwood, R.E.; Tjoelker, M.G.; Ghannoum, O. Photosynthetic capacity and leaf nitrogen decline along a controlled climate gradient in provenances of two widely distributed Eucalyptus species. Glob. Chang. Biol. 2018, 24, 4626–4644. [Google Scholar] [CrossRef] [PubMed]
- Ju, Y.L.; Wang, C.K.; Wang, N.; Quan, X.K. Transplanting larch trees into warmer areas increases the photosynthesis and its temperature sensitivity. Tree Physiol. 2022, 42, 2521–2533. [Google Scholar] [CrossRef]
- Prado, C.H.B.A.; De Moraes, J.A.P.V. Photosynthetic capacity and specific leaf mass in twenty woody species of Cerrado vegetation under field conditions. Photosynthetica 1997, 33, 103–112. [Google Scholar] [CrossRef]
- Sharkey, T.D.; Bernacchi, C.J.; Farquhar, G.D.; Singsaas, E.L. Fitting photosynthetic carbon dioxide response curves for C3 leaves. Plant Cell Environ. 2007, 30, 1035–1040. [Google Scholar] [CrossRef]
- Vitasse, Y.; Delzon, S.; Bresson, C.C.; Michalet, R.; Kremer, A. Altitudinal differentiation in growth and phenology among populations of temperate-zone tree species growing in a common garden. Can. J. For. Res. 2009, 39, 1259–1269. [Google Scholar] [CrossRef]
- Hikosaka, K. Mechanisms underlying interspecific variation in photosynthetic capacity across wild plant species. Plant Biotechnol. 2010, 27, 223–229. [Google Scholar] [CrossRef]
- Warren, C.R.; Dreyer, E.; Adams, M.A. Photosynthesis-Rubisco relationships in foliage of Pinus sylvestris in response to nitrogen supply and the proposed role of Rubisco and amino acids as nitrogen stores. Trees-Struct. Funct. 2003, 17, 359–366. [Google Scholar] [CrossRef]
- Grassi, G.; Magnani, F. Stomatal, mesophyll conductance and biochemical limitations to photosynthesis as affected by drought and leaf ontogeny in ash and oak trees. Plant Cell Environ. 2005, 28, 834–849. [Google Scholar] [CrossRef]
- Dong, N.; Prentice, I.C.; Wright, I.J.; Evans, B.J.; Togashi, H.F.; Caddy-Retalic, S.; McInerney, F.A.; Sparrow, B.; Leitch, E.; Lowe, A.J. Components of leaf-trait variation along environmental gradients. New Phytol. 2020, 228, 82–94. [Google Scholar] [CrossRef]
- Liang, X.Y.; Zhang, T.; Lu, X.K.; Ellsworth, D.S.; BassiriRad, H.; You, C.M.; Wang, D.; He, P.C.; Deng, Q.; Liu, H.; et al. Global response patterns of plant photosynthesis to nitrogen addition: A meta-analysis. Glob. Chang. Biol. 2020, 26, 3585–3600. [Google Scholar] [CrossRef]
- Xu, Y.S.; Shang, B.; Feng, Z.Z.; Tarvainen, L. Effect of elevated ozone, nitrogen availability and mesophyll conductance on the temperature responses of leaf photosynthetic parameters in poplar. Tree Physiol. 2020, 40, 484–497. [Google Scholar] [CrossRef] [PubMed]
- Rustad, L.; Campbell, J.; Marion, G.; Norby, R.; Mitchell, M.; Hartley, A.; Cornelissen, J.; Gurevitch, J.; Gcte, N. A meta-analysis of the response of soil respiration, net nitrogen mineralization, and aboveground plant growth to experimental ecosystem warming. Oecologia 2001, 126, 543–562. [Google Scholar] [CrossRef] [PubMed]
- Bai, E.; Li, S.L.; Xu, W.H.; Li, W.; Dai, W.W.; Jiang, P. A meta-analysis of experimental warming effects on terrestrial nitrogen pools and dynamics. New Phytol. 2013, 199, 441–451. [Google Scholar] [CrossRef] [PubMed]
- Lei, Z.Y.; Liu, F.; Wright, I.J.; Carriquí, M.; Niinemets, Ü.; Han, J.M.; Jia, M.M.; Atwell, B.J.; Cai, X.Y.; Zhang, W.F.; et al. Comparisons of photosynthetic and anatomical traits between wild and domesticated cotton. J. Exp. Bot. 2022, 73, 873–885. [Google Scholar] [CrossRef] [PubMed]
- Flexas, J.; Barbour, M.M.; Brendel, O.; Cabrera, H.M.; Carriquí, M.; Díaz-Espejo, A.; Douthe, C.; Dreyerc, E.; Ferrio, J.P.; Gago, J.; et al. Mesophyll diffusion conductance to CO2: An unappreciated central player in photosynthesis. Plant Sci. 2012, 196, 31. [Google Scholar] [CrossRef]
- von Caemmerer, S.; Evans, J.R. Temperature responses of mesophyll conductance differ greatly between species. Plant Cell Environ. 2015, 38, 629–637. [Google Scholar] [CrossRef]
- Li, S.L.; Tan, T.T.; Fan, Y.F.; Raza, M.A.; Wang, Z.L.; Wang, B.B.; Zhang, J.W.; Tan, X.M.; Ping, C.; Shafiq, I.; et al. Responses of leaf stomatal and mesophyll conductance to abiotic stress factors. J. Integr. Agric. 2022, 21, 2787–2804. [Google Scholar] [CrossRef]


Disclaimer/Publisher’s Note: The statements, opinions and data contained in all publications are solely those of the individual author(s) and contributor(s) and not of MDPI and/or the editor(s). MDPI and/or the editor(s) disclaim responsibility for any injury to people or property resulting from any ideas, methods, instructions or products referred to in the content. |
© 2024 by the authors. Licensee MDPI, Basel, Switzerland. This article is an open access article distributed under the terms and conditions of the Creative Commons Attribution (CC BY) license (https://creativecommons.org/licenses/by/4.0/).