
Influence of Early-Season Drought on the Peak of Growing Season in China Varies by Drought Timing and Biomes

Abstract
1. Introduction
2. Data and Methods
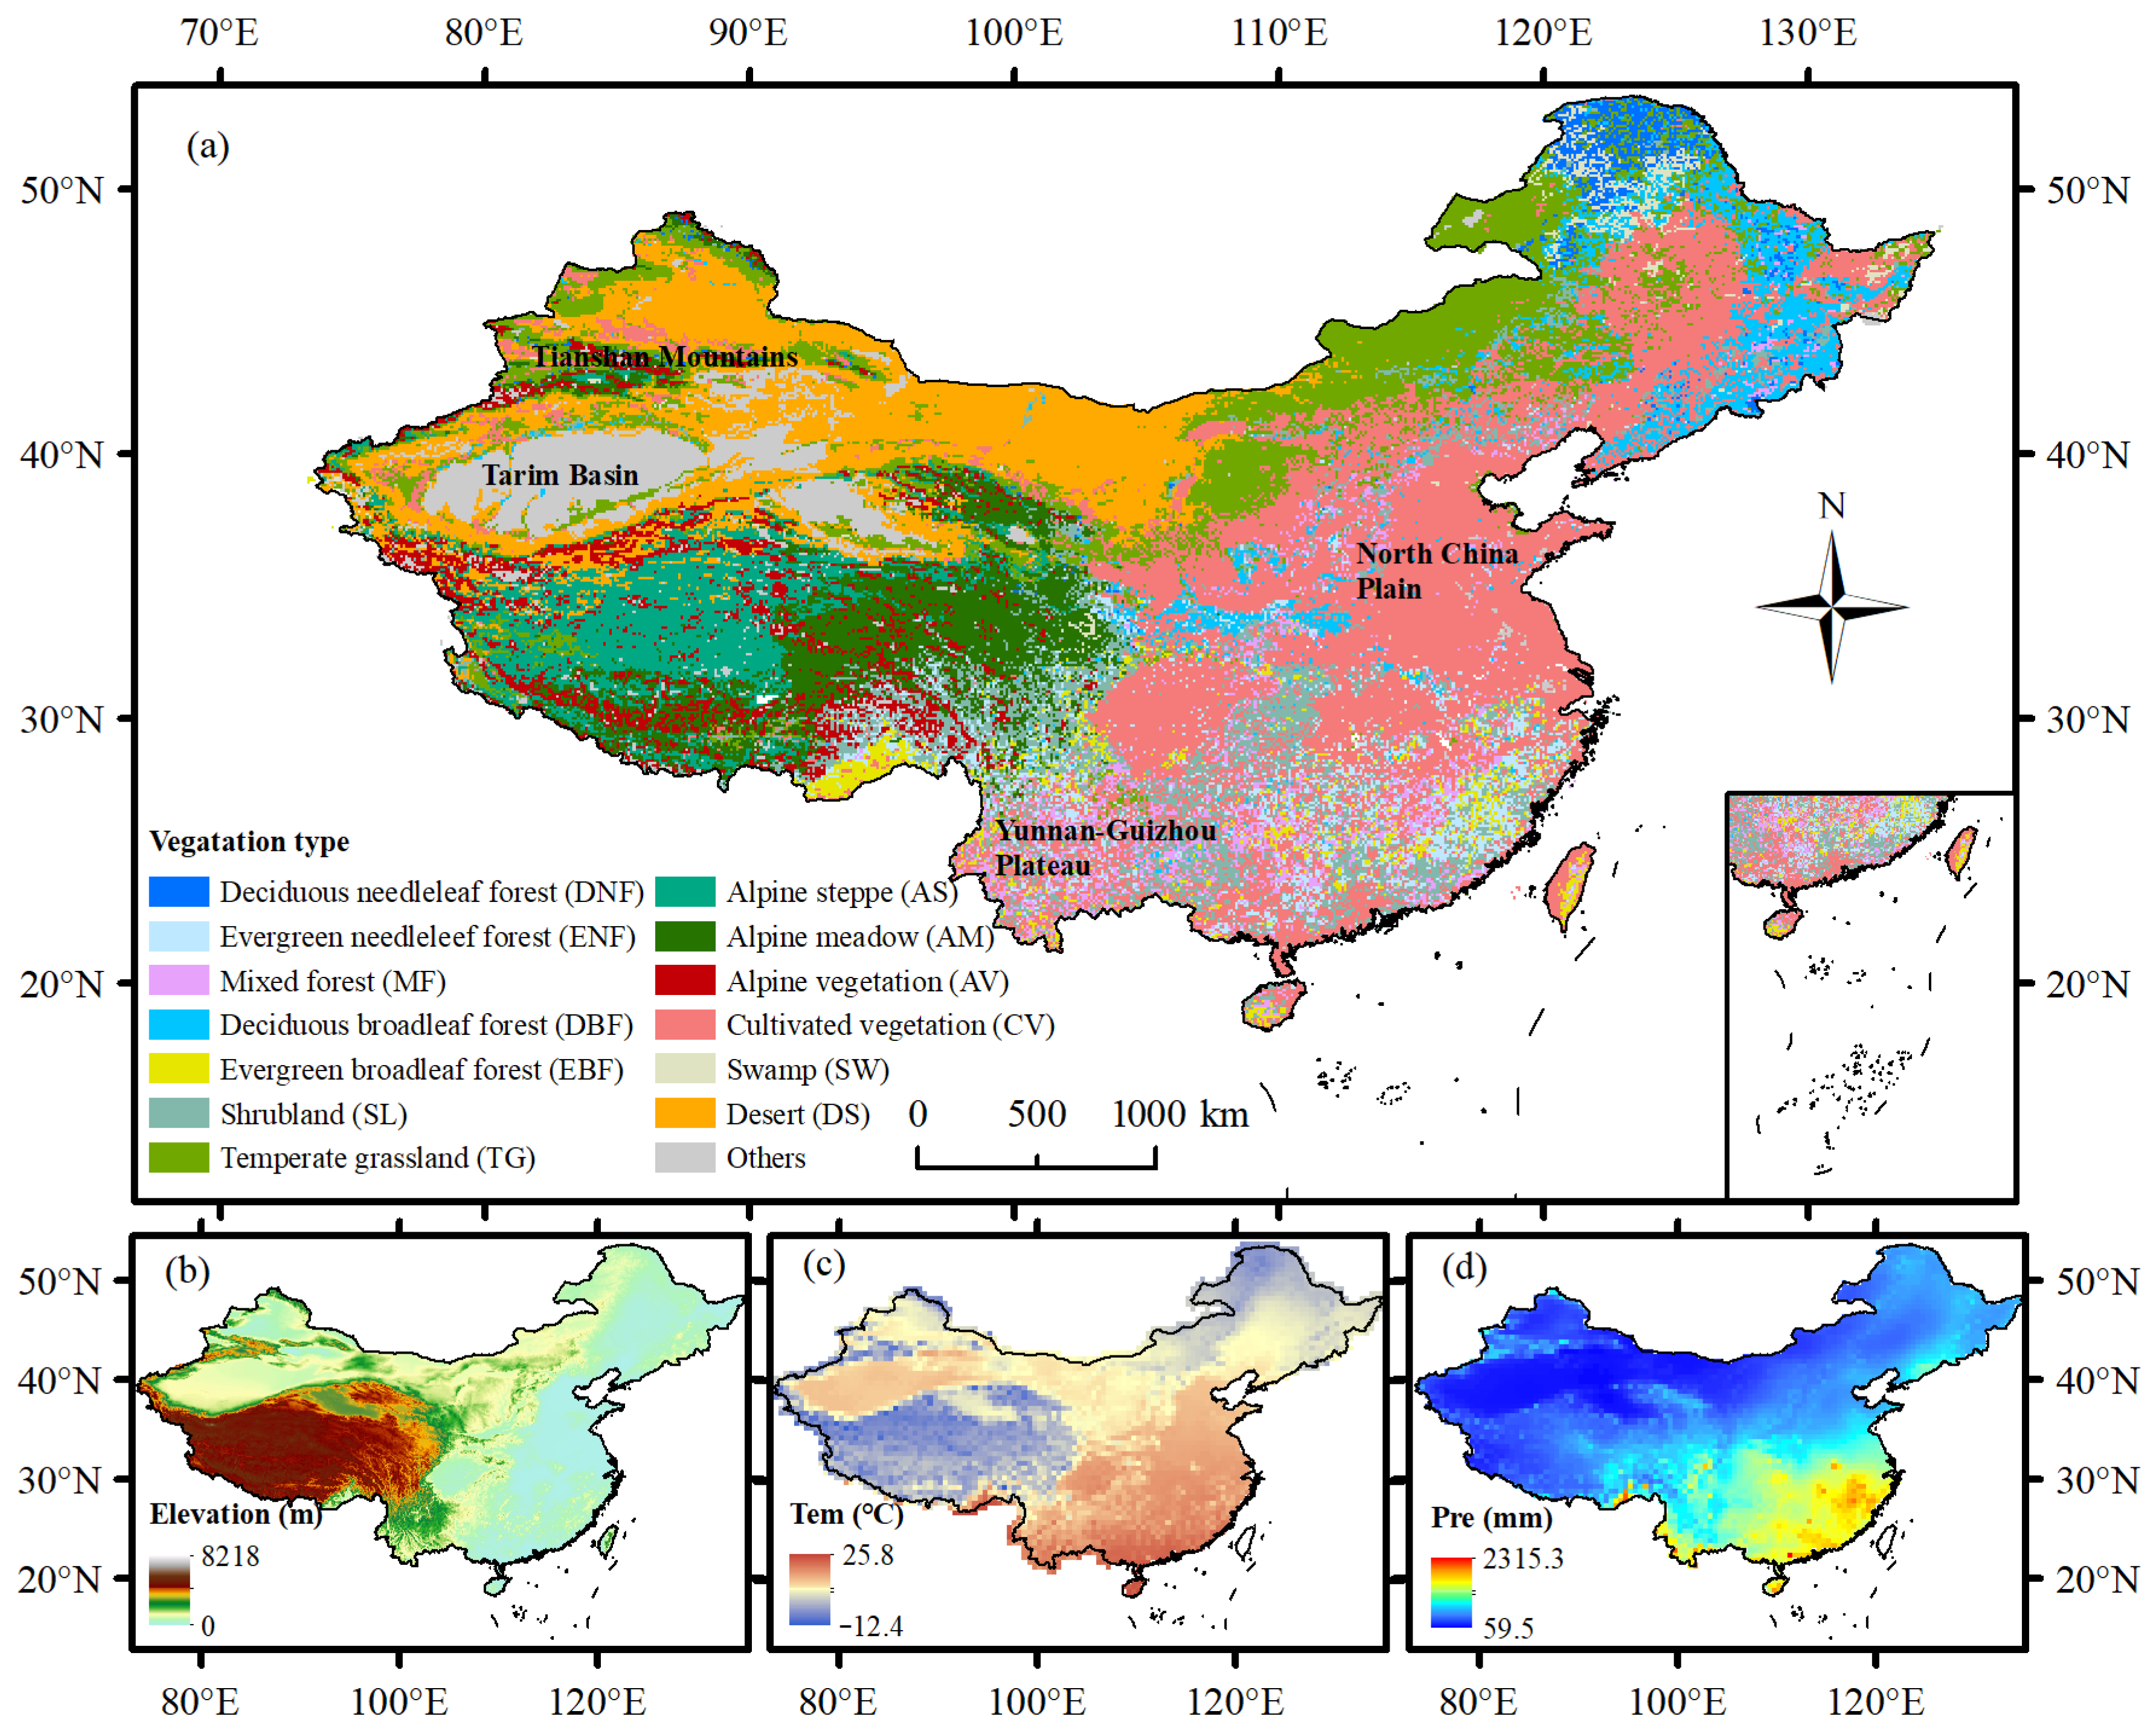
2.1. Study Area
2.2. Data Sources
2.2.1. Normalized Difference Vegetation Index Data
2.2.2. Meteorological Data
2.2.3. Drought Data
2.3. Methods
2.3.1. Extraction of POG
2.3.2. Trends and Correlation Analysis
3. Results
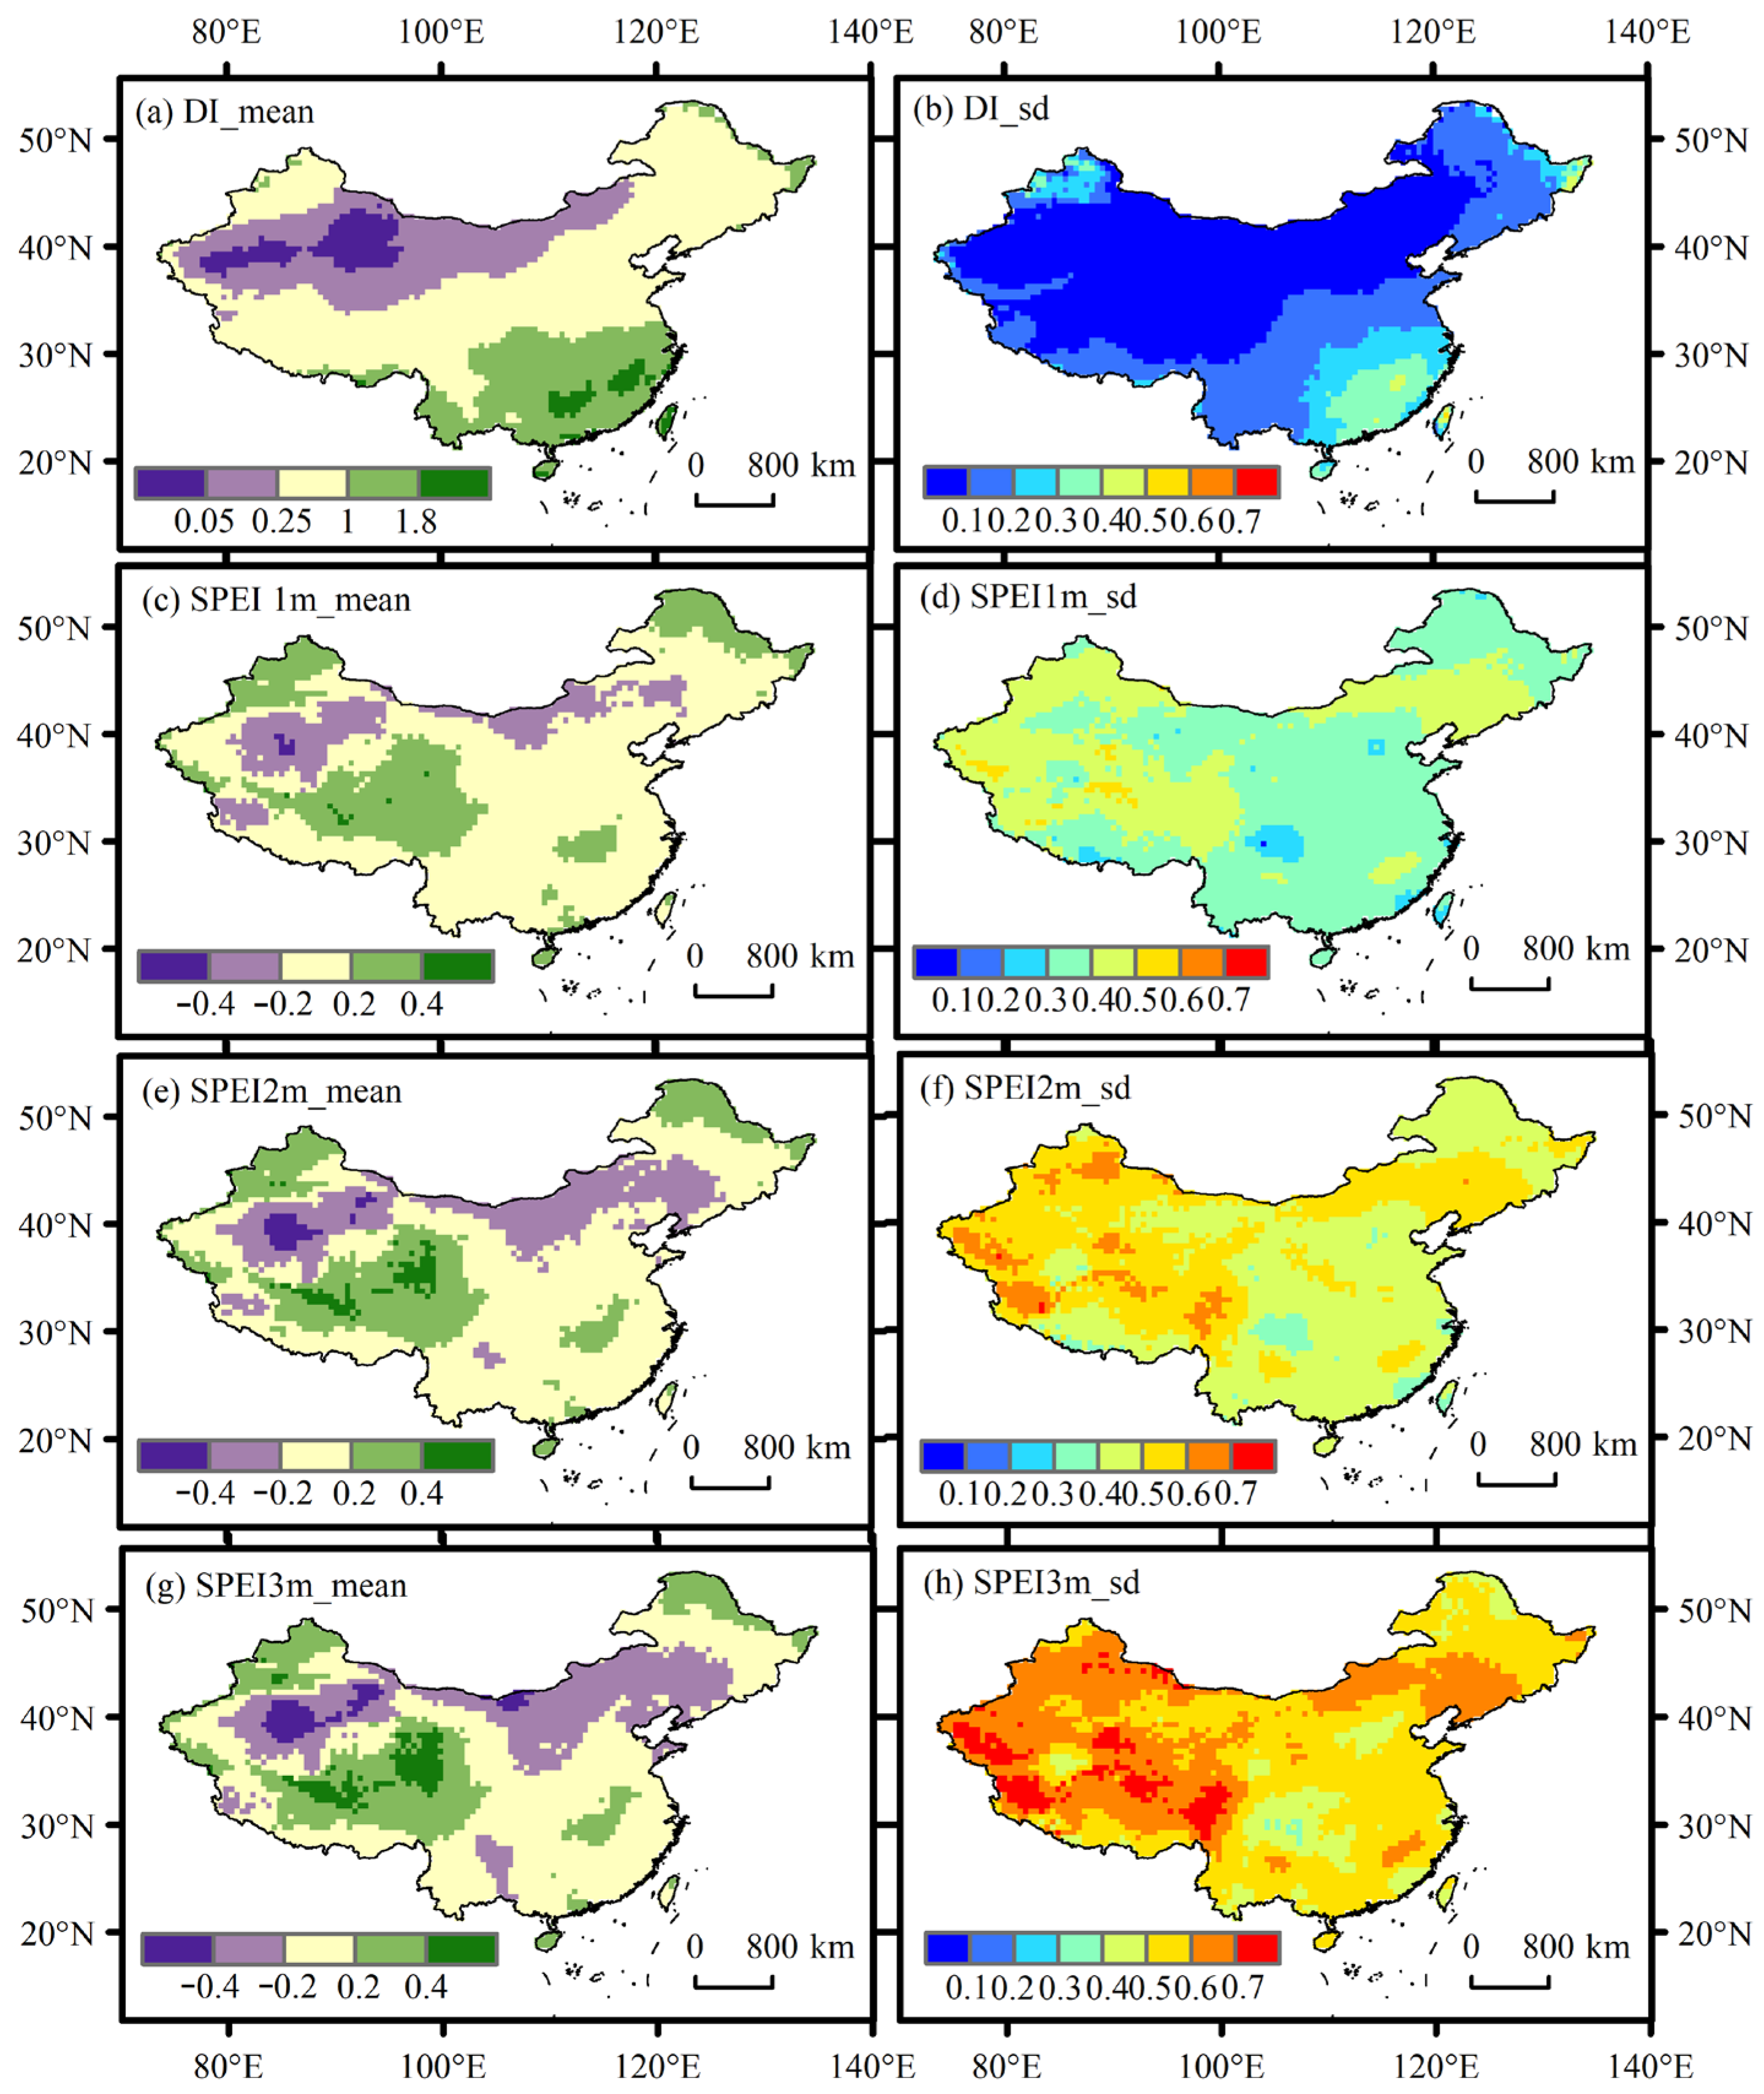
3.1. Temporal and Spatial Pattern of Drought Conditions
3.2. Temporal and Spatial Patterns of POG
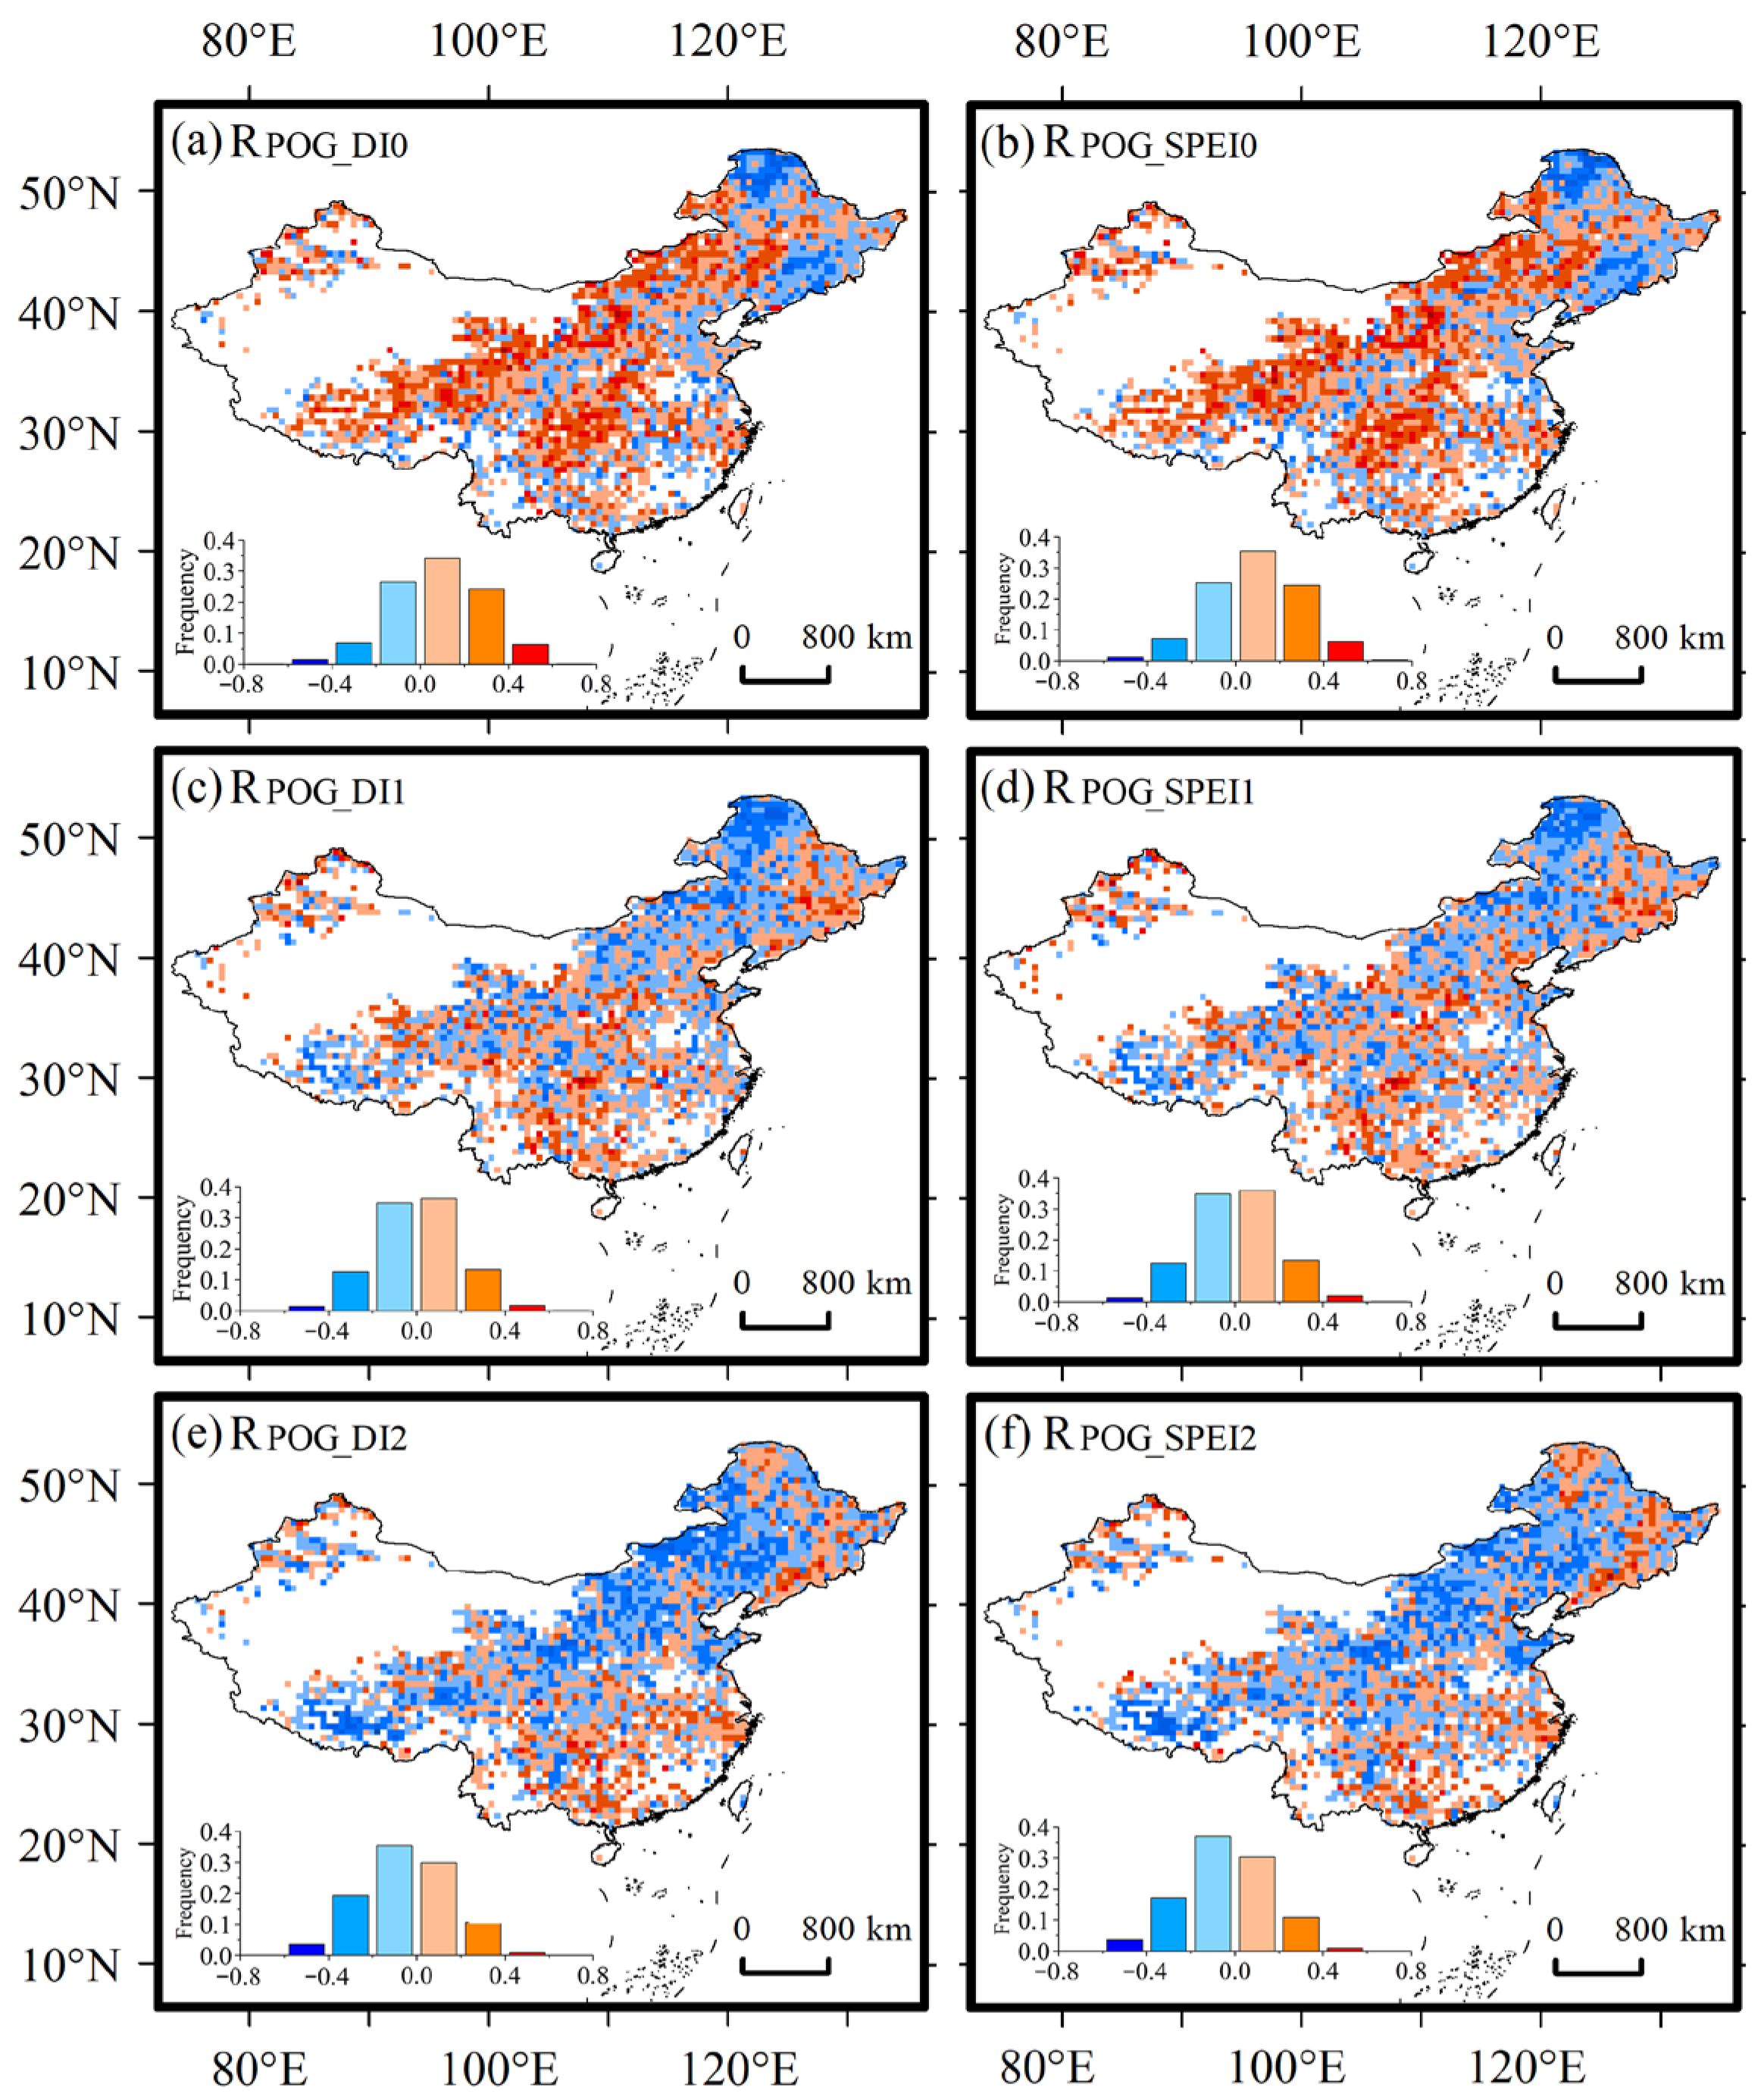
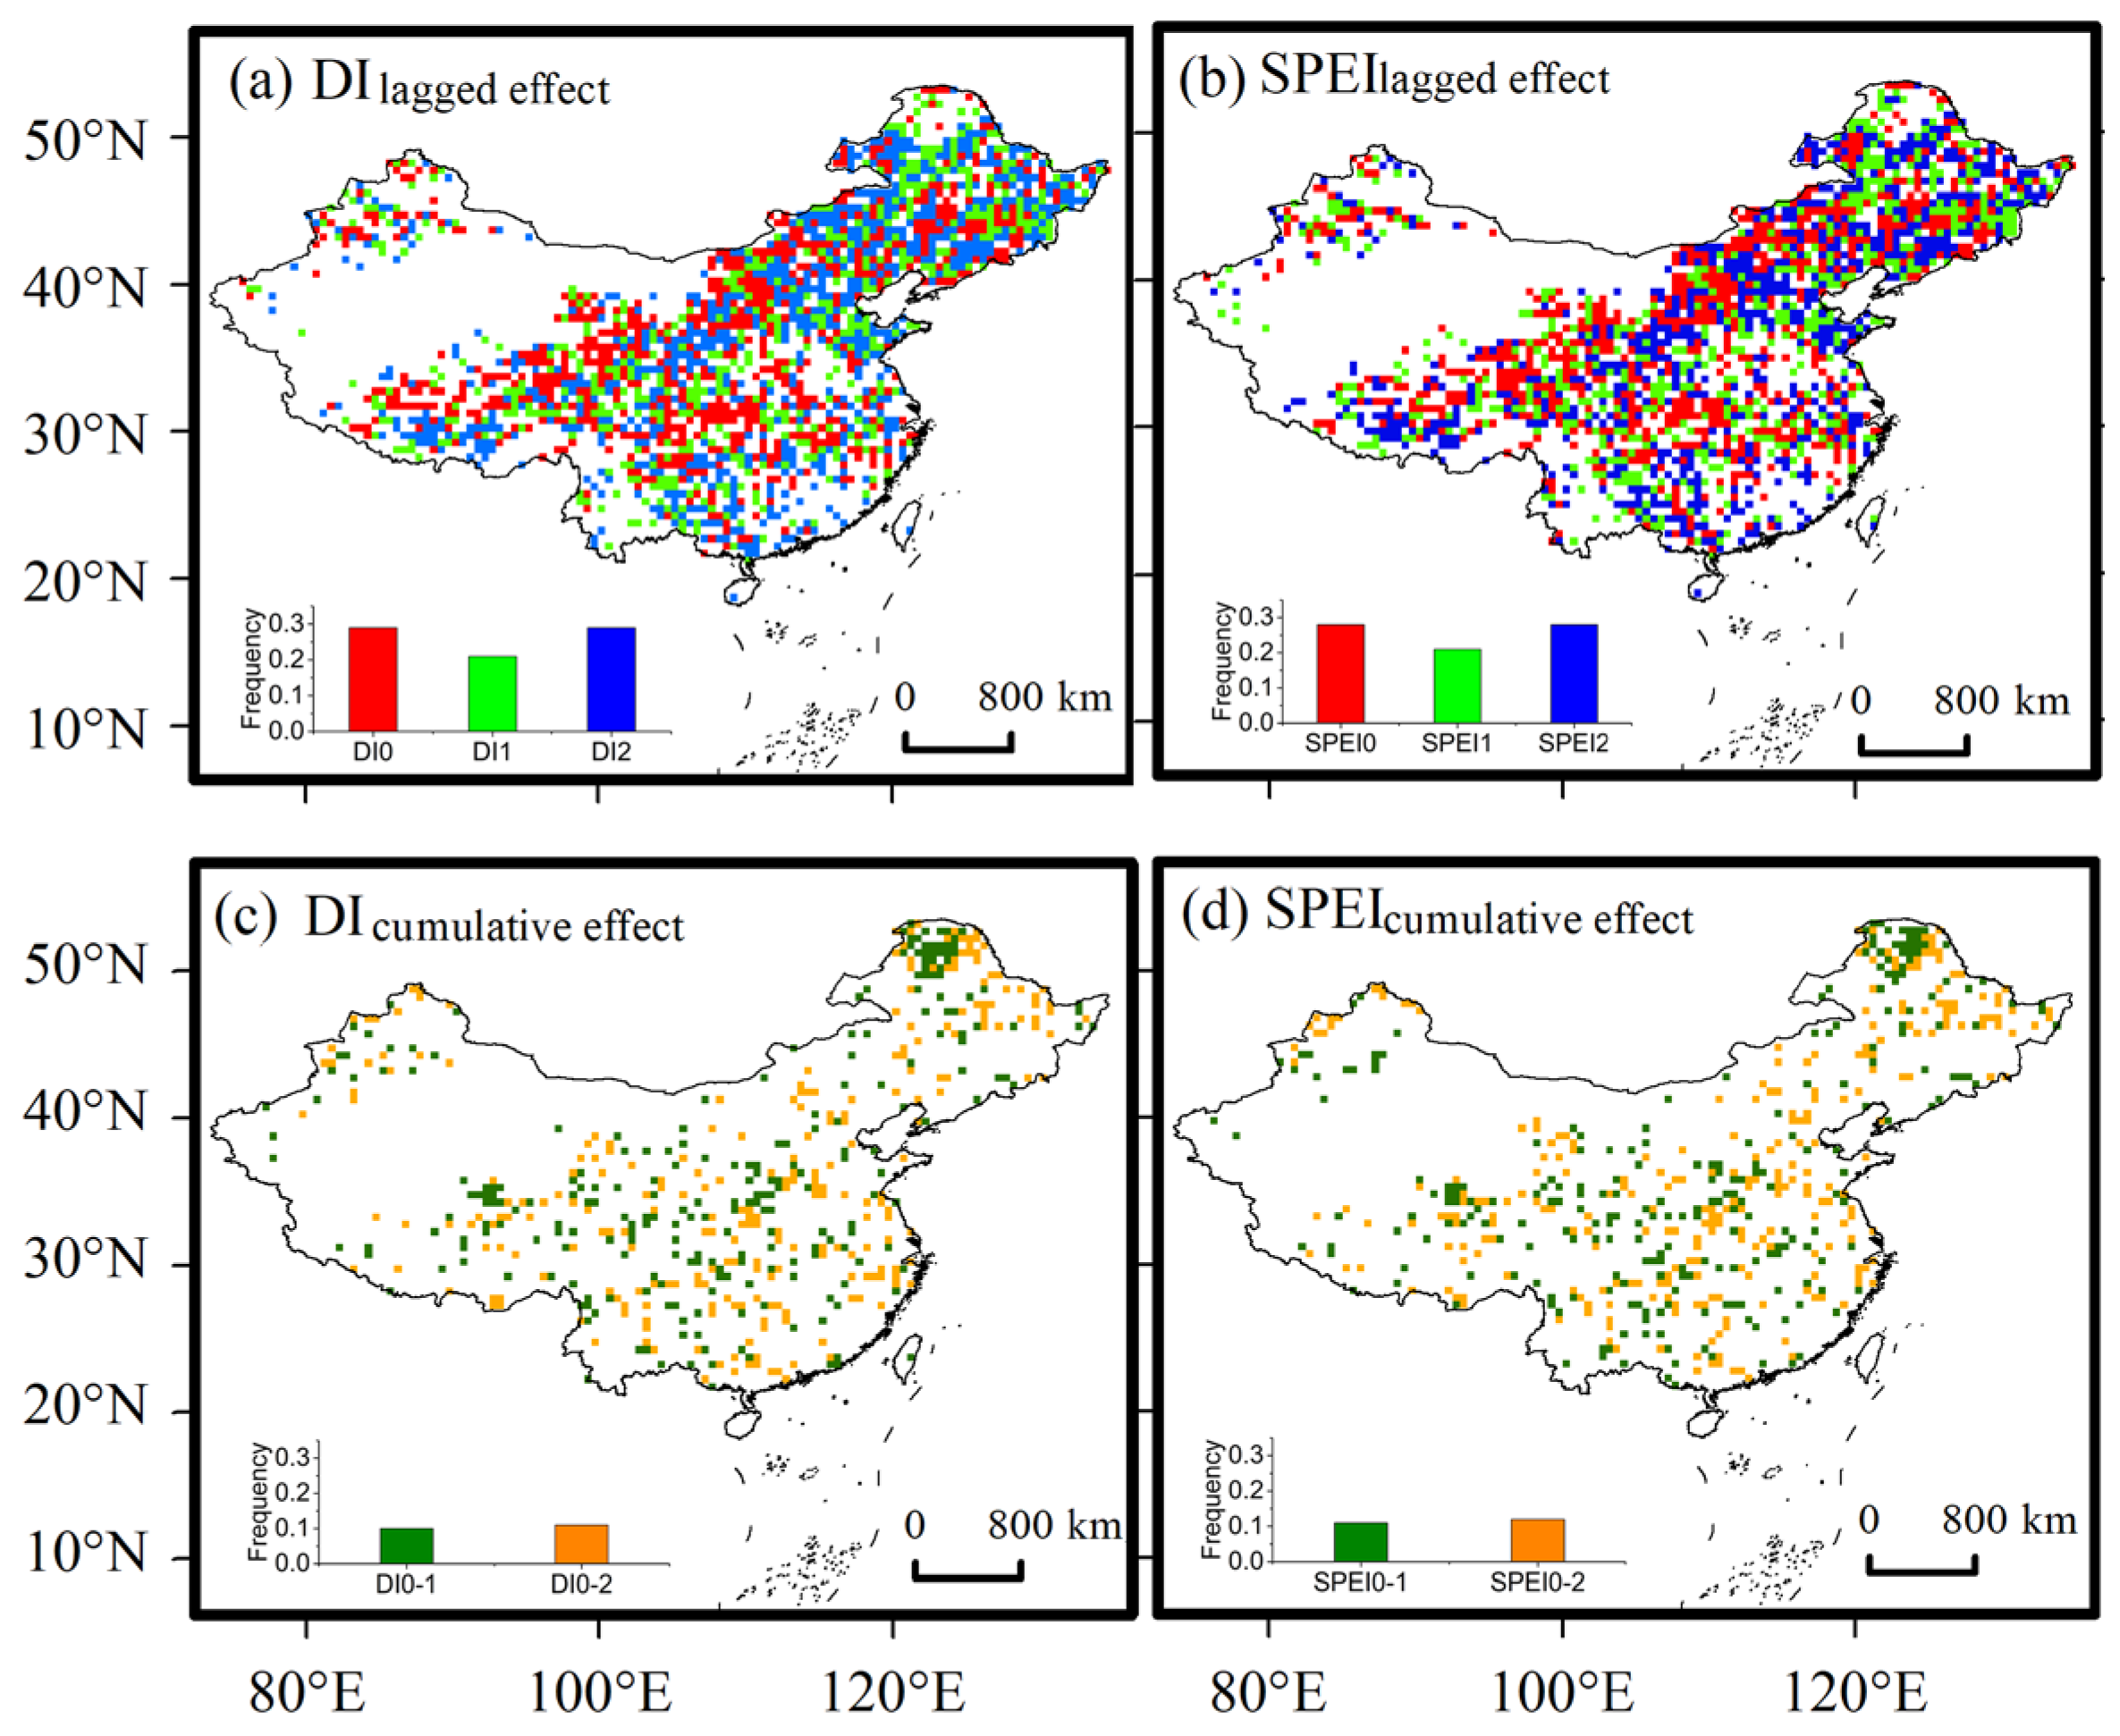
3.3. Influence of Drought on POG
4. Discussion
4.1. Patterns of Drought and the Drivers
4.2. Response of POG to Drought in Different Periods
4.3. Response of POG to Drought in Different Biomes
4.4. Response of POG to Drought along the Moisture Gradient
4.5. Response of POG to Drought with Changes in Elevation
4.6. Uncertainties
5. Conclusions
Supplementary Materials
Author Contributions
Funding
Data Availability Statement
Conflicts of Interest
References
- Primack, R.B.; Laube, J.; Gallinat, A.S.; Menzel, A. From observations to experiments in phenology re-search, investigating climate change impacts on trees and shrubs using dormant twigs. Ann. Bot. 2015, 116, 889–897. [Google Scholar] [CrossRef] [PubMed]
- Richardson, A.D.; Keenan, T.F.; Migliavacca, M.; Ryu, Y.; Sonnentag, O.; Toomey, M. Climate change, phenology, and phenological control of vegetation feedbacks to the climate system. Agric. For. Meteorol. 2013, 169, 156–173. [Google Scholar] [CrossRef]
- Sun, Q.; Li, B.; Zhou, G.; Jiang, Y.; Yuan, Y. Delayed autumn leaf senescence date prolongs the growing season length of herbaceous plants on the Qinghai-Tibetan Plateau. Agric. For. Meteorol. 2020, 284, 107896. [Google Scholar] [CrossRef]
- Visser, M.E. Phenology, Interactions of climate change and species. Nature 2016, 535, 236–237. [Google Scholar] [CrossRef] [PubMed]
- Keenan, T.F.; Gray, J.; Friedl, M.A.; Toomey, M.; Bohrer, G.; Hollinger, D.Y.; Munger, J.W.; O’Keefe, J.; Schmid, H.P.; Wing, I.S.; et al. Net carbon uptake has increased through warming-induced changes in temperate forest phenology. Nat. Clim. Chang. 2014, 4, 598–604. [Google Scholar] [CrossRef]
- Lian, X.; Piao, S.; Li, L.Z.X.; Li, Y.; Huntingford, C.; Ciais, P.; Cescatti, A.; Janssens, I.A.; Peñuelas, J.; Buermann, W.; et al. Summer soil drying exacerbated by earlier spring greening of northern vegetation. Sci. Adv. 2020, 6, eaax0255. [Google Scholar] [CrossRef]
- Meng, F.; Zhang, L.; Zhang, Z.; Jiang, L.; Wang, Y.; Duan, J.; Wang, Q.; Li, B.; Liu, P.; Hong, H.; et al. Enhanced spring temperature sensitivity of carbon emission links to earlier phenology. Sci. Total Environ. 2020, 745, 140999. [Google Scholar] [CrossRef] [PubMed]
- Murthy, K.; Bagchi, S. Spatial patterns of long-term vegetation greening and browning are con-sistent across multiple scales, Implications for monitoring land degradation. Land Degrad. Dev. 2018, 29, 2485–2495. [Google Scholar] [CrossRef]
- Buermann, W.; Forkel, M.; O’Sullivan, M.; Sitch, S.; Friedlingstein, P.; Haverd, V.; Jain, A.K.; Kato, E.; Kautz, M.; Lienert, S.; et al. Widespread seasonal compensation effects of spring warming on northern plant productivity. Nature 2018, 562, 110–114. [Google Scholar] [CrossRef] [PubMed]
- Peng, D.; Wang, Y.; Xian, G.; Huete, A.R.; Huang, W.; Shen, M.; Wang, F.; Yu, L.; Liu, L.; Xie, Q.; et al. Investigation of land surface phenology detections in shrub-lands using multiple scale satellite data. Remote Sens. Environ. 2020, 252, 112133. [Google Scholar] [CrossRef]
- Wu, C.; Hou, X.; Peng, D.; Gonsamo, A.; Xu, S. Land surface phenology of China’s temperate ecosystems over 1999–2013, Spatial-temporal patterns, interaction effects, covariation with climate and implications for productivity. Agric. For. Meteorol. 2016, 216, 177–187. [Google Scholar] [CrossRef]
- Yun, J.; Jeong, S.-J.; Ho, C.-H.; Park, C.-E.; Park, H.; Kim, J. Influence of winter precipitation on spring phenology in boreal forests. Glob. Chang. Biol. 2018, 24, 5176–5187. [Google Scholar] [CrossRef] [PubMed]
- Ge, Z.; Huang, J.; Wang, X.; Zhao, Y.; Tang, X.; Zhou, Y.; Lai, P.; Hao, B.; Ma, M. Using remote sensing to identify the peak of the growing sea-son at globally-distributed flux sites, A comparison of models, sensors, and biomes. Agric. For. Meteorol. 2021, 307, 108489. [Google Scholar] [CrossRef]
- Gonsamo, A.; Chen, J.M.; Ooi, Y.W. Peak season plant activity shift towards spring is reflected by increasing carbon uptake by extratropical ecosystems. Glob. Chang. Biol. 2018, 24, 2117–2128. [Google Scholar] [CrossRef] [PubMed]
- Hilton, T.W.; Whelan, M.E.; Zumkehr, A.; Kulkarni, S.; Berry, J.A.; Baker, I.T.; Montzka, S.A.; Sweeney, C.; Miller, B.R.; Elliott Campbell, J. Peak growing season gross uptake of carbon in North America is largest in the Midwest USA. Nat. Clim. Chang. 2017, 7, 450–454. [Google Scholar] [CrossRef]
- Park, T.; Ganguly, S.; Tømmervik, H.; Euskirchen, E.S.; Høgda, K.-A.; Karlsen, S.R.; Brovkin, V.; Nemani, R.R.; Myneni, R.B. Changes in growing season duration and productivity of northern vegetation inferred from long-term remote sensing data. Environ. Res. Lett. 2016, 11, 084001. [Google Scholar] [CrossRef]
- Yang, F.; Liu, C.; Chen, Q.; Lai, J.; Liu, T. Earlier spring-summer phenology and higher photosynthetic peak altered the seasonal patterns of vegetation productivity in alpine ecosystems. Remote Sens. 2024, 16, 1580. [Google Scholar] [CrossRef]
- Yang, J.; Dong, J.; Xiao, X.; Dai, J.; Wu, C.; Xia, J.; Zhao, G.; Zhao, M.; Li, Z.; Zhang, Y.; et al. Divergent shifts in peak photosynthesis timing of temper-ate and alpine grasslands in China. Remote Sens. Environ. 2019, 233, 111395. [Google Scholar] [CrossRef]
- Wang, X.Y.; Wu, C.Y. Estimating the peak of growing season (POS) of China’s terrestrial eco-systems. Agric. For. Meteorol. 2019, 278, 107639. [Google Scholar] [CrossRef]
- Zeng, Z.; Piao, S.; Li, L.Z.X.; Zhou, L.; Ciais, P.; Wang, T.; Li, Y.; Lian, X.; Wood, E.F.; Friedlingstein, P.; et al. Climate mitigation from vegetation biophysical feedbacks during the past three decades. Nat. Clim. Chang. 2017, 7, 432–436. [Google Scholar] [CrossRef]
- Xu, C.; Liu, H.; Williams, A.P.; Yin, Y.; Wu, X. Trends toward an earlier peak of the growing season in Northern Hemisphere mid-latitudes. Glob. Chang. Biol. 2016, 22, 2852–2860. [Google Scholar] [CrossRef] [PubMed]
- Cleland, E.E.; Chuine, I.; Menzel, A.; Mooney, H.A.; Schwartz, M.D. Shifting plant phenology in response to global change. Trends Ecol. Evol. 2007, 22, 357–365. [Google Scholar] [CrossRef] [PubMed]
- Fu, Y.H.; Zhao, H.; Piao, S.; Peaucelle, M.; Peng, S.; Zhou, G.; Ciais, P.; Huang, M.; Menzel, A.; Peñuelas, J.; et al. Declining global warming effects on the phenology of spring leaf unfolding. Nature 2015, 526, 104–107. [Google Scholar] [CrossRef] [PubMed]
- Maseyk, K.S.; Lin, T.; Rotenberg, E.; Grünzweig, J.M.; Schwartz, A.; Yakir, D. Physiology-phenology interactions in a productive semi-arid pine forest. New Phytol. 2008, 178, 603–616. [Google Scholar] [CrossRef] [PubMed]
- Schimel, D.S. Drylands in the Earth System. Science 2010, 327, 418–419. [Google Scholar] [CrossRef] [PubMed]
- Esch, E.H.; Lipson, D.A.; Cleland, E.E. Invasion and drought alter phenological sensitivity and synergistically lower ecosystem production. Ecology 2019, 100, e02802. [Google Scholar] [CrossRef] [PubMed]
- Allen, C.D.; Breshears, D.D.; McDowell, N.G. On underestimation of global vulnerability to tree mortality and forest die-off from hotter drought in the Anthropocene. Ecosphere 2015, 6, 1–55. [Google Scholar] [CrossRef]
- Dai, A. Increasing drought under global warming in observations and models. Nat. Clim. Chang. 2013, 3, 52–58. [Google Scholar] [CrossRef]
- Deng, H.; Yin, Y.; Wu, S.; Xu, X. Contrasting drought impacts on the start of phenological growing season in Northern China during 1982–2015. Int. J. Climatol. 2020, 40, 3330–3347. [Google Scholar] [CrossRef]
- Li, B.; Su, H.; Chen, F.; Wu, J.; Qi, J. The changing characteristics of drought in China from 1982 to 2005. Nat. Hazards 2013, 68, 723–743. [Google Scholar] [CrossRef]
- Sheffield, J.; Wood, E.F.; Roderick, M.L. Little change in global drought over the past 60 years. Nature 2012, 491, 435–438. [Google Scholar] [CrossRef] [PubMed]
- Zeng, Z.; Wu, W.; Li, Y.; Zhou, Y.; Zhang, Z.; Zhang, S.; Guo, Y.; Huang, H.; Li, Z. Spatiotemporal Variations in Drought and Wetness from 1965 to 2017 in China. Water 2020, 12, 2097. [Google Scholar] [CrossRef]
- Groisman, P.; Bulygina, O.; Henebry, G.; Speranskaya, N.; Shiklomanov, A.; Chen, Y.; Tchebakova, N.; Parfenova, E.; Tilinina, N.; Zolina, O.; et al. Dryland belt of Northern Eurasia, contemporary environmental changes and their consequences. Environ. Res. Lett. 2018, 13, 115008. [Google Scholar] [CrossRef]
- Pinzon, J.E.; Tucker, C.J. A Non-Stationary 1981–2012 AVHRR NDVI3g Time Series. Remote Sens. 2014, 6, 6929–6960. [Google Scholar] [CrossRef]
- Tao, Z.; Wang, H.; Liu, Y.; Xu, Y.; Dai, J. Phenological response of different vegetation types to temperature and precipitation variations in northern China during 1982–2012. Int. J. Remote Sens. 2017, 38, 3236–3252. [Google Scholar] [CrossRef]
- Yang, K.; He, J. China meteorological forcing dataset (1979–2015). In A Big Earth Data Platform for Three Poles; National Tibetan Plateau Data Center: Beijing, China, 2016; Available online: https://poles.tpdc.ac.cn/zh-hans/data/7a35329c-c53f-4267-aa07-e0037d913a21/ (accessed on 7 May 2024). [CrossRef]
- Cong, N.; Shen, M.; Piao, S.; Chen, X.; An, S.; Yang, W.; Fu, Y.H.; Meng, F.; Wang, T. Little change in heat requirement for vegetation green-up on the Tibetan Plateau over the warming period of 1998–2012. Agric. For. Meteorol. 2017, 232, 650–658. [Google Scholar] [CrossRef]
- Vicente-Serrano, S.M.; Beguería, S.; López-Moreno, J.I. A Multiscalar Drought Index Sensitive to Global Warming, The Standardized Precipitation Evapotranspiration Index. J. Clim. 2010, 23, 1696–1718. [Google Scholar] [CrossRef]
- Jiang, D.; Hao, M.; Fu, J.; Zhuang, D.; Huang, Y. Spatial-temporal variation of marginal land suitable for energy plants from 1990 to 2010 in China. Sci. Rep. 2014, 4, 5816. [Google Scholar] [CrossRef] [PubMed]
- Ohlson, J.A.; Kim, S. Linear valuation without OLS, the Theil-Sen estimation approach. Rev. Account. Stud. 2015, 20, 395–435. [Google Scholar] [CrossRef]
- Peng, J.; Wu, C.; Zhang, X.; Wang, X.; Gonsamo, A. Satellite detection of cumulative and lagged effects of drought on autumn leaf senescence over the Northern Hemisphere. Glob. Chang. Biol. 2019, 25, 2174–2188. [Google Scholar] [CrossRef] [PubMed]
- Jiao, W.; Wang, L.; Smith, W.K.; Chang, Q.; Wang, H.; D’Odorico, P. Observed increasing water constraint on vegetation growth over the last three decades. Nat. Commun. 2021, 12, 3777. [Google Scholar] [CrossRef]
- Sun, S.; Chen, H.; Ju, W.; Wang, G.; Sun, G.; Huang, J.; Ma, H.; Gao, C.; Hua, W.; Yan, G. On the coupling between precipitation and potential evapo-transpiration, contributions to decadal drought anomalies in the Southwest China. Clim. Dyn. 2017, 48, 3779–3797. [Google Scholar] [CrossRef]
- Wu, C.; Wang, J.; Ciais, P.; Peñuelas, J.; Zhang, X.; Sonnentag, O.; Tian, F.; Wang, X.; Wang, H.; Liu, R.; et al. Widespread decline in winds delayed autumn foliar senescence over high latitudes. Proc. Natl. Acad. Sci. USA 2021, 118, e2015821118. [Google Scholar] [CrossRef] [PubMed]
- Liu, Q.; Fu, Y.H.; Zeng, Z.; Huang, M.; Li, X.; Piao, S. Temperature, precipitation, and insolation effects on autumn vegetation phenology in temperate China. Glob. Chang. Biol. 2016, 22, 644–655. [Google Scholar] [CrossRef] [PubMed]
- Tao, Z.; Huang, W.; Wang, H. Soil moisture outweighs temperature for triggering the green-up date in temperate grasslands. Theor. Appl. Climatol. 2020, 140, 1093–1105. [Google Scholar] [CrossRef]
- Arend, M.; Brem, A.; Kuster, T.M.; Günthardt-Goerg, M.S. Seasonal photosynthetic responses of European oaks to drought and elevated daytime temperature. Plant Biol. 2013, 15, 169–176. [Google Scholar] [CrossRef] [PubMed]
- Montserrat-Martí, G.; Camarero, J.J.; Palacio, S.; Pérez-Rontomé, C.; Milla, R.; Albuixech, J.; Maestro, M. Summer-drought constrains the phenology and growth of two coexisting Mediterranean oaks with contrasting leaf habit, implications for their persistence and reproduction. Trees 2009, 23, 787–799. [Google Scholar] [CrossRef]
- Hufkens, K.; Keenan, T.F.; Flanagan, L.B.; Scott, R.L.; Bernacchi, C.J.; Joo, E.; Brunsell, N.A.; Verfaillie, J.; Richardson, A.D. Productivity of North American grasslands is increased under future climate scenarios de-spite rising aridity. Nat. Clim. Chang. 2016, 6, 710–714. [Google Scholar] [CrossRef]
- Liu, D.; Li, Y.; Wang, T.; Peylin, P.; MacBean, N.; Ciais, P.; Jia, G.; Ma, M.; Ma, Y.; Shen, M.; et al. Contrasting responses of grassland water and carbon exchanges to climate change between Tibetan Plateau and Inner Mongolia. Agric. For. Meteorol. 2018, 249, 163–175. [Google Scholar] [CrossRef]
- Liu, Y.; Wu, C.; Wang, X.; Jassal, R.S.; Gonsamo, A. Impacts of global change on peak vegeta-tion growth and its timing in terrestrial ecosystems of the continental US. Glob. Planet. Chang. 2021, 207, 103657. [Google Scholar] [CrossRef]
- Li, G.; Wu, C.; Chen, Y.; Huang, C.; Zhao, Y.; Wang, Y.; Ma, M.; Ding, Z.; Yu, P.; Tang, X. Increasing temperature regu-lates the advance of peak photosynthesis timing in the boreal ecosystem. Sci. Total Environ. 2023, 882, 163587. [Google Scholar] [CrossRef] [PubMed]
- Huang, Z.; Zhou, L.; Chi, Y. Spring phenology rather than climate dominates the trends in peak of growing season in the Northern Hemisphere. Glob. Chang. Biol. 2023, 29, 4543–4555. [Google Scholar] [CrossRef] [PubMed]
- Bai, Y.; Li, S. Growth peak of vegetation and its response to drought on the Mongolian Plateau. Ecol. Indic. 2022, 141, 109150. [Google Scholar] [CrossRef]
- Zeng, X.; Hu, Z.; Chen, A.; Yuan, W.; Hou, G.; Han, D.; Liang, M.; Di, K.; Cao, R.; Luo, D. The global decline in the sen-sitivity of vegetation productivity to precipitation from 2001 to 2018. Glob. Chang. Biol. 2022, 28, 6823–6833. [Google Scholar] [CrossRef] [PubMed]
- Bradley, A.V.; Gerard, F.F.; Barbier, N.; Weedon, G.P.; Anderson, L.O.; Huntingford, C.; AragÃO, L.E.O.C.; Zelazowski, P.; Arai, E. Relationships between phenology, radiation and precip-itation in the Amazon region. Glob. Chang. Biol. 2011, 17, 2245–2260. [Google Scholar] [CrossRef]
- Wu, C.; Peng, J.; Ciais, P.; Peñuelas, J.; Wang, H.; Beguería, S.; Andrew Black, T.; Jassal, R.S.; Zhang, X.; Yuan, W.; et al. Increased drought effects on the phenology of autumn leaf senes-cence. Nat. Clim. Chang. 2022, 12, 943–949. [Google Scholar] [CrossRef]
- Gampe, D.; Zscheischler, J.; Reichstein, M.; O’Sullivan, M.; Smith, W.K.; Sitch, S.; Buermann, W. Increasing impact of warm droughts on northern ecosystem productivity over recent decades. Nat. Clim. Chang. 2021, 11, 772–779. [Google Scholar] [CrossRef]


Disclaimer/Publisher’s Note: The statements, opinions and data contained in all publications are solely those of the individual author(s) and contributor(s) and not of MDPI and/or the editor(s). MDPI and/or the editor(s) disclaim responsibility for any injury to people or property resulting from any ideas, methods, instructions or products referred to in the content. |
© 2024 by the authors. Licensee MDPI, Basel, Switzerland. This article is an open access article distributed under the terms and conditions of the Creative Commons Attribution (CC BY) license (https://creativecommons.org/licenses/by/4.0/).
Share and Cite
Tao, Z.; Dai, J.; Wang, X.; Wang, Y. Influence of Early-Season Drought on the Peak of Growing Season in China Varies by Drought Timing and Biomes. Forests 2024, 15, 1027. https://doi.org/10.3390/f15061027
Tao Z, Dai J, Wang X, Wang Y. Influence of Early-Season Drought on the Peak of Growing Season in China Varies by Drought Timing and Biomes. Forests. 2024; 15(6):1027. https://doi.org/10.3390/f15061027
Chicago/Turabian StyleTao, Zexing, Junhu Dai, Xiaoyue Wang, and Yuan Wang. 2024. "Influence of Early-Season Drought on the Peak of Growing Season in China Varies by Drought Timing and Biomes" Forests 15, no. 6: 1027. https://doi.org/10.3390/f15061027
APA StyleTao, Z., Dai, J., Wang, X., & Wang, Y. (2024). Influence of Early-Season Drought on the Peak of Growing Season in China Varies by Drought Timing and Biomes. Forests, 15(6), 1027. https://doi.org/10.3390/f15061027