Article

Siberian Pine and Larch Response to Warming-Drying Climate in the Southern Boundary of Their Range

by
Ilya A. Petrov
1,2,3,*,
Viacheslav I. Kharuk
1,2,3,
Alexey S. Golyukov
1,2,3,
Sergei T. Im
1,3,4,5,
Sergei O. Ondar
6 and
Alexander S. Shushpanov
1,3,5
1
Sukachev Institute of Forests, Federal Scientific Center, Russian Academy of Science, Siberian Branch, Academgorodok 50/28, Krasnoyarsk 660036, Russia
2
Institute of Space and Information Technologies, Siberian Federal University, Academika Kirenskogo Str. 26, Krasnoyarsk 660074, Russia
3
Laboratory of Biodiversity and Ecology, Tomsk State University, Lenina Str. 36, Tomsk 634050, Russia
4
Institute of Ecology and Geography, Siberian Federal University, Svobodny Str. 79, Krasnoyarsk 660041, Russia
5
Institute of Space Research and High Technologies, Reshetnev Siberian State University of Science and Technology, Krasnoyarsky Rabochy Str. 31, Krasnoyarsk 660014, Russia
6
Department of Biology and Ecology, Tuvan State University, Lenina Str. 36, Kyzyl 667000, Russia
*
Author to whom correspondence should be addressed.
Forests 2024, 15(6), 1054; https://doi.org/10.3390/f15061054
Submission received: 3 May 2024 / Revised: 5 June 2024 / Accepted: 15 June 2024 / Published: 18 June 2024

Abstract

:
Trees’ growth and areal responses to changing climate are primarily expected within the edges of the species range. Here, we compared the responses of Siberian pine (Pinus sibirica Du Tour), a moisture-sensitive species, and drought-resistant larch (Larix sibirica Ledeb.) at the southern part of their ranges in the Siberian Mountains (the Tannu-Ola Ridge). We study the species’ growth and proportion in the forests from forest-steppe to treeline ecotone along the elevation gradient. These studies are based on radial growth index (GI) analysis and GI dependence on the climate variables. We used satellite time series to detect the land cover changes (areas of larch and Siberian pine, as well as shrubs and birch). We compared trees’ GI before and after warming “restart” in the late 1990s. Generally, GI dependence on the air temperature was negative at elevations below c. 1600 m a.s.l., whereas GI dependence on the moisture variables (precipitation, vapor pressure deficit, and soil moisture) was positive for both species. Above 1600 m, increasing air temperatures stimulated species growth, whereas the influence of moisture variables was negative (for larch) or neutral (for Siberian pine). After the warming restart, the GI of both conifers increased in moisture-sufficient high elevations and treeline ecotone, whereas within low elevations (<1300 m), the GI was stagnant or suppressed. Both species’, especially Siberian pine, negative growth dependence on air temperature and positive dependence on the moisture variables strongly increased since the warming restart. We found a risen growth dependence of both species on the soil-stored water during the previous year (September–October), which smoothed moisture stress at the beginning of the growing season. Yet both species’ growth also suffered as a result of early spring warms. We found that larch is migrating in both uphill and downhill directions, while Siberian pine is migrating uphill only. Forests loss occurred at low elevations (<1300 m), whereas forest and shrub gain occurred at high (>2000 m) ones. The upper boundary of the forests and shrubs is migrating uphill at rates of about 0.8 and 0.3 m/y, respectively. We observed a decrease in Siberian pine proportion in the forests, whereas areas of larch and birch strongly increased (by 150% and 100%, respectively), which indicates the retreat of Siberian pine from its southern habitat. We suggested afforestation of the areas of Siberian pine mortality by the drought-tolerant larch species.

1. Introduction

Climate-driven changes in trees’ growth rate, vigor, mortality, and habitat changes were documented throughout the boreal biome [1,2,3,4]. The mortality of stands formed by conifers has been spreading over an area of several million ha in North America [5,6,7,8] and [9,10]. Wide-spread spruce (Picea abies L.) mortality occurred in Germany [11], Slovakia [12], and the southern part of European Russia [13]. The main causes of mortality in those areas are considered to be multi-year low precipitation and root-zone drying [2,14,15].
Alongside conifer, hardwood species also experienced negative consequences of warming. Thus, Betula sp. growth reduction and mortality were documented within the forest-steppe ecotone, potentially leading to the conversion of these areas into steppe in the future [16]. A large-scale productivity decline of aspen (Populus tremuloides Michx.) has recently been documented throughout the United States and Canada as a result of drought and insect outbreaks [17]. In Central Europe, beech (Fagus sylvatica L.) has strongly suffered from the exceptional 2018 drought and subsequent dry years [18,19].
The influence of increasing aridity is distinct for the different species. Thus, drought-resistant deciduous larch (Larix spp.) increased its range by infilling and shifting its distributions northward, although larch recession and thinning were more common in southern regions [20,21,22]. On the contrary, precipitation-sensitive “dark needle conifers” (i.e., Siberian pine, fir, and spruce) experienced a decrease in the growth rate and increased mortality in the southern low-elevations. However, those species are migrating uphill and to the northern habitat of larch [23]. An increased rate of tree mortality has been observed since the end of 1990s, and it has coincided with a warming increase (or “restart”) and consequent drought events increase in the 21st century. That restart of air temperature has been documented at the local as well as on the global scales (i.e., https://www.ncei.noaa.gov/access/monitoring/climate-at-a-glance/global/time-series/nhem/land/5/9/1950-2024, accessed on 15 September 2023). Meanwhile, in moisture-sufficient habitats (e.g., northern wetlands and alpine ecotone), the warming restart led to a strong increase in trees’ growth as well as vegetation primary productivity (both GPP and NPP) [21]. The warming climate also stimulated the expanding of trees’ range into high-elevation mountains and northward [20,24,25]. Alongside with warming climate, CO2 fertilization also positively influenced trees’ growth [26].
Trees’ response to warming is also mediated by relief features. Thus, increased mortality of Siberian pine is mostly observed on steep sunlit southern slopes and in shallow soils with a low water capacity [23]. Moreover, even the drought-resistant larch has experienced water stress on southern slopes [20,22,23].
Trees with distinct ecological niches should respond to warming differently. The comparative analysis of such species is essential for predicting climate-driven consequences of climate change on the species’ growth, health, and ranges. We suggest that those consequences will be primarily manifested within (1) overlapping parts of species’ ranges and (2) within the edges of species’ ranges. In this paper, we consider the comparative influence of warming on the growth rate of two main taiga species, namely larch (Larix sibirica Ledeb.), a deciduous drought-resistant conifer, and the moisture-sensitive evergreen Siberian pine (Pinus sibirica Du Tour).
Among Siberian trees, larch species are the leaders in cold and drought resistance. A deciduous pattern and high water-use efficiency allow that species to grow in semi-desert conditions (up to 250 mm/year) [27]. Due to its resistance to harsh environments, larch is the dominant species within the Siberian permafrost zone, and it formed northern and alpine treelines. Since the warming onset (the 1970s), larch growth has increased, and densification of larch forests has been reported [24,28]. In the most parts of the larch habitat, including high elevations, air and soil temperatures are namely limiting larch growth. Consequently, the current warming has stimulated larch growth [21]. Meanwhile, the warming-driven increase in aridity has facilitated seasonal water stress at the beginning of the growing season [21]. In addition, the warming-driven burning rate has led to the transformation of sparse southern larch forests into forest-steppe and steppe communities [22].
Unlike larch, Siberian pine is intolerant to low air humidity. This highly moisture-sensitive species primarily occupies areas with precipitation up to 1000+ mm/year, although it can successfully grow at lower precipitation levels (about 500 mm/year). Compared to larch, Siberian pine is a less cold-resistant species, and it can be found beyond the Arctic Circle and often forms (together with larch but behind larch) treelines in the mountains. Siberian pine rarely forms pure stands. Regularly, that species, together with fir (Abies sibirica Ledeb.) and spruce (Picea obovata Ledeb.), forms mixed “dark-needle coniferous” forests, which are the second (after larch forests) largest forest formation in Siberia. In the warming and drying climate, Siberian pine, as well as fir, has experienced increasing mortality in the low elevations since the 1990s. That phenomenon is caused mainly by the synergy of water stress (inciting factor) and pest attacks (contributing factor) [8,10,29,30]. Meanwhile, in the areas of sufficient precipitation, Siberian pine has shown increased growth and uphill migration [31].
Despite the contrasting ecological niches of Siberian pine and larch, both species can form mixed forests within the boundaries of their ranges, e.g., in the southern Siberian Mountains. Meanwhile, in the future, the spatial distribution of climate and growth rates of these species will experience significant changes. The first phases of those changes should be yet observable within the edges of both species’ ranges. Therefore, we selected a study area within the southern part of Altai-Sayan Mountain Country, i.e., the Tannu-Ola Ridge (Figure 1). The Siberian pine forests that occupied the northern slope of that ridge are within the southern edge of that pine range. Larch forests on the southern slope sharply turn into Mongolian steppes to the south. For our studies, we selected three contrasting elevation belts, i.e., the treeline ecotone, the mixewood forest formed by larch and Siberian pine, and the forest-steppe ecotone. We hypothesize that distinct changing climate influences on the larch and Siberian pine growth will be visible (1) along the elevation gradient and (2) within the different elevation belts. In addition, we analyzed the temporal dynamics of birch (Betula sp.), a minor component of the forests, and shrubs (which occurred mostly within and beyond the treeline ecotone).
We seek the answers to the following questions:
  • What are the Siberian pine and larch radial growth dynamics within the treeline, mixewood forest, and forest-steppe ecotone?
  • How do larch and Siberian pine growth depend on the air temperature, moisture variables (precipitation, VPD, soil moisture), and wind speed along the elevation gradient?
  • What are the differences between larch and Siberian pine’s responses to the changing climate?

2. Materials and Methods

2.1. Study Area

The study area is located on the northern megaslope of the Tannu-Ola Mountains. The Tannu-Ola Ridge is composed of several sub-ridges and spreads from west to east for about 300 km (Figure 1). The mountains’ mean elevations are about 2500–2700 m; the maximum elevation is 3061 m.
Elevations up to 2100 m are occupied by alpine tundra communities. The treeline ecotone (2000–2100 m) is formed by Siberian pine and larch together with bush communities (Betula spp., Salix spp.). Middle elevations (1300–2000 m) on the northern megaslope are covered by mixed Siberian pine and larch forests (so-called “black mountain belt”). The forest-steppe ecotone (1200–1300 m) is formed by larch with presence of Scots pine (Pinus sylvestris L.) and birch (Betula sp.). The southern megaslope is covered by larch forests. On the northern megaslope, the proportion of Siberian pine decreases at lower elevations and changes to larch forests with birch (Betula sp.) admixture, which also change to steppe communities at c. 1000 m. [32,33].
Within the study area of the Tannu-Ola northern slope, the mean air temperatures in January and July are −20 °C and +14 °C, respectively. The mean annual precipitation is about 650 mm, which occurs mostly during the summer (380 mm).

2.2. On-Ground Studies

Field data were obtained along the elevational transect (c. 1000–2100 m; the total length c. 17 km) on the northern megaslope of the Tannu-Ola Ridge (Figure 1). Test plots (TP) were established at six elevational levels (treeline ecotone c. 2000–2100 m.; four TP in mixewood (larch and Siberian pine) forests within c. 1200–2000 m range and forest-steppe ecotone, c. 1100 m.). At each circular TP (with a radius of 9.8 m), we measured trees’ height and DBH (diameter at breast height, i.e., 1.3 m) and described trees’ physiognomy, soil type, and ground cover. Trees for sampling were randomly selected around each TP center point within an area of c. 0.5 ha. Samples (cores) were taken at DBH height using an increment borer. Within the treeline, cores were obtained at the root collar level. In addition, we sampled regeneration (i.e., trees with height <1.5 m) around the central point of each TP (within three plots 2 × 2 m). Within the treeline ecotone, 23 larches and 18 Siberian pine trees were sampled (also sampled regeneration (REG)—26 and 25, correspondingly). Within the mixewood forest, we sampled 89 larch and 80 Siberian pine trees, correspondingly. The sample size within the forest-steppe ecotone was 33 larch trees. Data obtained in test plots are presented in Table 1.

2.3. Climate Variables

Monthly air temperature, precipitation, wind speed, and vapor pressure deficit (VPD) values were obtained from the nearest weather station, “Sosnovka”, which is located c. 15 km from the test plots at an elevation of 947 m (WMO index is 36099). Soil moisture (0–28 cm depth) data were obtained from the ERA5-Land dataset at a spatial resolution of 0.1° × 0.1° (https://cds.climate.copernicus.eu/cdsapp; accessed on 15 September 2023).

2.4. Dendrochronological Analysis

For dendrochronological analysis, we used cores obtained from larch and Siberian pine trees sampled in September 2023. In total, 294 wood samples were collected. Tree cores were glued onto a wooden backing, finely sanded, and treated with contrast powder. The measurements were carried out on the LINTAB-6 platform with an accuracy of 0.01 mm. The quality of cross-dating and measurement accuracy of tree-ring series were estimated by TSAP [34] and COFECHA 6.02 software (https://www.ldeo.columbia.edu/tree-ring-laboratory/resources/software, accessed on 6 February 2023) [35].
Thirteen (13) tree ring chronologies were developed: four for the treeline ecotone (trees and regeneration both for larch and Siberian pine), eight for the mixewood forests (both for larch and Siberian pine), and one for larch trees from the forest-steppe ecotone. Descriptive statistics of tree ring chronologies are presented in Table 2.
Tree ring chronologies were developed using ARSTAN 6.02 software (https://www.ldeo.columbia.edu/tree-ring-laboratory/resources/software, accessed on 6 February 2023) [36]. To reduce the effect of long-term trends unrelated to the eco-climate variables, raw time series of the radial increment (in mm) were fitted with an exponential or negative linear trend line (age-related growth trend curve) and converted into a unitless growth index (GI) time series with an average of 1.0 by Equation (1) [37]:
G I t = R t mm G t mm
where GIt is the GI in the t-th year; Rt is the tree ring width measured in mm; Gt is a value of an age-related growth trend (in mm), calculated in the ARSTAN program by standard dendrochronological techniques. Finally, in the following analysis we used unitless GI values.

2.5. Satellite Data Analysis

2.5.1. Landsat-Based Analysis along the Elevation Transect

Landsat time series data (1988–2023) were analyzed to detect changes in trees’ and shrubs’ cover along the elevation transect (Figure 1). For this purpose, Landsat-5 scene (19 September 1988) and Landsat-9 scene (27 August 2023) were used. A topo normalization was applied for both scenes using a C-correction [38]. We removed burned forest areas using the GFLDF product (2001–2022) [39]. We used a support vector machine algorithm to generate a land cover classification map. We generated a training sample set based on our ground survey data and freely available high-resolution scenes (Google Maps, ArcGIS World Imagery, and Yandex Maps). We focused on the determination of the forested and shrubland areas. We estimated the classification accuracy based on the error matrix and KHAT (κ)-statistics [40]. We used classification maps to find the zones of forest and shrubland gains and losses. We considered the following classes: (1) forest gain, (2) shrubland gain, (3) forest loss, and (4) shrubland loss. We estimated shifts of the upper boundaries of forests and shrubs as differences between 99th percentiles of the area distributions concerning elevations.

2.5.2. MODIS-Based Analysis of the Land Cover Classes in the Tannu-Ola Ridge

We used the MODIS MOD12Q1 product (v6.1; https://lpdaac.usgs.gov/products/mcd12q1v061; accessed on 12 January 2024) to estimate changes in the cover of Siberian pine and larch stands. That dataset represents annual global land cover maps [41]. We used IGBP classification layers to assess changes in land cover. Burned areas were removed from the used land cover maps based on the MODIS MCD64A1 product (https://lpdaac.usgs.gov/products/mcd64a1v061; accessed on 12 January 2024). Both products have a 500 m spatial resolution. These datasets were downloaded from NASA’s EarthData portal (https://search.earthdata.nasa.gov/search; accessed on 12 January 2024).
The Tannu-Ola Ridge was delineated based on a physical map and the Copernicus GLO30 Digital Elevation Model (https://spacedata.copernicus.eu/collections/copernicus-digital-elevation-model; accessed on 17 January 2024). The GLO30 was obtained from the OpenTopography geoportal (https://portal.opentopography.org; accessed on 17 January 2024). We analyzed territories (about 20,060 km2) with elevations >1000 m.
All spatial data were transformed to the UTM projection (zone 46, WGS84) and clipped to the territory of the Tannu-Ola Ridge. We calculated harmonized maps for the two periods (2001–2003 and 2020–2022) using the majority filter cell statistics. We reduced the number of the analyzed land cover classes by merging IGBP classes concerning local ones that are typical for the Tannu-Ola Ridge (Table 3). Changes were detected based on the generated maps and the transformation matrix of land cover classes.

2.6. Statistical Analysis

We analyzed Spearman correlation coefficients to assess the impact of climate variables (air temperature, precipitation, soil moisture, wind speed, and vapor pressure deficit) on the GI dynamics. We used different combinations of months for different elevations due to the large elevational extent of the transect (almost 1000 m). The highest and lowest sites of the transect will differ significantly in the beginning, duration, and phases of the growing season. At the lowest site, the growing season in certain years can begin as early as the end of April, while at the highest site, the beginning of the growing season can be delayed until the first third of June. We calculated correlations for Siberian pine and larch trees and regeneration along the elevation gradient. We calculated trends using regression analysis. We used a T-test to assess the significance of trends. We used Statsoft Statistica (v. 12) and Microsoft Excel (v. 2405) software (https://www.statistica.com; accessed on 15 September 2023; and https://www.microsoft.com/ru-ru/microsoft-365/excel; accessed on 15 September 2023). Spatial data were processed using ESRI ArcGIS (v. 10.8.2) software (https://www.esri.com, accessed on 15 September 2023).

3. Results

3.1. Climate Variables’ Dynamic

Air temperature in the growing (MJJAS) period significantly increased since the year 1997 (plus 1.1 °C, Figure 2a). That increase was also documented for the whole Northern Hemisphere (Figure S1). The temperature of the cold period (NDJFM) increased until c. 1997, with insignificant trends afterward (Figure 2a). Since the warming increase, decreasing trends in soil moisture (especially at the beginning of the growing period, June) and drought index SPEI and an increasing trend of VPD occurred (with local extremes in the years 2019–2021; Figure 2c–e). Meanwhile, the precipitation dynamics was without significant trends (Figure 2b). Winter wind speed increase coincided with the warming restart (Figure 2f).

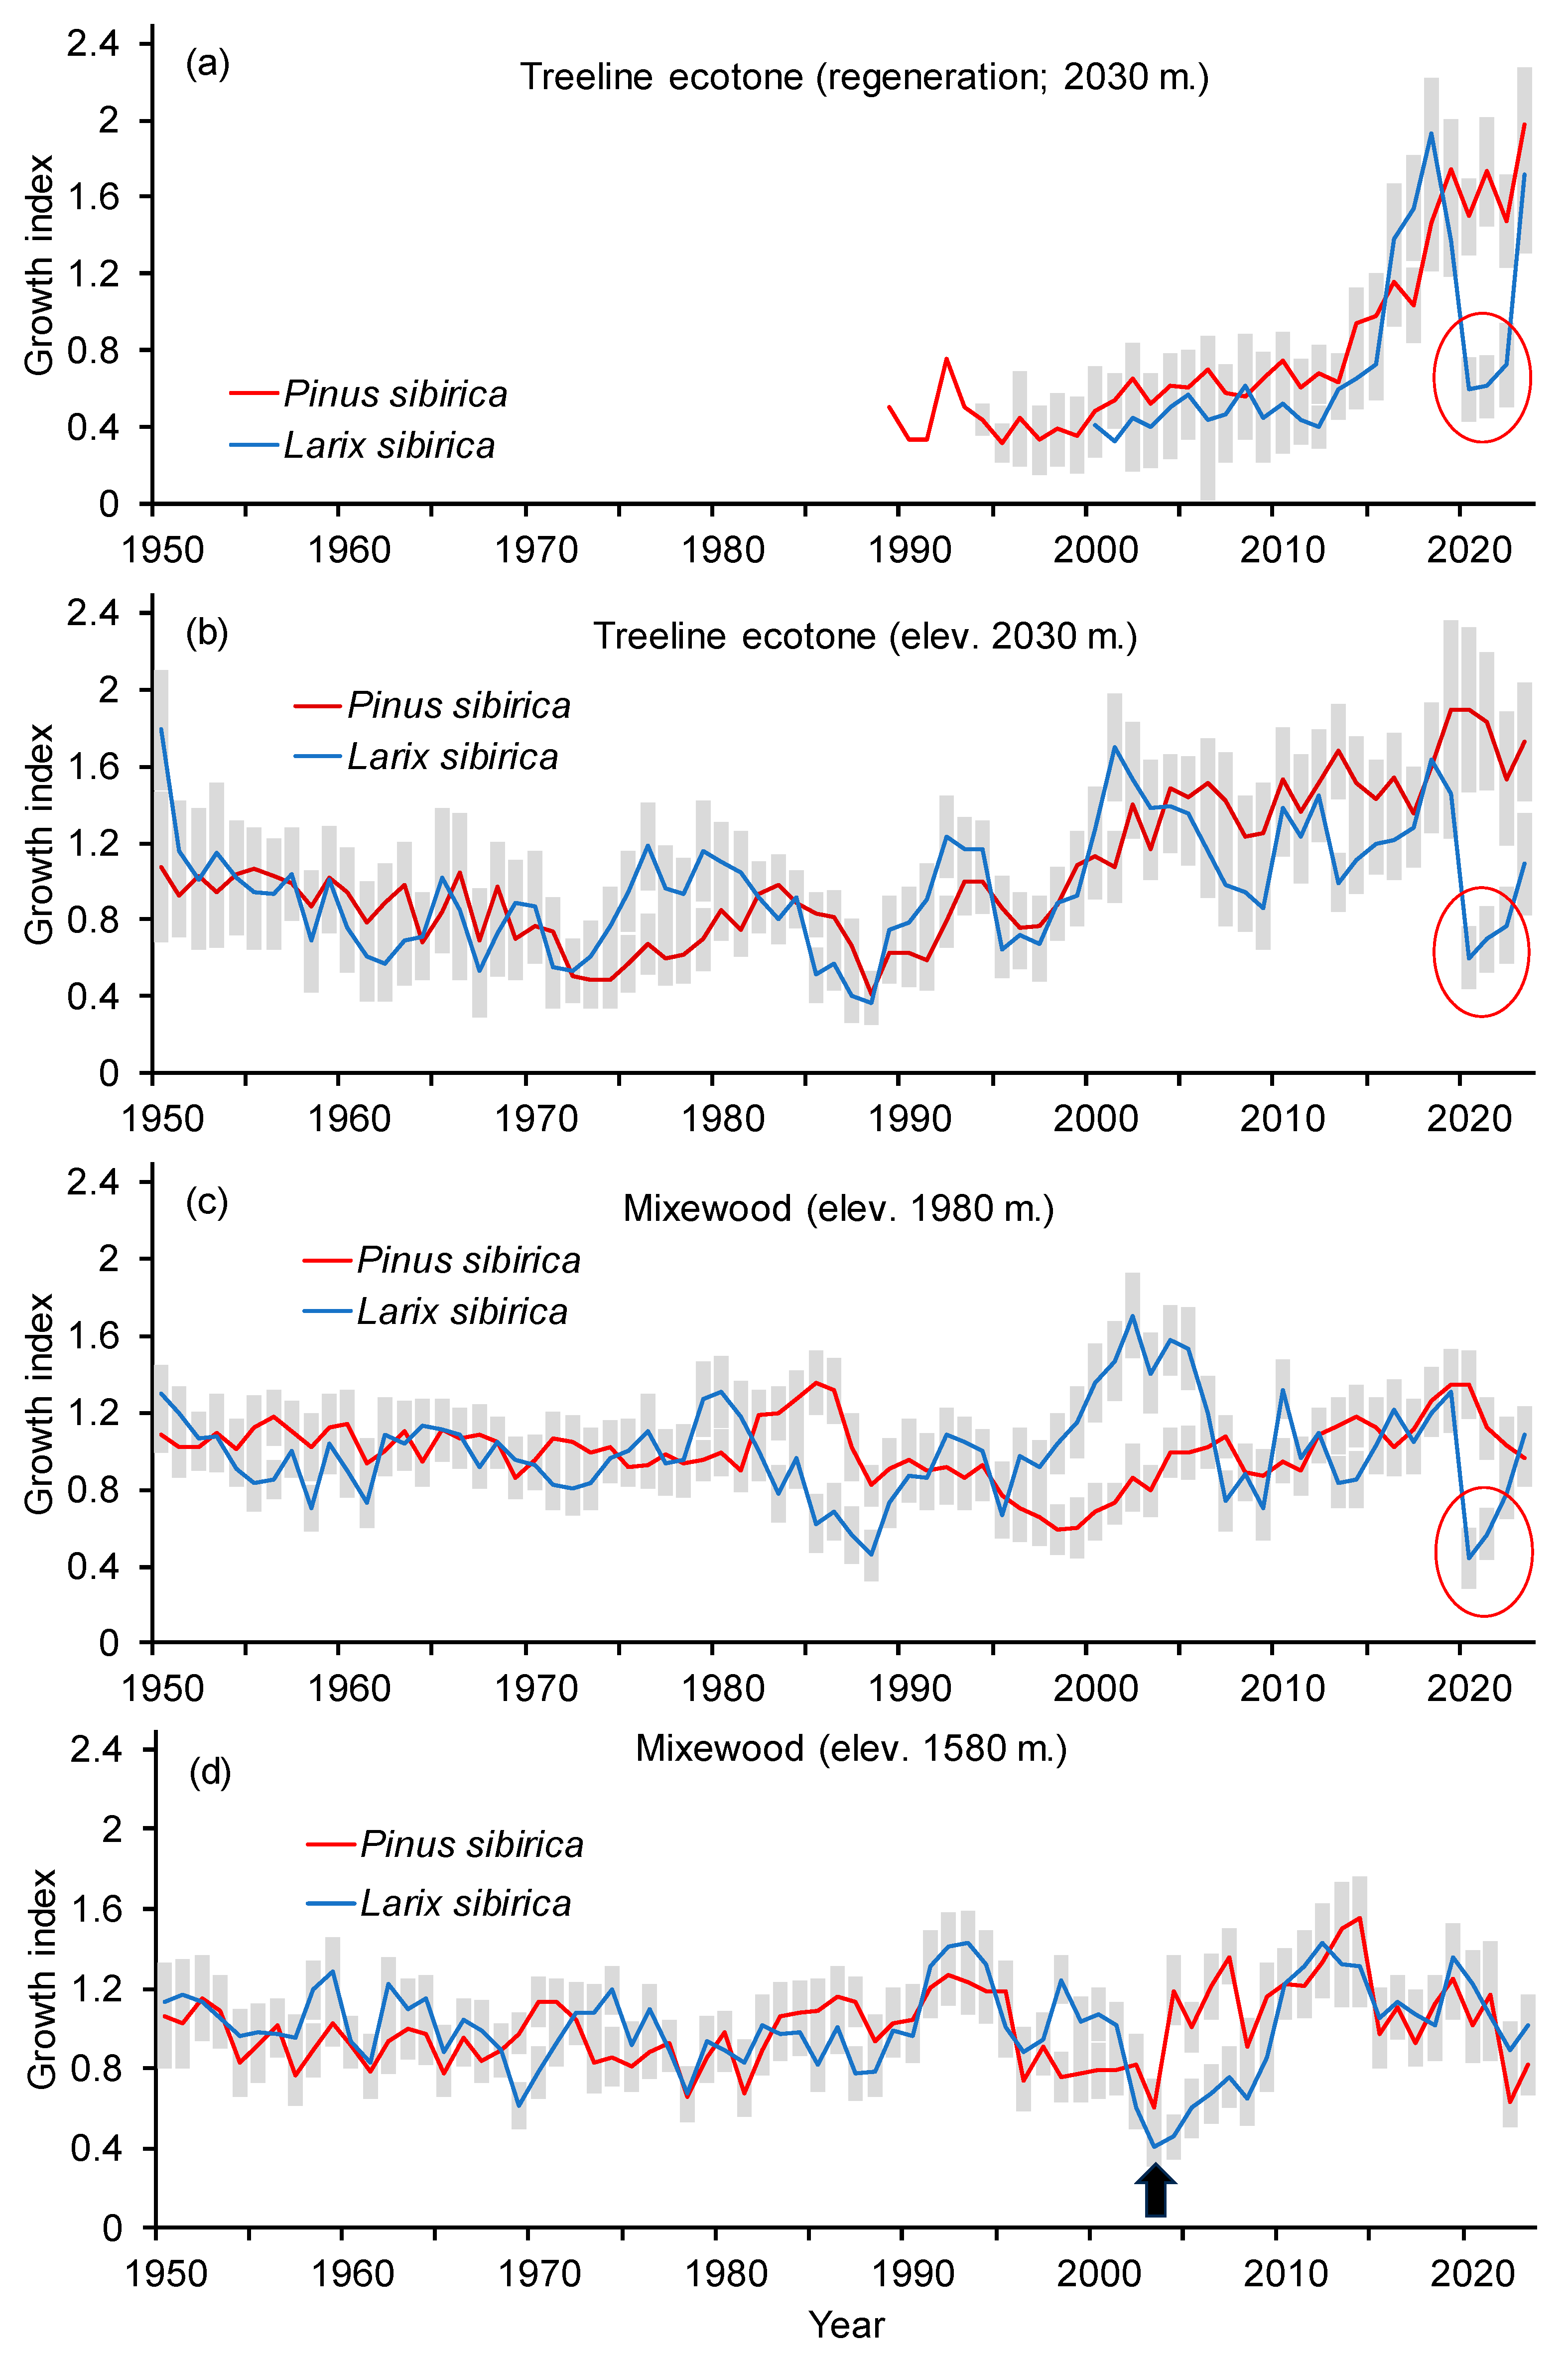
3.2. Trees Growth Dynamics

Within treeline ecotone, the growth index of both Siberian pine and larch decreased until the beginning of the 1970s with the following minor GI increase. The following strong increase in Siberian pine growth was observed from the end of the 1990s to the beginning of the 2000s (Figure 3b). Notably, at low elevations, the GI of Siberian pine and, less significantly, of larch was higher before the warming restart (Figure 3f). Remarkably, both larch trees and regeneration growth showed a depression during the years 2020–2022 (indicated by red circles in Figure 3a–c). The years of those events coincided with an outbreak of the insect defoliator Zeiraphera griseana Hübner, 1799, that led a temporal decrease in larch growth (see Discussion section).
The warming increase since 1997 led to an increase in the GI of both tree species at high (≥1980, Figure 3a–c) elevations, whereas at lower elevations, trees’ growth decreased, with minimum values around the year 2004 (Figure 3e–g). The latter coincides with the period of minimal values of precipitations and soil moisture content (Figure 2b,c).
At low elevations (c. 1200 m), a decrease in trees’ growth was observed since the beginning of the 1980s, and it continued in the 1990s with the following fluctuations around mean values which are below those in the previous period (Figure 3f). In the forest-steppe, larch growth strongly increased during the years 2020–2022, which coincided with anomalously high moisture values (Figure 2b–d and Figure 3g). In fact, the warming restart led to an increase in tree’s growth at high elevations and a growth decrease at low elevations, i.e., within the zones of sufficient and low moisture supply, correspondingly. The quantitative analysis of the tree growth–climate variables relationship is considered in the next section.

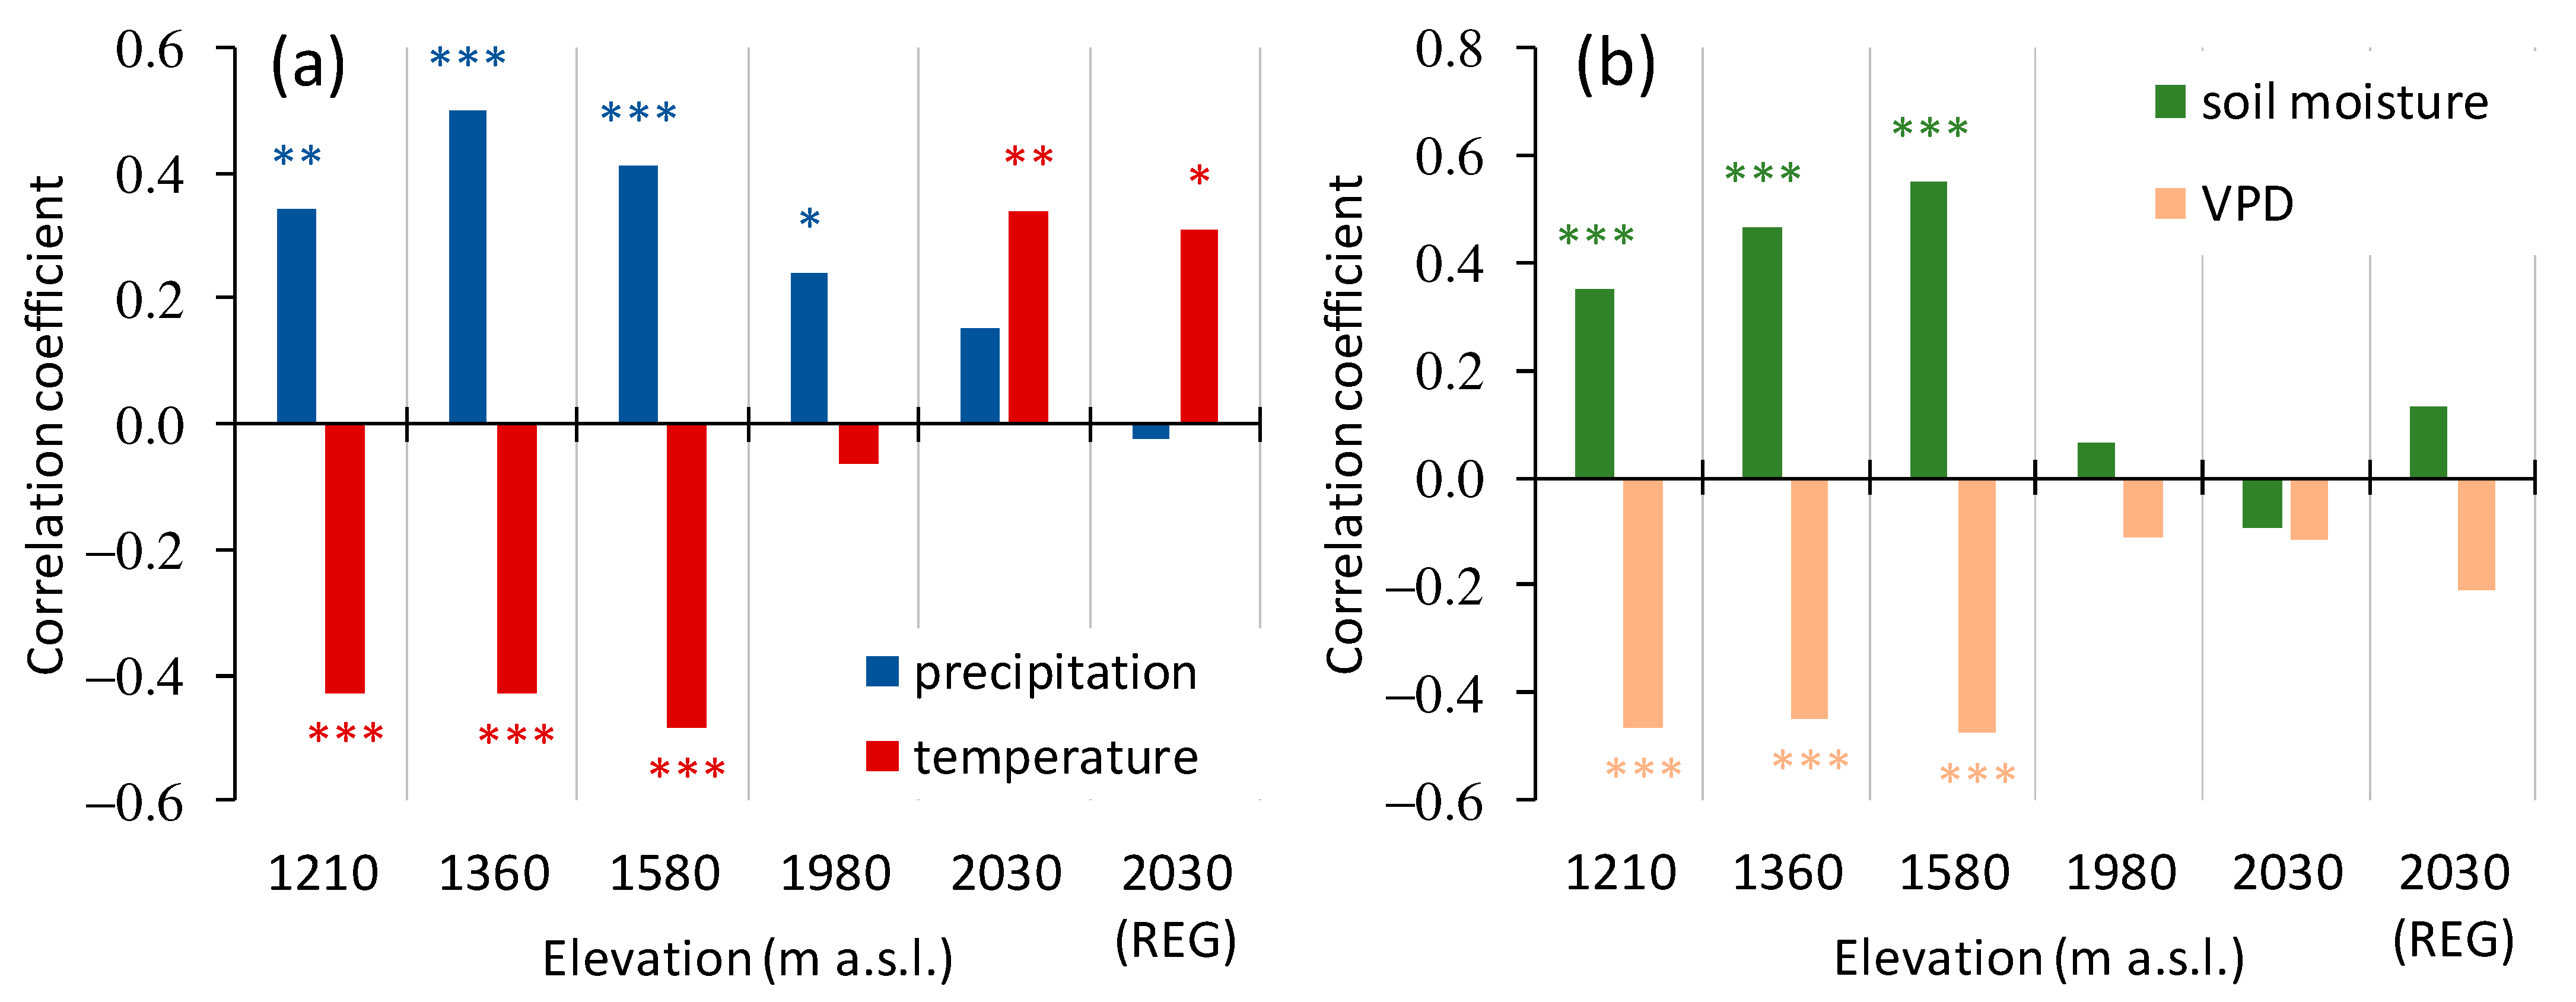
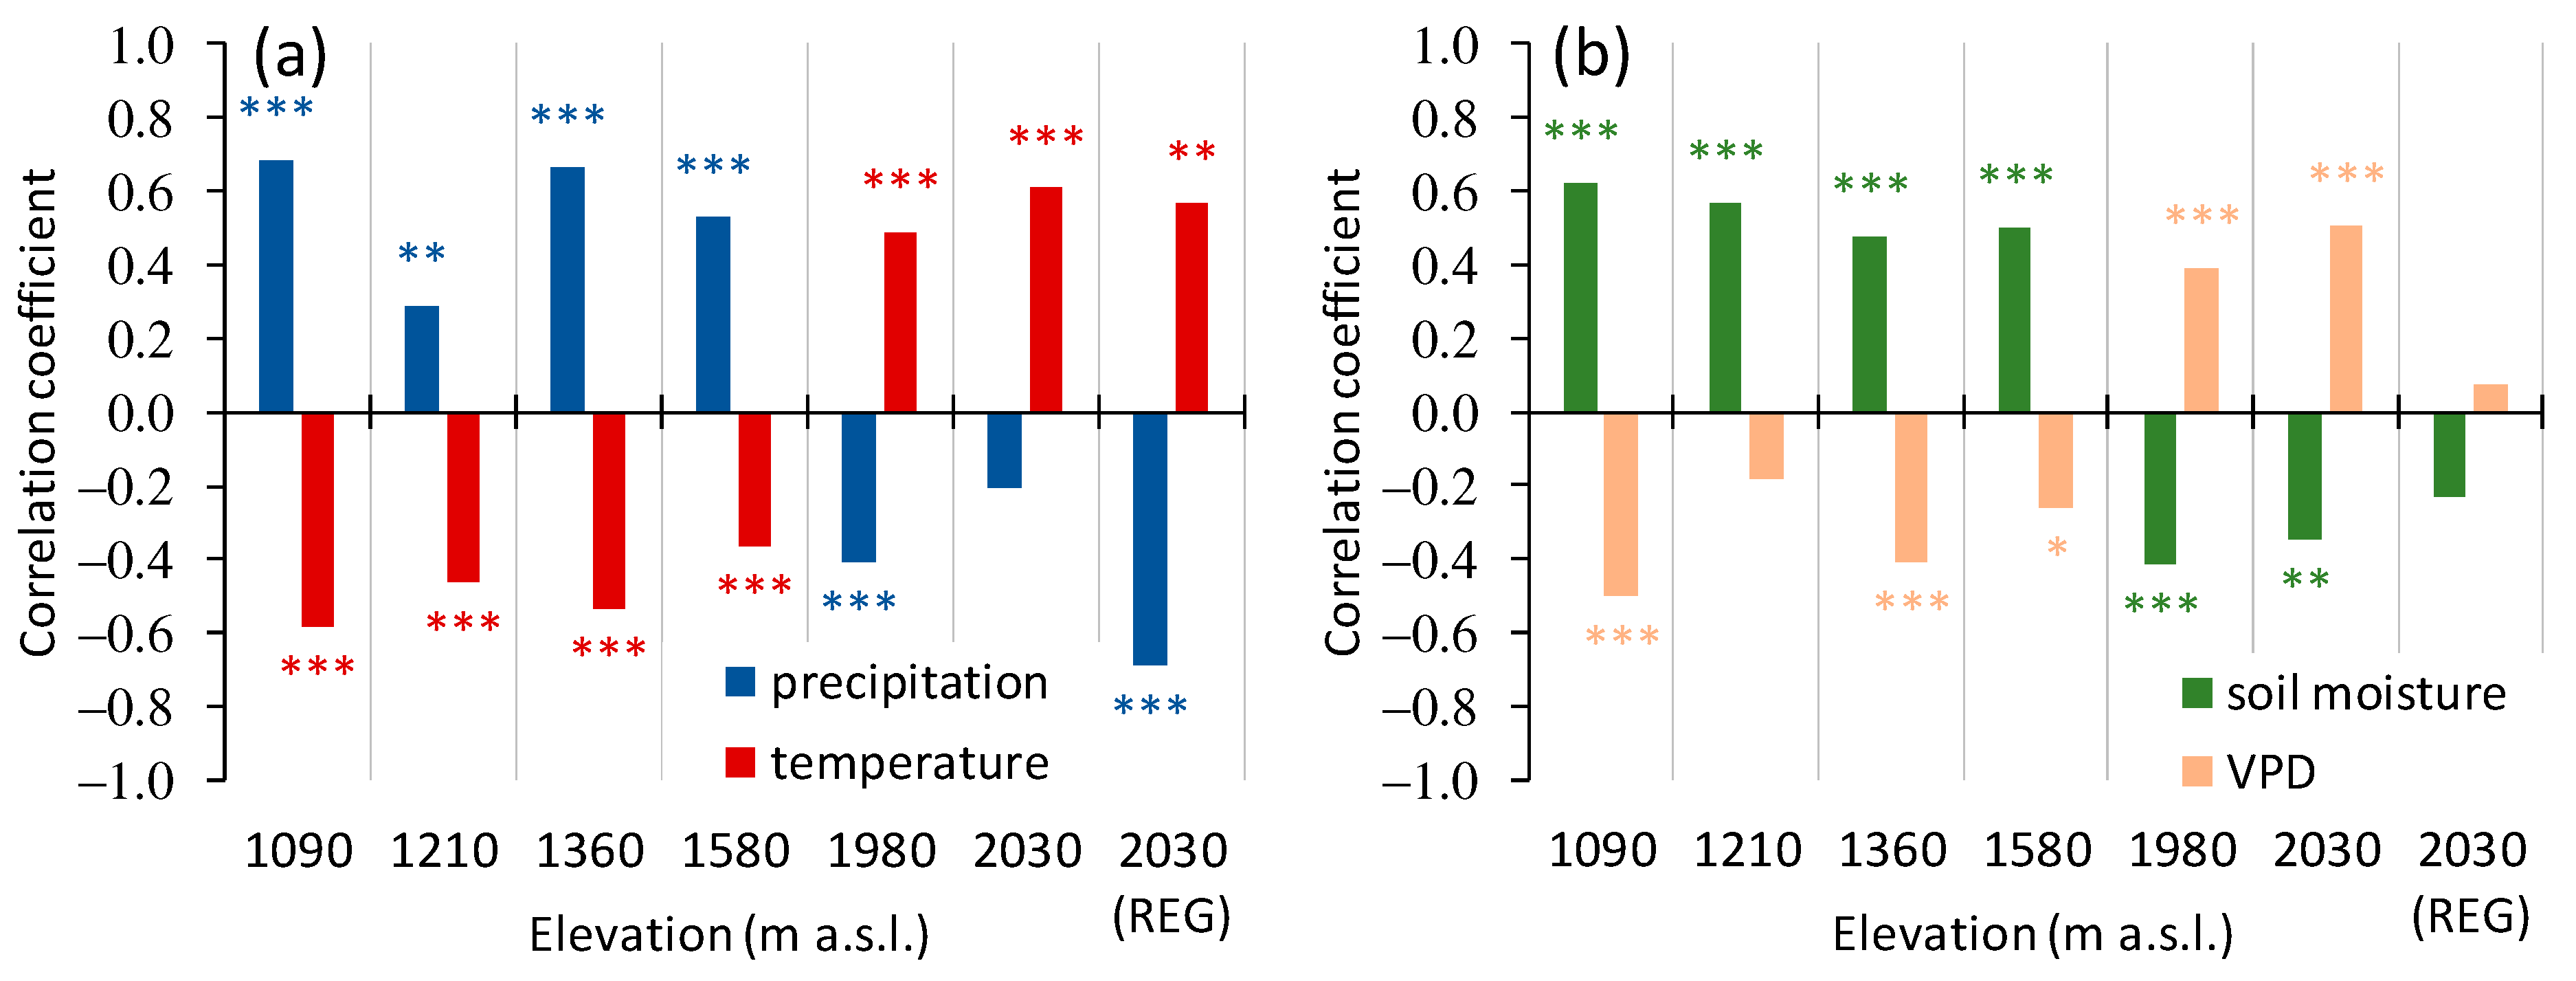
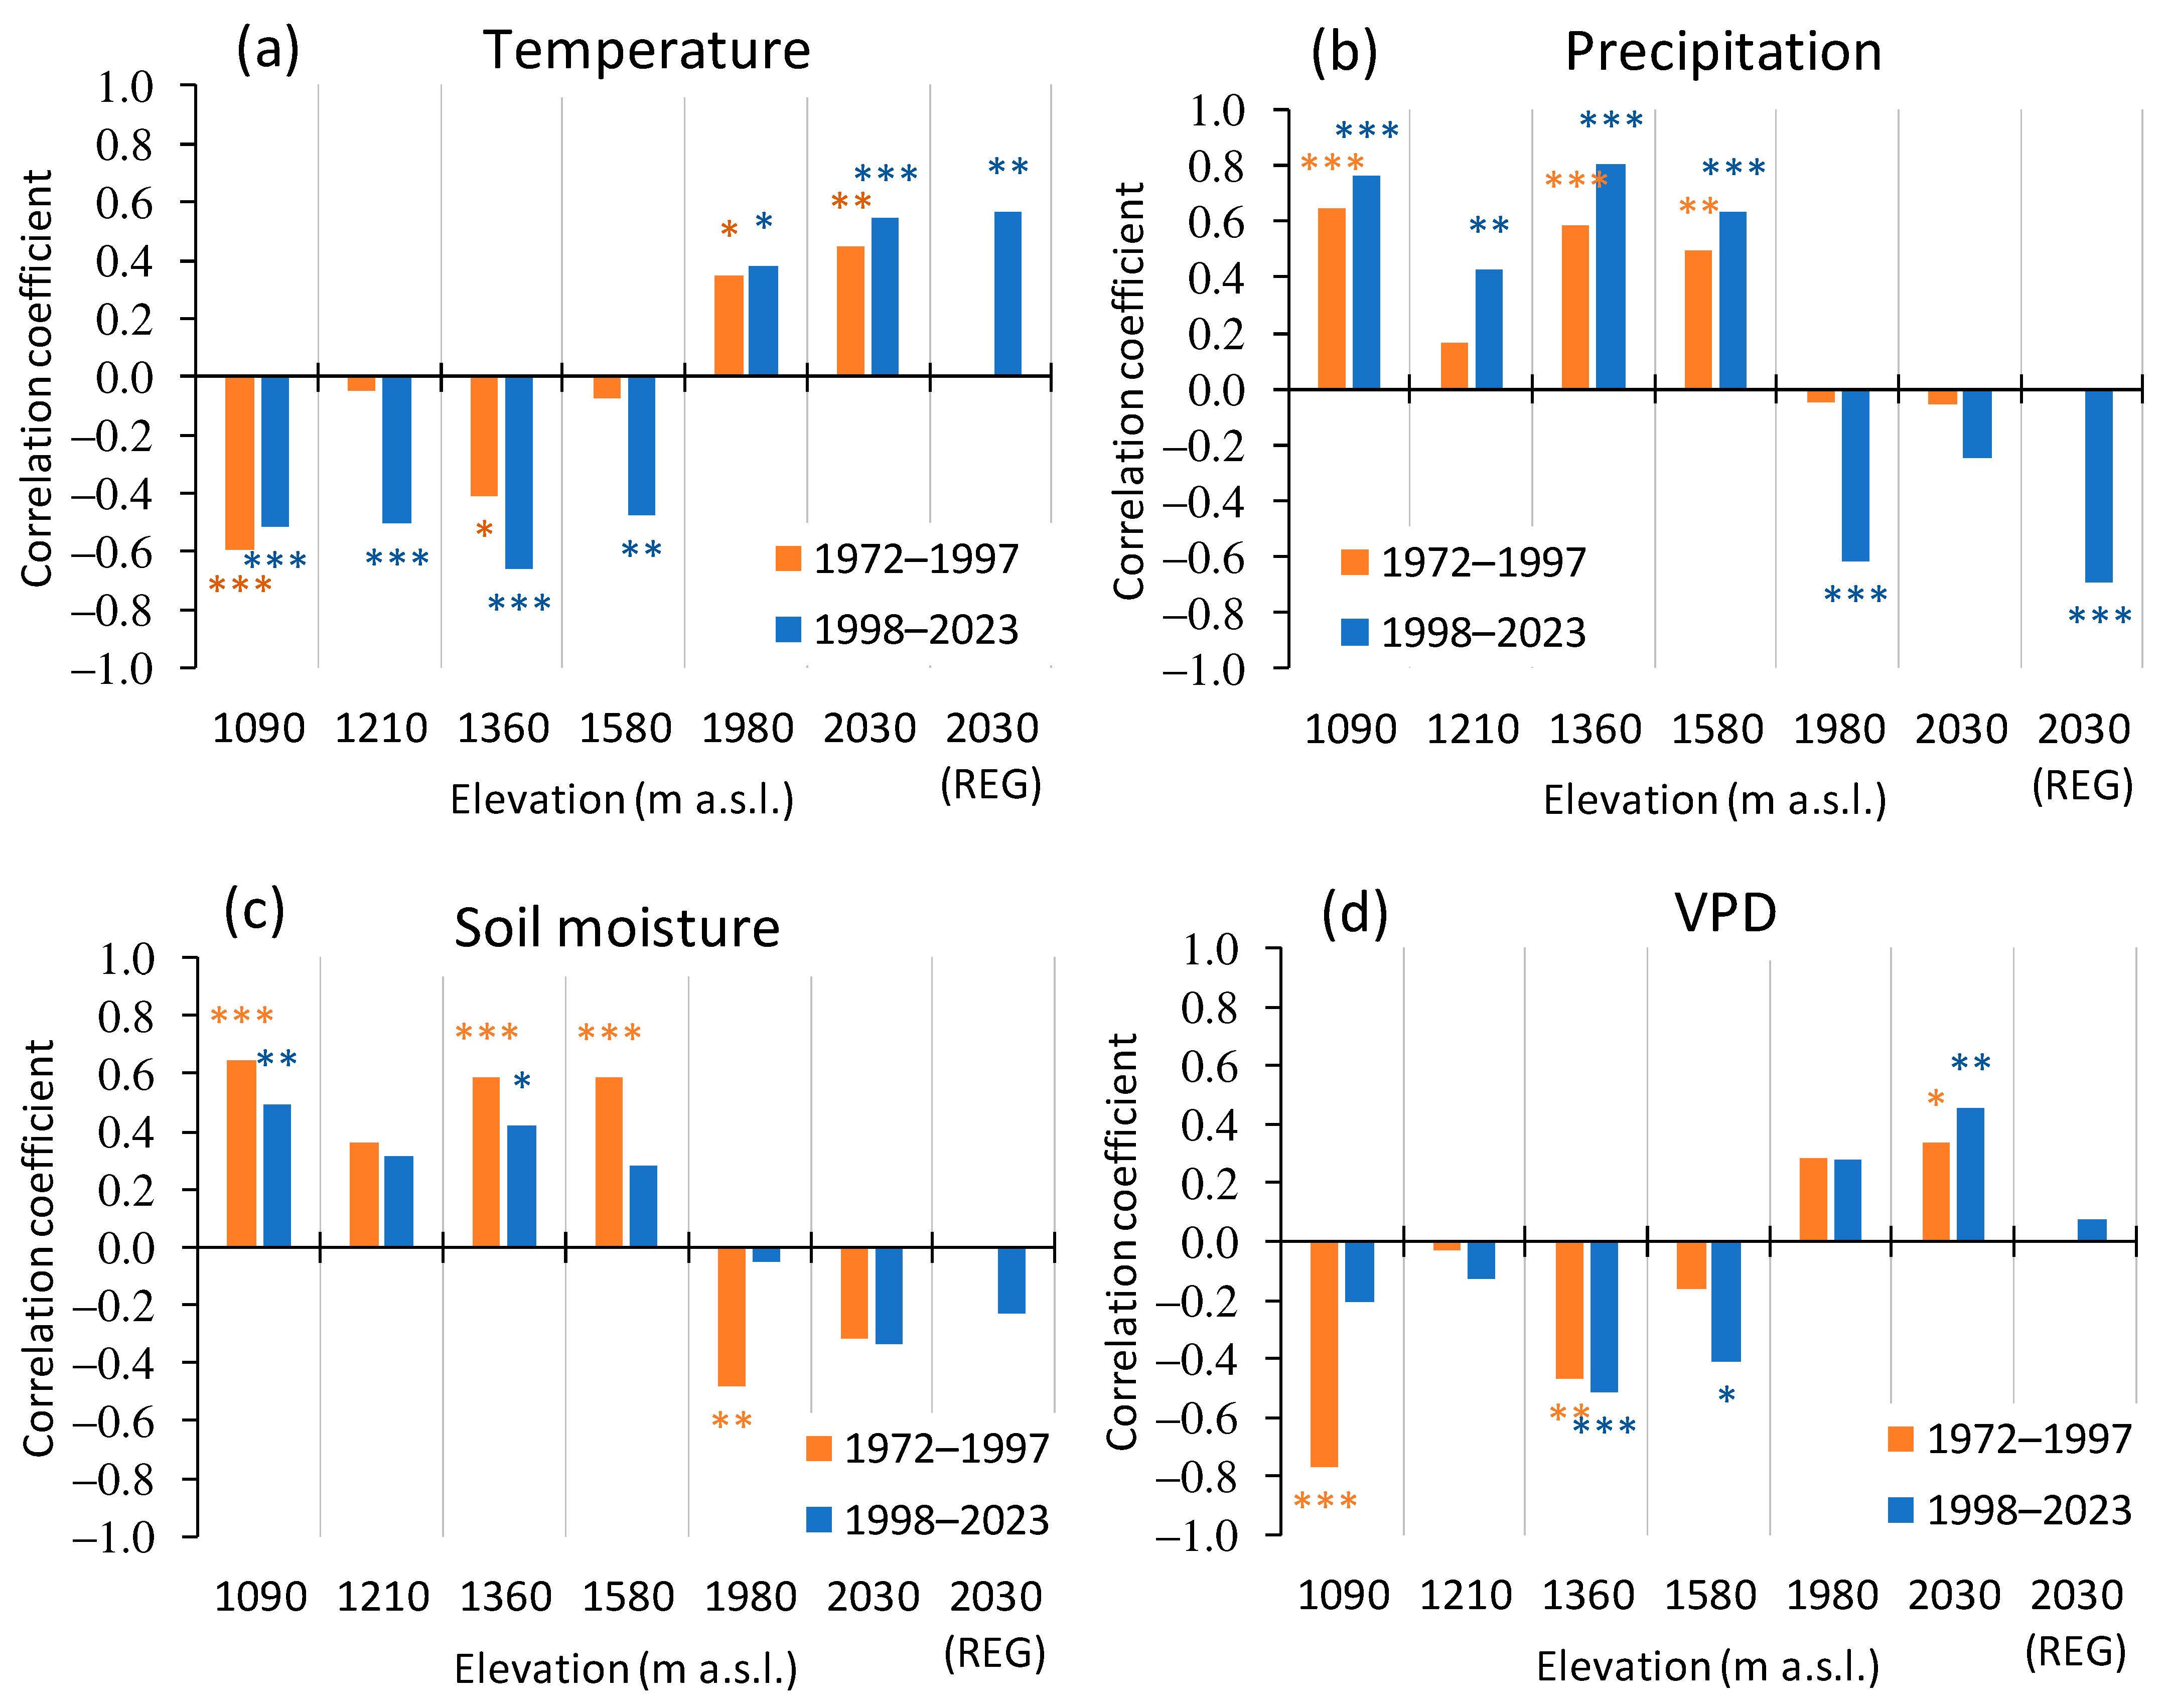
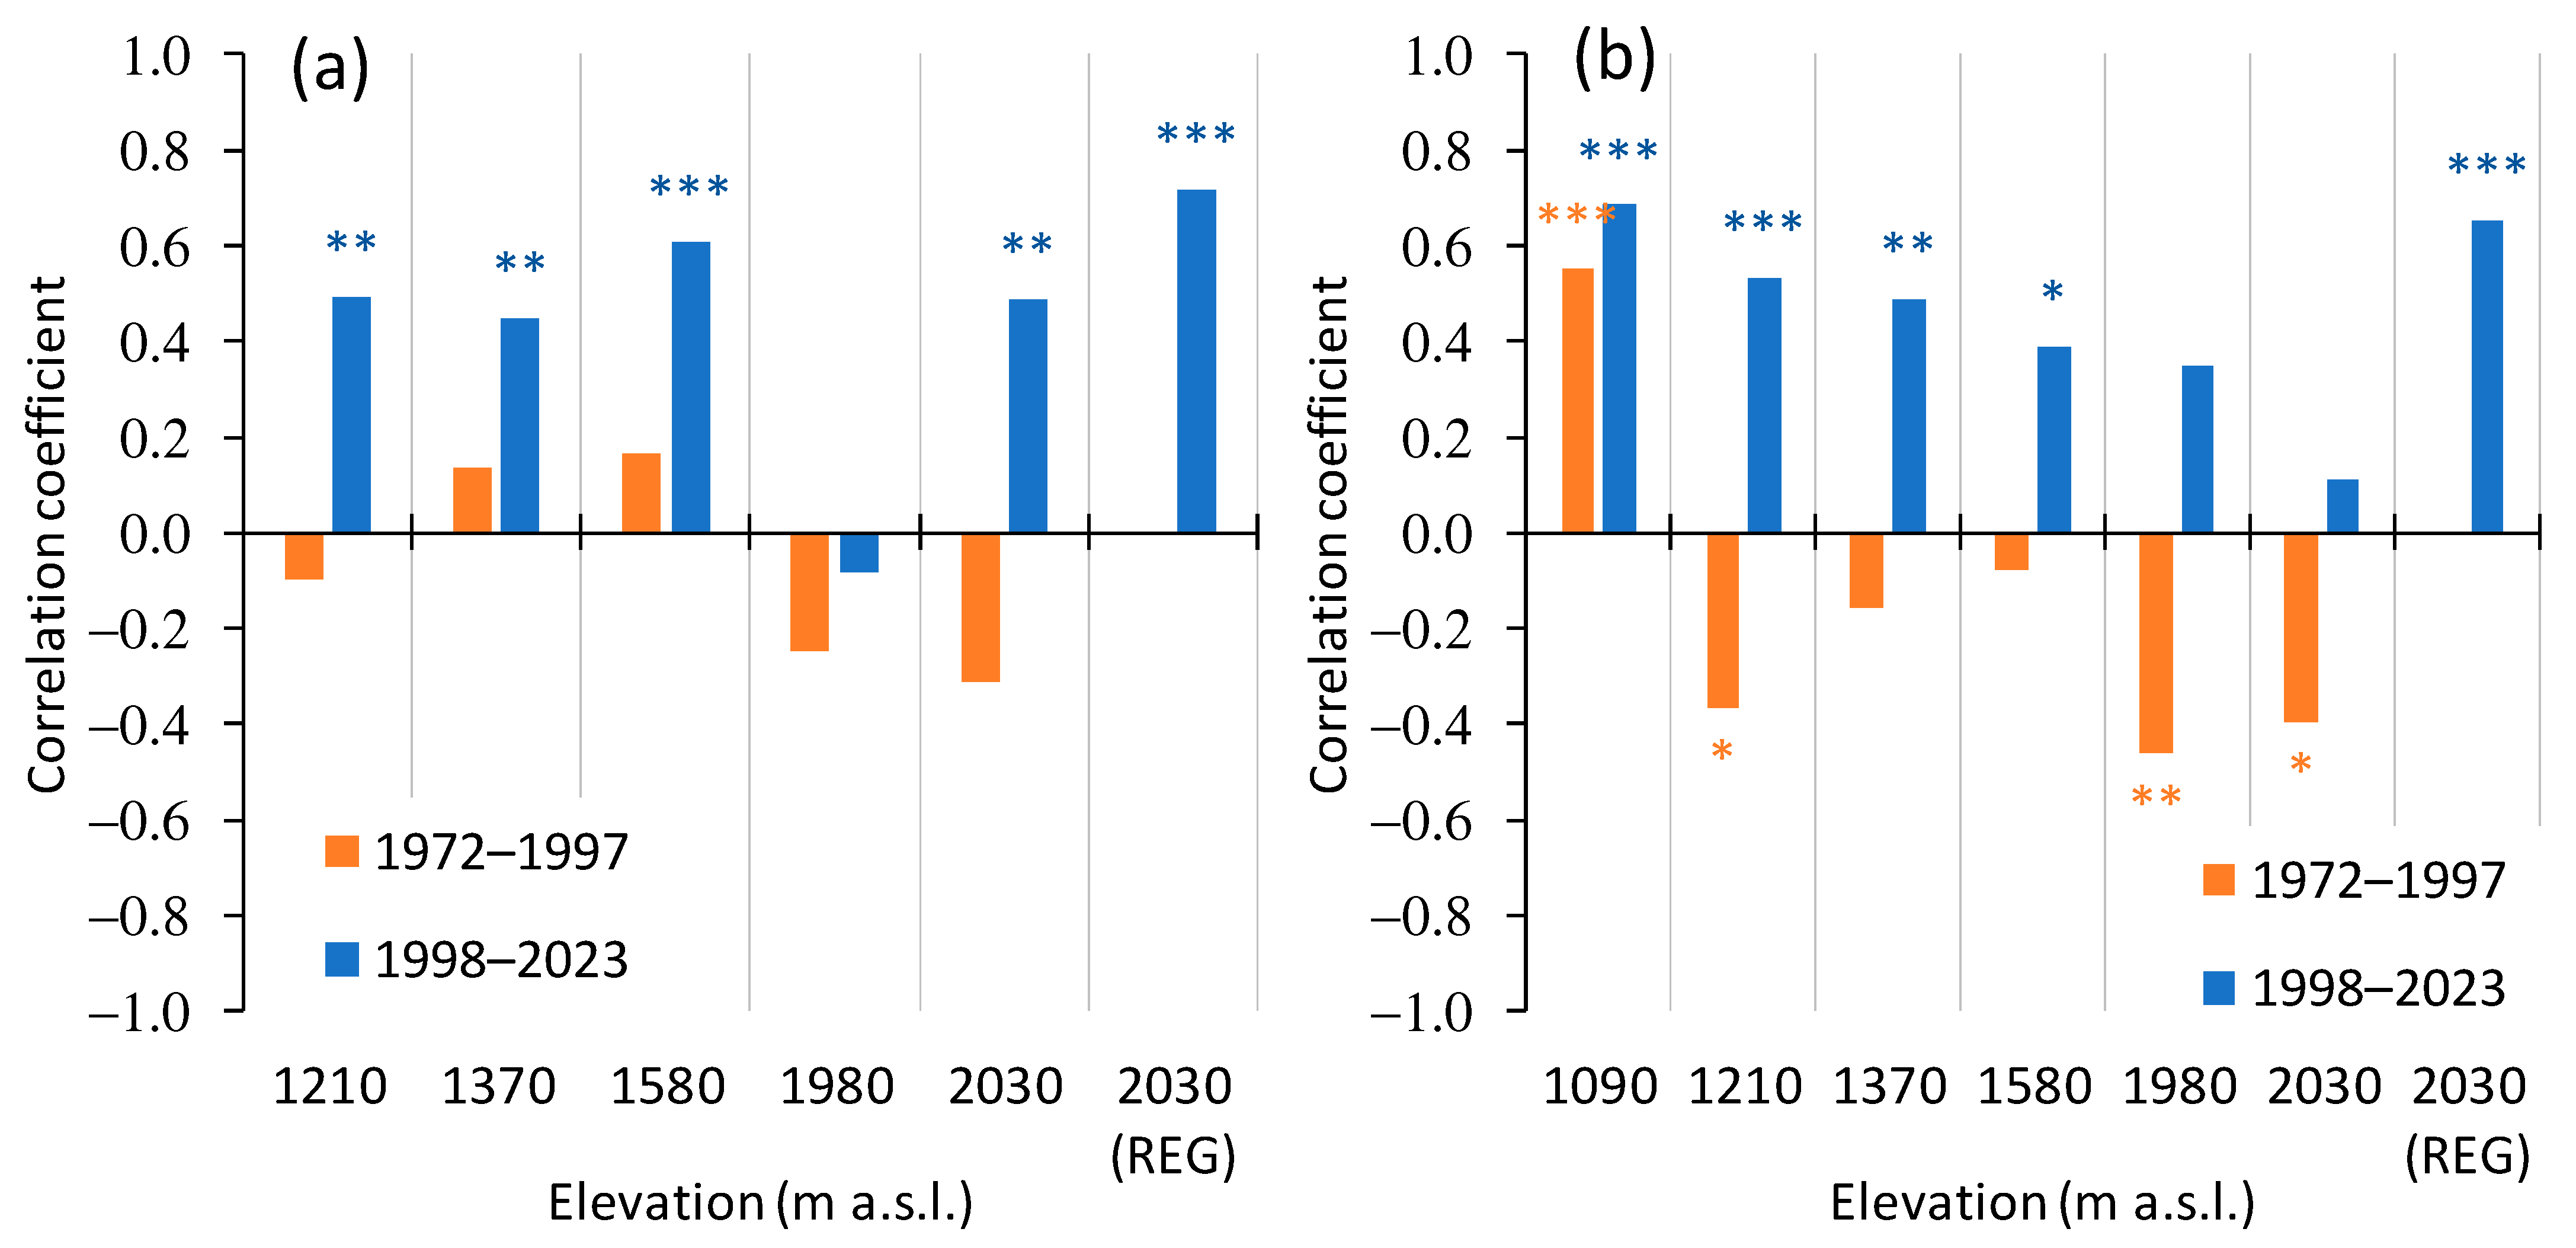
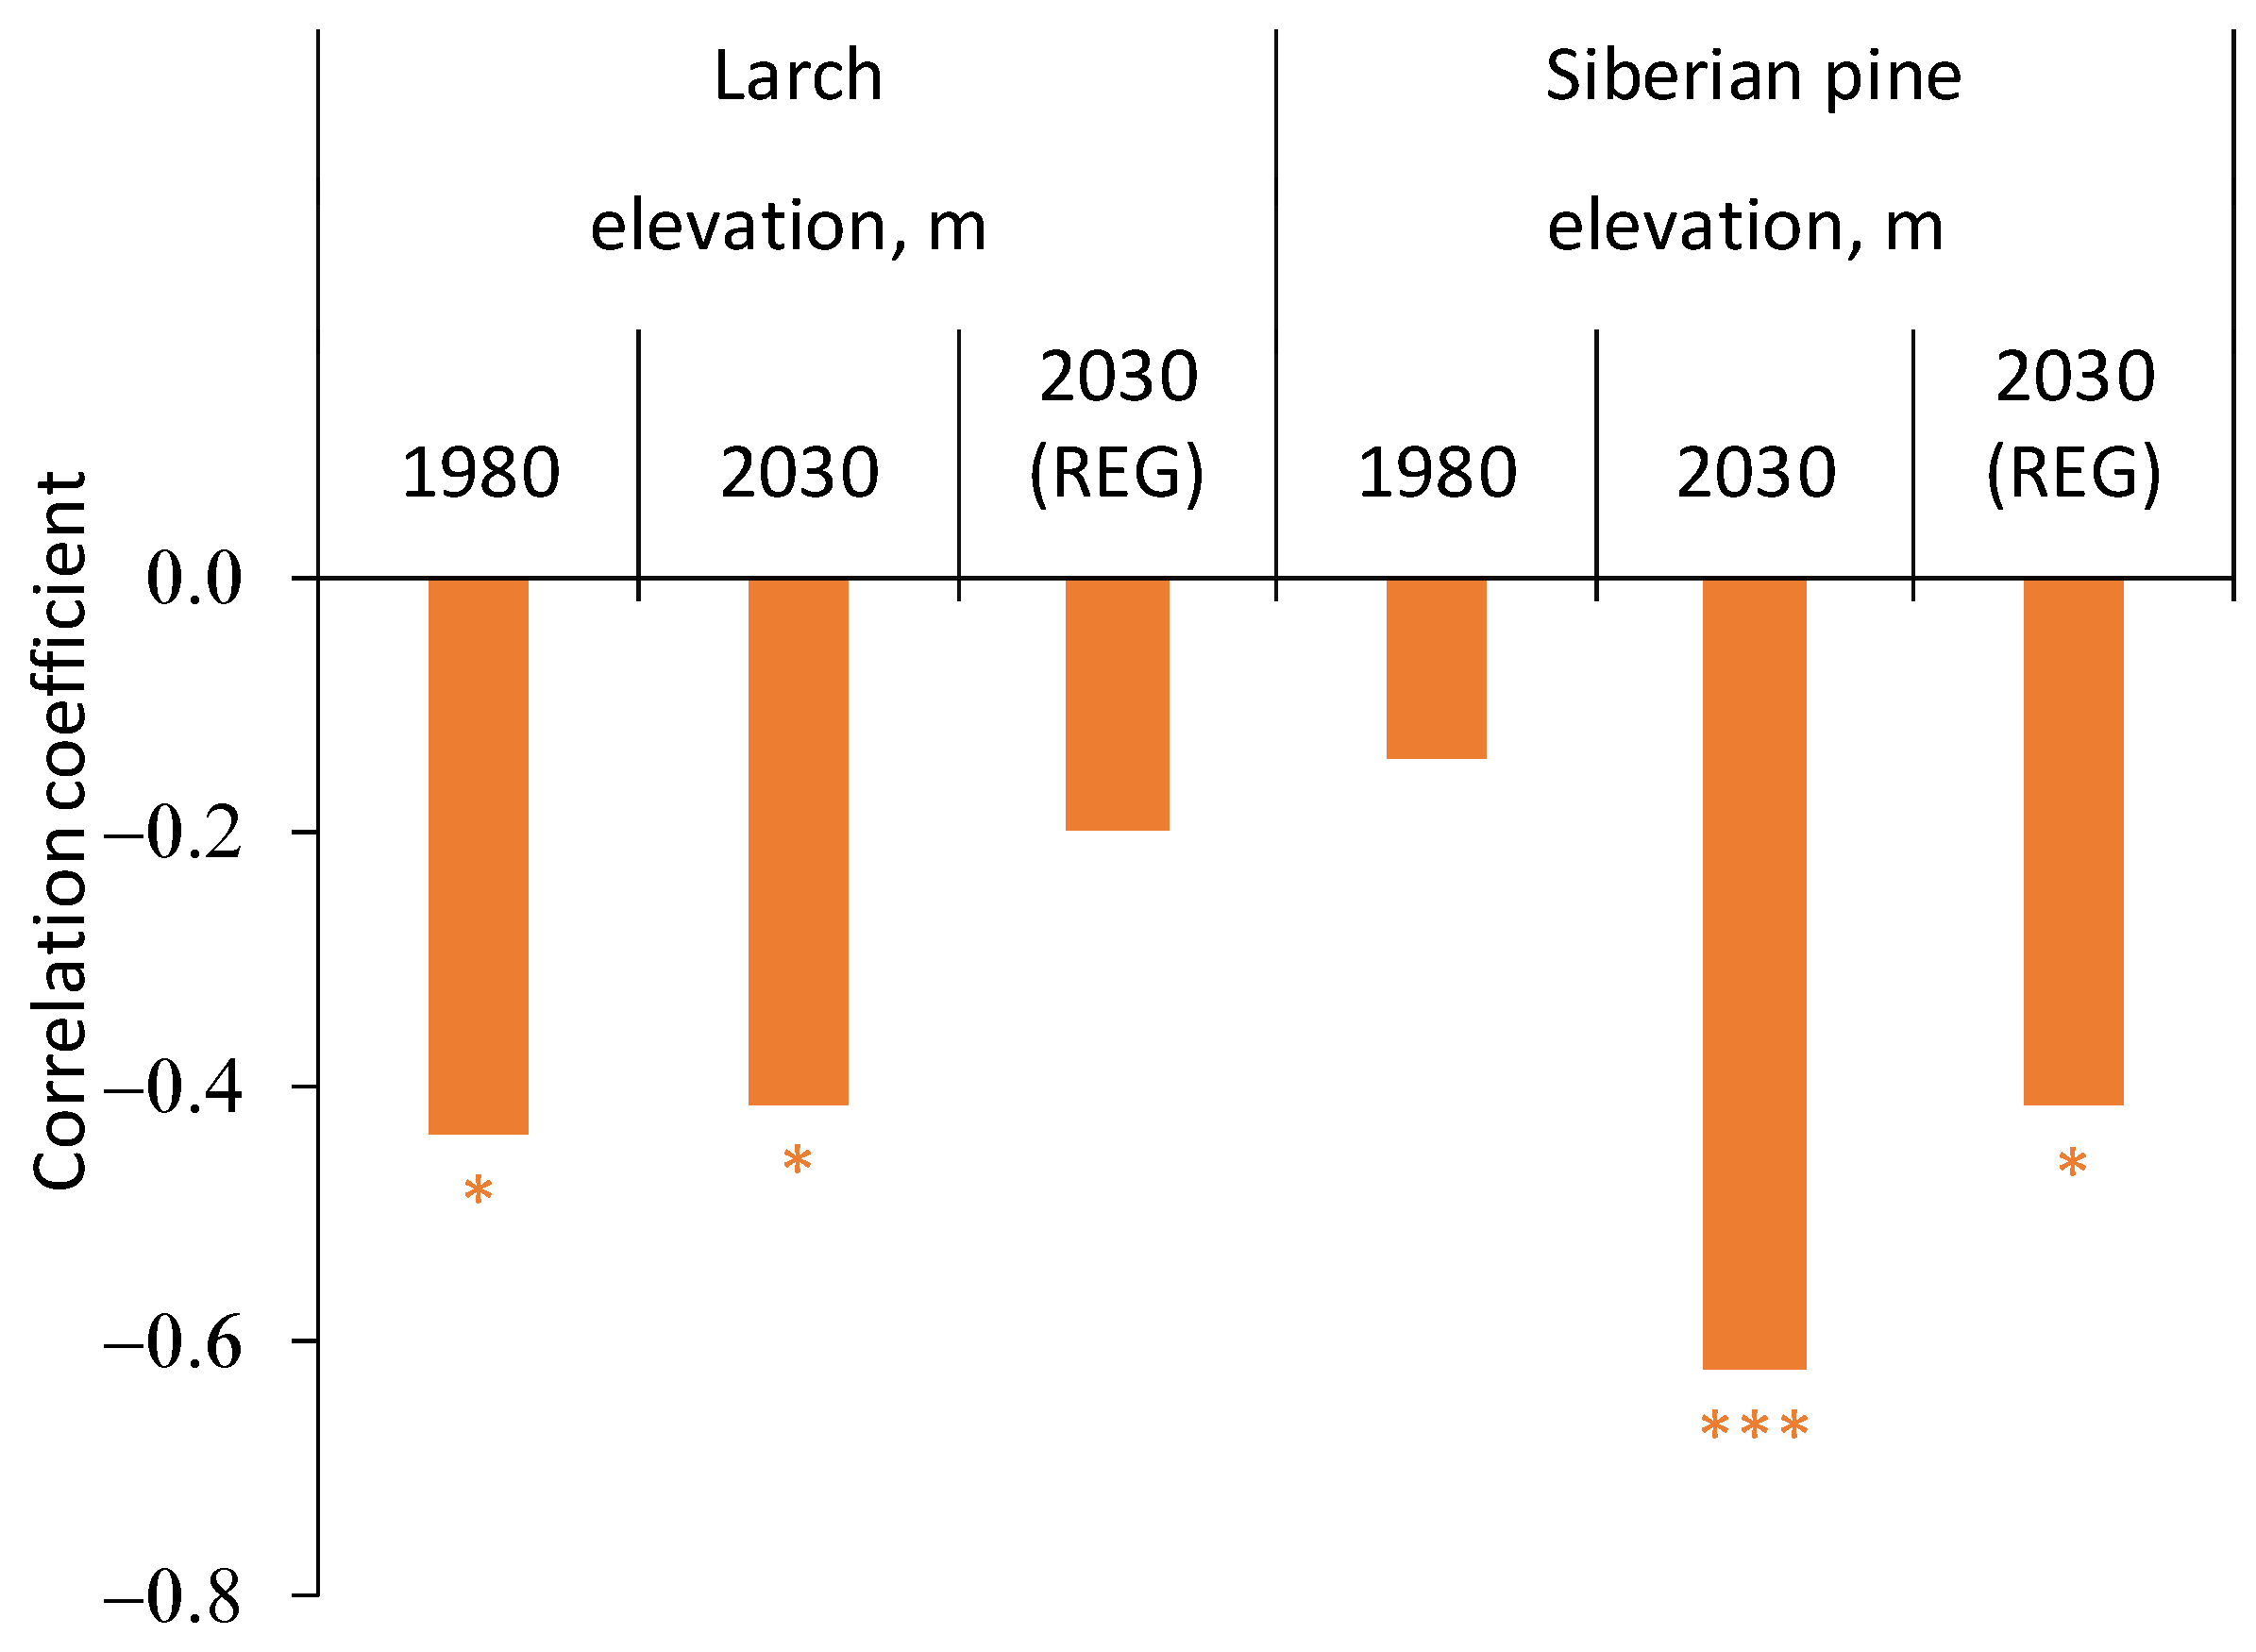
3.3. Trees Growth Dependence on the Climate Variables

3.3.1. A General Pattern of Siberian Pine and Larch Growth along the Elevation Gradient

Here, we considered the general pattern of Siberian pine and larch growth along the elevation gradient, as well as the dependences of trees’ growth on the air temperature and moisture variables.
The Siberian pine growth dependence on air temperature and atmospheric drought (indicated by VPD) switched from negative at lower elevations (1210–1580) to positive (for temperature) or insignificant (for VPD) at higher elevations. The positive influence of precipitation and soil moisture at low and middle elevations (including 1580 m) switched to negative (or insignificant) at high (from about 2000 m) elevations (Figure 4a,b).
A similar (but more distinct) switch from negative to positive influence (for temperatures) and from positive to negative (for precipitation and soil moisture) was observed for larch (Figure 5a,b). Notable is a lower influence of VPD on larch growth in comparison with Siberian pine. It is known that Siberian pine is highly sensitive to atmospheric drought, whereas larch is a drought-resistant species.

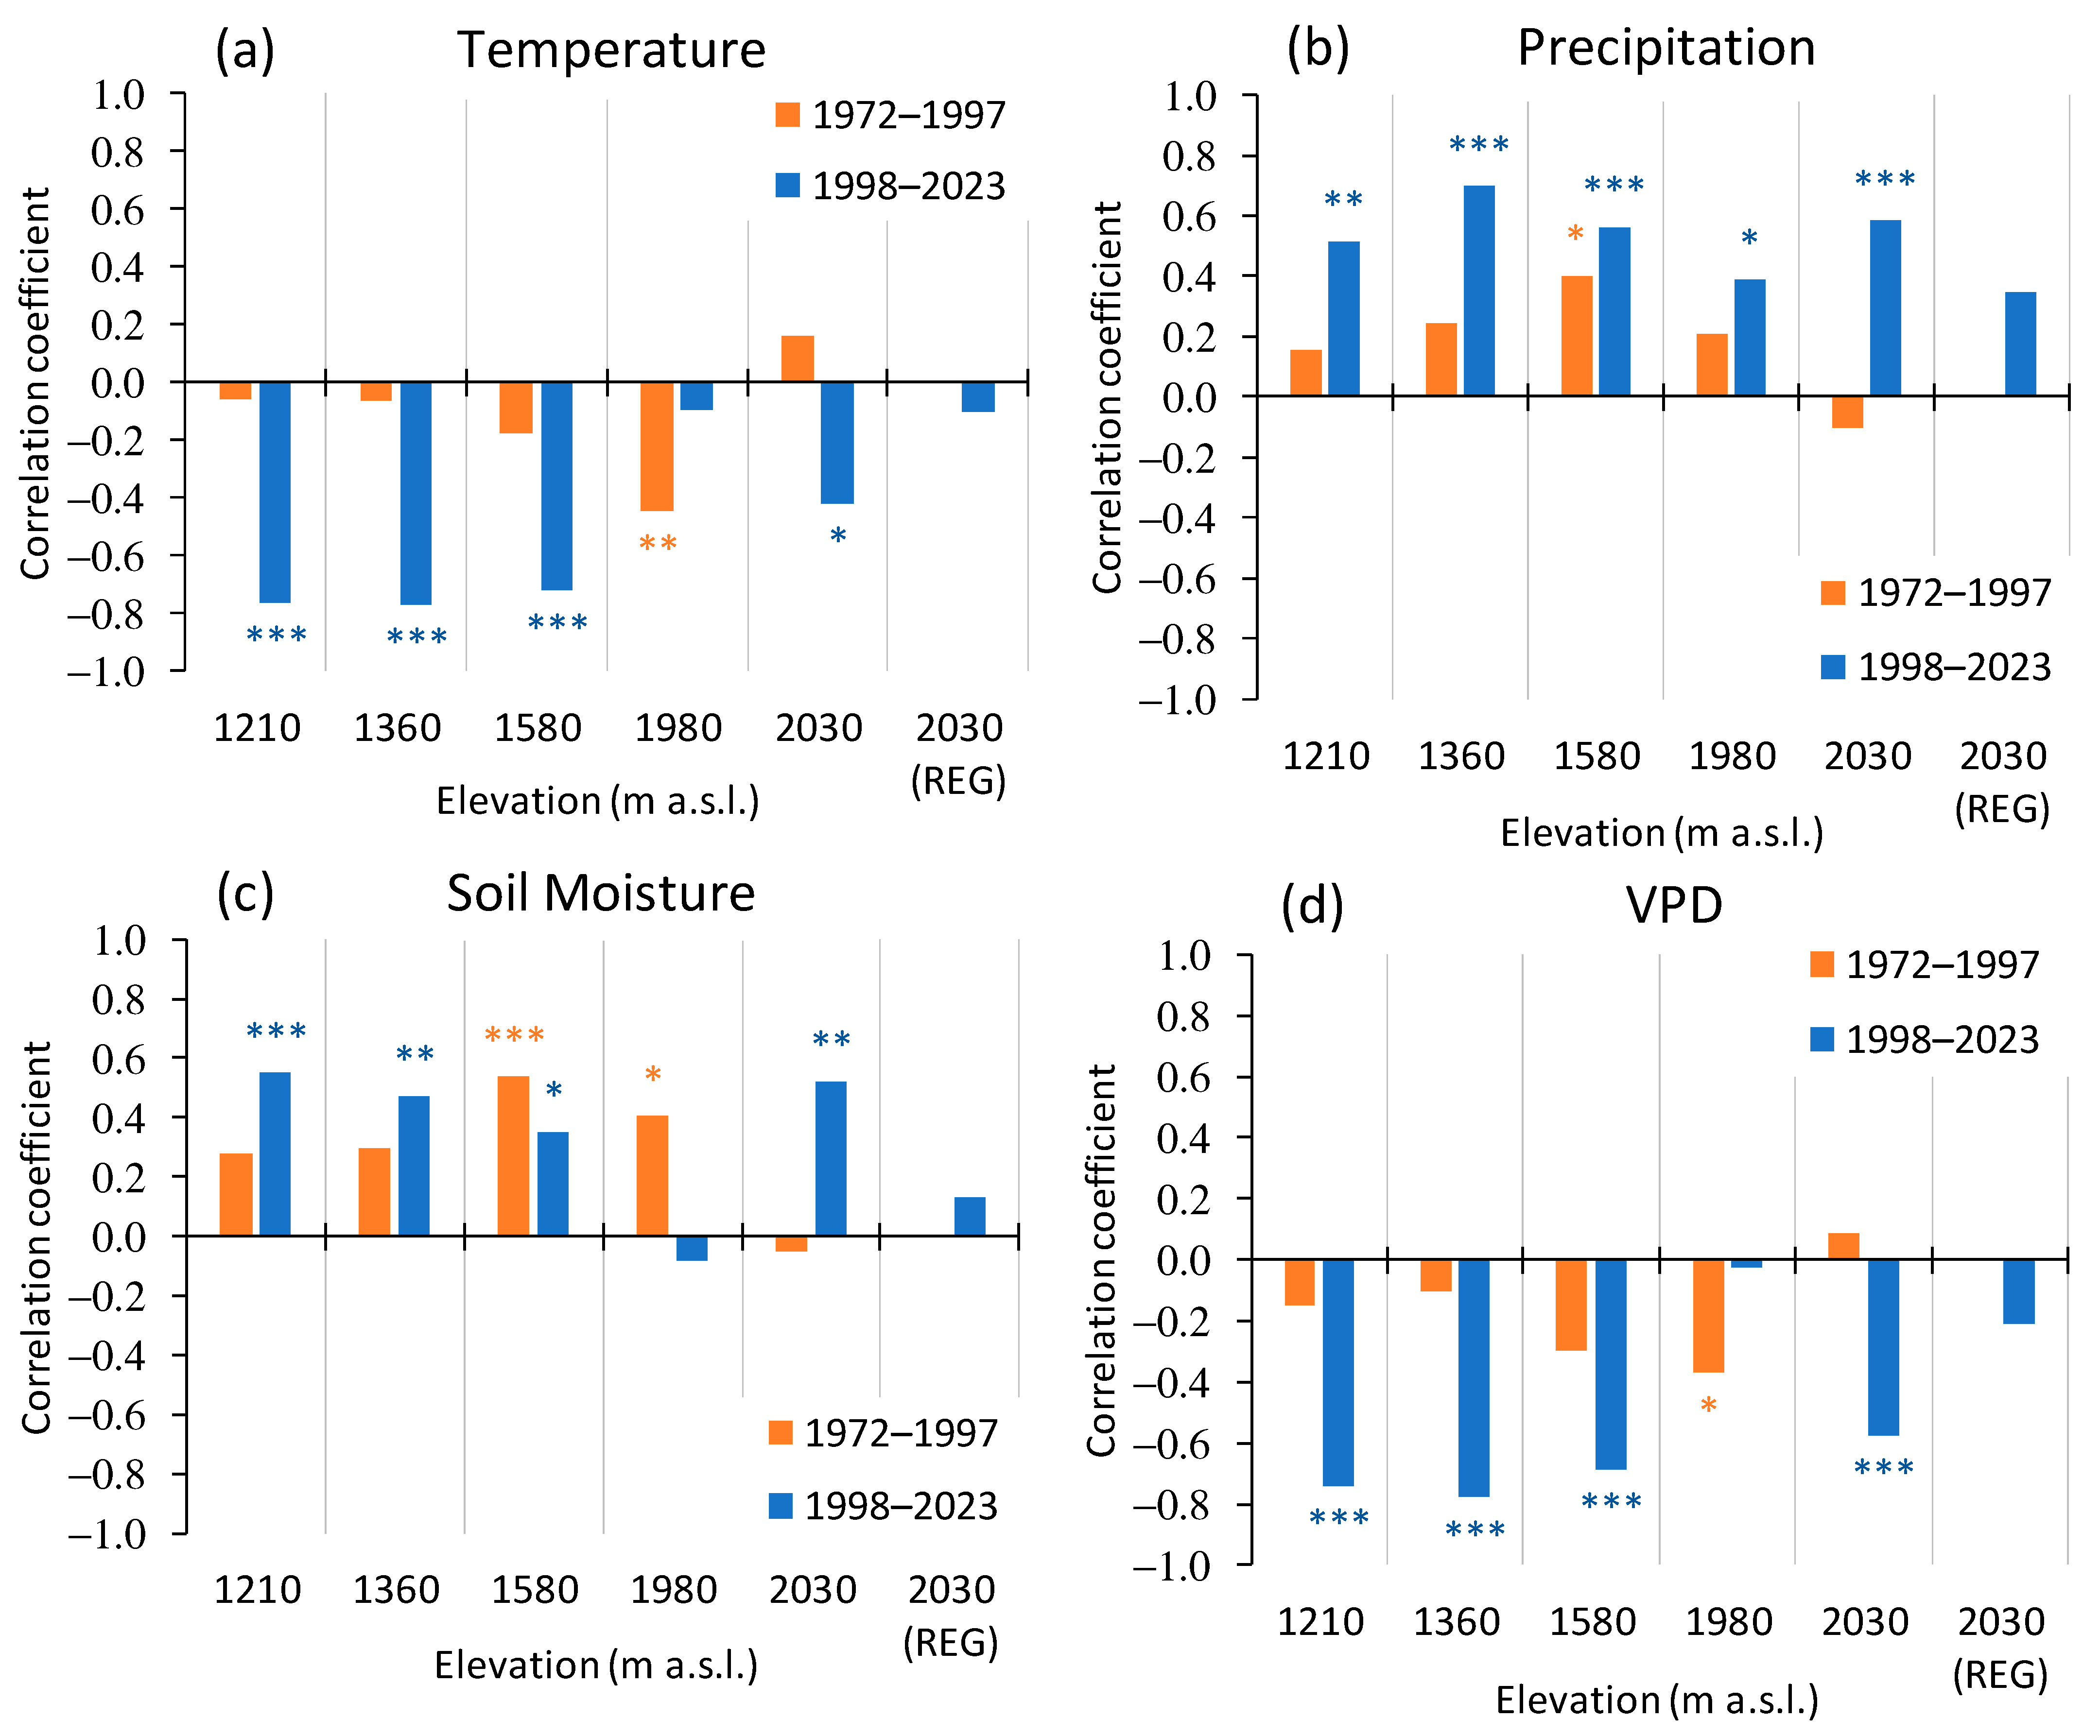
3.3.2. Siberian Pine and Larch Growth since the Warming Restart

Here, we focused on the comparative analysis of trees’ growth within different elevation belts before and after the warming restart, i.e., from 1972 to 1997 (Figure 2a) and over a similar interval (1998–2023).
Siberian pine’s sensitivity to moisture conditions (precipitation, VPD, and soil moisture) increased since the warming restart in almost all elevation belts. In the treeline ecotone, Siberian pine became sensitive to precipitations, soil moisture, and VPD. In addition, the GI dependence on temperature switched from positive to negative (or to neutral for regeneration) since the warming restart (Figure 6a). At low elevations (below ca. 1600 m), the negative growth reaction to warming increased (Figure 6a).
The warming restart caused an increased negative influence of air temperature on the larch growth within low elevations, whereas at high-elevations, i.e., in the area of sufficient precipitation, warming led to a larch growth increase (Figure 7a). In the elevations with low moisture supply, larch growth dependence on the precipitation increased, whereas in high elevations, a negative influence of precipitation was observed (Figure 7b). There were no significant changes found for the soil moisture content and VPD (Figure 7c,d). Within the timberline (elevation 2000 m), the growth dependence on soil moisture was influenced by the effect of snow accumulation that delayed the beginning of the growing season.
The negative larch growth reaction to precipitation and soil moisture and the positive one with VPD in the high elevations should be associated with an excessive moisture supply at high elevations. Meanwhile, in the forest-steppe (elevation 1090 m), in the area with a minimal moisture supply, larch growth is strongly limited by elevated air temperature and increasing soil and atmospheric droughts (the latter is indicated by VPD).
Remarkable, both tree species depend on soil moisture that accumulated since the last year (September–October) and which has arisen since the warming restart (Figure 8). Earlier, that dependence was observed only for larch trees within the forest-steppe ecotone [22].
Remarkably, there is a negative influence of April–May temperatures on larch and especially Siberian pine trees and regeneration growth since the warming restart at high elevations (Figure 9). Earlier, that effect was insignificant. That effect is related to the warming-driven living tissue activation, whereas water supply is limited by still-frozen soil (see Discussion).

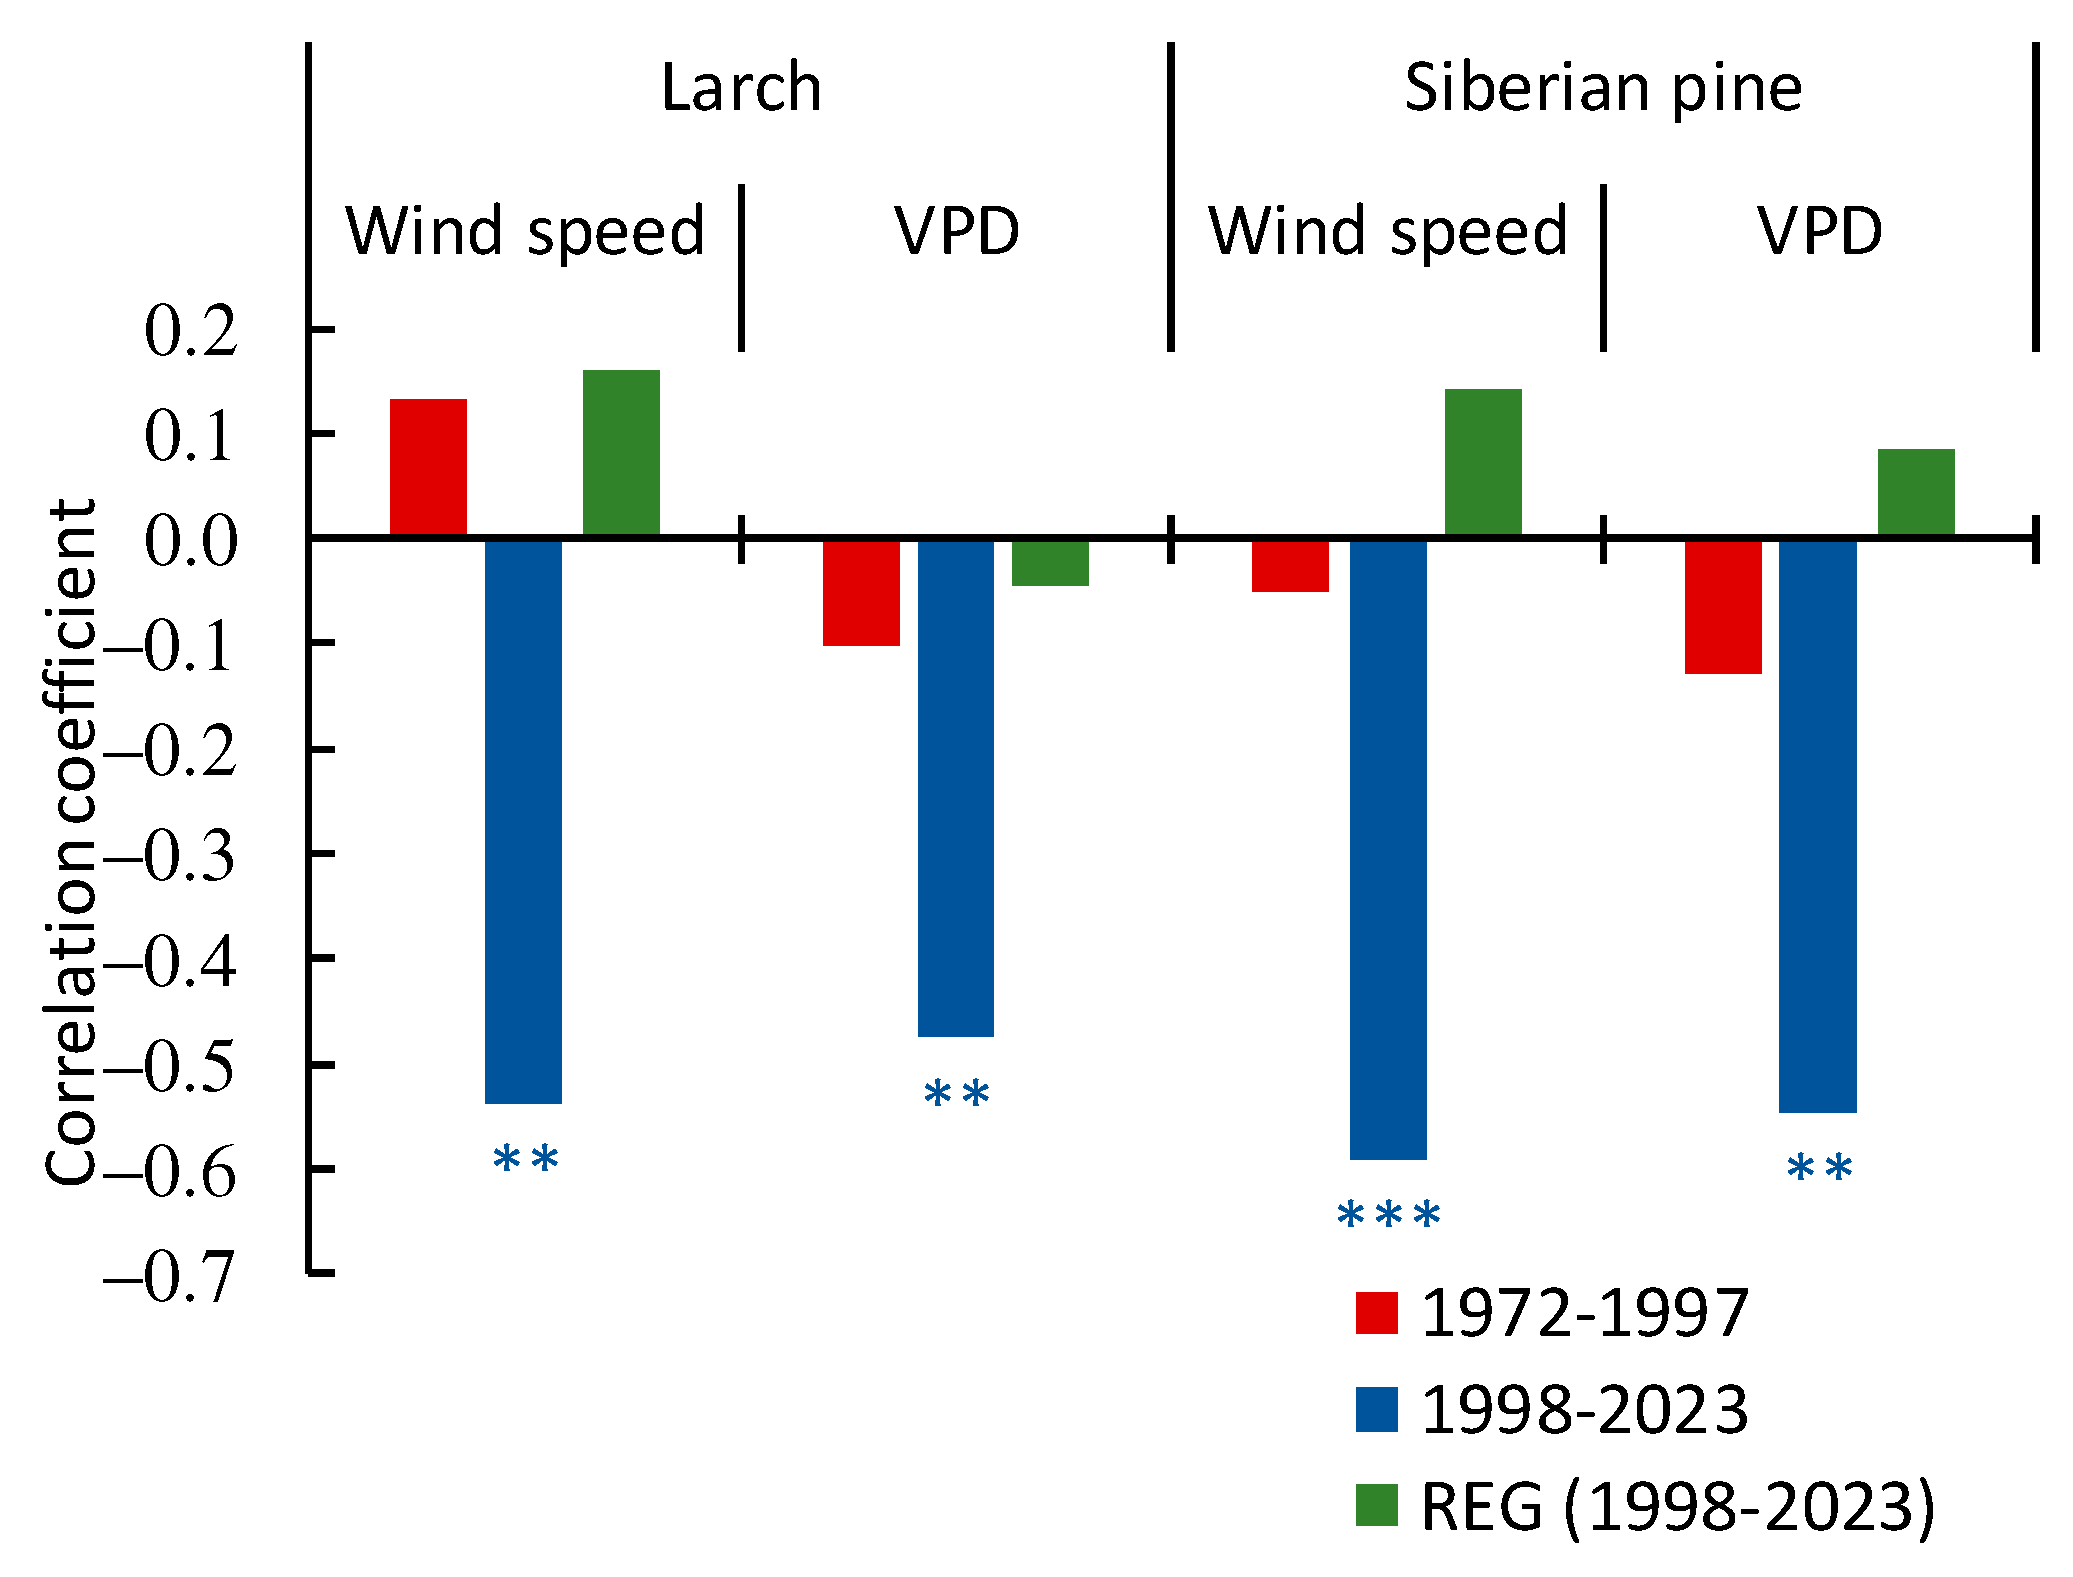
3.3.3. Winter Winds and VPD Influence on the Tree’s Growth

During a cold season (November–March), winter winds as well as VPD suppressed the growth of larch and Siberian pine trees within the treeline ecotone. That occurred since c. 1998, whereas in the previous period (1973–1997), the influences of both winds and VPD were insignificant (Figure 10a,b). An increase in that negative influence coincided with the increase in wind speed and VPD (Figure 2d,e). Notable is the fact that the winds’ influence on the Siberian pine growth was stronger in comparison with larch, which was attributed to the larch’s deciduous pattern. Meanwhile, the regeneration growth of both species was not sensitive to winds or VPD influence.

3.4. The Satellite Data Analysis

3.4.1. The Landsat-Based Analysis along the On-Ground Transect

During the study period (1988–2023), forest loss (Siberian pine mostly) occurred at low elevations (c. <1300 m), whereas forested area gain occurred at high (>2000 m) elevations. Meanwhile, the area of shrublands increased at both high and low elevations (Figure 11). The upper boundary of the closed forests shifted uphill from 2124 to 2153 m a.s.l., or by c. +30 m. For the shrublands, those shifts were from 2273 to 2283 m or by c. +10 m. Thus, the shrubs’ boundary is located about 130 m ahead of the forests. The estimated rates of the uphill migration are 0.8 m/yr. for forests and 0.3 m/yr. for shrubs.

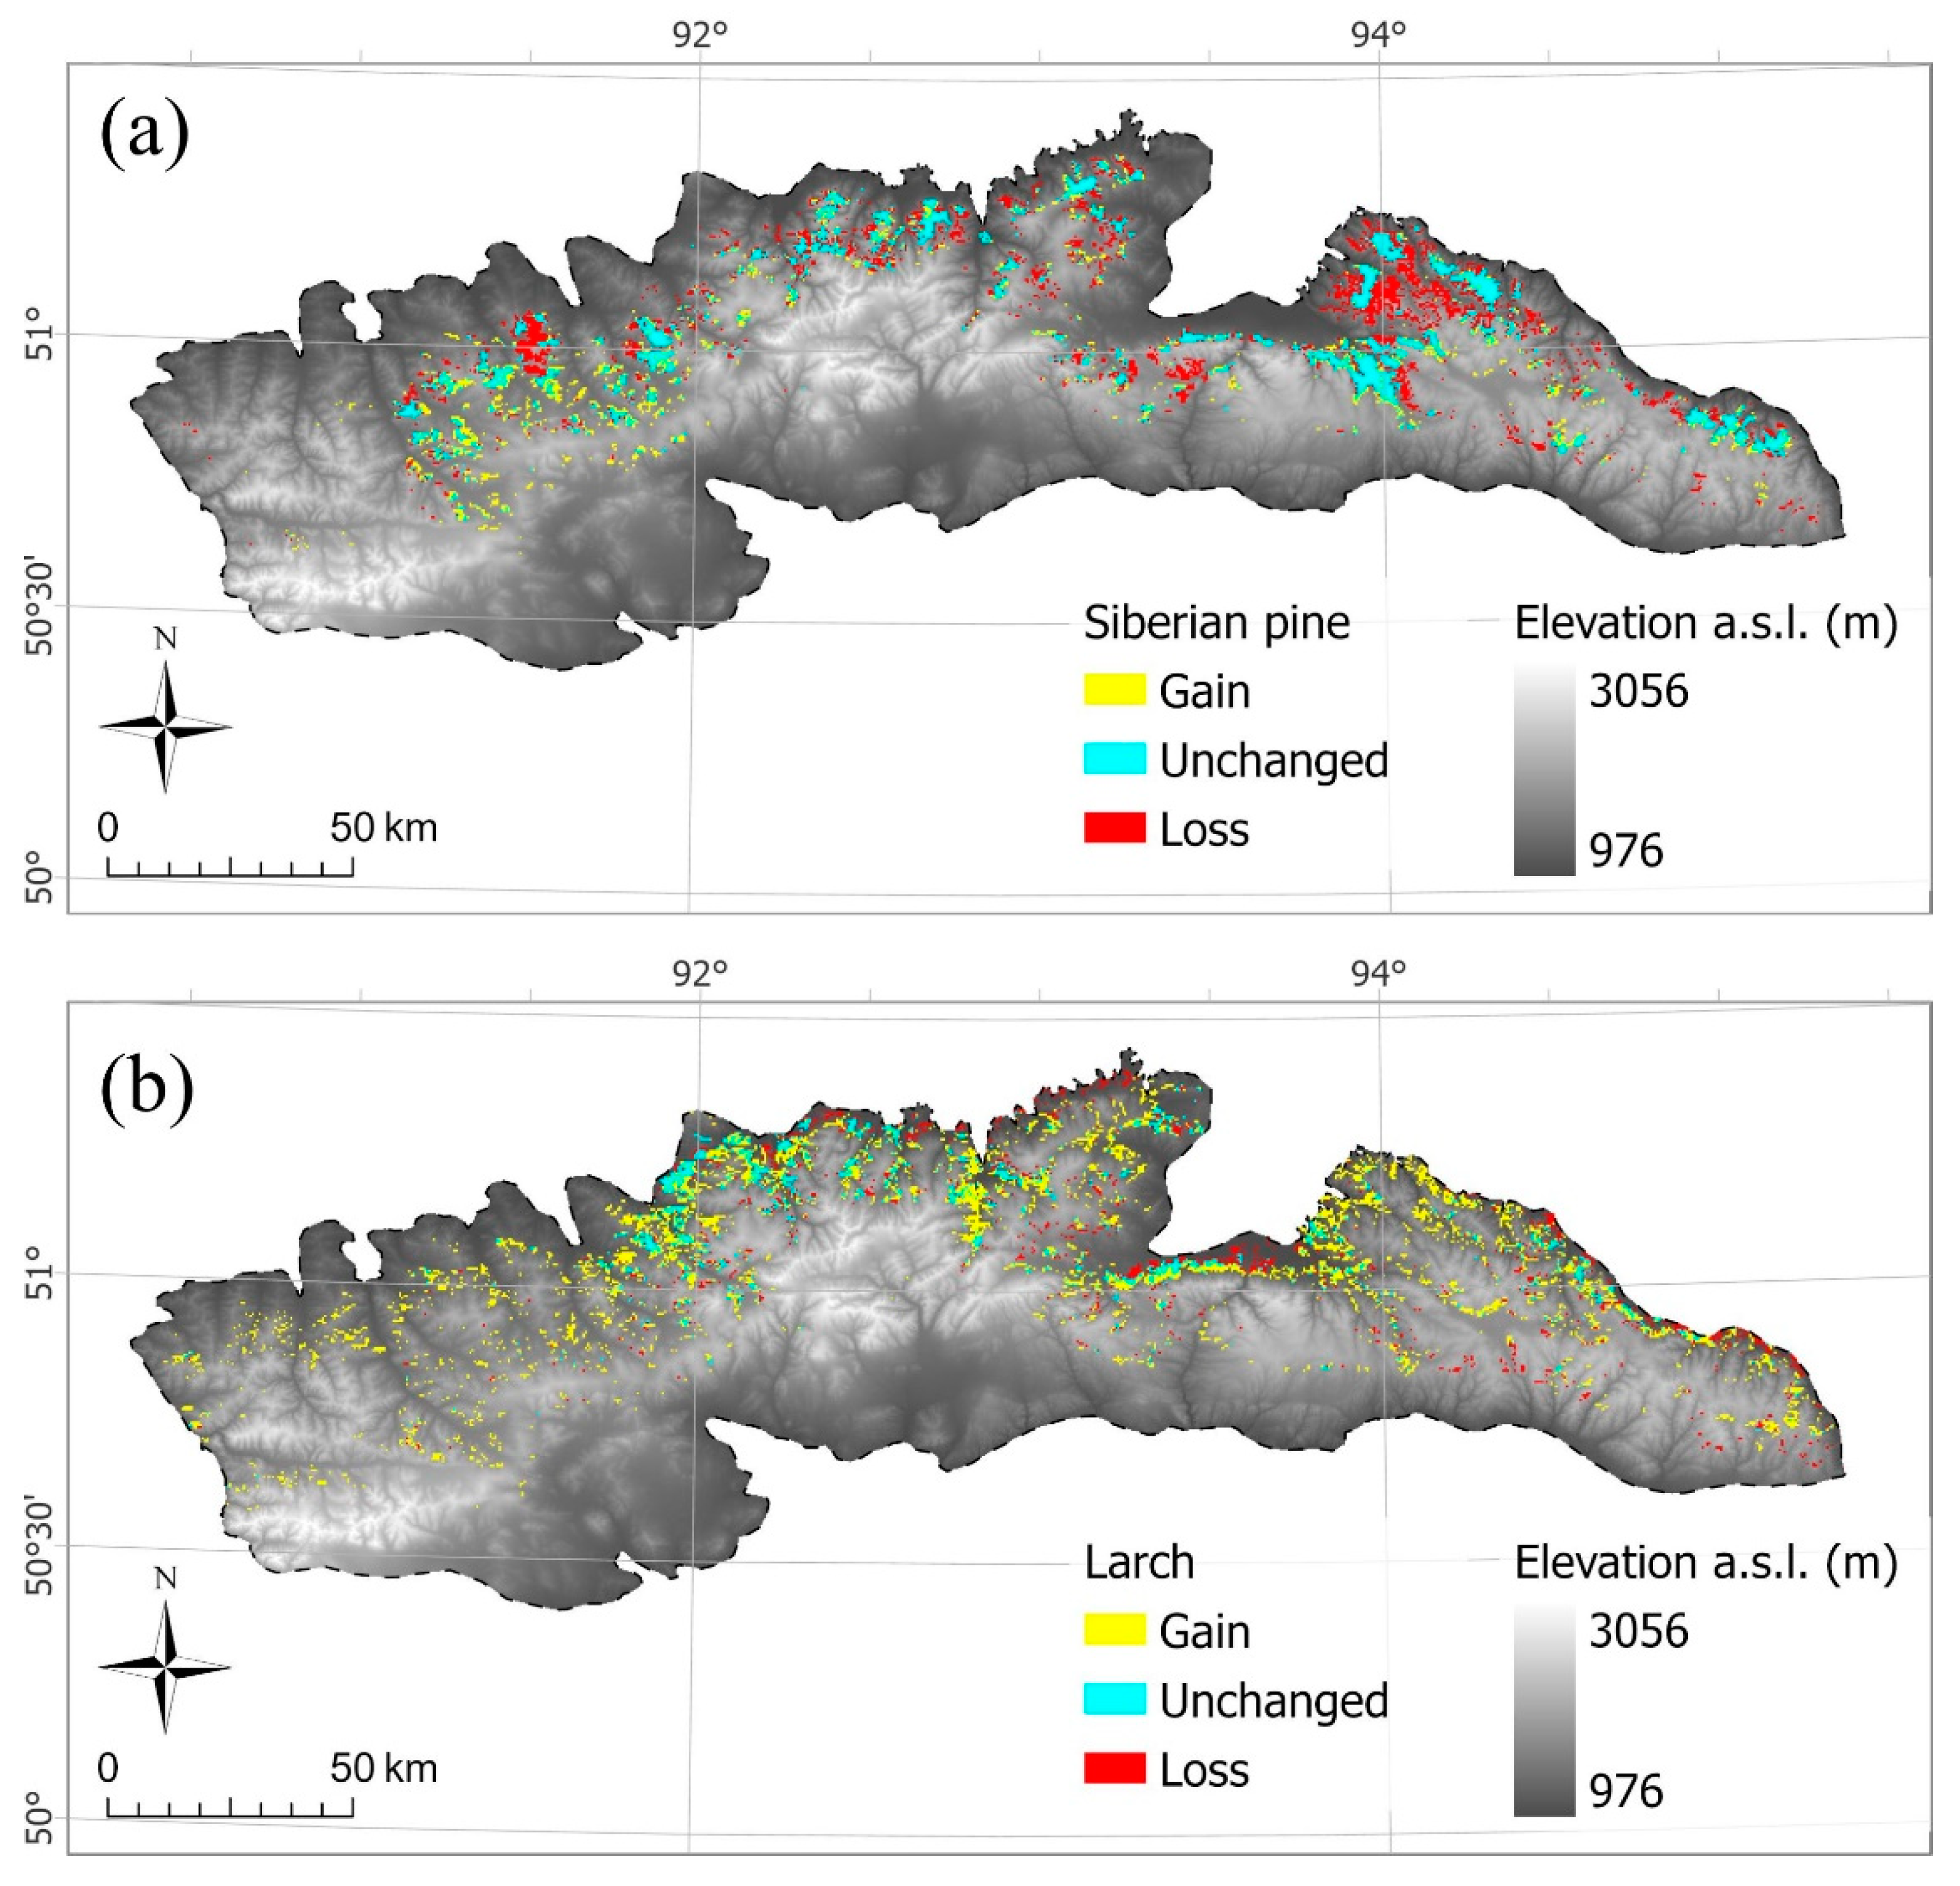
3.4.2. The MODIS-Based Analysis of Land Cover Changes in the Tannu-Ola Ridge

Within the Tannu-Ola Ridge, the majority of changes occurred on the northern megaslope. During 2001–2022, the area of Siberian pine stands decreased by −12% (~142 sq. km) (Figure 12a; Table 4). Siberian pine stands mostly transformed into mixed forests, i.e., the area of forests with dominance of Siberian pine decreased (Table 5). On the contrary, the area of larch forests increased by +147% (~806 sq. km; Figure 12b; Table 4). That increase was caused mostly by the partial transformation of “mixed forests” into larch-dominant ones (Table 5). Siberian pine loss and gain occurred mostly at low and high elevations, respectively, whereas the larch area increase was observed at both high and low elevations. Meanwhile, the area of mixed forests also increased (+15%) due to income from the “shrubs and grasses” class, while “shrubs and grasses” itself decreased by −13% (Table 4 and Table 5). Notable is an increase in the birch stands’ area (+101%). The total area of closed stands increased by +21% (+1486 sq. km), which was caused mostly by the transformation of the “shrubs and grasses” class.

4. Discussion

The Tannu-Ola Ridge, the habitat of Siberian pine and larch, is located within the southern edge of those species’ ranges. The southern territories are occupied by steppe communities with occasional sparse larch stands. Since the warming restart, air temperature during the growing season have strongly increased, which has led to changes in both species’ growth sensitivity to the thermal and moisture variables along the elevation gradient. Rising temperatures have led to the amplification of atmospheric drought, intensified soil drought, and direct effects of heat stress on the trees. In general, growth suppression of both species by air temperature at lower elevations increased, whereas at high elevations, rising temperatures stimulated trees’ growth. In addition, increased sensitivity to the moisture variables increased in all elevations. However, the strength of Siberian pine and larch’s reaction to the warming-drying climate was significantly different along the elevation gradient, as well as the proportion of those species’ areas within the Tannu-Ola Ridge forests.

4.1. General Pattern of Trees Growth along the Elevation Gradient

The growth dependence of both species on the air temperature and moisture variables switches along the elevation gradient. Air temperature negatively influenced Siberian pine growth at low elevations (until c. 2000 m) and stimulated growth at higher elevations. Similarly, growth dependence on VPD switched from negative to insignificant at elevations above >2000 m. A similar switch was reported for this species in the northern part of the Kuznetsk Ala-Tau Mountains [31]. Similarly, an observed decline of fir, a precipitation-sensitive species, in US forests was mediated by moisture availability [42]. The positive influence of precipitation and soil moisture at low elevations changed to insignificant at high (>2000 m) elevations (Figure 4).
An analogous relationship was observed between larch growth and climate variables along the elevation gradient (Figure 5). Within low elevations, larch growth was negatively influenced by VPD, although less so in comparison with Siberian pine. A water stress influence on larch growth was also found in the foothills (within the transition to forest-steppe) in the West Sayan Mountains to the north [22]. Meanwhile, within the timberline and treeline, excessive moisture suppressed larch growth, while Siberian pine growth was insensitive. Generally, the warming restart significantly changed both species’ growth dependence on the hydrothermal variables.

4.2. Siberian Pine and Larch Growth since the Warming Restart

The warming restart significantly modified the dependence of both species’ growth on the air temperature and moisture variables. Alongside that, winter wind speed changes coinciding with the warming restart strongly affected trees’ growth within the treeline ecotone.
Warming within the treeline stimulated the growth increase in both species since the end of the 1990s. Moreover, the growth increase in the treeline was stronger than in lower elevations (Figure 3). That may be attributed to the comparatively low species–species competition for nutrients and light within the sparse treeline communities. However, strong local depressions of the larch growth occurred during recent years. These growth depressions were also observed at lower (up to c. 1600 m) elevations (Figure 3a–c). Those depressions of the GI coincided with the outbreak of the insect defoliator Zeiraphera griseana, a larch tortrix. Defoliation of larch (even complete but single defoliation) did not lead to larch mortality, although it did decrease trees’ growth. Outbreaks of larch tortrix regularly arose at high elevations (>1200 m) [43]. During the considered period of the outbreak within the study site (2020–2022), a megascale outbreak of Zeiraphera griseana occurred also in the larch forests of Middle and Eastern Siberia. The area of that outbreak included larch forests within the huge range from 51° NL in the south to 64° NL in the north and from 92° EL in the west to 130° EL in the east.
Since the warming restart, Siberian pine growth dependence on the moisture variables increased throughout all elevations. Thus, positive correlations with precipitation and soil moisture and negative ones with atmospheric drought (indicated by VPD) strongly increased. A significant negative correlation arose with air temperature throughout all elevations, including the treeline ecotone (Figure 6).
A similar—but stronger—warming restart caused changes in growth–climate variables correlations for the drought-resistant larch. An increased negative influence of air temperature on growth was observed at low elevations, whereas at high elevations, i.e., in the area with sufficient precipitation, warming stimulated growth increase. At the lower elevations, i.e., the zone with a lower moisture supply, a positive dependence on the precipitation increased. However, at the high elevations, negative correlations with precipitation arose, and an increase in the positive correlation with VPD was observed. That effect is related to excessive moistening at high elevations. A similar negative influence of over-moistening on larch growth was reported for the wetlands [21]. Meanwhile, in the area with minimal moisture supply, i.e., a forest-steppe ecotone, larch growth was strongly limited by moisture variables as well as rising air temperature (Figure 7).
The rising air temperature since the warming restart led to the rise in both tree species’ dependence on soil moisture stored during the fall (September–October) of the previous year (Figure 8). A similar earlier dependence was reported for larch trees only within the forest-steppe ecotone [22]. Notably, Siberian pine positively responded to the restored soil moisture within all elevation belts, whereas larch responded mostly at low elevations. The strong dependence of larch regeneration on the stored moisture is explained by the shallow root system of the seedlings.

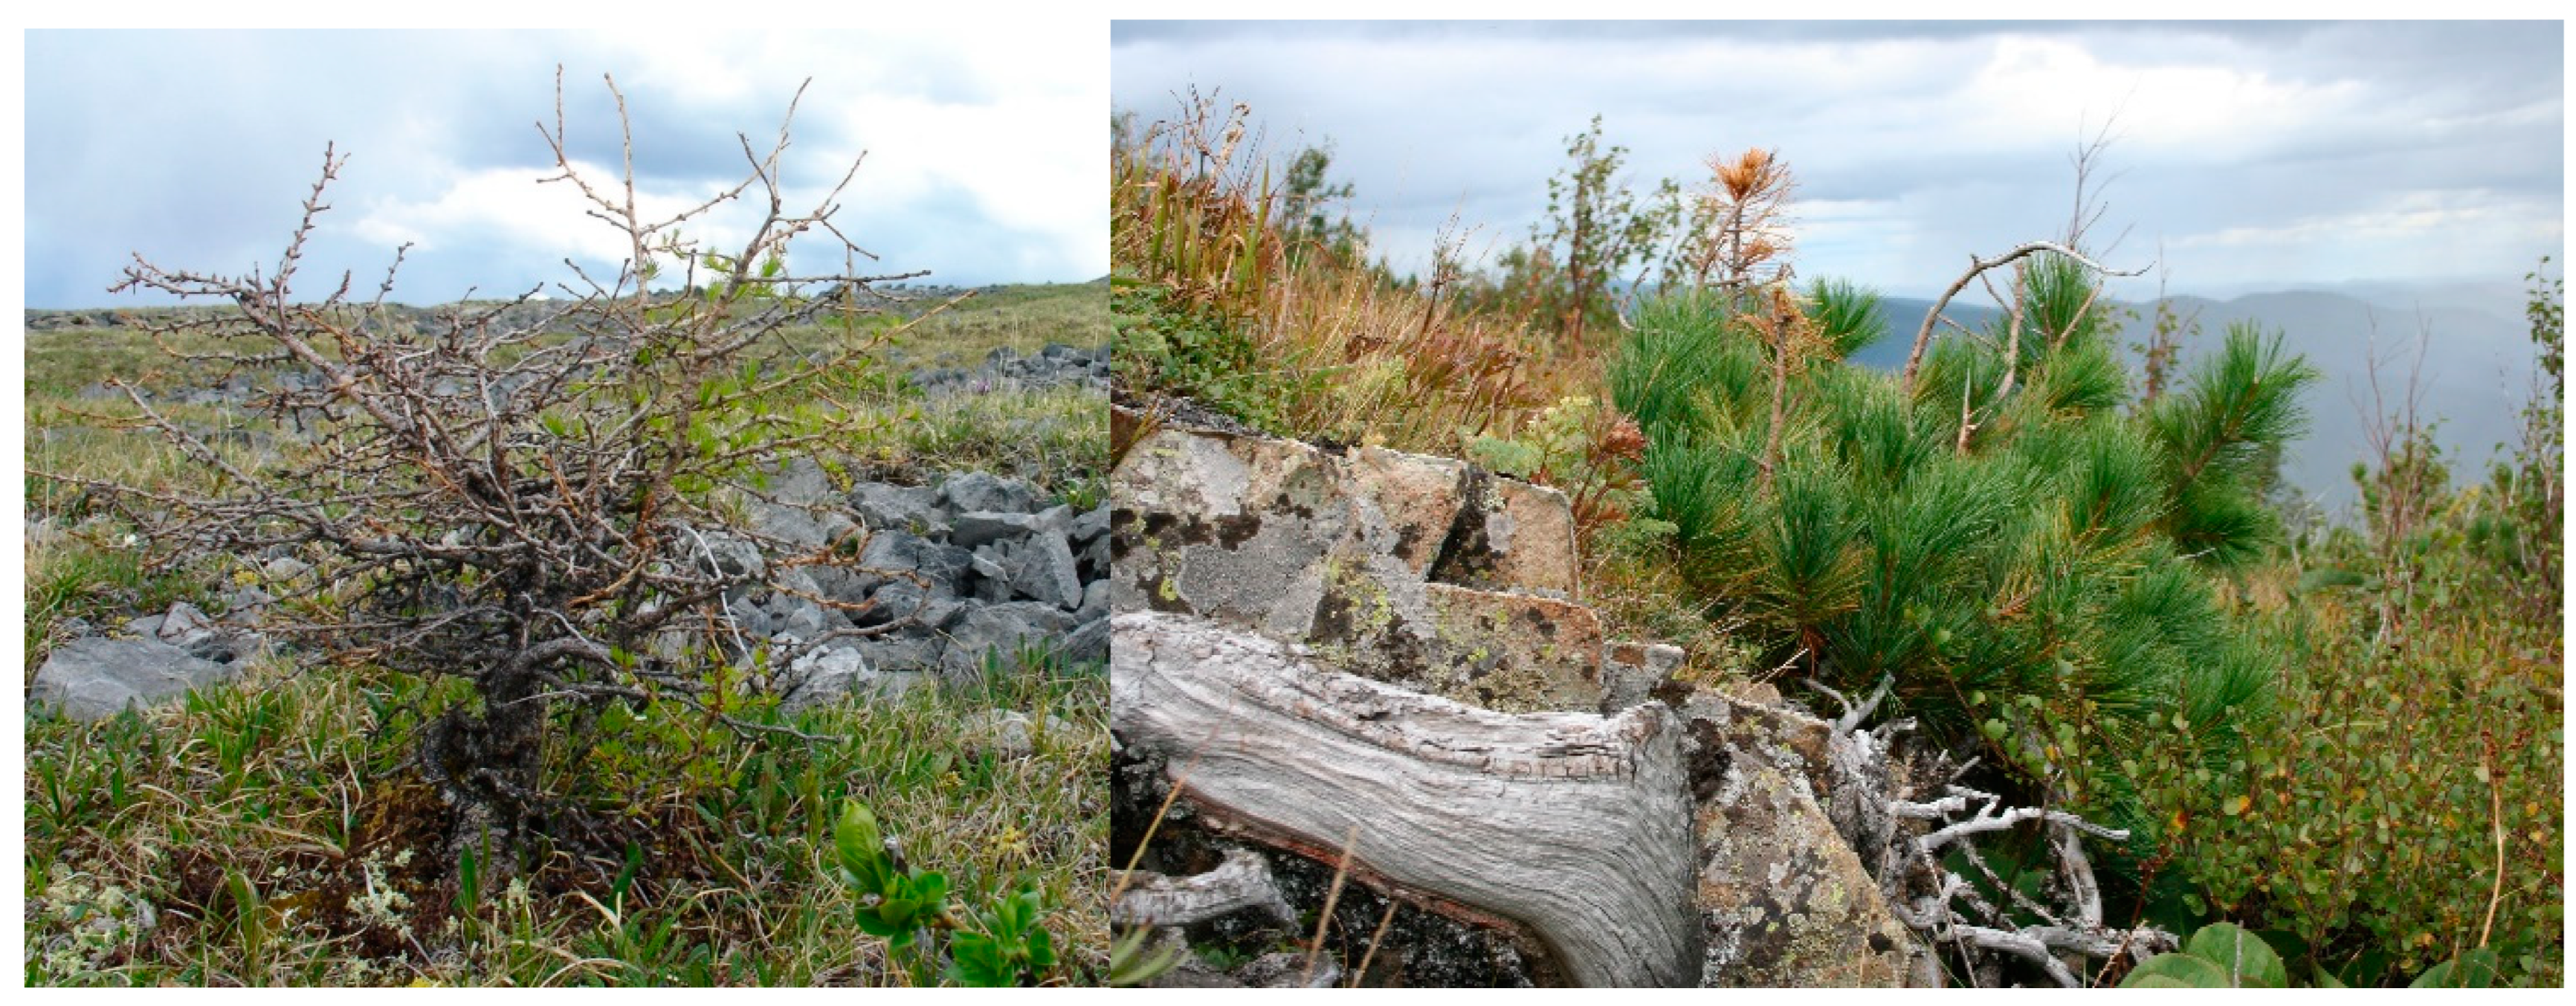
4.2.1. Siberian Pine and Larch Regeneration

It is remarkable that larch regeneration abounded within the forest-steppe ecotone (c. 22,000 trees/ha) and was comparatively high (1300 trees/ha) within the treeline ecotone (Table 1). Meanwhile, in the mixed forests, larch regeneration de facto is absent. It is known that larch, as a light-sensitive species, regenerates poorly under the canopy, whereas it regenerates successfully within open areas, including burns [22]. Meanwhile, Siberian pine, as a shade-tolerant species, regenerates successfully under the mother canopy (700–1100 trees/ha) as well as in the treeline ecotone (1100/ha, Table 1). We also observed, though did not quantitatively measure, an uphill migration of larch and Siberian pine regeneration. However, under a similar habitat in Siberia, the mean uphill rate of treeline migration was about 0.2 m yr –1–0.5 m yr –1 [44]. Those values are within the range of trees’ upslope climbing rates reported in Europe, Northern America, the Himalayas, and northern Chinese mountains [45,46,47,48].

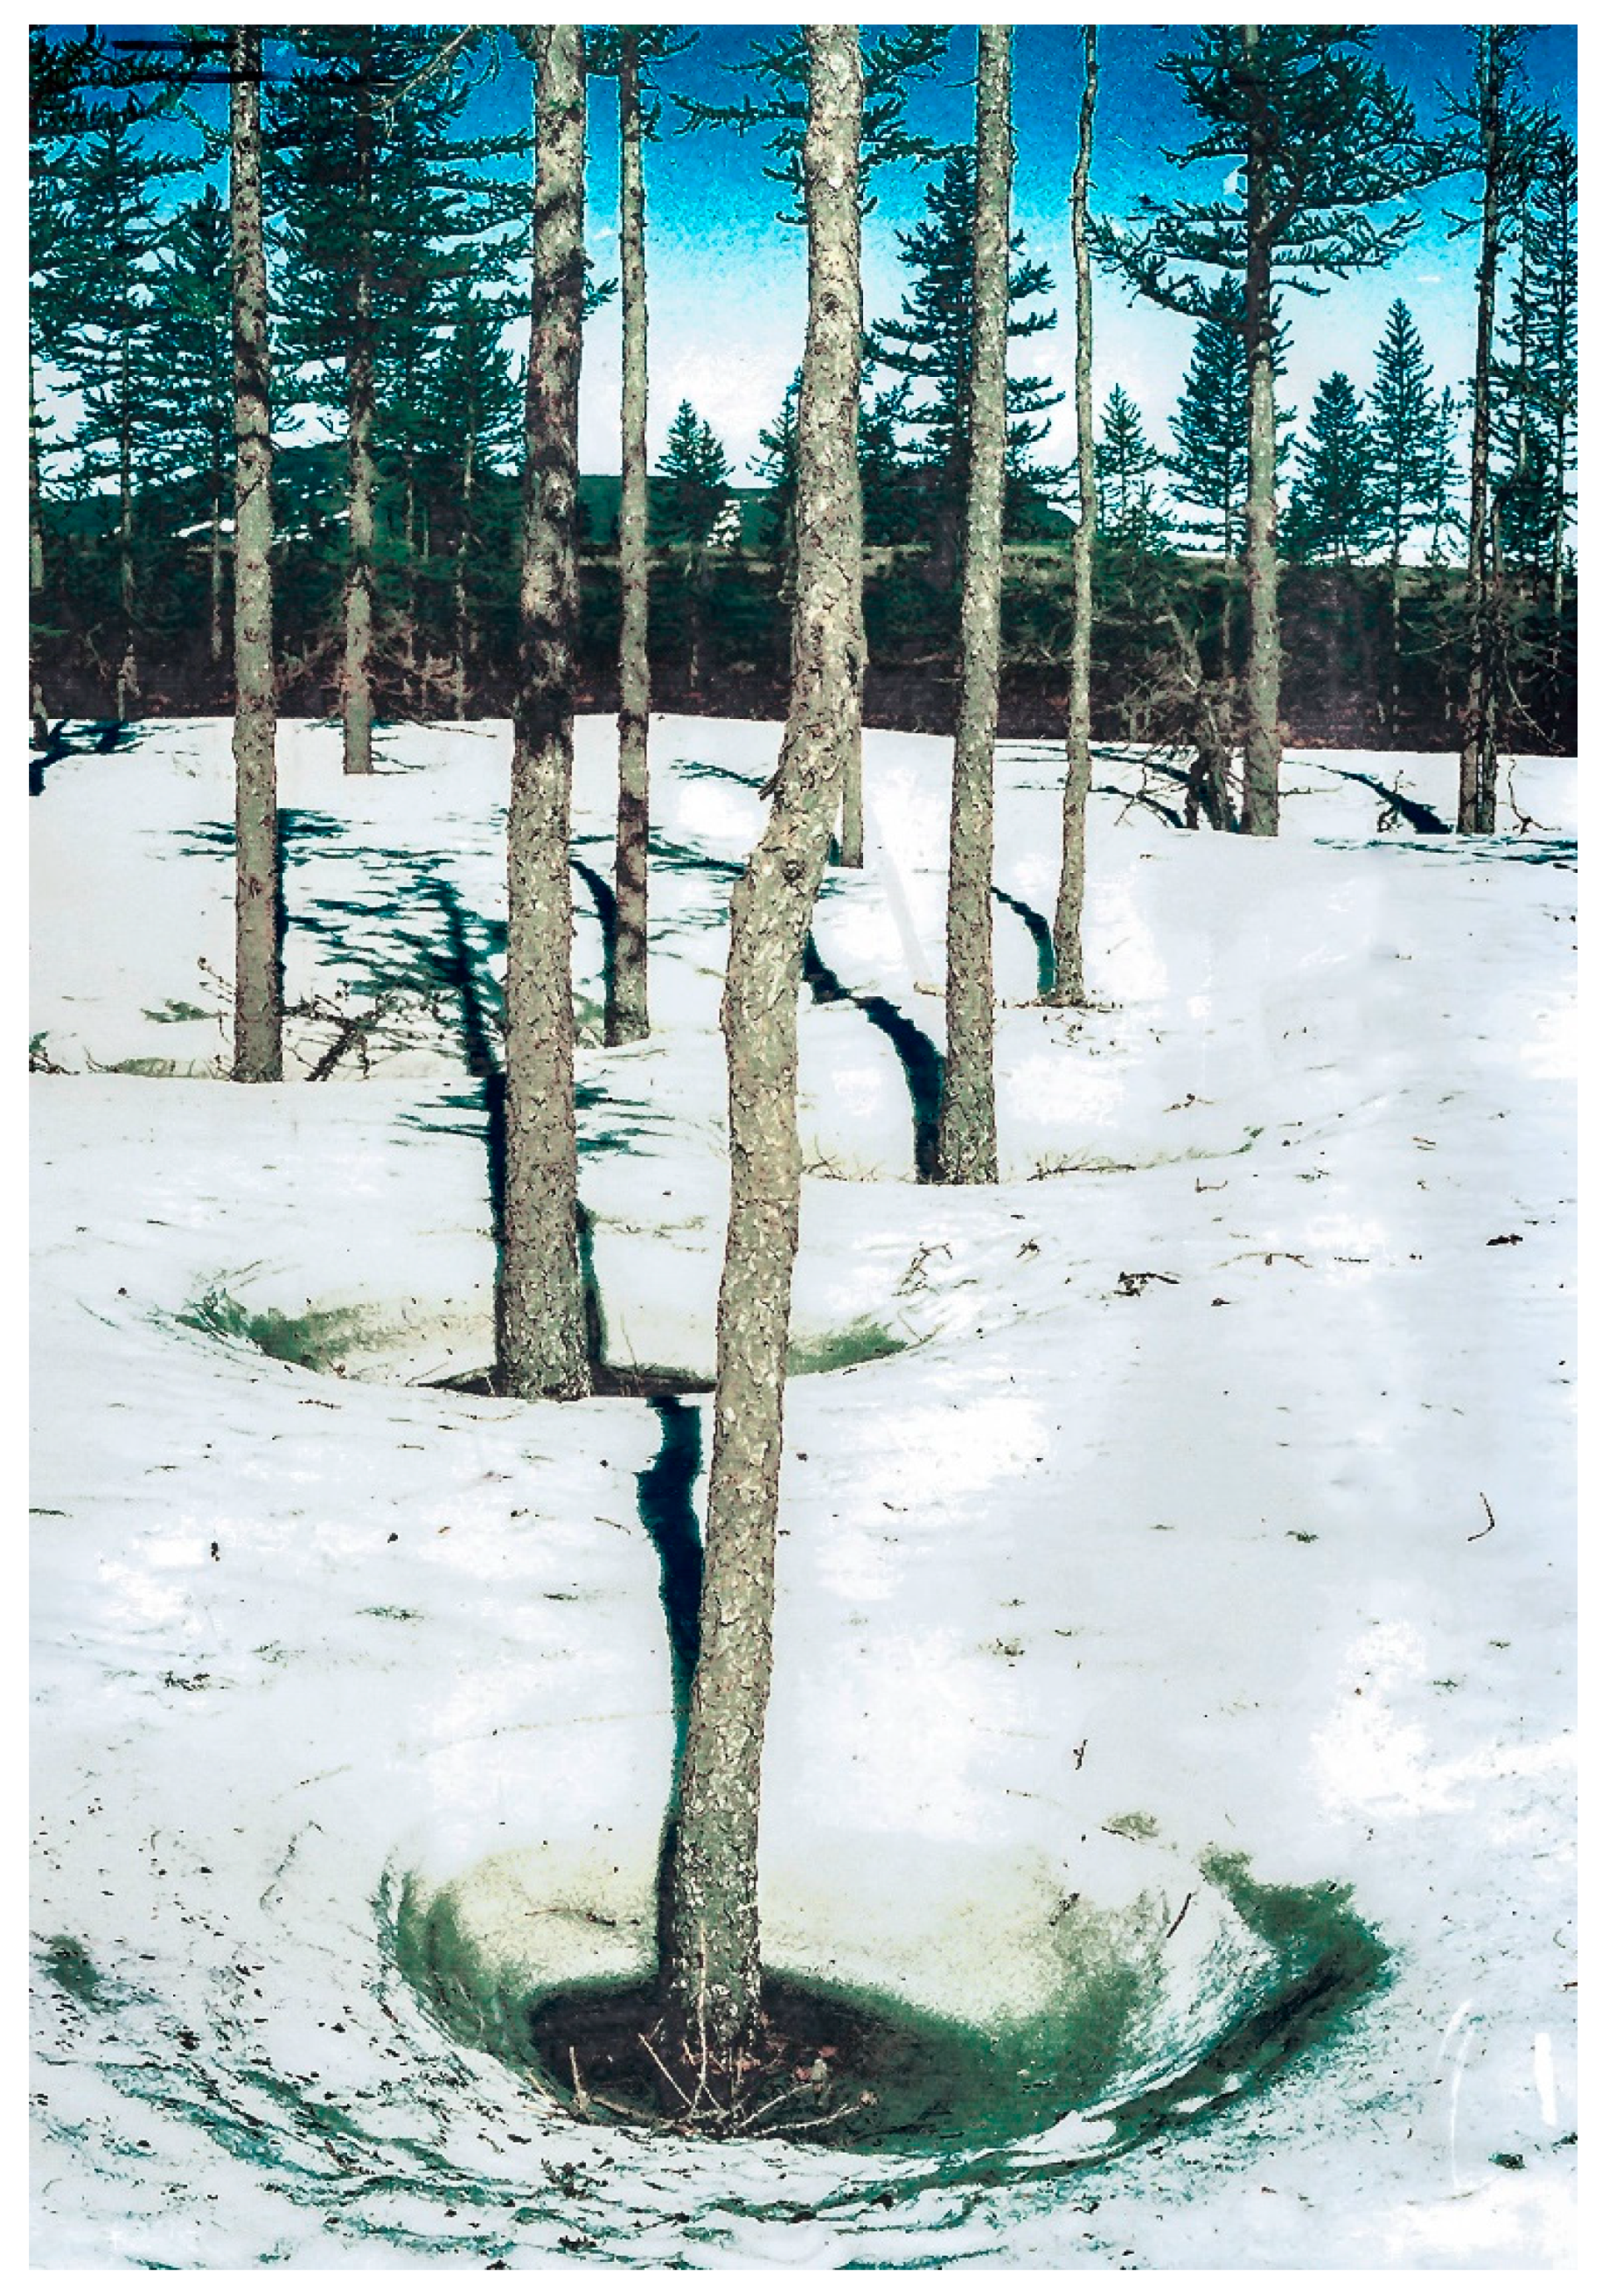
4.2.2. Winter Winds and VPD Influence on the Trees and Regeneration

Winter winds play a notable role within the treeline ecotone by influencing trees’ growth and trees’ physiognomy (i.e., mat and krummholz formation) as well as treeline upslope shift [44,45,46,49]. We found that winter winds (i.e., NDJFM), together with VPD, suppressed the growth of larch and Siberian pine in the treeline. Notably, trees’ growth in mixewoods or the forest-steppe ecotone was not sensitive to the winds. An increased adverse influence of both factors coincided with a period of increase in wind speeds at the end of the 1990s. The combined effect of wind speed and VPD led to an increase in desiccation. Larch is comparatively less influenced by winds and VPD due to its deciduous pattern. Larch also rarely can be found in prostrate and krummholz forms. It also is advancing uphill ahead of Siberian pine.
Meanwhile, the regeneration growth of both species was not sensitive to the wind and VPD influences because it is sheltered by deep snow cover. The regeneration height was c. 1.2 m, whereas snow depth regularly exceeds 2.0 m on the leeward slopes. However, in the areas with low snow cover, regeneration of both species experienced growth suppression and physiognomy changes (i.e., mat and krummholz forms, Figure 13).
The warming-driven growth increase is accompanied by the transformation of the krummholz form into the vertical form described earlier [45,46,50]. Since the trees’ height surpassed the height sheltered by snow, trees faced wind-driven desiccation and snow abrasion with consequent growth depression. However, with time, trees often formed clusters (“hedges”) with a streamlined “common crown” that mitigated adverse wind impact. Consequently, in-cluster trees’ growth dependence on the winds’ influences strongly decreased. With habitat improvement (warming, sufficient precipitation), hedges evolve into closed forests [44].

4.2.3. Early Springs Warming Influence on the Tree’s Growth

We found an adverse influence of early spring (April–May) positive air temperatures on Siberian pine and larch’s growth (Figure 9). In fact, the temperature of the sunlit side of the tree bark may exceed ambient temperature by up to +20 °C [51]. Elevated spring temperatures led to living tissues’ activation, with the subsequent tissues’ desiccation caused by lack of water supply from the still-frozen soil. In addition, subsequent frost injuries of living tissues occurred. In extreme cases, larch responded to warming with a “needles flash” while snow had still not melted (Figure 14). That phenomenon was described earlier [45]. However, Siberian pine (and fir, Abies sibirica) current-year shoots and needles could be severely injured during extremely warm springs with following late frosts. Significant negative correlations between trees’ GI and April–May air temperature have arisen since the warming onset, whereas before that, correlations were insignificant.

4.3. Comparative Dynamic of Land Cover Classes in the Tannu-Ola Ridge

During the study period (1988–2023), forest loss (Siberian pine mostly) occurred at low elevations (c. <1300 m), whereas forested area gain occurred at high (>2000 m) elevations. Meanwhile, the area of shrublands increased at both high and low elevations (Figure 11). The upper boundary of the closed forests shifted uphill from 2124 to 2153 m a.s.l., or by c. +30 m. For the shrublands, those shifts were from 2273 to 2283 m or by c. +10 m. Thus, the shrubs’ boundary was located about 130 m ahead of the forest’s. The estimated rates of the uphill migrations are 0.9 m/yr for forests and 0.3 m/yr. for shrubs.
In the 21st century, the area of the Siberian pine stands decreased (by −12%), whereas larch stands strongly increased (by c. +140%). Siberian pine loss was caused mostly by the transformation of pine-dominant stands into mixed forests, while the area of larch forest gained from “mixed forests”. Siberian pine loss and gain occurred mainly at low and high elevations, respectively, whereas larch area increased at both high and low elevations. Notable, there was a strong increase in birch stands area (+100%). A similar effect, i.e., a species composition change in favor of a drought-tolerant species as the climate water deficit increases, is described in the US Rocky Mountains [52]. It agrees with the reported evidence of climate-driven risks to forest health at the global scale [53]. The increased proportions of drought-resistant larch and comparatively resistant (versus Siberian pine) birch support the hypothesis that in the warming-drying climate, Siberian pine will retreat from the southern edge of its range.
Meanwhile, the total area of closed forests significantly (+20%) increased, and that increase occurred mostly at high (>2000 m) elevations. The upper boundary of the closed forests was migrating uphill at a rate of about 0.8 m/yr. Those values are within the range of trees’ upslope climbing rates reported in Europe, Northern America, the Himalayas, northern Chinese mountains [45,46,47,48], and Siberia [44].
Remarkably, the main source of forested area gain is shrubs and grass communities (Table 5). Together with the higher rate of forests’ uphill migration, this indicates a further decrease in the shrubland area due to its transformation into a forested area. However, at the moment, the shrubs’ upper boundary is located >100 m higher in comparison with forests, and shrubification is observed at high elevations.

5. Conclusions

The warming restart stimulated an increased growth of Siberian pine and larch in areas with sufficient precipitation (high elevations and treeline ecotone), whereas warming negatively influenced both species’ growth at low elevations. However, the species’ responses to warming are different. Thus, the Siberian pine’s sensitivity to moisture variables strongly increased. In addition, the growth dependence on temperature switched from positive to negative. Larch growth experienced less significant changes. Larch is migrating in both uphill and downhill directions, while Siberian pine is migrating uphill only. Increasing early spring temperatures decreased both species’ growth, although larch is more predisposed to that because it may “flash needles” while the water supply is still blocked in the frozen soil. Since the warming restart, the growth of both species (especially Siberian pine) became sensitive to soil water that was stored in the previous year. That water smooths the moisture stress at the beginning of the growing season. Siberian pine gradually decreased its proportion in the mixewood (minus 12%), whereas areas of larch and birch strongly increased (plus 150% and 100%, respectively). Forest loss occurred at low elevations (c. <1300 m), whereas forest gain occurred at high (>2000 m) elevations. The upper boundary of forests and shrubs shifted uphill (+30 and +10 m, respectively). The annual upslope migration rates of the closed forests and shrubs are estimated at 0.8 and 0.3 m/yr., respectively. Notably, winter winds suppressed the growth of both larch and Siberian pine trees in the treeline and at high elevations.
In the warming-drying climate, the retraction of Siberian pine (as well as other moisture-sensitive conifers, i.e., Abies sibirica and Picea obovata) in the southern low elevations should be inevitable due to their narrow ecological niches. Consequently, afforestation must not be based on the planting of Siberian pine but on planting drought-tolerant larch species.

Supplementary Materials

The following supporting information can be downloaded at: https://www.mdpi.com/article/10.3390/f15061054/s1, Figure S1: A May-September air temperature strong increase since c. 1997 (arrow) observed occurred throughout Northern Hemisphere.

Author Contributions

Conceptualization, I.A.P. and V.I.K.; methodology, V.I.K. and I.A.P.; validation, V.I.K., A.S.G., S.T.I. and I.A.P.; formal analysis, S.T.I., I.A.P. and A.S.G.; investigation, V.I.K.; S.T.I. and I.A.P.; resources, S.T.I., A.S.S., A.S.G. and S.O.O.; data curation, S.T.I., I.A.P. and A.S.G.; writing—original draft preparation, V.I.K. and I.A.P.; visualization, S.T.I., I.A.P., A.S.G. and A.S.S.; supervision, V.I.K. and I.A.P.; project administration, V.I.K.; funding acquisition, V.I.K. and S.O.O. All authors have read and agreed to the published version of the manuscript.

Funding

The research was funded by the Tomsk State University Development Program («Priority-2030») and Russian Science Foundation (project No. 23-14-20015).

Data Availability Statement

The data presented in this study are openly available: climate data in https://cds.climate.copernicus.eu/cdsapp (accessed on 15 September 2023); SPEI in https://spei.csic.es/map/maps.html (accessed on 15 September 2023).

Conflicts of Interest

The authors declare no conflicts of interest.

References

  1. Allen, C.D.; Macalady, A.K.; Chenchouni, H.; Bachelet, D.; McDowell, N.; Vennetier, M.; Kitzberger, T.; Rigling, A.; Breshears, D.D.; Hogg, E.H.; et al. A global overview of drought and heat-induced tree mortality reveals emerging climate change risks for forests. For. Ecol. Manag. 2009, 259, 660–684. [Google Scholar] [CrossRef]
  2. Allen, C.D.; Breshears, D.D.; McDowell, N.G. On underestimation of global vulnerability to tree mortality and forest die-off from hotter drought in the anthropocene. Ecosphere 2015, 6, 1–55. [Google Scholar] [CrossRef]
  3. Anderegg, W.R.L.; Wu, C.; Acil, N.; Carvalhais, N.; Pugh, T.A.M.; Sadler, J.P.; Seidl, R. A climate risk analysis of Earth’s forests in the 21st century. Science 2022, 377, 1099–1103. [Google Scholar] [CrossRef] [PubMed]
  4. Boonman, C.C.F.; Serra-Diaz, J.M.; Hoeks, S.; Guo, W.-Y.; Enquist, B.J.; Maitner, B.; Malhi, Y.; Merow, C.; Buitenwerf, R.; Svenning, J.-C. More than 17,000 tree species are at risk from rapid global change. Nat. Commun. 2024, 15, 166. [Google Scholar] [CrossRef] [PubMed]
  5. Logan, J.A.; Régnière, J.; Powell, J.A. Assessing the impacts of global warming on forest pest dynamics. Front. Ecol. Environ. 2003, 1, 130–137. [Google Scholar] [CrossRef]
  6. Guarin, A.; Taylor, A.H. Drought triggered tree mortality in mixed conifer forests in Yosemite National Park, California, USA. For. Ecol. Manag. 2005, 218, 229–244. [Google Scholar] [CrossRef]
  7. Redmond, M.D.; Barger, N.N. Tree regeneration following drought- and insect-induced mortality in piñon–juniper woodlands. New Phytol. 2013, 200, 402–412. [Google Scholar] [CrossRef] [PubMed]
  8. Millar, C.I.; Stephenson, N.L. Temperate forest health in an era of emerging megadisturbance. Science 2015, 349, 823–826. [Google Scholar] [CrossRef] [PubMed]
  9. Martínez-Vilalta, J.; Lloret, F.; Breshears, D.D. Drought-induced forest decline: Causes, scope and implications. Biol. Lett. 2012, 8, 689–691. [Google Scholar] [CrossRef]
  10. Neumann, M.; Mues, V.; Moreno, A.; Hasenauer, H.; Seidl, R. Climate variability drives recent tree mortality in Europe. Glob. Change Biol. 2017, 23, 4788–4797. [Google Scholar] [CrossRef]
  11. Yousefpour, R.; Hanewinkel, M.; Le Moguédec, G. Evaluating the suitability of management strategies of pure Norway spruce forests in the black forest area of Southwest Germany for adaptation to or mitigation of climate change. Environ. Manag. 2010, 45, 387–402. [Google Scholar] [CrossRef]
  12. Hlásny, T.; Barka, I.; Kulla, L.; Bucha, T.; Sedmák, R.; Trombik, J. Sustainable forest management in a mountain region in the Central Western Carpathians, northeastern Slovakia: The role of climate change. Reg. Environ. Change 2017, 17, 65–77. [Google Scholar] [CrossRef]
  13. Zamolodchikov, D.G. Evaluation of climate-induced changes in diversity of tree species according to forest fund data records. Biol. Bull. Rev. 2011, 131, 382–392. (In Russian) [Google Scholar]
  14. Goulden, M.L.; Bales, R.C. California forest die-off linked to multi-year deep soil drying in 2012–2015 drought. Nat. Geosci. 2019, 12, 632–637. [Google Scholar] [CrossRef]
  15. Harvey, J.E.; Batllori, E.; Lloret, F.; Aakala, T.; Anderegg, W.R.L.; Aynekulu, E.; Bendixsen, D.P.; Bentouati, A.; Bigler, C.; Burk, C.J.; et al. Forest and woodland replacement patterns following drought-related mortality. Proc. Natl. Acad. Sci. USA 2020, 117, 29720–29729. [Google Scholar] [CrossRef] [PubMed]
  16. Verhoeven, D.; de Boer, W.F.; Henkens, R.J.H.G.; Sass-Klaassena, U.G.W. Water availability as driver of birch mortality in Hustai National Park, Mongolia. Dendrochronologia 2018, 49, 127–133. [Google Scholar] [CrossRef]
  17. Boyd, M.A.; Berner, L.T.; Doak, P.; Goetz, S.J.; Rogers, B.M.; Wagner, D.; Walker, X.J.; Mack, M.C. Impacts of climate and insect herbivory on productivity and physiology of trembling aspen (Populus tremuloides) in Alaskan boreal forests. Environ. Res. Lett. 2019, 14, 085010. [Google Scholar] [CrossRef]
  18. Etzold, S.; Ziemińska, K.; Rohner, B.; Bottero, A.; Bose, A.K.; Ruehr, N.K.; Zingg, A.; Rigling, A. One century of forest monitoring data in Switzerland reveals species—And site-specific trends of climate-induced tree mortality. Front. Plan. Sci. 2019, 10, 307. [Google Scholar] [CrossRef] [PubMed]
  19. Neycken, A.; Scheggia, M.; Bigler, C.; L’evesque, M. Long-term growth decline precedes sudden crown dieback of European beech. Agric. For. Meteorol. 2022, 324, 109103. [Google Scholar] [CrossRef]
  20. Mamet, S.D.; Carissa, D.B.; Andrew, J.T.; Colin, P.L. Shifting global Larix distributions: Northern expansion and southern retraction as species respond to changing climate. J. Biogeogr. 2018, 46, 30–44. [Google Scholar] [CrossRef]
  21. Kharuk, V.I.; Petrov, I.A.; Krivobokov, L.V.; Golyukov, A.S.; Dvinskaya, M.L.; Im, S.T.; Shushpanov, A.S.; Smith, K.T. Larch response to warming in northern Siberia. Reg. Environ. Change 2023, 23, 17. [Google Scholar] [CrossRef]
  22. Kharuk, V.I.; Petrov, I.A.; Golyukov, A.S.; Dvinskaya, M.L.; Im, S.T.; Shushpanov, A.S. Larch growth across thermal and moisture gradients in the Siberian Mountains. J. Mt. Sci. 2023, 20, 101–114. [Google Scholar] [CrossRef]
  23. Kharuk, V.I.; Im, S.T.; Petrov, I.A.; Dvinskaya, M.L.; Shushpanov, A.S.; Golyukov, A.S. Climate-driven conifer mortality in Siberia. Glob. Ecol. Biog. 2021, 30, 543–556. [Google Scholar] [CrossRef]
  24. Shiyatov, S.G.; Terent’ev, M.M.; Fomin, V.V.; Zimmermann, N.E. Altitudinal and horizontal shifts of the upper boundaries of open and closed forests in the Polar Urals in the 20th century. Russ. J Ecol. 2007, 38, 223–227. [Google Scholar] [CrossRef]
  25. Dial, R.J.; Maher, C.T.; Hewitt, R.E.; Sullivan, P.F. Sufficient conditions for rapid range expansion of a boreal conifer. Nature 2022, 608, 546–551. [Google Scholar] [CrossRef] [PubMed]
  26. Wang, Z.; Liu, X.; Penuelas, J.; Camarero, J.J.; Zeng, X.; Liu, X.; Zhao, L.; Xu, G.; Wang, L. Recent shift from dominant nitrogen to CO2 fertilization control on the growth of mature Qinghai spruce in China’s Qilian Mountains. Agric. For. Meteorol. 2023, 343, 109779. [Google Scholar] [CrossRef]
  27. Kloeppel, B.D.; Treichel, I.W.; Kharuk, S.; Gower, S.T. Foliar carbon isotope discrimination in Larix species and sympatric evergreen conifers: A global comparison. Oecologia 1998, 114, 153–159. [Google Scholar] [CrossRef] [PubMed]
  28. Kirdyanov, A.V.; Prokushkin, A.S.; Tabakova, M.A. Tree-ring growth of Gmelin larch under contrasting local conditions in the north of Central Siberia. Dendrochronologia 2013, 31, 114–119. [Google Scholar] [CrossRef]
  29. Raffa, K.F.; Aukema, B.H.; Bentz, B.J.; Carroll, A.L.; Hicke, J.A.; Turner, M.G.; Romme, W.H. Cross-scale drivers of natural disturbances prone to anthropogenic amplification: The dynamics of bark beetle eruptions. BioScience 2008, 58, 501–517. [Google Scholar] [CrossRef]
  30. Kolb, T.E.; Fettig, C.J.; Ayres, M.P.; Bentz, B.J.; Hicke, J.A.; Mathiasen, R.; Stewart, J.E.; Weed, A.S. Observed and anticipated impacts of drought on forest insects and diseases in the United States. For. Ecol. Manag. 2016, 380, 321–324. [Google Scholar] [CrossRef]
  31. Kharuk, V.I.; Petrov, I.A.; Golyukov, A.S.; Im, S.T.; Shushpanov, A.S. Mountain Taiga in a Warming Climate: Contrast of Siberian Pine Growth along an Elevation Gradient. Forests 2024, 15, 50. [Google Scholar] [CrossRef]
  32. Makunina, N.I. Main types of plant communities of the steppe belt of the southern macroslope of the Tannu-Ola ranges. Flora Veg. Asian Russ. 2010, 1, 49–57. (In Russian) [Google Scholar]
  33. Makunina, N.I. Botanical and geographical characteristics of the forest-steppe of the Altai-Sayan Mountain region. Contemp. Probl. Ecol. 2016, 9, 342–348. [Google Scholar] [CrossRef]
  34. Rinn, F. TSAP V 3.6 Reference Manual: Computer Program for Tree-Ring Analysis and Presentation; Frank Rinn Distribution: Heidelberg, Germany, 1996. [Google Scholar]
  35. Holmes, R.L. Computer-assisted quality control in tree-ring dating and measurement. Tree-Ring Bull. 1983, 44, 69–75. [Google Scholar]
  36. Cook, E.R.; Holmes, R.L. Chronology Development, Statistical Analysis. Guide for Computer Program ARSTAN; Laboratory of Tree-Ring Research, The University of Arizona: Tucson, AZ, USA, 1986; pp. 50–65. [Google Scholar]
  37. Speer, J.H. Fundamentals of Tree-Ring Research; University of Arizona Press: Tucson, AZ, USA, 2010. [Google Scholar]
  38. Riano, D.; Chuvieco, E.; Salas, J.; Aguado, I. Assessment of different topographic corrections in Landsat-TM data for mapping vegetation types. IEEE Trans. Geosci. Remote Sens. 2003, 41, 1056–1061. [Google Scholar] [CrossRef]
  39. Tyukavina, A.; Potapov, P.; Hansen, M.C.; Pickens, A.H.; Stehman, S.V.; Turubanova, S.; Parker, D.; Zalles, V.; Lima, A.; Kommareddy, I.; et al. Global Trends of Forest Loss Due to Fire from 2001 to 2019. Front. Remote Sens. 2022, 3, 825190. [Google Scholar] [CrossRef]
  40. Congalton, R.; Green, K. Assessing the Accuracy of Remotely Sensed Data: Principles and Practices, 3rd ed.; CRC Press: Boca Raton, FL, USA, 2019; p. 346. [Google Scholar] [CrossRef]
  41. Sulla-Menashe, D.; Gray, J.M.; Abercrombie, S.P.; Friedl, M.A. Hierarchical mapping of annual global land cover 2001 to present: The MODIS Collection 6 Land Cover product. Remote Sens. Environ. 2019, 222, 183–194. [Google Scholar] [CrossRef]
  42. Stephenson, N.L.; Das, A.J.; Ampersee, N.J.; Bulaon, B.M.; Yee, J.L. Which trees die during drought? The key role of insect host-tree selection. J. Ecol. 2019, 107, 2383–2401. [Google Scholar] [CrossRef]
  43. Vorontsov, A.I. Forest Entomology; Higher School: Moscow, Russia, 1982; 384p. (In Russian) [Google Scholar]
  44. Kharuk, V.I.; Petrov, I.A.; Im, S.T.; Golyukov, A.S.; Dvinskaya, M.L.; Shushpanov, A.S. Tree Clusters Migration into Alpine Tundra, Siberia. J. Mt. Sci. 2022, 19, 3426–3440. [Google Scholar] [CrossRef]
  45. Shiyatov, S.G.; Terent’ev, M.M.; Fomin, V.V. Spatiotemporal dynamics of forest-tundra communities in the Polar Urals. Russ. J. Ecol. 2005, 36, 69–75. [Google Scholar] [CrossRef]
  46. Kullman, L. Tree line population monitoring of Pinus sylvestris in the Swedish Scandes, 1973–2005: Implications for tree line theory and climate change ecology. J. Ecol. 2007, 95, 41–52. [Google Scholar] [CrossRef]
  47. Franke, A.; Feilhauer, H.; Bräuning, A.; Rautio, P.; Braun, M. Remotely sensed estimation of vegetation shifts in the polar and alpine treeline ecotone in Finnish Lapland during the last three decades. For. Ecol. Manag. 2019, 454, 117668. [Google Scholar] [CrossRef]
  48. Lu, X.; Liang, E.; Wang, Y.; Babst, F.; Camarero, J.J. Mountain treelines climb slowly despite rapid climate warming. Glob. Ecol. Biogeogr. 2021, 30, 305–315. [Google Scholar] [CrossRef]
  49. Holtmeier, F.K.; Broll, G. Wind as an ecological agent at treelines in North America, the Alps, and the European subarctic. Phys. Geogr. 2010, 31, 203–233. [Google Scholar] [CrossRef]
  50. Holtmeier, F.K. Mountain Timberlines: Ecology, Patchiness, and Dynamics; Kluwer Academic Publishers: Dordrecht, The Netherlands, 2009; pp. 1–437. [Google Scholar] [CrossRef]
  51. Sakai, A. Temperature fluctuations in wintering trees. Physiol. Plant 1966, 19, 105–114. [Google Scholar] [CrossRef]
  52. Sindewald, L.; Tomback, D. Recruitment at treeline in the Central Rocky Mountains shifts in favor of a drought-tolerant species as climate water deficit increases. In Proceedings of the EGU General Assembly 2024, Vienna, Austria, 14–19 April 2024. EGU24-14114. [Google Scholar] [CrossRef]
  53. Hartmann, H.; Bastos, A.; Das, A.J.; Esquivel-Muelbert, A.; Hammond, W.M.; Martínez-Vilalta, J.; McDowell, N.G.; Powers, J.S.; Pugh, T.A.M.; Ruthrof, K.X.; et al. Climate change risks to global forest health: Emergence of unexpected events of elevated tree mortality worldwide. Annu. Rev. Plant Biol. 2022, 73, 673–702. [Google Scholar] [CrossRef]
Figure 1. (a) The study area location; (b) test plot locations: 1—treeline ecotone (elevation ~2100 m), 2–5—mixed forest (~2000–1200 m), 6—forest-steppe ecotone (~1100 m). The Siberian pine- and larch-dominant stands are marked by red and yellow, respectively, and mixed stands are marked by green.
Forests 15 01054 g001
Figure 2. The dynamics of (a) air temperature, (b) precipitation, (c) soil moisture, (d) drought index SPEI), (e) vapor pressure deficit (VPD), and (f) wind speed. After 1997, the temperature in the growing period significantly increased ((a); mean values indicated by dotted lines (p < 0.05)). Winter wind speed increase coincided with the warming restart (f). Trends are significant at p < 0.05.
Forests 15 01054 g002
Figure 3. Growth index dynamics of Siberian pine and larch trees and regeneration within treeline ecotone (a,b), mixewood (cf), and forest-steppe (g). The significant increase in GI occurred during the last two decades. The local depressions of the larch GI during the years 2020–2022 (ac, indicated with red circles) corresponded with the outbreak of Zeiraphera griseana (a larch tortrix)—a defoliator insect. An anomalously high GI of larch in the forest-steppe during the years 2020–2022 (a red circle on (g)) corresponded to years with anomalously high precipitation. Black arrows (dg) indicate years with minimal values of precipitation and soil moisture content (Figure 2b,c). Grey bars indicate confidence level at p < 0.05.
Forests 15 01054 g003aForests 15 01054 g003b
Figure 4. Spearman’s correlation coefficients between Siberian pine GI and temperature (a), precipitation (a), soil moisture (b) and VPD (b). Along the elevation gradient, air temperature negatively influenced Siberian pine growth at low elevations (until c. 2000 m) and stimulated growth at higher elevations. The dependence of growth on VPD switched from negative to insignificant at elevations above c. >2000 m. The positive influence of precipitation and soil moisture at low elevations changed to insignificant at high (c. >2000 m) elevations. Seasons: temperature—May–August for elevations 1210–1580 and June-August for elevations 1980–2030; precipitation—May–June for elevations 1210–1580 and July-August for elevations 1980–2030; soil moisture—May–July; vapor pressure deficit (VPD)—May–August. REG is regeneration. Significant correlations at p < 0.1, p < 0.05, and p < 0.01 are indicated by one (*), two (**), and three (***) asterisks, correspondingly. The study period was 1965–2023.
Forests 15 01054 g004
Figure 5. Spearman’s correlation coefficients between larch GI and temperature (a), precipitation (a), soil moisture (b) and VPD (b). Air temperature negatively influenced larch growth at low elevations (until c. 2000 m) and stimulated growth at higher elevations. The growth dependence on VPD switched from negative to positive at elevations above c. >2000 m. The positive influence of precipitation and soil moisture at low elevations changed to negative at high (>2000 m) elevations. Seasons: air temperature—May–July for elevations 1210–1580 and June for elevations 1980–2030; VPD—June–July; precipitation—April–June; soil moisture—June–July. REG is regeneration. Significant correlations at p < 0.1, p < 0.05, and p < 0.01 are indicated by one (*), two (**), and three (***) asterisks, correspondingly. The study period was 1965–2023.
Forests 15 01054 g005
Figure 6. Since the warming restart, correlations between Siberian pine growth and (a) air temperature and (d) VPD have become significantly negative, whereas correlations with precipitation (b) and soil moisture (c) have become significantly positive. The growth dependence on the climate variables within the timberline zone (elevation 1980 m) is influenced by the effect of snow accumulation. Seasons: temperature—May–August in elevations 1210–1580 and June–August for elevations 1980–2030; VPD—May–August; precipitation—May–June for elevations 1210–1580 m and July–August for elevations 1980–2030; soil moisture—May–July. REG is regeneration. Significant correlations at p < 0.1, p < 0.05, and p < 0.01 are indicated by one (*), two (**), and three (***) asterisks, correspondingly. Study periods are 1972–1997 and 1998–2023.
Forests 15 01054 g006
Figure 7. Since the warming restart, negative correlations between larch growth and air temperature increased within low elevations, whereas positive correlations increased at high elevations (a). On the opposite, positive correlations with precipitation increased at low elevations, whereas negative ones occurred at high elevations (b). As for soil moisture and VPD, no significant changes occurred (c,d). Seasons: temperature—May–July for elevations 1210–1580 and June for elevations 1980–2030; precipitation—April–June; soil moisture—June–July; VPD—June–July. The growth dependence on the climate variables within the timberline zone (elevation 1980 m) is influenced by the effect of snow accumulation. REG means regeneration. Significant correlations at p < 0.1, p < 0.05, and p < 0.01 are indicated by one (*), two (**), and three (***) asterisks, correspondingly. Study periods are 1972–1997 and 1998–2023.
Forests 15 01054 g007
Figure 8. Since the warming restart, the growth of both (a) Siberian pine and (b) larch began to depend on moisture that was stored in the soil during the previous year (September–October). The growth dependence on climate variables within the timberline zone (elevation 2000 m) is influenced by the effect of snow accumulation. REG is regeneration. Significant correlations at p < 0.1, p < 0.05, and p < 0.01 are indicated by one (*), two (**), and three (***) asterisks, correspondingly. Study periods: 1972–1997 and 1998–2023.
Forests 15 01054 g008
Figure 9. Since the warming restart, the growth of both larch and Siberian pine species within timberline and treeline has been negatively influenced by increasing April–May temperature. REG is regeneration. Significant correlations at p < 0.1 and p < 0.01 are indicated by one (*) and three (***) asterisks, correspondingly. The study period is 2004–2023.
Forests 15 01054 g009
Figure 10. The treeline ecotone. Since 1998, winter (November–March) winds and vapor pressure deficit (VPD) suppressed the growth of larch and Siberian pine, whereas in the previous period (1973–1997), those influences were insignificant. Meanwhile, regeneration (REG) growth of both species was not suppressed. Significant correlations at p < 0.05, and p < 0.01 are indicated by two (**), and three (***) asterisks, correspondingly. Study periods are 1972–1997 and 1998–2023.
Forests 15 01054 g010
Figure 11. Difference (Δ) in areas of forests and shrublands (2023 minus 1988). The forested area increased at high (>2000 m) and decreased at low (<1300 m) elevations. The area of shrublands increased at both high and low elevations.
Forests 15 01054 g011
Figure 12. (a) During 2001–2022, the area of Siberian pine stands decreased by −12% (−142.1 km2), whereas (b) larch stands gained +147% (+805.6 km2). Burned areas were removed.
Forests 15 01054 g012
Figure 13. Krummholz larch and Siberian pine with the signs of desiccation-driven twig mortality.
Forests 15 01054 g013
Figure 14. Larch needles flashed while snow is still not melted.
Forests 15 01054 g014
Table 1. Test plots data.
Test PlotElevation, mCoordinatesCanopy ClosureSpecies CompositionTree SpeciesTree Density, n/haMean Tree’s Height, mMean Tree’s DBH, cmMean Tree’s Age, YearsRegeneration, n/ha
Treeline ecotone
1203050°59′ N
94°23′ E
<0.37P3LLarix sibirica100415801300
Pinus sibirica150525801100
Mixewood
2198051°00′ N
94°23′ E
0.76P4LLarix sibirica50018.5351500
Pinus sibirica40017.53585700
3158051°00′ N
94°26′ E
0.46P4LLarix sibirica25016.5271100
Pinus sibirica40014.53075800
4136051°01′ N
94°29′ E
0.46L4PLarix sibirica50022.5351300
Pinus sibirica40017.530801050
5121051°01′ N
94°31′ E
0.66Ls4PLarix sibirica33017.5251800
Pinus sibirica25017.5281201125
Forest-steppe ecotone
6109051°04′ N
94°36′ E
0.510LLarix sibirica50015305522,000
Note: species composition is a proportion of larch (L) and Siberian pine (P) within the given test site.
Table 2. Descriptive statistics of tree ring chronologies.
Test PlotElevation, mTree SpeciesMean Age, YearsTotal Length of ChronologySample DepthEPSFirst Order AutocorrelationMean Sensitivity
12030
(REG)
Larix sibirica142000–2023260.930.630.26
Pinus sibirica211989–2023250.930.800.20
22030Larix sibirica801798–2023230.970.750.24
Pinus sibirica771894–2023180.950.910.17
31980Larix sibirica1361720–2023200.970.610.19
Pinus sibirica851888–2023170.930.620.12
41580Larix sibirica1111850–2023240.970.590.19
Pinus sibirica731932–2023200.970.630.15
51360Larix sibirica1301793–2023240.980.600.27
Pinus sibirica811886–2023230.960.720.18
61210Larix sibirica1781789–2023210.970.780.22
Pinus sibirica1171812–2023200.960.790.19
71090Larix sibirica551946–2023360.990.550.37
Table 3. Merged IGBP classes used in the spatial analysis.
Class NameMODIS MOD12Q1 IGBP Class NameDescription
1Siberian pine standsEvergreen needleleaf forestsDominated by Siberian pine (tree cover > 60 %)
2Larch standsDeciduous needleleaf forestsDominated by larch
(tree cover > 60 %)
3Birch standsDeciduous broadleaf forestsDominated by birch trees
(tree cover > 60 %)
4Mixed standsMixed forests + woody savannasDominated by neither deciduous nor evergreen (40–60% of each) tree types (tree cover > 60 %)
5Shrubs and grassesClosed and open shrublands + grasslands + permanent wetlandsDominated by shrublands and grasslands
6BackgroundBarren + water bodiesNo vegetation
Table 4. Changes in areas of land cover classes within the Tannu-Ola Ridge determined based on the MCD12Q1 IGBP maps.
Class NameArea in 2001–2003 (sq. km)Area in 2020–2022 (sq. km)Δ (sq. km)Δ (% of 2001–2003)
1Siberian pine stands1235.81093.7−142.1−12
2Larch stands547.31352.9+805.6+147
3Birch stands21.743.5+21.9+101
4Mixed stands5211.76012.2+800.5+15
5Shrubs and grasses11,135.49646.6−1488.8−13
6Background3.46.4+3.0+88
Note: “Shrubs and grasses” class cannot be separated based on the MCD12Q1 IGBP maps.
Table 5. The transformation matrix of the land cover classes during 2001–2022 within the Tannu-Ola Ridge based on the MCD12Q1 IGBP maps. The bold text indicates unchanged areas.
2001–2003Land Cover Area (sq. km)
2020–2022
Siberian Pine StandsLarch StandsBirch StandsMixed StandsShrubs and GrassesBackground
Siberian pine stands713.660.20.0428.533.40.0
Larch stands14.4316.210.9195.310.50.0
Birch stands0.01.59.99.21.10.0
Mixed stands359.7940.721.43730.2159.70.0
Shrubs and grasses6.034.31.31648.99441.53.4
Background0.00.00.00.00.43.0
Disclaimer/Publisher’s Note: The statements, opinions and data contained in all publications are solely those of the individual author(s) and contributor(s) and not of MDPI and/or the editor(s). MDPI and/or the editor(s) disclaim responsibility for any injury to people or property resulting from any ideas, methods, instructions or products referred to in the content.

