Article

Capacity of Forests and Grasslands to Achieve Carbon Neutrality in China

1
State Key Laboratory of Simulation and Regulation of Water Cycle in River Basin, China Institute of Water Resources and Hydropower Research, Beijing 100038, China
2
Institute of Sediment Research, China Institute of Water Resources and Hydropower Research, Beijing 100038, China
3
Economic & Technology Research Institute of State Grid Shandong Electric Power Company, Jinan 250021, China
*
Author to whom correspondence should be addressed.
Forests 2024, 15(6), 1060; https://doi.org/10.3390/f15061060
Submission received: 2 June 2024 / Revised: 16 June 2024 / Accepted: 17 June 2024 / Published: 19 June 2024
(This article belongs to the Section Forest Meteorology and Climate Change)

Abstract

:
Forests and grasslands play an important role in carbon cycling. They not only absorb CO2 from the air through vegetation biomass and soil carbon sinks, but also reduce and control the horizontal transport of soil carbon (i.e., reinforcing soil carbon storage via soil conservation), thus avoiding erosion-induced CO2 emissions. In this study, vegetation biomass and soil carbon sinks, soil carbon reinforcement and reduced carbon emissions via soil conservation by forests and grasslands were quantified on the scale of the whole of China. The analysis was based on the distribution of biomass and the soil carbon pool and soil erosion rates derived from national surveys, as well as carbon density values from field surveys and literature. In 2021, forests and grasslands in China generated 394.18 Mt C/year (y) of steady-state carbon sinks through vertical biomass and soil absorption. The biomass carbon sinks of grasslands, and those of leaves, twigs, flowers and fruits of the forests, were not taken into account when quantifying the stable biomass sink, because they can become net producers of CO2 due to seasonal withering and carryover, or they can form soil organic carbon as potential soil carbon sinks. The amount of horizontal soil carbon reinforcement in China’s forests and grasslands in 2021 was 20.31 Mt C/y, which was positively correlated with the reduction in the water erosion area; consequently, vertical emissions of approximately 14.89–29.78 Mt of CO2 into the atmosphere were avoided. Overall, in 2021, China’s forests and grasslands absorbed atmospheric CO2 and reduced emissions by 1.46–1.47 Gt CO2/y, equivalent to approximately 13% of China’s annual fossil CO2 emissions. This study demonstrates the fact that the adoption of forest and grassland measures sequesters carbon in soil and biota and reduces the risks of CO2 emissions by both vertical and horizontal paths, which is important for achieving carbon neutrality and mitigating climate change.

1. Introduction

Over the past 160 years, the global CO2 concentrations have been rising, primarily due to emissions from the combustion of fossil fuels and cement production. According to the Greenhouse Gas Bulletin [1], the globally averaged CO2 mole fraction in 2021 was approximately 415.7 ± 0.2 µmol-mol−1, 149% of the pre-industrial level. China is the top emitter of CO2 and generates approximately 28% of the global CO2 emissions [2]. Achieving carbon neutrality is therefore crucial for the country’s sustainable development and for global climate change mitigation. According to a recent study, China plays a leading role in greening of the world through land-use management, and alone accounts for 25% of the global net increase in leaf area [3]. Forests and grasslands profoundly alter land use and are the main terrestrial ecosystems, which can not only increase carbon stocks in terrestrial carbon sinks but also reduce the risk of soil carbon transport via soil conservation. They therefore play an essential role in the carbon cycle [4] and their contribution to carbon neutrality is critical.
Carbon sinks of forests and grasslands include vegetation biomass carbon sinks (hereafter referred to as biomass carbon sinks) and soil carbon sinks. Forest and grassland vegetation absorb CO2 for photosynthesis, acting as biomass carbon sinks and producing a significant increase in biomass carbon stocks [5]. Previous quantitative estimations of biomass carbon sinks have mostly been based on biomass and carbon pool surveys, including carbon pools of photosynthetic and non-photosynthetic parts of tree and shrubs, as well as the herb and litter layers and even dead wood [6,7,8]. Vegetation-synthesized carbon can gradually be released into the atmosphere, converting from a net sink to a net source, or form soil organic matter as a potential soil carbon sink, which is especially the case for the litter and dead-wood carbon pools. Only long-term carbon sequestration in biota can mitigate greenhouse gas emissions. In addition, forests and grasslands greatly influence soil carbon net sinks by increasing the addition of soil organic matter and regulating soil respiration. Zhou et al. reported that topsoil in preserved old-growth forests accumulated atmospheric carbon at an unexpectedly high average rate, although the biomass carbon sink of the forests was negligible [9].
The dual role of soil in climate change mitigation is not only to increase soil carbon stocks, but also to conserve existing soil organic carbon stocks, i.e., to avoid carbon loss [10]. For areas affected by erosion, soil organic carbon accumulation would be attenuated by erosion-induced carbon loss [11]. Forest and grasslands enhance surface roughness and reduce the sand-carrying capacity of water flow, preventing the horizontal transport of soil organic carbon and decreasing the soil carbon losses [12]. In a study by Chen et al., the magnitude of soil organic carbon loss was significantly higher in bare plots (14.39%) compared to plots with vegetation cover (3.83%) [13]. Furthermore, soil erosion involves the detachment, breakdown, transport, redistribution and burial of soil carbon, as well as exogenous organic carbon recharge [14], causing a “net source or sink” problem [15]. Although carbon lost through soil erosion replacement may become replenished by root exudates and litterfall through land-use management [16], the formation of soil organic matter/carbon is very slow, and may require scores or even hundreds of years to reach a new equilibrium between soil carbon input and output. During erosion, soil organic carbon is prone to mineralization because of the disintegration of aggregates. Approximately 20% to 40% of emissions are due to the mineralization of the displaced carbon [17,18,19]. Forests and grasslands can effectively control soil organic carbon losses, therefore playing an important role in maintaining and improving soil organic carbon stocks and avoiding atmospheric CO2 concentration increases.
In summary, forests and grasslands can help achieve carbon neutrality through biomass and soil carbon sinks, soil carbon reinforcement via soil conservation, and, consequently, reduced carbon emissions (i.e., avoided emissions). However, current estimates of the capacity and contribution of forests to carbon sequestration only consider their vertical biomass and soil carbon sinks [20,21], and forest and grassland measures to prevent horizontal soil organic carbon transport and vertical carbon emissions remain misunderstood and unquantified. To fill this knowledge gap, it is important to comprehensively consider these roles for forests and grasslands in carbon neutrality.
Since the late 1970s, China has launched nationwide vegetation restoration practices [20], resulting in a significant increase in the carbon pool of China’s forest and grasslands and a substantial reduction in severe erosion. In this study, the stable carbon sinks, as well as soil carbon reinforcement and CO2 emissions which were avoided due to reduced soil erosion, were quantified separately, using a consistent framework. The overall aim was to assess the role of China’s forest and grasslands in carbon neutrality and climate mitigation in recent years.

2. Methods

2.1. Study Disign

The contribution of forests and grasslands to achieving carbon neutrality in 2021 was assessed, based on recent scientific data. The biomass and soil carbon sinks were estimated by the carbon-sink-rate method, which has a high stability and reliability. As biomass and soil carbon accumulation may require some years, the carbon sink rates were calculated using a vegetation and soil-carbon-density database for 2021 and values recorded close to 2019 (the reference year). The soil carbon reinforcement and avoided CO2 emissions were estimated from the reduction in soil erosion derived from national surveys on erosion rates in 2021 and 2020 (reference years).

2.2. Data Source for Estimating the Contribution to Carbon Neutrality

To estimate forest and grassland carbon sinks, the areas of different forest and grassland cover types in 2021 were obtained from a 10 × 10 m data layer derived from national annual dynamic monitoring of soil and water losses, according to their land-cover classification (see Table 1). The dataset of biomass carbon density of forests and grasslands in 2021 and the reference year was built based on national surveys provided by the National Science and Technology Infrastructure of China, and the National Forestry and Grassland Science Data Center [22,23]. The national surveys included spatial position of plot, vegetation type, vegetation biomass, related carbon storage and carbon density. The dataset of soil organic carbon content and soil carbon density of forests and grasslands in 2021 was mainly based on national surveys of the third forest and grassland carbon sink. Peripheral components of soil carbon density were collected from field soil surveys to handle missing values. The field campaign was carried out in 2021 using the method developed by Tang et al. [24]. Sampling was performed at 113 plots across three provinces (35 sites in Fujian, 33 sites in Shanxi, and 45 sites in Shannxi) which have typical forest and grassland cover types. The soil carbon density values of forests and grasslands in the reference year were provided by the National Earth System Science Data Center [25] and from values recorded close to 2019 from the published literature and reports (216 groups of data).
Estimates of soil carbon reinforcement were determined based on polygons generated by overlaying the data layers for water erosion rate and soil organic carbon content in ArcGIS. The total soil carbon reinforcement at the national scale was obtained by summation over all polygons. The water erosion rates in 2021 and the reference year were obtained from 10 × 10 m data layers derived from the national annual dynamic monitoring of soil and water losses, which were calculated using the Chinese Soil Loss Equation (CSLE) [26] on the basis of remote sensing images, field investigation and indoor artificial interpretation in 2021 and 2020, respectively.

2.3. Estimation of Biomass Carbon Sinks

The biomass carbon sink is the change in the stable biomass carbon stock over the study period (from the reference year to 2021). When estimating the annual biomass carbon sink, the contribution of grasslands was not considered, as the carbon sequestrated in biota by grasses could be returned to the atmosphere due to seasonal withering or enter the soil to form soil organic carbon. The biomass carbon sink (FCSB, t C per year, i.e., t C/y) was calculated using the carbon-sink-rate method, as shown in the following equation:
FCS B = k = 1 l FCSQ BR , k · SF Q , k
where k = 1, 2, 3… l represents the forest cover types, including arbor forests, shrublands, orchards (fruit forests, tea plantations and other orchards), and other forests; FCSQBR,k is the biomass carbon-sink rate for forest cover k (t C/(hm2·y)); and SFQ,k is the area of forest cover k (hm2). The FCSQBR,k was obtained using the following equation:
FCSQBR,k = (CB,k − C’B,k)/n
where CB,k and C’B,k are the biomass organic carbon density values for forest cover k in 2021 and the reference year (t C/hm2), respectively; n is the duration (in years).

2.4. Estimation of Soil Carbon Sinks

The forests and grassland soil carbon sink (FCSS, t C/y) was calculated using the carbon-sink-rate method, according to the following equation:
FCS S = k = 1 l FCSQ SR , k · SF Q , k + i = 1 j FCSC SR , i · SF C , i
where k = 1, 2, 3… l represents the forest cover type (the same as mentioned above); i = 1, 2, 3… j represents the grassland type, including natural grasslands, artificial grasslands, and other grasslands; FCSQSR,k is the forest soil carbon-sink rate for forest cover k (t C/(hm2·y); FCSCSR,i and SFC,i are the grassland soil carbon-sink rate (t C/(hm2·y) and area (hm2) for grassland cover i, respectively. The calculation of the soil carbon-sink rate was similar to that of the biomass carbon-sink rate, which was obtained based on the soil carbon density values of different ages:
FCSQSR,k = (CS,k − C’S,k)/n
FCSCSR,i = (CS,I − C’S,i)/n
where CS,k and C’S,k are the soil carbon density values for forest cover k in 2021 and the reference year (t C/hm2), respectively; CS,i and C’S,i are the soil carbon density values for grassland cover i in 2021 and the reference year (t C/hm2), respectively.

2.5. Estimation of Soil Carbon Reinforcement and Avoided CO2 Emissions

Soil carbon reinforcement (FSRE, t C/y) is the reduced horizontal transport of organic carbon via soil conservation by forests and grasslands on the eroded landscape, and was calculated as follows:
FSR E = k = 1 l FSR Q , k + i = 1 j FSR C , i
FSR Q , k = ( RQ k , t 1 AQ k , t 1 RQ k , t 0 AQ k , t 0 ) GF k
FSR C , i = ( RC i , t 1 AC i , t 1 RC i , t 0 AC i , t 0 ) GF i
where k = 1, 2, 3… l and i = 1, 2, 3… j are as mentioned above; t1 and t0 represent the reference year (2020) and 2021, respectively; FSRQ,k is the soil carbon reinforcement for forest cover k (t C/y); FSRC,i is the soil carbon reinforcement for grassland cover i (t C/y); RQk,t1 and RQk,t0 are the soil erosion rates for forest cover k in 2020 and 2021 (t C/(hm2·y)), respectively; RCi,t1 and RCi,t0 are the soil erosion rates for grassland cover i in 2020 and 2021 (t C/(hm2·y)), respectively; AQk,t1 and AQk,t0 are the areas of forest cover k in 2020 and 2021 (hm2·y), respectively; ACi,t1 and ACi,t0 are the areas of grassland cover i in 2020 and 2021 (hm2), respectively; and GFk and GFi are the soil organic carbon content for forest cover k and grassland cover i in 2021 (%), respectively.
Avoided CO2 emissions impede further CO2 emissions via soil carbon reinforcement. The amount of CO2 emissions avoided was calculated by assuming that 20%–40% of erosion-transported soil organic carbon was prevented from being released into the atmosphere (the percentage was derived from previous studies; see Introduction).

2.6. Statistical Analyses

All statistical analyses were conducted using SPSS 22.0. The difference between forest-biomass and soil carbon-sink rates, as well as between forest and grassland-soil carbon-sink rates, was determined using one-way analysis of variance (ANOVA). In all cases, the results were considered statistically significant at p < 0.05. The relationship between soil carbon reinforcement and reduction in water erosion area was assessed using a general linear regression analysis.

3. Results

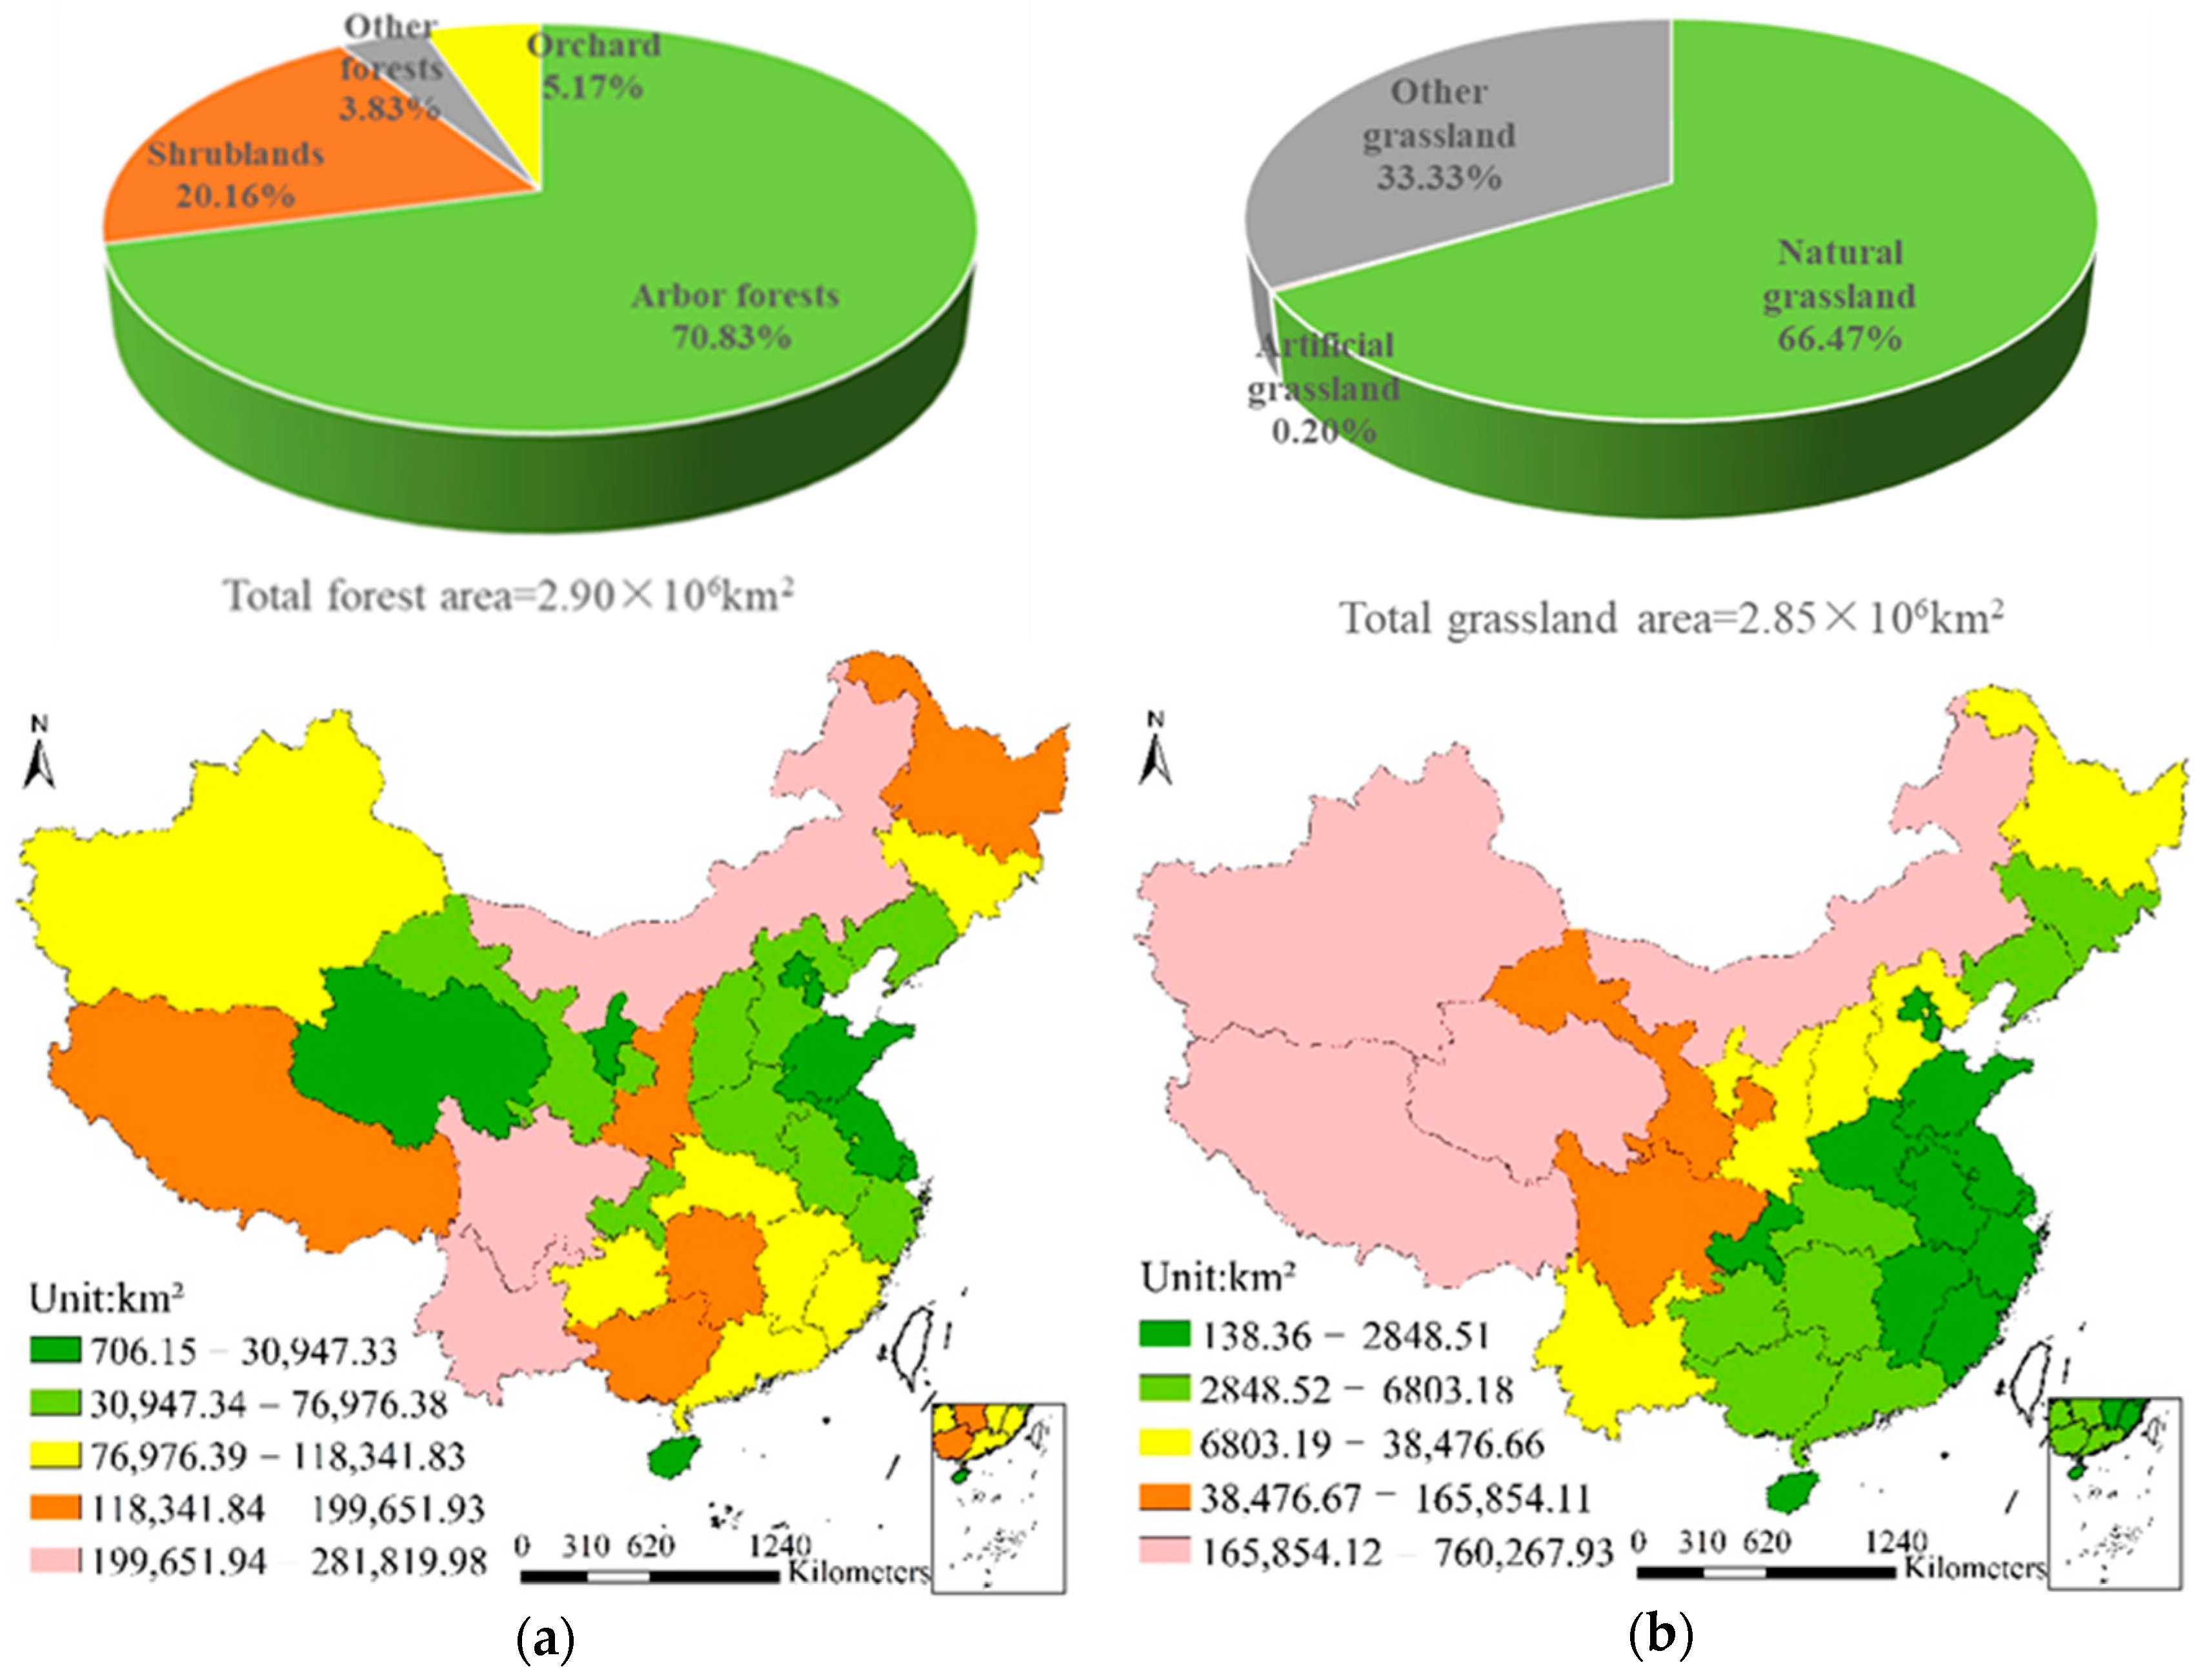
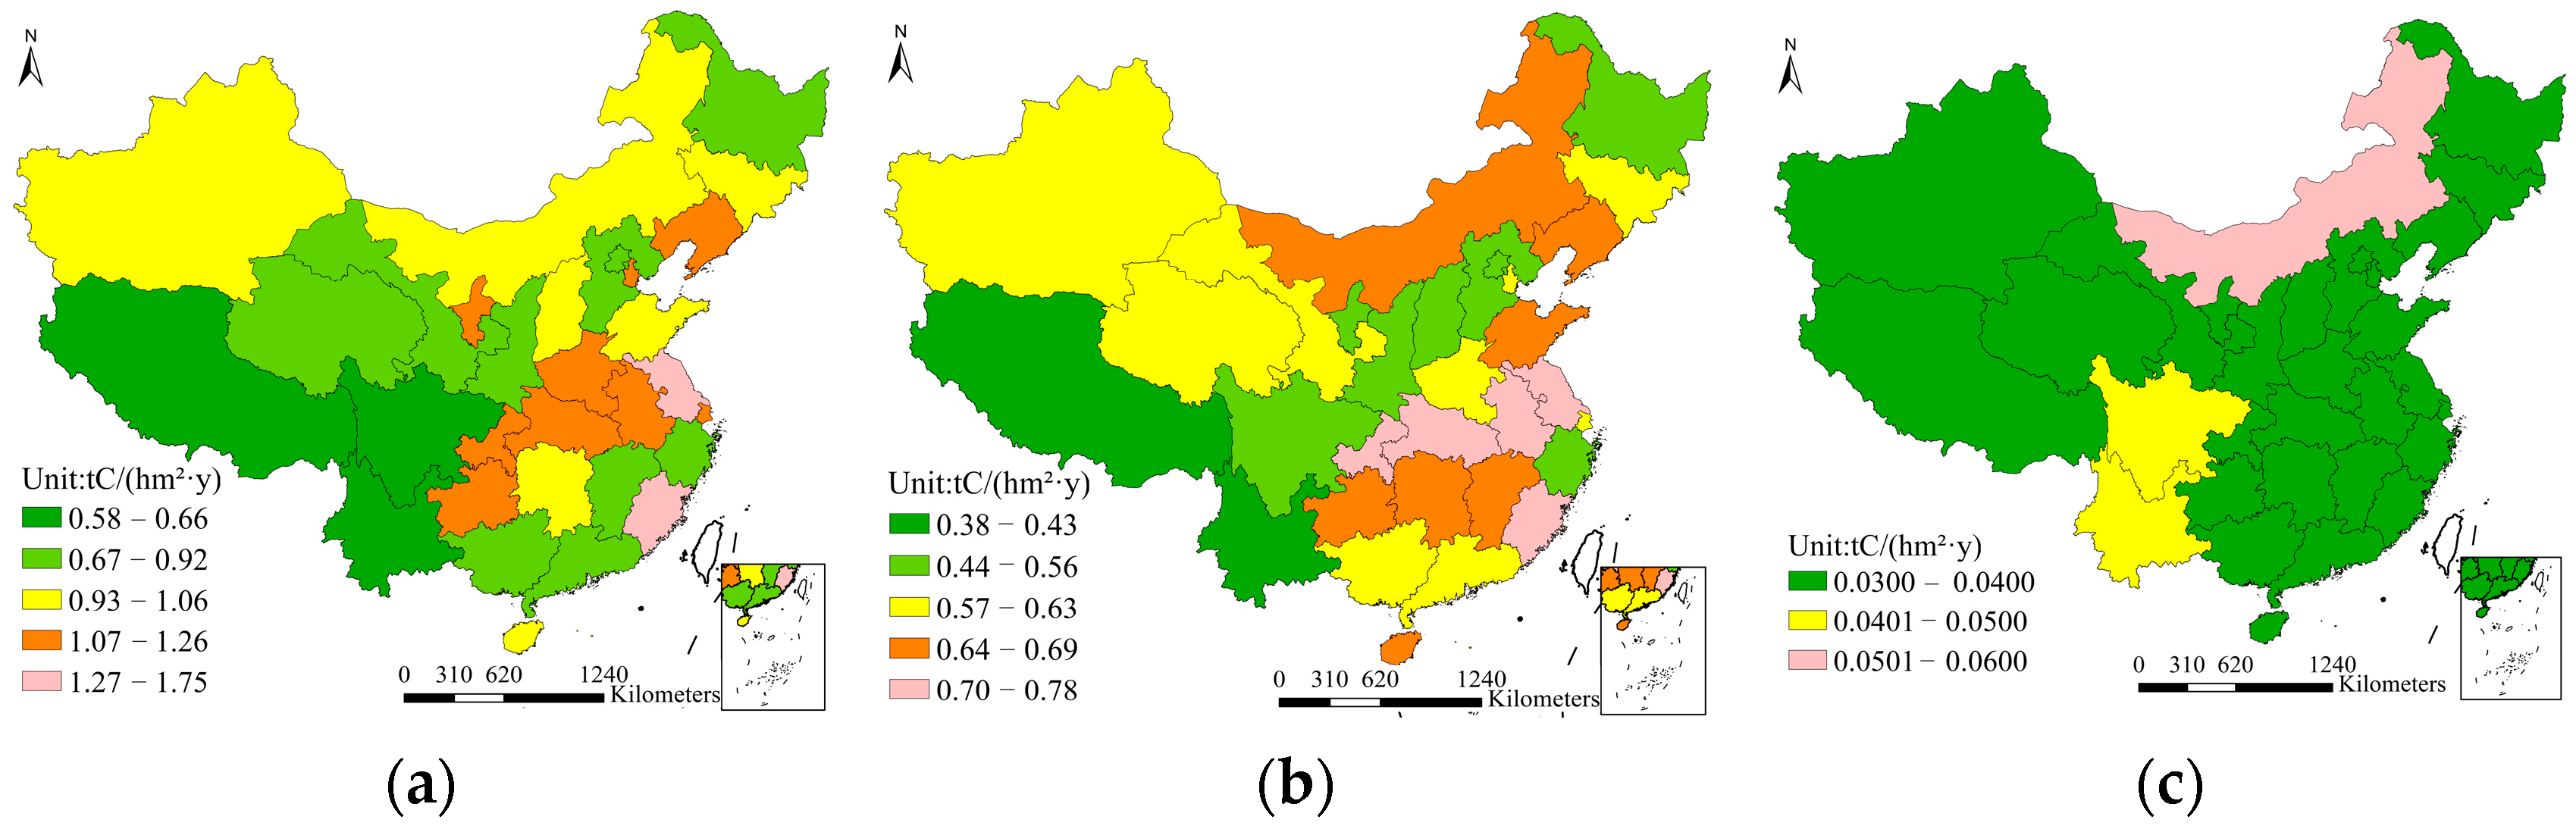
3.1. Areas and Carbon Sink Rates

China covers a total area of approximately 9.6 × 10⁶ km2. In 2021, the country’s total forest and grassland area was 5.75 × 10⁶ km2, of which forests accounted for 2.90 × 10⁶ km2, with arbor forests, shrublands and other forests occupying 70.83%, 20.16% and 3.83% of the total area, respectively (Figure 1a). The area occupied by orchards was 1.50 × 10⁵ km2, which accounted for only 5.17% of the total area. Forests were mainly distributed in Sichuan, Yunnan, and Mongolia in north and southwest China. In addition, the grassland area was 2.85 × 10⁶ km2, of which natural pasture accounted for a large area, with a coverage of 66.47%. Other grassland was 0.95 × 10⁶ km2 and accounted for 33.33% of the total grassland area. Artificial grasslands accounted for only 0.20% of the total grassland area. In China, grasslands were mainly distributed in Tibet, Inner Xinjiang, and Mongolia, covering 66.61% of the total area (Figure 1b).
The forest biomass and soil carbon-sink rate at provincial level ranged between 0.58–1.75 and 0.38–0.78 t C/(hm2·y), respectively, with large spatial variations across the country (Figure 2a,b). The forest biomass carbon-sink rate was significantly (p < 0.05) larger than the soil carbon-sink rate. Geographically, both the largest values of forest-biomass and soil carbon-sink rate were observed in Fujian, and the minimum values occurred in Tibet. In contrast, the spatial discrepancy of grassland soil carbon sink rate was not evident. The grassland soil carbon-sink rate ranged between 0.03 and 0.06 t C/(hm2·y), and was significantly (p < 0.05) lower than the forest soil carbon-sink rate. The largest grassland soil carbon-sink rate was observed for Mongolia, followed by Yunnan and Sichuan (Figure 2c).

3.2. Biomass and Soil Carbon Sinks

The forest biomass carbon sink in China amounted to 233.39 Mt C/y in 2021, and the contribution of arbor forests was the largest one (173.09 Mt C/y, 74.17%) (Figure 3a). The biomass carbon-sink values of shrublands and other forests were 45.67 and 11.12 Mt C/y, respectively, accounting for 19.57% and 4.77% of the total. The biomass carbon sink of orchards was only 3.51 Mt C/y and its contribution was the least (1.50%) (Figure 3a). Nationally, Inner Mongolia had the largest biomass carbon sink (24.67 Mt C/y, 10.57%), followed by those of Sichuan (17.44 Mt C/y, 7.47%), Yunnan (16.80 Mt C/y, 7.20%), and Fujian (16.38 Mt C/y, 7.02%) (Figure 3a).
The total soil carbon sink of forests and grasslands in China was 160.80 Mt C/y in 2021. The forest soil carbon sink was 150.88 Mt C/y, and forests contributed most significantly to the total soil carbon sinks, with a percentage of 93.84%. The forest soil carbon sinks of arbor forests, shrublands, orchards, and other forests were 111.85 (74.13%), 29.57 (19.60%), 2.27 (1.50%), and 7.19 Mt C/y (4.76%), respectively. The grassland soil carbon sink in China was 9.91 Mt C/y, and the values for natural grasslands, artificial grasslands, and other grasslands were 7.16 (72.27%), 0.02 (0.18%), and 2.73 Mt C/y (27.54%), respectively. The largest soil carbon sink was in Inner Mongolia (19.31 Mt C/y), accounting for 12.01% of the national soil carbon sink (Figure 3b).

3.3. Soil Carbon Reinforcement and Avoided CO2 Emissions

The horizontal soil carbon reinforcement of forest and grasslands in China was 20.31 Mt C/y in 2021, with considerable spatial variability across provinces (Figure 4a). The soil carbon reinforcement values for Xinjiang, Gansu, Sichuan, and Shanxi were large, at 2.71, 2.36, 1.58, and 1.50 Mt C/y, respectively. In contrast, the values for Heilongjiang, Fujian, and Ningxia were negative, at −3.22, −2.62, and −0.15 t C/y, respectively. From 2020 to 2021, the water erosion areas of forests and grasslands decreased by 8983.61km2 across China. The decrease in water erosion areas of forests and grasslands for Sichuan, Yunnan, and Mongolia was 1514.12, 1393.63, and 1091.73 km2, respectively. Conversely, the values for the eroded areas in Heilongjiang, Fujian, and Ningxia increased by 189.13, 17.85, and 15.72 km2, respectively (Figure 4b).
In addition, based on the calculated amount of soil carbon reinforcement, the vertical CO2 emissions avoided totaled 14.89–29.78 Mt of CO2 in 2021. This exhibited the fact that forests and grasslands prevented 14.89–29.78 Mt of CO2 from being emitted into the atmosphere via soil conservation, indicating that these land-cover types can effectively prevent carbon transfer from the soil to the atmosphere.

3.4. Contribution to Carbon Neutrality

Based on the calculated biomass and soil carbon sinks, the forests and grasslands in China generated a vertical carbon sink of 394.18 Mt C/y in 2021, absorbing 1.45 Gt (1445.33 Mt) atmospheric CO2 in this year. By taking into account the vertically avoided CO2 emissions, the contributions of forests and grasslands to carbon neutrality were 1.46–1.47 Gt of CO2 in 2021, equivalent to 13% of the national total fossil CO2 emissions (10.17 Gt in 2019) [2]. The biomass and soil carbon sinks were responsible for 97.98%–98.98% of the total vertical CO2 flux, and were the main contributors to carbon neutrality.

4. Discussion

4.1. Forests and Grasslands Generated Extensive Carbon Sinks

In this study, the values of the total carbon sink of forests and grasslands in China was similar to that estimated based on forest full-aperture carbon sequestration (394.18 vs. 443 Mt C/y) in a previous study [27], showing that forests and grasslands accounted for approximately 35.50% of the total mean land biosphere carbon sinks in China (1.11 Gt C/y) [28]. For comparison, the carbon sink of forest ecosystems from 2001 to 2010 in China was approximately 163 Mt C per year, according to the Carbon Project of the Chinese Academy of Sciences (CAS) [7], which was significantly lower than the values found in this study. This difference probably resulted from changes in forest area and the growth of established forests as well as the inconsistency in statistical analyses and criteria. In contrast to the findings of Fang et al. [7], our estimate of soil carbon sinks incorporated the contribution of grassland soil. Furthermore, the contribution of soil carbon sinks to the total in this study was higher than that measured by Fang et al. (40.79% vs. 25%) [7]. The higher ratio of the soil may be attributed to the lower biomass carbon sink. Leaves, flowers, fruits, and even small twigs from forests were seasonally withered or removed, and carbon fixed in the biota was returned to the atmosphere or became a source of soil organic carbon. This did not result in a stable biomass carbon sink, and thus, those biomass carbon sinks were not accounted for in this study.
Most annual carbon sinks in forest soils are concentrated near the soil surface (0–20 cm), rather than at depth [29]. Therefore, the forest and grassland soil carbon-sink rates calculated in this study were based on changes in organic carbon in the topsoil (0–20 cm). Our results showed that both maximum forest soil and biomass carbon-sink rates occurred in Fujian, corresponding to its high temperature and more precipitation. The minimum values, observed in Tibet, may have result from the cold and dry climate. This suggests the role of climate in shaping the carbon sink capacity. The forest carbon-sink rates in the present study were similar to that in America (0.94 t C/(hm2·y) [6], but lower than the global forest-ecosystem average net productivity (2.6 t C/(hm2·y) [30]. This difference probably resulted from different estimation methods. For all provinces, the forests and grasslands increased the biomass and soil organic carbon density, demonstrating that these land-cover types have great potential to increase carbon stocks and mitigate climate change. However, the patterns of soil and biomass carbon-sink rates do not exactly coincide with the climate distribution patterns, mostly likely because human activities also shape carbon sinks [24]. For example, a recent study revealed that afforestation increases the soil organic-carbon density in carbon-poor soils, and decreases it in carbon-rich soils [31]. This highlights the importance of site choice and scientific designs for future forest restoration and for maximizing carbon sequestration. In addition, our results showed that the forest biomass carbon-sink-rate pattern is not in agreement with the soil carbon-sink-rate pattern. Generally, when organic matter (mainly tree litter) is added to soil, only a small fraction (approximately 10%) of it becomes stable, and the remaining fractions are broken down by soil microbes and used for their various processes [32]. The soil microbial-community activity, however, could be the main driver of differences in the potential to store carbon in soils [33,34]. In this sense, studies on the interactions between soil microbes and soil organic matter are crucial to promote the contribution of the microbial community to soil carbon storage.

4.2. Reduced Carbon Emissions via Soil Carbon Reinforcement Should Be Highlighted

From a climate change point of view, soil carbon reinforcement has the potential to reduce carbon losses and keep soils in a good and stable condition. Soil carbon reinforcement by forests and grasslands in 2021 represents about 5.51% of the total decreased water erosion-removed soil organic carbon (64 g C·m−2·a−1) in China [35]. This small proportion was mainly attributed to the more substantial reduction in water erosion resulting from conservation activities between two earlier national surveys (carried out in 1995–1996 and 2010–2012) [35] compared with that between 2021 and 2020. Further regression analysis showed that soil carbon reinforcement was positively correlated with a reduced water-erosion area (Figure 5a). When the outliers (the corresponding values for Gansu and Xinjiang) were removed, the relationship was significant (p < 0.05) (Figure 5b). In Gansu and Xinjiang, although the reduction in the total water-erosion area for forests and grasslands was not obvious, severe water erosion was effectively controlled, and the resulting soil carbon reinforcement was high. For example, the extremely intense (erosion rates = 8000–15000 t·km−2·y−1) and violent (erosion rates > 15,000 t·km−2·y−1) water-eroded area of forests and grasslands in Gansu was reduced by 110.81 km2 (data from the national annual dynamic monitoring of soil and water losses). However, soil carbon reinforcement by forests and grasslands in Heilongjiang, Fujian, and Ningxia were negative, due to the increased erosion. This indicates that the effective management of forests and grasslands in China is still essential for halting soil organic-carbon loss caused by erosion.
Our results also showed that forests and grasslands reduced carbon emissions via soil carbon reinforcement, and approximately 14.89–29.78 Mt of CO2 emissions were prevented in 2021. This is equivalent to 1.15%–2.98% of the national total annual terrestrial-ecosystem carbon sinks. The horizontal soil-carbon transport due to soil erosion in China during the last two decades was 180 ± 80 Mt C/year [35], and if this carbon had been emitted into the atmosphere at a rate of 20%–40%, the total emissions would have been 132–264 Mt CO2. Based on a higher assessment of soil erosion [36], the erosion-induced carbon emission due to mineralization would have been 469–1525 Mt CO2, accounting for approximately 4.68%–15.22% of the national total fossil CO2 emissions. This highlights the necessity of adopting conservation-effective measures for preventing carbon emissions during soil carbon transport. The process of mineralization of the displaced carbon is generally accentuated by changes in soil wetness and temperature [18]. Severe soil erosion and excessive runoff result in higher soil temperatures and lower soil moisture, leading to increased emissions due to mineralization. Asia is the largest contributor to relative erosion-induced emission on the continental scale [18], within which China has regional hot spots of erosion and therefore conservation polices should be focused. In addition, due to the limited data availability, the impacts of forests and grasslands on mitigating wind erosion to reduce carbon losses have not been estimated. However, these two land-cover types are also important for carbon neutrality as they avoid carbon emissions through wind-breaking and sand-fixing. For example, research has found that the carbon sequestration in wind-eroded farmland with vegetation cover was mainly caused by reduced soil-carbon losses and dust interception rather than soil carbon inputs from grasses and crops [37].
Overall, in 2021, forests and grasslands sequestered carbon in biomass and soil and reduced the risk of erosion-induced emissions by 1.46–1.47 Gt CO2/y, which accounts for approximately 13% of the annual fossil CO2 emissions in China. This proportion is similar to the contribution of forest carbon sinks to annual carbon emissions in other temperate countries (mostly less than 15%); for example, the values for Korea and America are 9.4% and 10.36%, respectively [38]. Notably, sequestration and avoidance of carbon emissions by forests and grasslands are additional opportunities, not alternative to fossil emissions reductions. They can help to achieve carbon neutrality, but they will not solve climate change. Therefore, they should not be dismissed or exaggerated, especially the role of forests and grasslands in reducing erosion-induced emissions in the carbon cycle and China´s forest policies. Furthermore, most of the forests in China are young (60.94% of the total forest area) and have significant potential to contribute to future carbon sinks [27]. This considerable carbon-sequestration potential was an effective way for buying time before reaching a carbon saturation state.

5. Conclusions

By absorbing CO2 from the air, as well as reducing horizontal soil-carbon transport and protecting against further CO2 emissions, forests and grasslands are important for achieving carbon neutrality and mitigating climate change. On the national scale, in 2021, forests and grasslands generated extensive stable biomass carbon sinks and soil carbon sinks of 394.18 Mt C/y. Soil carbon reinforcement of forests and grasslands via soil conservation on the national scale was 20.31 Mt C/y, which kept about 14.89–29.78 Mt of CO2 from being emitted into the atmosphere in China; however, this fact has not been a focus of research and China’s forest policy. Overall, forests and grasslands absorbed atmospheric CO2 and reduced emissions by 1.46–1.47 Gt CO2/y in 2021, equivalent to 13% of the fossil CO2 emissions in China. Given the fact that most of the forests in China are young, significant climate benefits can be achieved in the future through carbon accumulation and the conservation of soil carbon stocks. Our results indicate that forest and grasslands are important components of national climate change-mitigation strategies in China, and thus, restoration and conservation need to received increased attention.

Author Contributions

Y.Z. (Yonge Zhang) analyzed the data and wrote the manuscript. Y.Z. (Yang Zhao) revised the paper and contributed to the investigation. Q.C. contributed to the funding acquisition. Y.Z. (Yuanji Zhu) contributed to the formal analysis. B.L. contributed to the data curation. X.Z. revised the paper and finished the submission. X.Y. contributed to the data analysis. All authors have read and agreed to the published version of the manuscript.

Funding

This study was supported by the Science and Technology Project of State Grid Corporation of China (5200-202416091A-1-1-ZN).

Data Availability Statement

Data is contained within the article.

Conflicts of Interest

The authors declare no conflict of interest.

References

  1. World Meteorological Organization. Greenhouse Gas Bulletin: The State of Greenhouse Gases in the Atmosphere Based on Global Observations through 2021[EB/OL]. No. 18. Available online: https://library.wmo.int/records/item/58743-no-18-26-october-2022 (accessed on 26 October 2022).
  2. Friedlingstein, P.; Jones, M.W.; O’sullivan, M.; Andrew, R.M.; Bakker, D.C.E.; Hauck, J.; Le Quéré, C.; Peters, G.P.; Peters, W.; Pongratz, J.; et al. Global Carbon Budget 2021. Earth Syst. Sci. Data Discuss. 2021, 14, 1917–2005. [Google Scholar] [CrossRef]
  3. Chen, C.; Park, T.; Wang, X.; Xu, B.; Chaturvedi, R.K.; Fuchs, R.; Brovkin, V.; Ciais, P.; Fensholt, R. China and India lead in greening of the world through land-use management. Nat. Sustain. 2019, 2, 122–129. [Google Scholar] [CrossRef]
  4. Dixon, R.K.; Solomon, A.M.; Brown, S.; Houghton, R.A.; Trexier, M.C. Carbon pools and flux of global forest ecosystems. Science 1994, 263, 185–190. [Google Scholar] [CrossRef]
  5. Hu, H.F.; Wang, S.P.; Guo, Z.D.; Fang, J.Y. The stage-classified matrix models project a significant increase in biomass carbon stocks in China’s forests between 2005 and 2050. Sci. Rep. 2015, 5, 11203. [Google Scholar] [CrossRef]
  6. Pan, Y.D.; Birdsey, R.A.; Fang, J.Y.; Houghton, R.; Kauppi, P.E.; Kurz, W.A.; Phillips, O.L.; Shvidenko, A.; Lewis, S.L.; Canadell, J.G. A large and persistent carbon sink in the World’s forests. Science 2011, 333, 988–993. [Google Scholar] [CrossRef]
  7. Fang, J.; Yu, G.; Liu, L.; Hu, S.; Chapin, F.S. Climate change, human impacts, and carbon sequestration in China. Proc. Natl. Acad. Sci. USA 2018, 115, 4015–4020. [Google Scholar] [CrossRef]
  8. Zhu, J.; Hu, H.; Tao, S.; Chi, X.; Li, P.; Jiang, L.; Ji, C.; Zhu, J.; Tang, Z.; Pan, Y. Carbon stocks and changes of dead organic matter in China’s forests. Nat. Commun. 2017, 8, 151. [Google Scholar] [CrossRef]
  9. Zhou, G.; Liu, S.; Li, Z.; Zhang, D.; Tang, X.; Zhou, C.; Yan, J.; Mo, J. Old-growth forests can accumulate carbon in soils. Science 2006, 314, 1417. [Google Scholar] [CrossRef]
  10. Bossio, D.A.; Cook-Patton, S.C.; Ellis, P.W.; Fargione, J.; Griscom, B.W. The role of soil carbon in natural climate solutions. Nat. Sustain. 2020, 3, 391–398. [Google Scholar] [CrossRef]
  11. Lal, R. Soil Carbon Sequestration Impacts on Global Climate Change and Food Security. Science 2004, 304, 1623–1627. [Google Scholar] [CrossRef]
  12. Zheng, J.Y.; Zhao, J.S.; Shi, Z.H.; Wang, L. Soil aggregates are key factors that regulate erosion-related carbon loss in citrus orchards of southern China: Bare land vs. grass-covered land. Agric. Ecosyst. Environ. 2021, 309, 107254. [Google Scholar] [CrossRef]
  13. Chen, M.Q.; Wang, K.Q. Properties of runoff, sediment and soil carbon stock under different soil and water conservation measures in sloping farmland. Guangdong Agric. Sci. 2015, 42, 124–129. (In Chinese) [Google Scholar]
  14. Billings, S.A.; Buddemeier, R.W.; Richter, D.; Van Oost, K.; Bohling, G. A simple method for estimating the influence of eroding soil profiles on atmospheric CO2. Glob. Biogeochem. Cycles 2010, 24, 1–14. [Google Scholar] [CrossRef]
  15. Van Oost, K.; Quine, T.A.; Govers, G.; De Gryze, S.; Six, J.; Harden, J.W.; Ritchie, J.C.; Mccarty, G.W.; Heckrath, G.; Kosmas, C. The impact of agricultural soil erosion on the global carbon cycle. Science 2007, 318, 626–629. [Google Scholar] [CrossRef]
  16. Harden, J.W.; Sharpe, J.M.; Parton, W.J.; Ojima, D.S.; Fries, T.L.; Huntington, T.G.; Dabney, S.M. Dynamic replacement and loss of soil carbon on eroding crop-land. Glob. Biogeochem. Cycles 1999, 13, 885–901. [Google Scholar] [CrossRef]
  17. Jacinthe, P.A.; Lal, R. A mass balance approach to assess carbon dioxide evolution during erosional events. Land Degrad. Dev. 2001, 12, 329–339. [Google Scholar] [CrossRef]
  18. Lal, R. Soil erosion and the global carbon budget. Environ. Int. 2003, 29, 437–450. [Google Scholar] [CrossRef]
  19. Polyakov, V.; Lal, R. Soil Organic Matter and CO2 emission as Affected by Water Erosion on Field Runoff Plots. Geoderma 2008, 143, 216–222. [Google Scholar] [CrossRef]
  20. Lu, F.; Hu, H.; Sun, W.; Liu, G.; Zhou, W.; Zhang, Q.; Shi, P.; Liu, X.; Wu, X. Effects of national ecological restoration projects on carbon sequestration in China from 2001 to 2010. Proc. Natl. Acad. Sci. USA 2018, 115, 4039. [Google Scholar] [CrossRef]
  21. Fang, J.; Cuo, Z.; Hu, H.; Kato, T.; Muraoka, H.; Son, Y. Forest biomass carbon sinks in East Asia, with special reference to the relative contributions of forest expansion and forest growth. Glob. Chang. Biol. 2014, 20, 2019–2030. [Google Scholar] [CrossRef]
  22. National Science & Technology Infrastructure of China; National Forestry and Grassland Science Data Center (NFGSDC). Forest and Grassland Resources and Ecological Status in China in 2021, 2021. CSTR: 17575.1101202302170010002V1. Available online: http://www.forestdata.cn (accessed on 16 February 2023).
  23. National Science & Technology Infrastructure of China; National Forestry and Grassland Science Data Center (NFGSDC). The Ninth National Forest Resources Inventory (2014–2018). CSTR: 17575.11.0120230320014.0001V1. 2019. Available online: http://www.forestdata.cn (accessed on 19 March 2019).
  24. Tang, X.; Zhao, X.; Bai, Y.; Tang, Z.; Zhou, G. Carbon pools in China’s terrestrial ecosystems: New estimates based on an intensive field survey. Proc. Natl. Acad. Sci. USA 2018, 115, 4021–4026. [Google Scholar] [CrossRef]
  25. National Earth System Science Data Center. National Science & Technology Infrastructure of China. High Resolution National Soil Information Grids of China [EB/OL]. 2019. Available online: https://www.geodata.cn/data/datadetails.html?dataguid=111615691069737&docId=3945 (accessed on 22 October 2021).
  26. Liu, B.Y.; Zhang, K.L.; Xie, Y. An Empirical Soil Loss Equation [A]. In Process of Soil Erosion and Its Environment Effect Volume Il 12th ISCO[C]; Tsinghua Press: Beijing, China, 2002; pp. 21–25. [Google Scholar]
  27. Wang, B.; Niu, X.; Song, Q.F. Analysis of Forest Carbon Sequestration Capacity in China Based on Forest Full-aperture Carbon Sequestration. Environ. Prot. 2021, 49, 30–34. (In Chinese) [Google Scholar]
  28. Wang, J.; Feng, L.; Palmer, P.I.; Liu, Y.; Fang, S.; Bsch, H.; O’Dell, C.W.; Tang, X.; Yang, D.; Liu, L. Large Chinese land carbon sink estimated from atmospheric carbon dioxide data. Nature 2020, 586, 720–723. [Google Scholar] [CrossRef]
  29. Deng, L.; Liu, G.B.; Shangguan, Z.P. Land-use conversion and changing soil carbon stocks in China’s Grain-for-Green Program: A synthesis. Glob. Change Biol. 2014, 20, 3544–3556. [Google Scholar] [CrossRef]
  30. Wang, X.C.; Wang, C.; Bond-Lamberty, B. Quantifying and reducing the differences in forest CO2-fluxes estimated by eddy covariance, biometric and chamber methods: A global synthesis. Agric. For. Meteorol. 2017, 247, 93–103. [Google Scholar] [CrossRef]
  31. Hong, S.B.; Yin, G.D.; Piao, S.L.; Dybzinski, R.; Cong, N.; Li, X.; Wang, K.; Peuelas, J.; Zeng, H.; Chen, A. Divergent responses of soil organic carbon to afforestation. Nat. Sustain. 2020, 3, 694–700. [Google Scholar] [CrossRef]
  32. Powlson, D. 2022. Available online: https://www.fwi.co.uk/arable/land-preparation/soils/farm-soil-carbon-is-the-focus-on-sequestration-right (accessed on 12 October 2022).
  33. Bhattacharyya, S.S.; Ros, G.H.; Furtak, K.; Iqbal, H.M.N.; Parra-Saldvar, R. Soil carbon sequestration—An interplay between soil microbial community and soil organic matter dynamics. Sci. Total Environ. 2022, 815, 152928. [Google Scholar] [CrossRef]
  34. Liao, H.; Hao, X.L.; Qin, F.; Delgado-Baquerizo, M.; Liu, Y.; Zhou, J.; Cai, P.; Chen, W.; Huang, Q. Microbial autotrophy explains large-scale soil CO2 fixation. Glob. Chang. Biol. 2022, 29, 231–242. [Google Scholar] [CrossRef]
  35. Yue, Y.; Ni, J.R.; Ciais, P.; Piao, S.L.; Wang, T.; Huang, M.T.; Li, T.H.; Wang, Y.C.; Chappell, A.; Van Oost, K. Lateral transport of soil carbon and land-atmosphere CO2 flux induced by water erosion in China. Proc. Natl. Acad. Sci. USA 2016, 113, 6617–6622. [Google Scholar] [CrossRef]
  36. Zhang, H.; Liu, S.; Yuan, W.; Dong, W.; Ye, A.; Xie, X.; Chen, Y.; Liu, D.; Cai, W.; Mao, Y. Inclusion of soil carbon lateral movement alters terrestrial carbon budget in China. Sci. Rep. 2014, 4, 7247. [Google Scholar] [CrossRef]
  37. Yu, H.Q.; Li, Y.; Nguyen, M.L.; Funk, R.; Liu, G.Q.; Li, J.J. Fallout Radionuclide based techniques for assessing the effectiveness of soil conservation measures in different erosion zones in China. J. Nucl. Agric. Sci. 2016, 26, 340–347. (In Chinese) [Google Scholar]
  38. Zhang, Z.; Zhang, Y.X. Research on Carbon Peak and Carbon Sink Capacity of Major Carbon Emitting Countries in the World. For. Resour. Manag. 2023, 2, 1–9. (In Chinese) [Google Scholar]
Figure 1. Spatial distribution of forest (a) and grassland areas (b) in China in 2021. Insets contain (a) a pie chart of forest cover types and (b) a pie chart of grassland cover types. Forest cover types include arbor forests, shrublands, orchards (fruit forests, tea plantations, and other orchards), and other forests. Grassland cover types include natural grasslands, artificial grasslands, and other grasslands.
Forests 15 01060 g001
Figure 2. Biomass carbon-sink rate of forests (a), soil carbon-sink rate of forests (b) and grasslands (c) at provincial level.
Forests 15 01060 g002
Figure 3. Spatial distribution of forest biomass carbon sinks (a), and forest and grassland soil carbon sinks (b) in China in 2021. Insets comprise (a) a pie chart of contributions of different land-cover types to biomass carbon sinks and (b) a pie chart of contributions of different land-cover types to soil carbon sinks.
Forests 15 01060 g003
Figure 4. Spatial distribution of soil carbon reinforcement (a) and reduction in water erosion area (b) of forests and grasslands in China in 2021.
Forests 15 01060 g004
Figure 5. Relationship between soil carbon reinforcement and reduction in the water erosion area. (a) Relationship when all values were included (n = 31), (b) relationship when relative values for Gansu and Xinjing were excluded (n = 29).
Forests 15 01060 g005
Table 1. Forest and grassland classification used in the manuscript.
ItemsClassificationNotation
ForestsArbor forestsArbor forests with canopy density ≥ 0.2.
Shrublands Shrublands with cover degree ≥ 40%.
Other ForestsOpen woodlands (arbor forest with canopy density > 0.1 and <0.2), immature forests, and nursery forests.
OrchardsFruit forests, tea plantations and other orchards.
GrasslandsNatural grasslandsGrasslands dominated by natural herbs, used for grazing or mowing.
Artificial grasslandsGrasslands with artificial grass.
Other grasslandsDominated by herbaceous plants and with tree canopy density < 0.1.
Disclaimer/Publisher’s Note: The statements, opinions and data contained in all publications are solely those of the individual author(s) and contributor(s) and not of MDPI and/or the editor(s). MDPI and/or the editor(s) disclaim responsibility for any injury to people or property resulting from any ideas, methods, instructions or products referred to in the content.

