Article

Restoration Strategies in the Heidaigou Open-Pit Mine Dump Based on Water Sources and Plant Water Utilization

1
College of Desert Management, Inner Mongolia Agricultural University, Hohhot 010018, China
2
Key Laboratory of Desert Ecosystem Protection and Restoration, State Forestry Administration, Hohhot 010010, China
3
Ordos Forestry and Grassland Development Center, Ordos 017010, China
*
Author to whom correspondence should be addressed.
Forests 2024, 15(6), 906; https://doi.org/10.3390/f15060906
Submission received: 20 April 2024 / Revised: 17 May 2024 / Accepted: 21 May 2024 / Published: 23 May 2024
(This article belongs to the Special Issue Advances in Vegetation Succession with Soil Erosion)

Abstract

:
In this study, three typical plants capable of restoring in the Heidaigou open-pit mine dump, namely, Pinus sylvestris var. mongolica, Caragana korshinskii, and Medicago sativa, were taken as the research objects. The δ2H and δ18O values of atmospheric precipitation, soil water, stem water, and leaf water were measured using the stable isotope technique, and the distribution characteristics of the δ2H and δ18O values of different water sources were identified. The IsoSource model (version1.3.1) was used to calculate the contribution rate of different water sources to the plants, and the differences and dynamic changes in the water sources for P. sylvestris var. mongolica, C. korshinskii, and M. sativa during the rainy season were examined. Results showed that the water source of the three plants was found to be mainly soil water, and the utilization of each potential water source varied in different periods of the rainy season. In June, when SWC was sufficient, P. sylvestris var. mongolica and M. sativa primarily absorbed and utilized shallow and middle soil water, with relative utilization ratios of 55.5% and 59%, respectively, while C. korshinskii has a more balanced utilization ratio of soil water in each layer, with shallow soil water utilization at 33.7%, middle soil water at 34.2%, and deep soil water at 32.2%. In August, when SWC decreased, P. sylvestris var. mongolica, C. korshinskii, and M. sativa were all transferred to deep soil water, with utilization ratios of 75.8%, 78.8%, and 71.1%, respectively. The values showed that these three typical plants are capable of restoring can respond to external water changes through the plastic transformation of water absorption sources. Among them, C. korshinskii can flexibly use soil water in each layer, has stronger survival competitiveness in drought, and can better adapt to the fragile ecological environment of a mining dump.

1. Introduction

Water is one of the key factors limiting the normal growth and development of plants, and the changes it undergoes affect the growth and distribution pattern of plants [1,2]. Against the background of global climate change, the eco-hydrological processes in arid and semi-arid regions have undergone significant changes, which have an impact on vegetation water use strategies. In this context, the analysis of plant water sources and variations in arid and semi-arid regions is helpful to understand the eco-hydrological process and ecological management of the regions [3,4,5].
China’s coal resources are concentrated in arid and semi-arid areas. However, the mining of coal mines, especially open-pit mining, will inevitably cause damage to the environment. According to statistics, the area of land destroyed by open-pit coal mining in China is as high as 6600 hm2 every year, of which the dump formed by open-pit mining alone occupies 3000 hm2 [6], and the damage area is extensive. Heidaigou open-pit coal mine is the largest open-pit coal mine in China, and is located in arid and semi-arid areas. The area experiences severe soil erosion and low vegetation coverage due to its location within an ecologically fragile zone of the Loess Plateau [7]. Coal has also caused serious damage to the local vegetation and water system [8], accelerating the degradation process of the regional ecosystem. Accordingly, the ecological restoration of mining areas has become the focus of national and local governments [9]. Determining how to carry out vegetation restoration and reconstruction on the dump formed by the accumulation of waste is of great significance for coordinating the utilization of water and soil resources in the region, restoring soil quality, and promoting the sustainable development of coal mines [7,10]. Soil water is the main source of water absorbed by plants, but the spatial distribution of soil water is not uniform, resulting in different degrees of utilization of soil water by different plants. At present, water problems in the ecological restoration of the dump in the mining area are mainly focused on the study of soil hydrological effects [11], soil water physical properties [12], slope soil erosion [13], the influence of soil pore structure on hydraulic characteristics [14], and the response of water and fertilizer during vegetation restoration [15]. A few reports have also been published on the use of stable isotope technology to trace the source and utilization strategy of plant water in mining areas, that is, the use of precipitation and soil water by vegetation on typical artificial pad landforms. However, quantitative descriptions are still lacking, making it necessary to carry out special targeted research.
Numerous methods are used to determine the sources of plant water, such as the root survey method [16], stem sap flow technology [17], plant water potential characteristics [18], and so on. The “fingerprint” of water, hydrogen, and oxygen isotopes can quantify with high sensitivity and accuracy the utilization of different water sources by plants, replacing time-consuming and laborious traditional methods to a certain extent [19,20]. By analyzing and comparing the hydrogen and oxygen isotope values in plant stem water and other potential water sources and combining them with the multi-source mixing model, the source of plant water absorption and the contribution rate of each potential water source can be effectively judged [21,22,23]. For example, McCole [24] pointed out that deep root plants such as trees and shrubs use more stable deep soil water sources, while shallow root plants such as herbs use shallow unstable soil water sources. Pei Yanwu et al. [25] studied the root water absorption source and seasonal variation characteristics of Pinus sylvestris var. mongolica in Mu Us sandy land. Their results showed that the root water absorption depth of P. sylvestris var. mongolica changed with the season. Its roots mainly absorbed 0–80 cm shallow soil water (61.03%) in the rainy season and mainly used more than 90 cm soil water (15.40%) and groundwater (70.10%) in the dry season. Furthermore, Williams et al. [26] found that Quercus kansuensis in Northern California has a higher utilization rate of deep soil water and groundwater in areas with less rainfall, while shallow soil water is mainly used in areas with more rainfall. These studies show that variations in plant types, root characteristics, seasonal fluctuations, changes in rainfall, and other factors result in differences in the water sources absorbed by plant roots, introducing greater uncertainty to related research. However, most of the current studies on plant water sources focus on a single factor, and the water source and utilization mechanism of plants under the combined action of multiple factors still require exploration. The dump is a huge special landform formed by a large number of stripping materials and waste materials. The process of coal mining has seriously disturbed the soil structure, which can easily lead to the decline of groundwater level. In the case of insufficient soil water storage, plants cannot effectively use groundwater, resulting in the degree to which plants utilize each water source being inevitably different from that in the natural state. Additionally, the physiological and ecological differences of different plant species in different months of the rainy season inevitably lead to different water consumption, although systematic research on these two factors is scarce.
Therefore, this study takes the Heidaigou open-pit mine dump as the research area and the typical restoration plant species P. sylvestris var. mongolica, Caragana korshinskii, and Medicago sativa as the research objects. This study combines other relevant environmental parameters, such as meteorological factors and soil water content (SWC), and analyzes the characteristics of hydrogen and oxygen stable isotope composition in precipitation, soil water, stem water, and leaf water. The objectives of this study are as follows: (i) clarify the water sources of the three plants in the rainy season and quantify the contribution rate of each potential water source to the plants, and (ii) reveal the water use mechanism and adaptation strategy of the three plants in the rainy season. This study proposed the following hypotheses:
H1: 
Soil water availability may affect the water absorption depth of plants, and the three plants may exhibit similar water sources.
H2: 
The water sources of P. sylvestris var. mongolica, C. korshinskii, and M. sativa are different in different months of the rainy season, and the degree of utilization of soil water by plants in different periods will also be different due to the varying degrees of rainfall recharge.

2. Materials and Methods

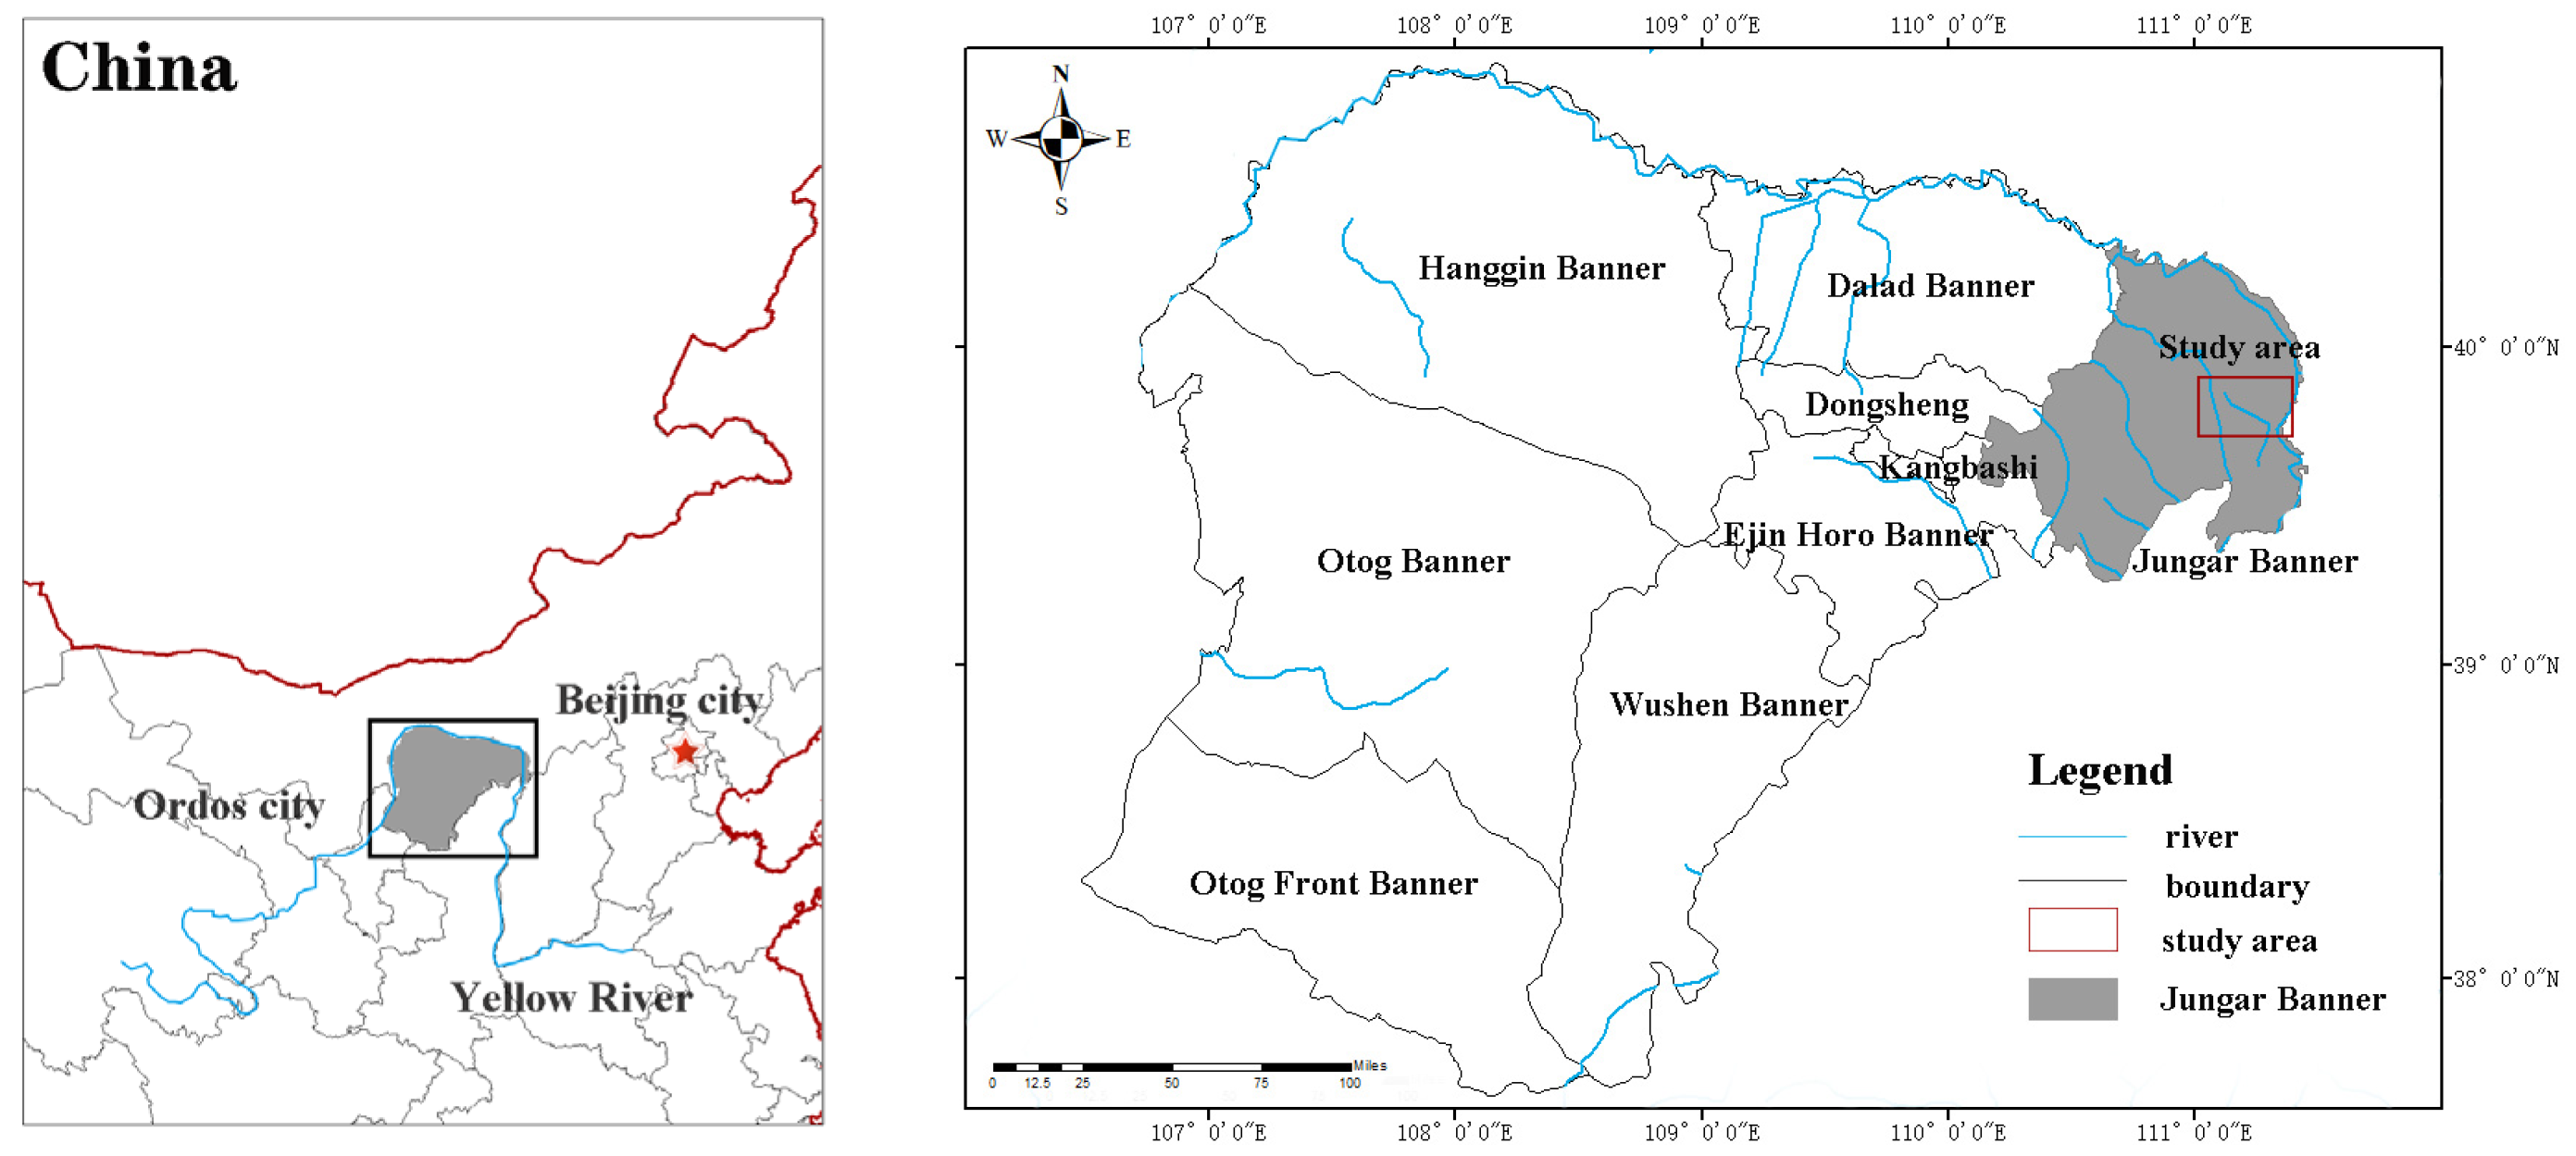
2.1. Overview of the Study Area

The Heidaigou open-pit coal mine in the study area is located in the central part of the Zhungeer coalfield (Figure 1) (111°13′–111°21′ E, 39°25′–39°49′ N), 120 km from Hohhot in the north, 135 km from Ordos in the west, and 225 km from the Pingshuo open-pit coal mine in the south. The mining area belongs to the temperate semi-arid continental climate, with an altitude of 1256 m, an average annual temperature of 7.2 °C, and an average annual rainfall of 408 mm. During the study period, the total rainfall from June to August accounted for more than 70% of the whole year. The frost-free period is between 125 and 150 days, and average sunshine hours is 3119.3 h. The dump of the mining area is a multi-stage platform comprising six dumps: tamping garlic ditch dump, east dump, north dump, west dump, inner dump, and east dump. The soil type is mainly loessial soil, which has a low nutrient content. The vegetation in this area belongs to a warm-temperate steppe zone. It consists mainly of low and sparse natural vegetation, and the coverage is less than 30%. The predominant species include Stipa bungeana, Thymus mongolicus, and Leymus secalinus. The artificial vegetation in the dump includes C. korshinskii, Sabina vulgaris, and Armeniaca sibirica, among many others (Table 1).

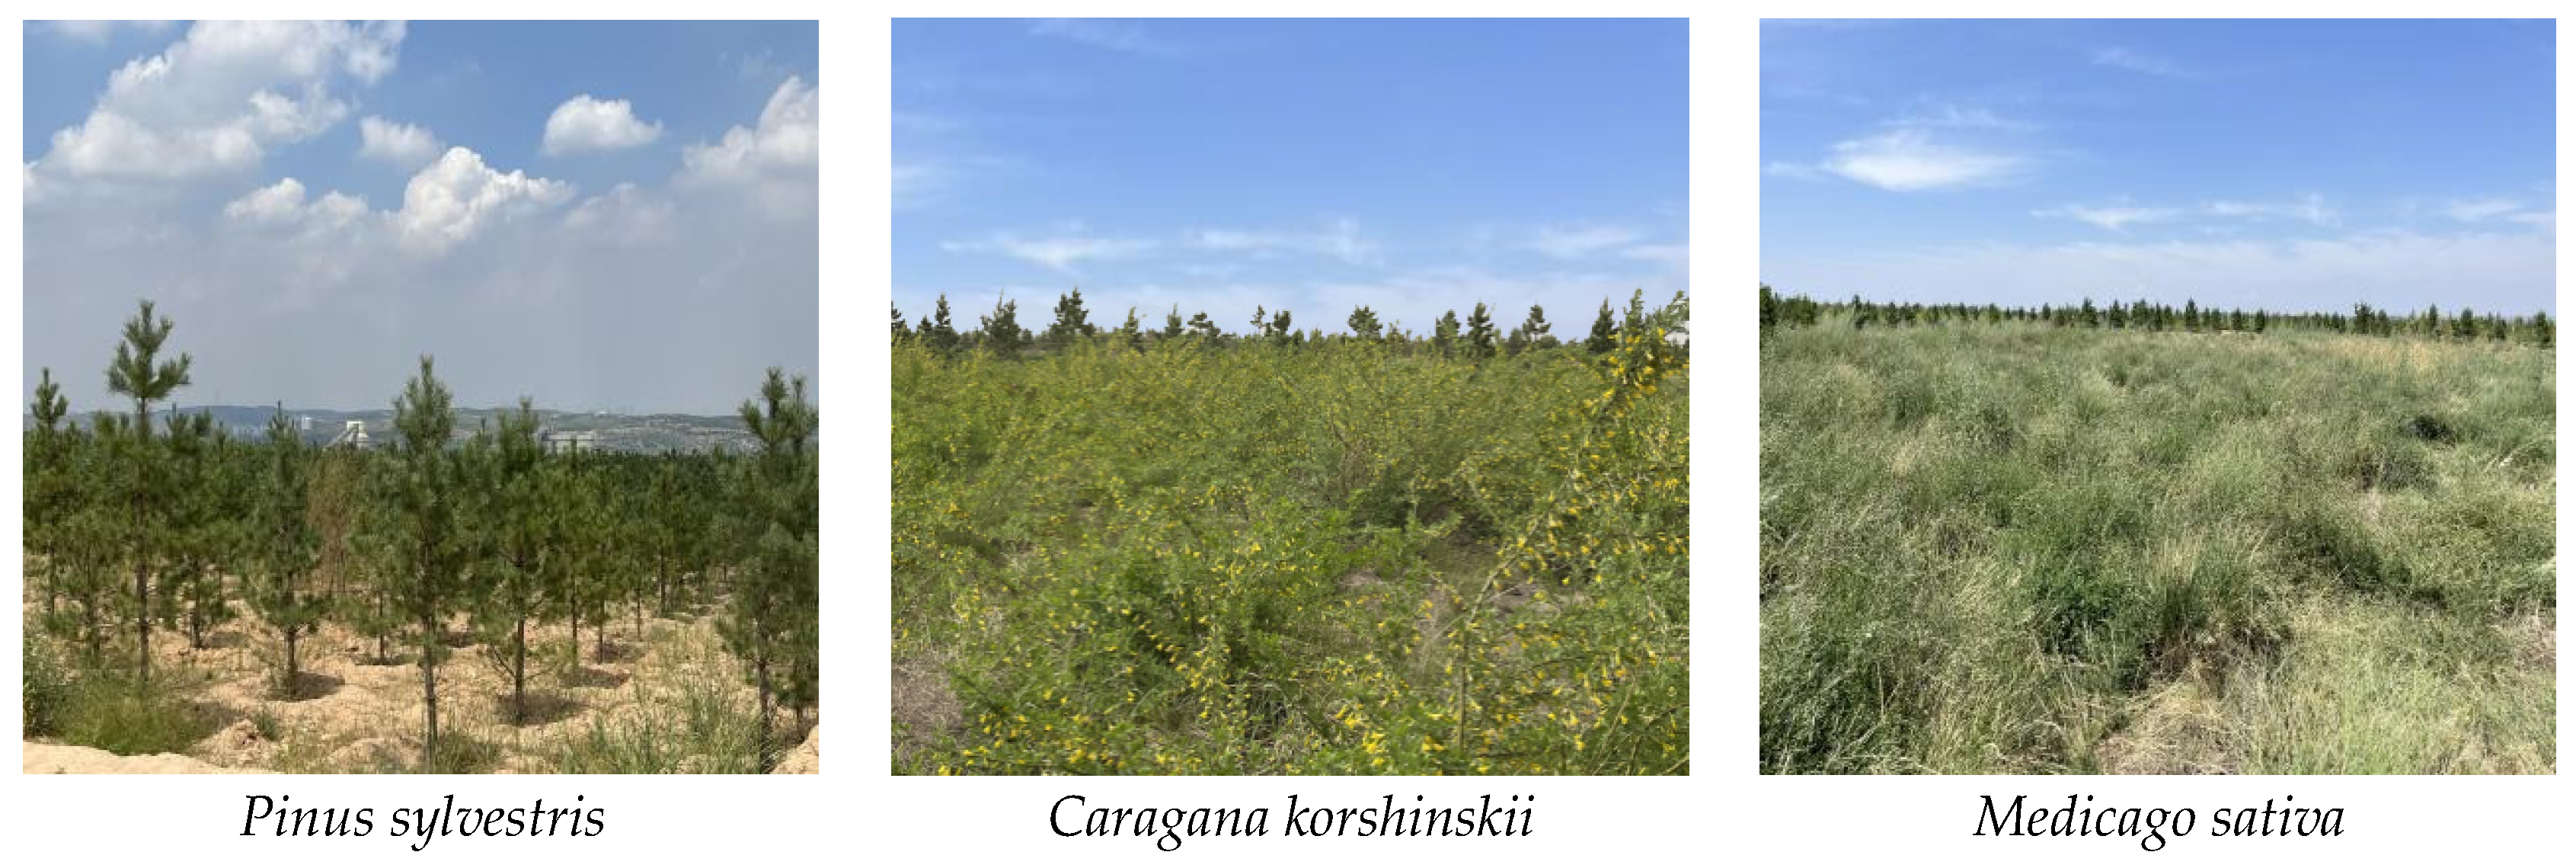
2.2. Experimental Design and Sample Selection

Three typical plants capable of restoring plots on the dump platform were selected as the research objects, namely, the P. sylvestris var. mongolica site, the C. korshinskii site, and the M. sativa site (Figure 2). The experiment was carried out during the rainy season from June to August 2023. A monthly sample collection was conducted for 2 days under sunny, cloudless weather, with no rainfall events in the preceding 3 days. A small automatic weather station (HOBO U30, Onset Inc., Bourne, MA, USA) was set up in the flat terrain around the experimental plot and equipped with a data collector (U-DT-2), rainfall barrel (S-RGB-M002, 0.2 mm), and air temperature and humidity sensor (S-THB-M002, 0.02 °C, 0.1%). Data were recorded every minute to observe rainfall (mm), atmospheric temperature (°C), and air relative humidity (%) continuously throughout the study period in the area. In each plot, three representative plants with excellent growth were selected, which can typically reflect the growth level of the whole test plot. The xylem branches of each plant were collected, and the precipitation and soil sampling were carried out simultaneously. Table 2 shows the information of sample plots and plant characteristics.

2.3. Sample Collection

2.3.1. Plant Samples

In each plot, three plants with similar morphological characteristics, such as good growth, plant height, and crown width, were selected as sample plants. Each sample plant was repeated three times to collect branches, in order to reduce the error. For woody plants, 4–6 branches of non-green bolted branches were cut and quickly peeled to expose the phloem, with each piece measuring about 3–5 cm. For herbs, the thickest part of the root–stem junction was cut. The samples were then immediately placed into 30 mL brown glass bottles with spiral-lined caps, sealed with Parafilm, and stored in an incubator with ice bags for low-temperature storage, and the temperature in the incubator was about 4 °C. Sun-facing and healthy green plant leaves were collected above the canopy of each sample plant, and 10–15 leaves were taken from each plant. These leaves were wrapped with tin foil paper and placed in a portable incubator, which was brought back to the laboratory to determine the hydrogen and oxygen stable isotope values in the plant xylem and leaves.

2.3.2. Soil Samples

In the range of 1 m near each plant of the cut branch, soil drills were used to drill soil at a depth of 0–100 cm. The soil was divided into 10 layers: 0–10, 10–20, 20–30, 30–40, 40–50, 50–60, 60–70, 70–80, 80–90, and 90–100 cm. The collected soil samples were divided into two parts: one part was placed in an aluminum box with a known weight of 15–20 g to measure the soil mass moisture content, and the other part was quickly placed in a 30 mL brown glass bottles with spiral-lined caps. The bottle was sealed with Parafilm, placed in a portable incubator for low-temperature storage, and brought back to the laboratory to be frozen in the refrigerator in order to determine the hydrogen and oxygen stable isotopes in soil water.

2.3.3. Rainfall Samples

A self-made rainfall collector was placed in an open area of the test site in the mining area. A plastic funnel was placed on the top of the collector, and a tin bucket with a diameter of 15 cm was placed below. A table tennis ball was placed in a plastic funnel to avoid evaporation of rainwater samples in the tin barrel. During the test, after each rainfall, the rainwater was immediately moved from the collection barrel to a 30 mL opaque brown bottle and sealed with Parafilm sealing film. The corresponding rainfall date was recorded. The bottle was quickly placed in a portable ice box for low-temperature preservation. It was frozen in a laboratory refrigerator for the determination of hydrogen and oxygen stable isotopes in soil water (δ2H, δ18O).

2.4. Determination of Stable Hydrogen and Oxygen Isotopes

2.4.1. Sample Analysis

Indoor sample analysis was carried out in the Key Laboratory of the State Forestry and Grassland Administration for Desert Ecosystem Protection and Restoration of Inner Mongolia Agricultural University. The fresh weight of the soil sample in the aluminum box was weighed, and then the sample was dried in an oven at 105 °C for 8 h. The dried soil sample was weighed again, and the SWC calculation formula is as follows:
S W C = M M C M C × 100 %
In the formula, SWC represents the soil moisture content, %; M represents the weight of wet soil, g; and MC represents the weight of dry soil, g.
A total of 36 rainfall samples, 288 plant samples, and 1080 soil samples were collected during the study period. After a week of sample collection, the automatic vacuum condensation extraction system (LI-2100, LICA, Beijing, China) was used to extract water from branches, leaves, and soil samples, and the water extraction rate was 99%. The extracted water first needs to pass through a 0.22 μm aqueous membrane to remove impurities. A liquid water isotope analyzer (isoprime precisION, Elementar, Langenselbold, Germany) [27] was used on the filtered water sample to determine the stable hydrogen and oxygen isotope composition. The obtained data were compared with the Standard Mean Ocean Water (SMOW). The δ2H and δ18O values in the sample were calculated using Formulas (2) and (3).
δ 2 H sample ( ) = [ ( 2 H / H ) sample ( 2 H / H ) SMOW 1 ] × 10 3
δ 18 O sample ( ) = [ ( 18 O / 16 O ) sample ( 18 O / 16 O ) SMOW 1 ] × 10 3

2.4.2. Excessive Calculation of the Water Body

The linear relationship between δ2H and δ18O in precipitation is called the meteoric water line (MWL) [28,29]. The LC-excess value reflects the degree of evaporation fractionation of different water sources relative to local atmospheric precipitation [30]. According to the linear-conditioned LC-excess formula proposed by Landwehr and Coplen [31]:
L C excess = δ 2 H a × δ 18 O b
In the formula, a and b represent the slope and intercept of the LMWL. The average value of LC-excess in precipitation is usually 0‰. An LC-excess lower than 0 indicates that the evaporative enrichment of stable isotopes in the water body occurs during hydrological processes, while an LC-excess greater than 0 indicates that the water body is subjected to non-precipitation water sources [32,33].

2.4.3. Proportion of Plant Water Use

Philips et al. [34] proposed the IsoSource model, which can calculate the water contribution rate of various potential water sources such as soil water and precipitation at different depths to plants. The model follows the principle of isotope mass conservation and assumes that the contribution rate of all potential water sources to plant water absorption is 100%. Under drought conditions, some plants will produce hydrogen isotope fractionation when absorbing water, but the oxygen isotope is very stable and will not undergo isotope fractionation. Therefore, it is more accurate to use δ18O to calculate the contribution rate of each potential water source to plants [35]. Prior to running the IsoSource model, the parameter source increment in the system is set to 1%, and the mass balance tolerance is set to 0.01. The calculation principle of the IsoSource model is as follows:
δ 18 O X = f 1 δ 18 O 1 + f 2 δ 18 O 2 + f 3 δ 18 O 3 + + f n δ 18 O n
f 1 + f 2 + f 3 + + f n = 1
where δ18OX represents the oxygen isotope value of plant stem water, δ18O1 represents the oxygen isotope value of the first potential water source, δ18O2 represents the oxygen isotope value of the second potential water source, and so on, with δ18On representing the oxygen isotope value of the nth potential water source. f1 represents the contribution rate of the first potential water source to the plant stem water, f2 represents the contribution rate of the second potential water source, and so on, with fn representing the contribution rate of the nth potential water source to the plant stem water.

2.5. Division of Soil Water Sources

The water sources of plants in the dump of the mining area include soil water, precipitation, and groundwater. Since a sunny day was selected for each sampling time, precipitation was not used as a potential water source for plants as rainwater would eventually penetrate into the soil. Moreover, because the dump is a huge loose pile landform formed under human disturbance, with a thickness of more than 100 m, plants encounter difficulty absorbing and utilizing groundwater. Therefore, soil water at different depths was considered to be a potential source of water for plants in the dump.
The potential water sources of plants are divided into three categories as follows: ① Significant seasonal and inter-layer differences appear in the hydrogen and oxygen stable isotope values of shallow soil water (0–20 cm) primarily because this soil layer is susceptible to climatic factors such as precipitation, temperature, and humidity. ② Hydrogen and oxygen stable isotope values of middle soil water (20–60 cm) still have significant seasonal and inter-layer differences, but compared with the surface soil, the change trend is relatively moderate. ③ Hydrogen and oxygen stable isotope values of deep soil water (60–100 cm) have small seasonal and inter-layer differences and are relatively stable. The formula of soil stratification combined with weighted isotope average is:
δ mean = ( S W C i × δ i ) S W C i
In the formula, δmean represents the average values of δ2H and δ18O after soil stratification and weighting; SWCi represents the moisture content of soil i; and δi represents the δ2H and δ18O values of the i-layer soil water.

2.6. Data Processing and Analysis

One-way analysis of variance was used to test the significance of the SWC and isotope values in different layers of soil in different months. The contribution rate of plant potential water source was analyzed using a multivariate mixed model. The source increment was set to 1%, and the mass balance tolerance was set to 0.01%. Excel 2010 and SPSS 26.0 were used for statistical data, and Origin 2021 and Ps CC2018 were used to draw charts. The data in this paper are expressed as mean values ± standard deviation.

3. Results

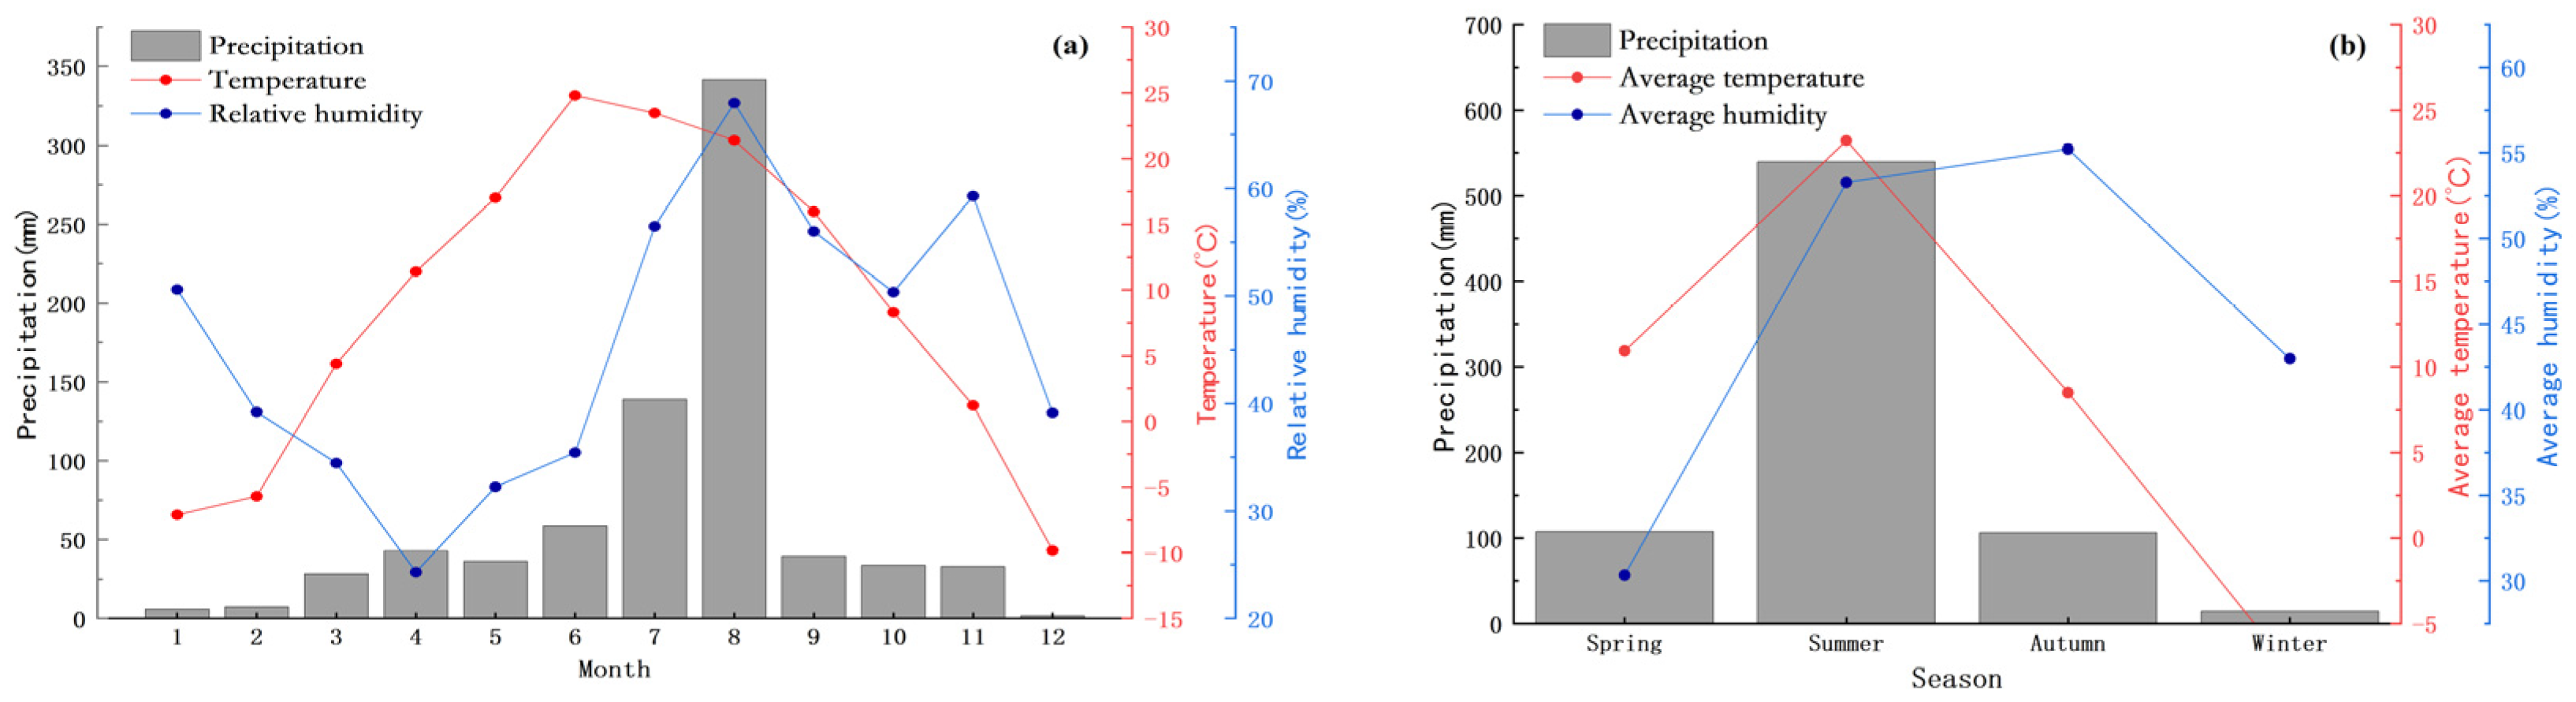
3.1. Analysis of Rainfall Characteristics

The monthly variation characteristics of precipitation, temperature and relative humidity in the study area are shown in Figure 3a. The monthly scale reveals that the total precipitation in the study area in 2023 is 766.98 mm, the average annual temperature is 8.78 °C, and the average annual relative humidity is 45.45%. The precipitation distribution was uneven. The total rainfall from June to August during the study period was 539.68 mm, accounting for 70.36% of the total annual rainfall, and the rainfall in August was the largest, up to 341.94 mm. The rainfall in December was very little, only 0.54 mm and mostly snow. The precipitation and temperature in this area have obvious seasonal changes. The temperature is the highest in June, which is 24.8 °C. With the increase in rainfall times in July and August, the temperature gradually decreases. In August, the rainfall is the largest and the relative humidity also reaches the peak, which is 67.94%. The temperature decreases rapidly in September, and the overall temperature changes significantly with the seasons.
The seasonal variation characteristics of precipitation, temperature, and relative humidity in the study area are shown in Figure 3b. In meteorology, June to August is the summer of the Northern Hemisphere, and December to February of the following year is the winter of the Northern Hemisphere. The period from September to November between summer and winter is defined as autumn, and the period from March to May between winter and summer is defined as spring. From the seasonal scale, it can be seen that the precipitation is mainly concentrated in summer. The total precipitation in summer is 539.68 mm, accounting for 70.27% of the total annual precipitation. The order of rainfall is: summer (539.68 mm) > spring (107.42 mm) > autumn (106.28 mm) > winter (14.6 mm). The weather in spring is relatively dry, the relative humidity is low, the precipitation in autumn is abundant, the relative humidity is high, and the rainfall and temperature show good synergy. The order of relative humidity is: autumn (55.21%) > summer (53.28%) > winter (42.98%) > spring (30.33%).

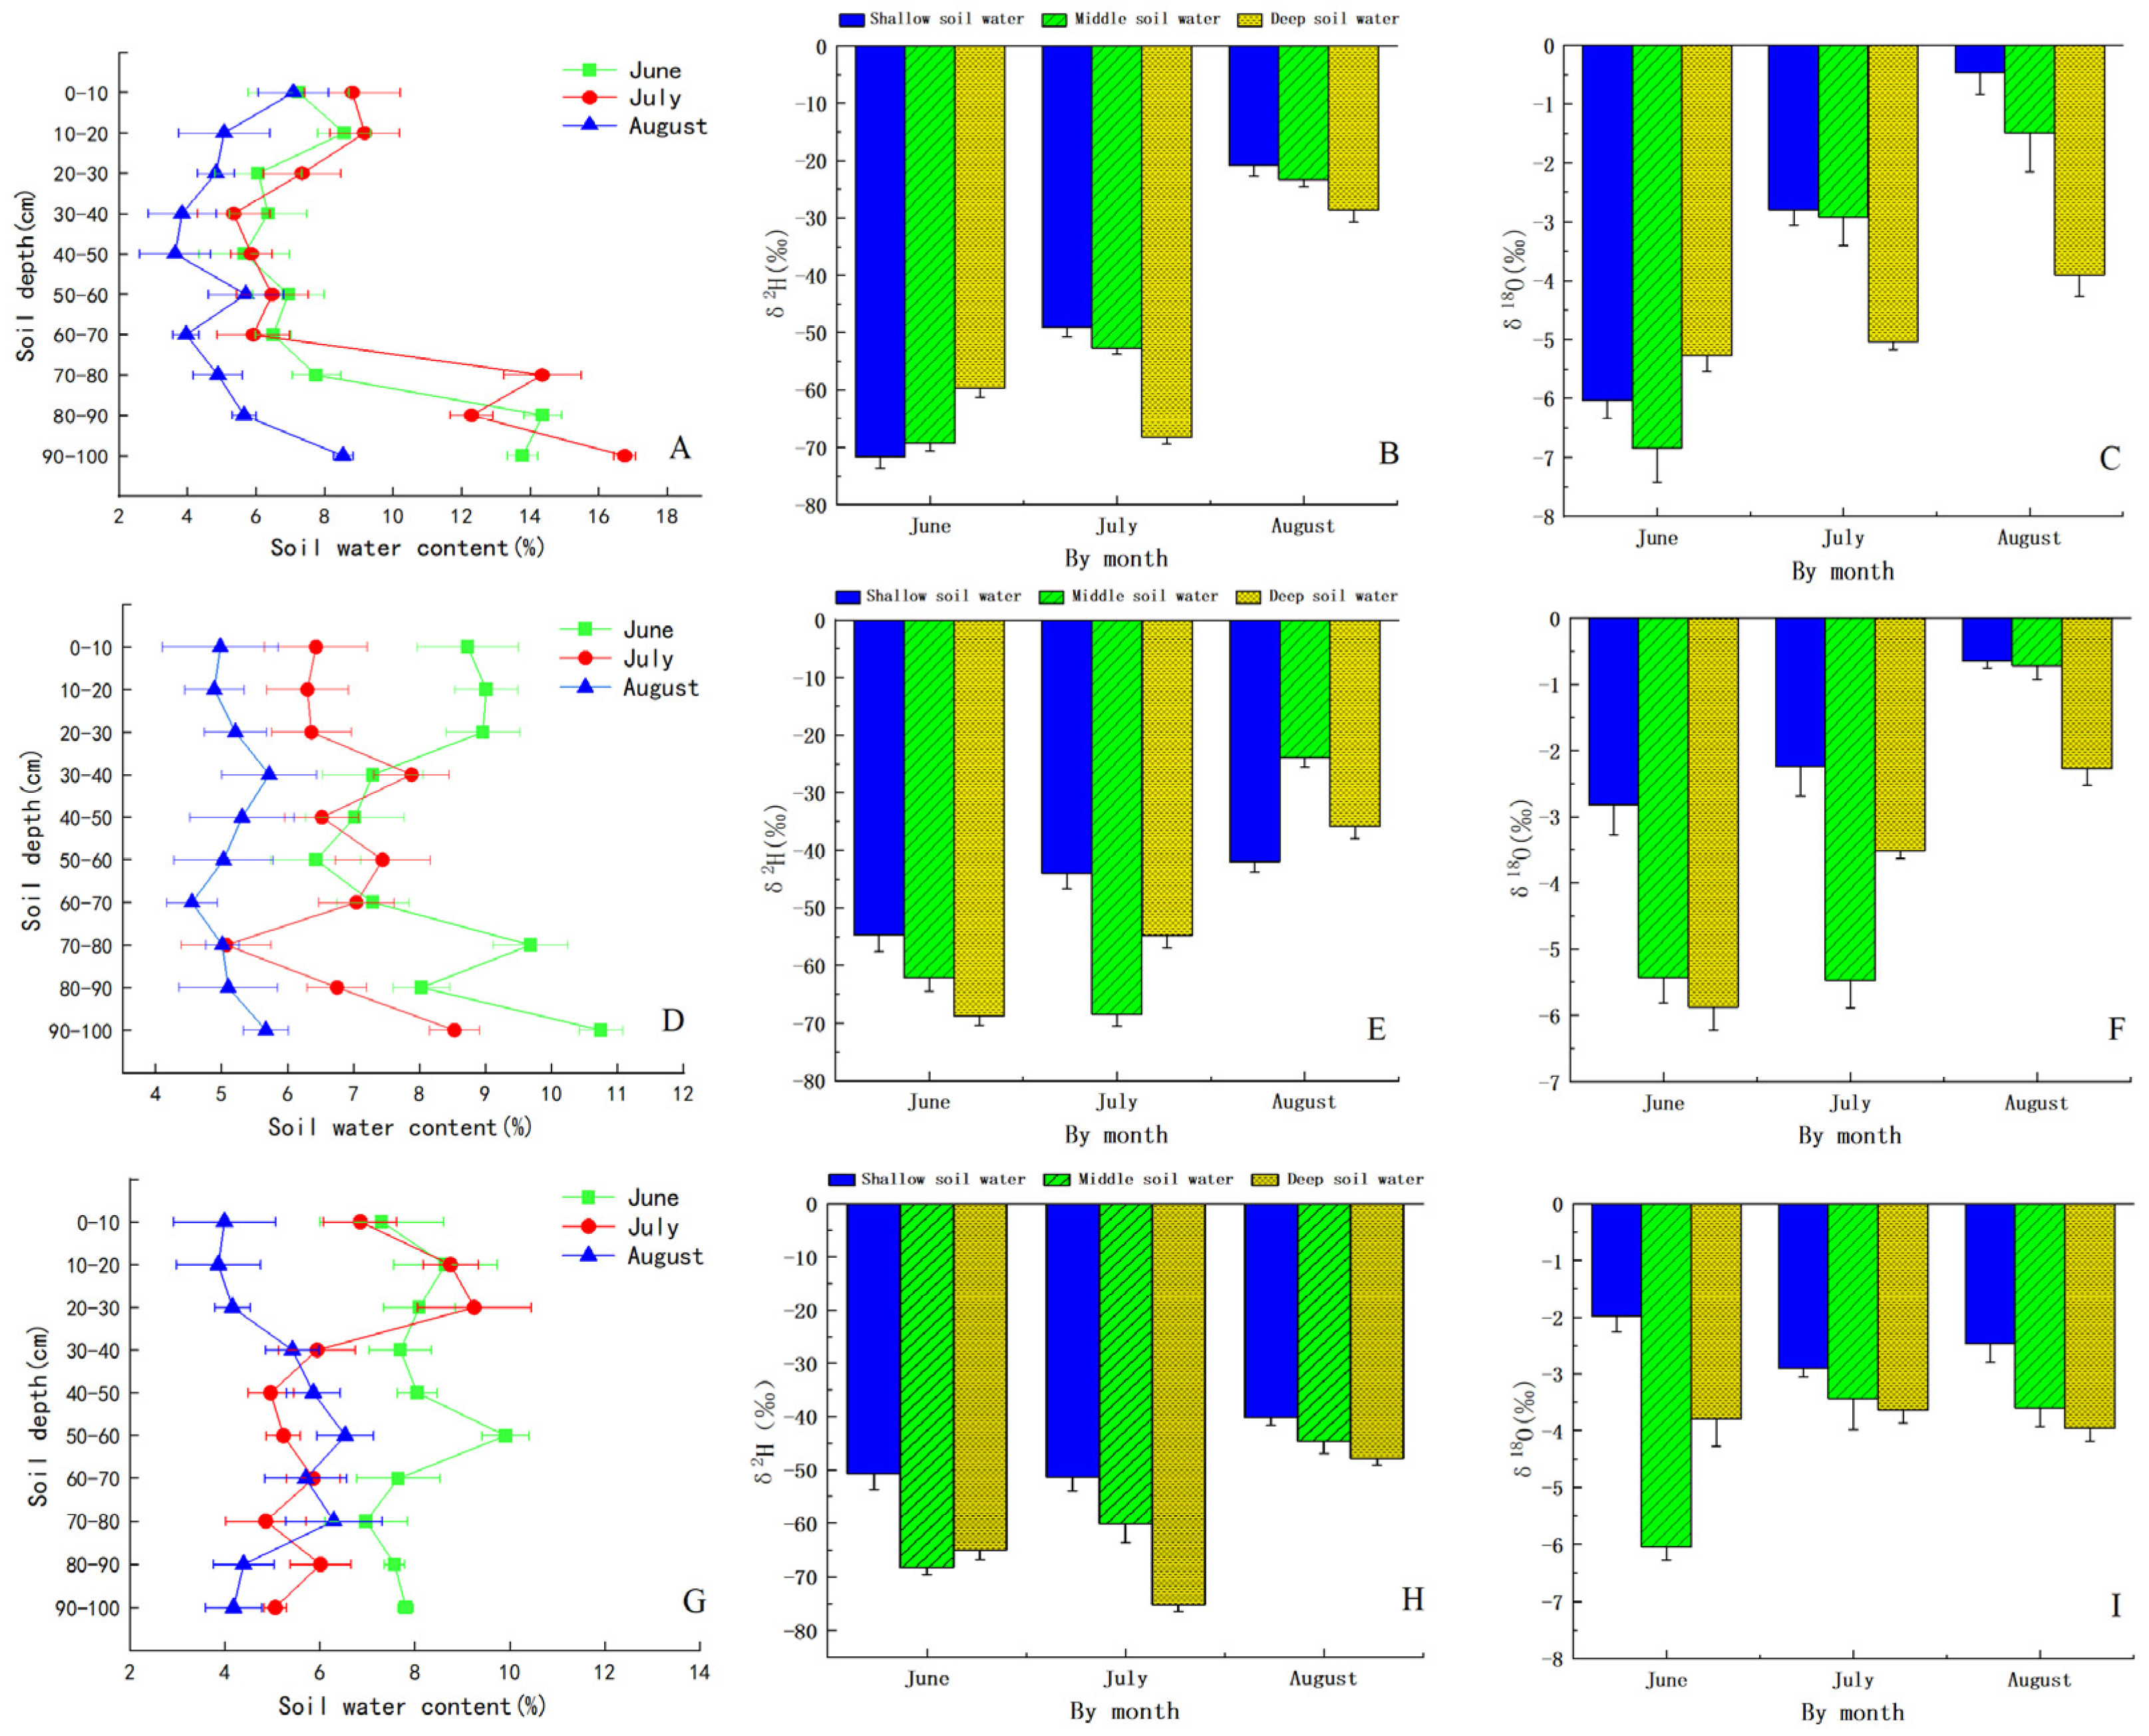
3.2. Changes in Soil Water Content and Isotopic Composition Characteristics

Figure 4A,D,G illustrate the variation characteristics of soil moisture content with depth in three plant plots. This study found that the soil moisture content of P. sylvestris var. mongolica, C. korshinskii, and M. sativa during the rainy season ranged from 3.64% to 16.76%, 4.55% to 10.75%, and 3.86% to 9.91%, respectively. The average values were (7.63 ± 1.67)%, (6.77 ± 1.30)%, and (6.43 ± 1.21)%, respectively. The average soil moisture content showed that P. sylvestris var. mongolica site > C. korshinskii site > M. sativa site, which indicated that the P. sylvestris var. mongolica site was more conducive to the storage of soil moisture. In June, the soil moisture content of the P. sylvestris var. mongolica site, the C. korshinskii site, and the M. sativa site ranged from 5.66% to 14.37%, 6.43% to 10.75%, and 6.97% to 9.91%, respectively. In August, the soil became noticeably dry, and the soil moisture content decreased by 3.64%–8.54%, 4.55%–5.72%, and 3.86%–6.53%, respectively. This change was related to the increase in temperature and the strong transpiration of plants, leading to the soil moisture content remaining at a low level as a whole. The soil moisture content of the P. sylvestris var. mongolica site and the C. korshinskii site (June–August) increased with the deepening of the soil layer, and the soil moisture content of the 0–60 cm soil layer changed only slightly, with averages of 6.81%, 7.17%, and 5.03% as well as 7.91%, 6.82%, and 5.19%, respectively. The change in soil moisture content in 60–100 cm fluctuates greatly, with increases of 2.12, 2.83, and 2.16 as well as 1.47, 1.68, and 1.25, respectively. All these transformations may be due to the increasing number in rainfall events, which led to the infiltration of water into deep soil. In July, the soil moisture content of the 0–30 cm soil layer in the M. sativa field increased, which was (8.28 ± 1.03)%, while the soil moisture content of the 30–80 cm soil layer decreased, which was (5.42 ± 0.46)%. The average soil moisture content of 0–30 cm was significantly higher than that of the 30–80 cm soil layer. The high surface soil moisture content may be due to the continuous rainfall event that occurred during the sampling work. During this period, soil evaporation was small, and the precipitation was too late to infiltrate deep in to the soil.
Figure 4 shows that the δ2H value of soil water in the P. sylvestris var. mongolica site was between −71.68‰ and −20.85‰, with an average of −46.27‰, and the δ18O value was between −6.83‰ and −0.47‰, with an average of −3.65‰. The δ2H value of soil water in the C. korshinskii site was between −68.77‰ and −23.95‰, with an average of −46.36‰, and the δ18O value was between −5.87‰ and 0.78‰, with an average of −2.55‰. The δ2H value of soil water in the M. sativa site was between −68.31‰ and 4.13‰, with an average of −32.09‰, and the δ18O value was between −6.04‰ and 2.46‰, with an average of −1.79‰. These results indicate that the stable isotope variation range of the three plant soils in the study area is in the following order: M. sativa site > P. sylvestris var. mongolica site > C. korshinskii site. Furthermore, the meteorological conditions between the sample plots are basically the same, but the δ2H and δ18O values have significant differences (p < 0.01), indicating that ecological restoration measures have an impact on the redistribution and migration of soil moisture. The average value suggests that the soil water isotope of the M. sativa site is more enriched than that of the P. sylvestris var. mongolica site and the C. korshinskii site. This may be due to the creeping growth characteristics of the M. sativa plant, which may cause interception during rainfall, thereby prolonging the recharge process of soil moisture and increasing the fractionation effect. The δ18O values of soil water in different soil depths of the three woodlands changed significantly with the month. The δ18O values of soil water in the 0–60 cm soil layer decreased with the increase in soil depth, which was due to the evaporation of heavy isotopes when rainwater was falling to the surface and infiltrating into the soil.
Figure 5 shows that the LC-excess value of surface soil water (0–30 cm) in the three plant plots in August is the most negative and has a large range of variation, indicating that the evaporation fractionation is strong. In June, the rainfall is less and evaporation is stronger, resulting in a significant decrease in the LC-excess value of surface soil water. In July, the rainfall is more and evaporation is stronger. The surface soil is recharged by a large amount of negative rainwater, and the LC-excess value of soil water is more positive than that in June. In general, the LC-excess value of soil water in the M. sativa site is negative compared with that in the P. sylvestris var. mongolica site and the C. korshinskii site, indicating that soil water in the M. sativa site is more affected by evaporation. According to the fitting line, the LC-excess value of soil water has a power function relationship with soil depth. As depth increases, the LC-excess value gradually stabilizes, indicating that deep soil water is weakened by evaporation.

3.3. Isotopic Characteristics of Precipitation, Soil Water, Stem Water and Leaf Water

Based on the precipitation isotope δ2H and δ18O values collected from June to September 2023, the atmospheric precipitation equation line in this area was established (Figure 6) as follows: δ2H = 7.27δ18O − 2.95 (R2 = 0.97) (p < 0.01). Compared with the global atmospheric precipitation equation line (δ2H = 8δ18O + 10), the slope and intercept are smaller than the global atmospheric precipitation line, indicating that evaporation and other factors have an impact on rainfall. The stable isotope values of δ2H and δ18O in the soil water of three kinds of site (P. sylvestris var. mongolica, C. korshinskii, and M. sativa) are mostly located in the lower right of the LMWL. The slope is between 6.17 and 7.25, and the intercept is between −31.49 and −15.59, all of them are smaller than the local atmospheric water line, indicating that atmospheric precipitation is the main source of soil water, which is significantly affected by secondary evaporation before it is converted into soil water. Compared with the P. sylvestris var. mongolica site and the M. sativa site, the slope of the soil water line in the C. korshinskii site is closer to the LMWL, which may be related to the interception ability of different plant canopies and the difference of the local microenvironment. The stable isotope values of hydrogen and oxygen in the stem water of the three woodland plants were higher than those in soil water (Table 3). The average values of hydrogen and oxygen stable isotopes of stem water of P. sylvestris var. mongolica, C. korshinskii, and M. sativa were −55.19‰ and −2.02‰, −52.24‰ and −1.91‰, and −22.96‰ and −0.5‰, respectively. The hydrogen and oxygen stable isotopes showed a small variance between P. sylvestris var. mongolica and C. korshinskii, whereas M. sativa exhibited higher enrichment. The composition of δ2H and δ18O in the leaves of different plants is more abundant than that in the stem water. The intercept and slope of the leaves of the three plants are considerably smaller than the LMWL, indicating that the water evaporates strongly during the transition from the plant to the atmosphere.

3.4. Characteristics of Water Use and Its Ratio of Different Plants

Soil water at different depths is the direct water source of plants, and precipitation is the indirect water source of plants. In general, the δ18O of plant roots in arid areas is not fractionated during water absorption. Therefore, by comparing the oxygen stable isotope values of plant stem water and potential water sources, the main water source information of plants can be judged qualitatively. In June, the δ18O value of stem water of P. sylvestris var. mongolica intersected with the δ18O value of soil water in the 0–10, 40–50, and 70–80 cm soil layers (Figure 7). The δ18O value of C. korshinskii stem water intersected with the δ18O value of soil water in the 20–40 cm soil layer and was close to the δ18O value of soil water in the 70–80 cm soil layer. The δ18O value of M. sativa stem water intersected with the δ18O value of soil water in the 20–30, 60–70, and 90–100 cm soil layers. In July, the δ18O value of stem water of P. sylvestris var. mongolica intersected with the δ18O value of soil water in the 0–10, 60–70, and 70–80 cm soil layers and was close to the δ18O value of soil water in the 30–40 and 50–60 cm soil layers. The δ18O value of C. korshinskii stem water intersected with the δ18O value of soil water in the 20–30, 50–60, and 80–90 cm soil layers and was close to the δ18O value of soil water in the 40–50 cm soil layer. The δ18O value of M. sativa stem water intersected with the δ18O value of soil water in the 30–40, 70–80, and 90–100 cm soil layers and was close to the δ18O value of soil water in the 40–50 cm soil layer. In August, the δ18O value of stem water of P. sylvestris var. mongolica intersected with the δ18O value of soil water in the 20–40 and 80–90 cm soil layers. The δ18O value of C. korshinskii stem water intersected with the δ18O value of soil water in the 60–70 and 90–100 cm soil layers and was close to the δ18O value of soil water in the 30–40 cm soil layer. The δ18O value of M. sativa stem water intersected with the δ18O value of soil water in the 50–60 and 80–90 cm soil layers. The depth of the δ18O intersection point of plant stem water and soil water varies in different months, indicating that the water absorption depths of P. sylvestris var. mongolica, C. korshinskii, and M. sativa are also different in different months.
Figure 8 shows that the water use ratio of different plant types varies. The P. sylvestris var. mongolica site used a large amount of 60–100 cm deep soil water in the rainy season, and the utilization rates were 44.5%, 49%, and 75.8%. In June, due to the low rainfall and the large evaporation of surface soil water, the surface soil water could not meet the basic growth needs of plants. Thus, the plants used the middle soil water of 20–60 cm, and the utilization rate was 31.6%. In August, the contribution rates of soil water in the 0–20 and 20–60 cm soil layers were 6.5% and 17.7%, respectively. This outcome is attributed to the plants being in a period of vigorous growth and thus having a greater demand for water. Therefore, the plants absorbed shallow soil water while also absorbing more middle and deep soil water. In July, the strong evaporation reduced the SWC of the 0–20 cm layer in the C. korshinskii site, resulting in the plants mainly absorbing 20–60 cm middle soil water, with the utilization ratio of 59.6%. The contribution rates of shallow soil water (0–20 cm) and deep soil water (60–100 cm) were 14.1% and 26.3%, respectively. In August, a large number of precipitations supplemented the water content of the shallow soil, but the contribution rate of deep soil water to C. korshinskii was the largest at 78.8%. This may be because there was no rainfall in the first few days of sampling, and the infiltration process of soil moisture caused the deep soil water to receive a large amount of supply, resulting in the main use of deep soil water by plants. M. sativa mainly used deep soil water throughout the rainy season, followed by middle soil water. In June, M. sativa mainly used middle and deep soil water and utilization rates were 36.9% and 41%. In July, the proportion of M. sativa using middle and deep soil water gradually increased, rising by 10.84% and 17.32%, respectively. In August, plants absorbed deep soil moisture and the proportion of utilization was the highest, accounting for 71.6%. In the case of poor soil moisture conditions, plants have obvious advantages in the uptake of deep soil water, and this difference is closely related to the distribution characteristics of plant roots.

4. Discussion

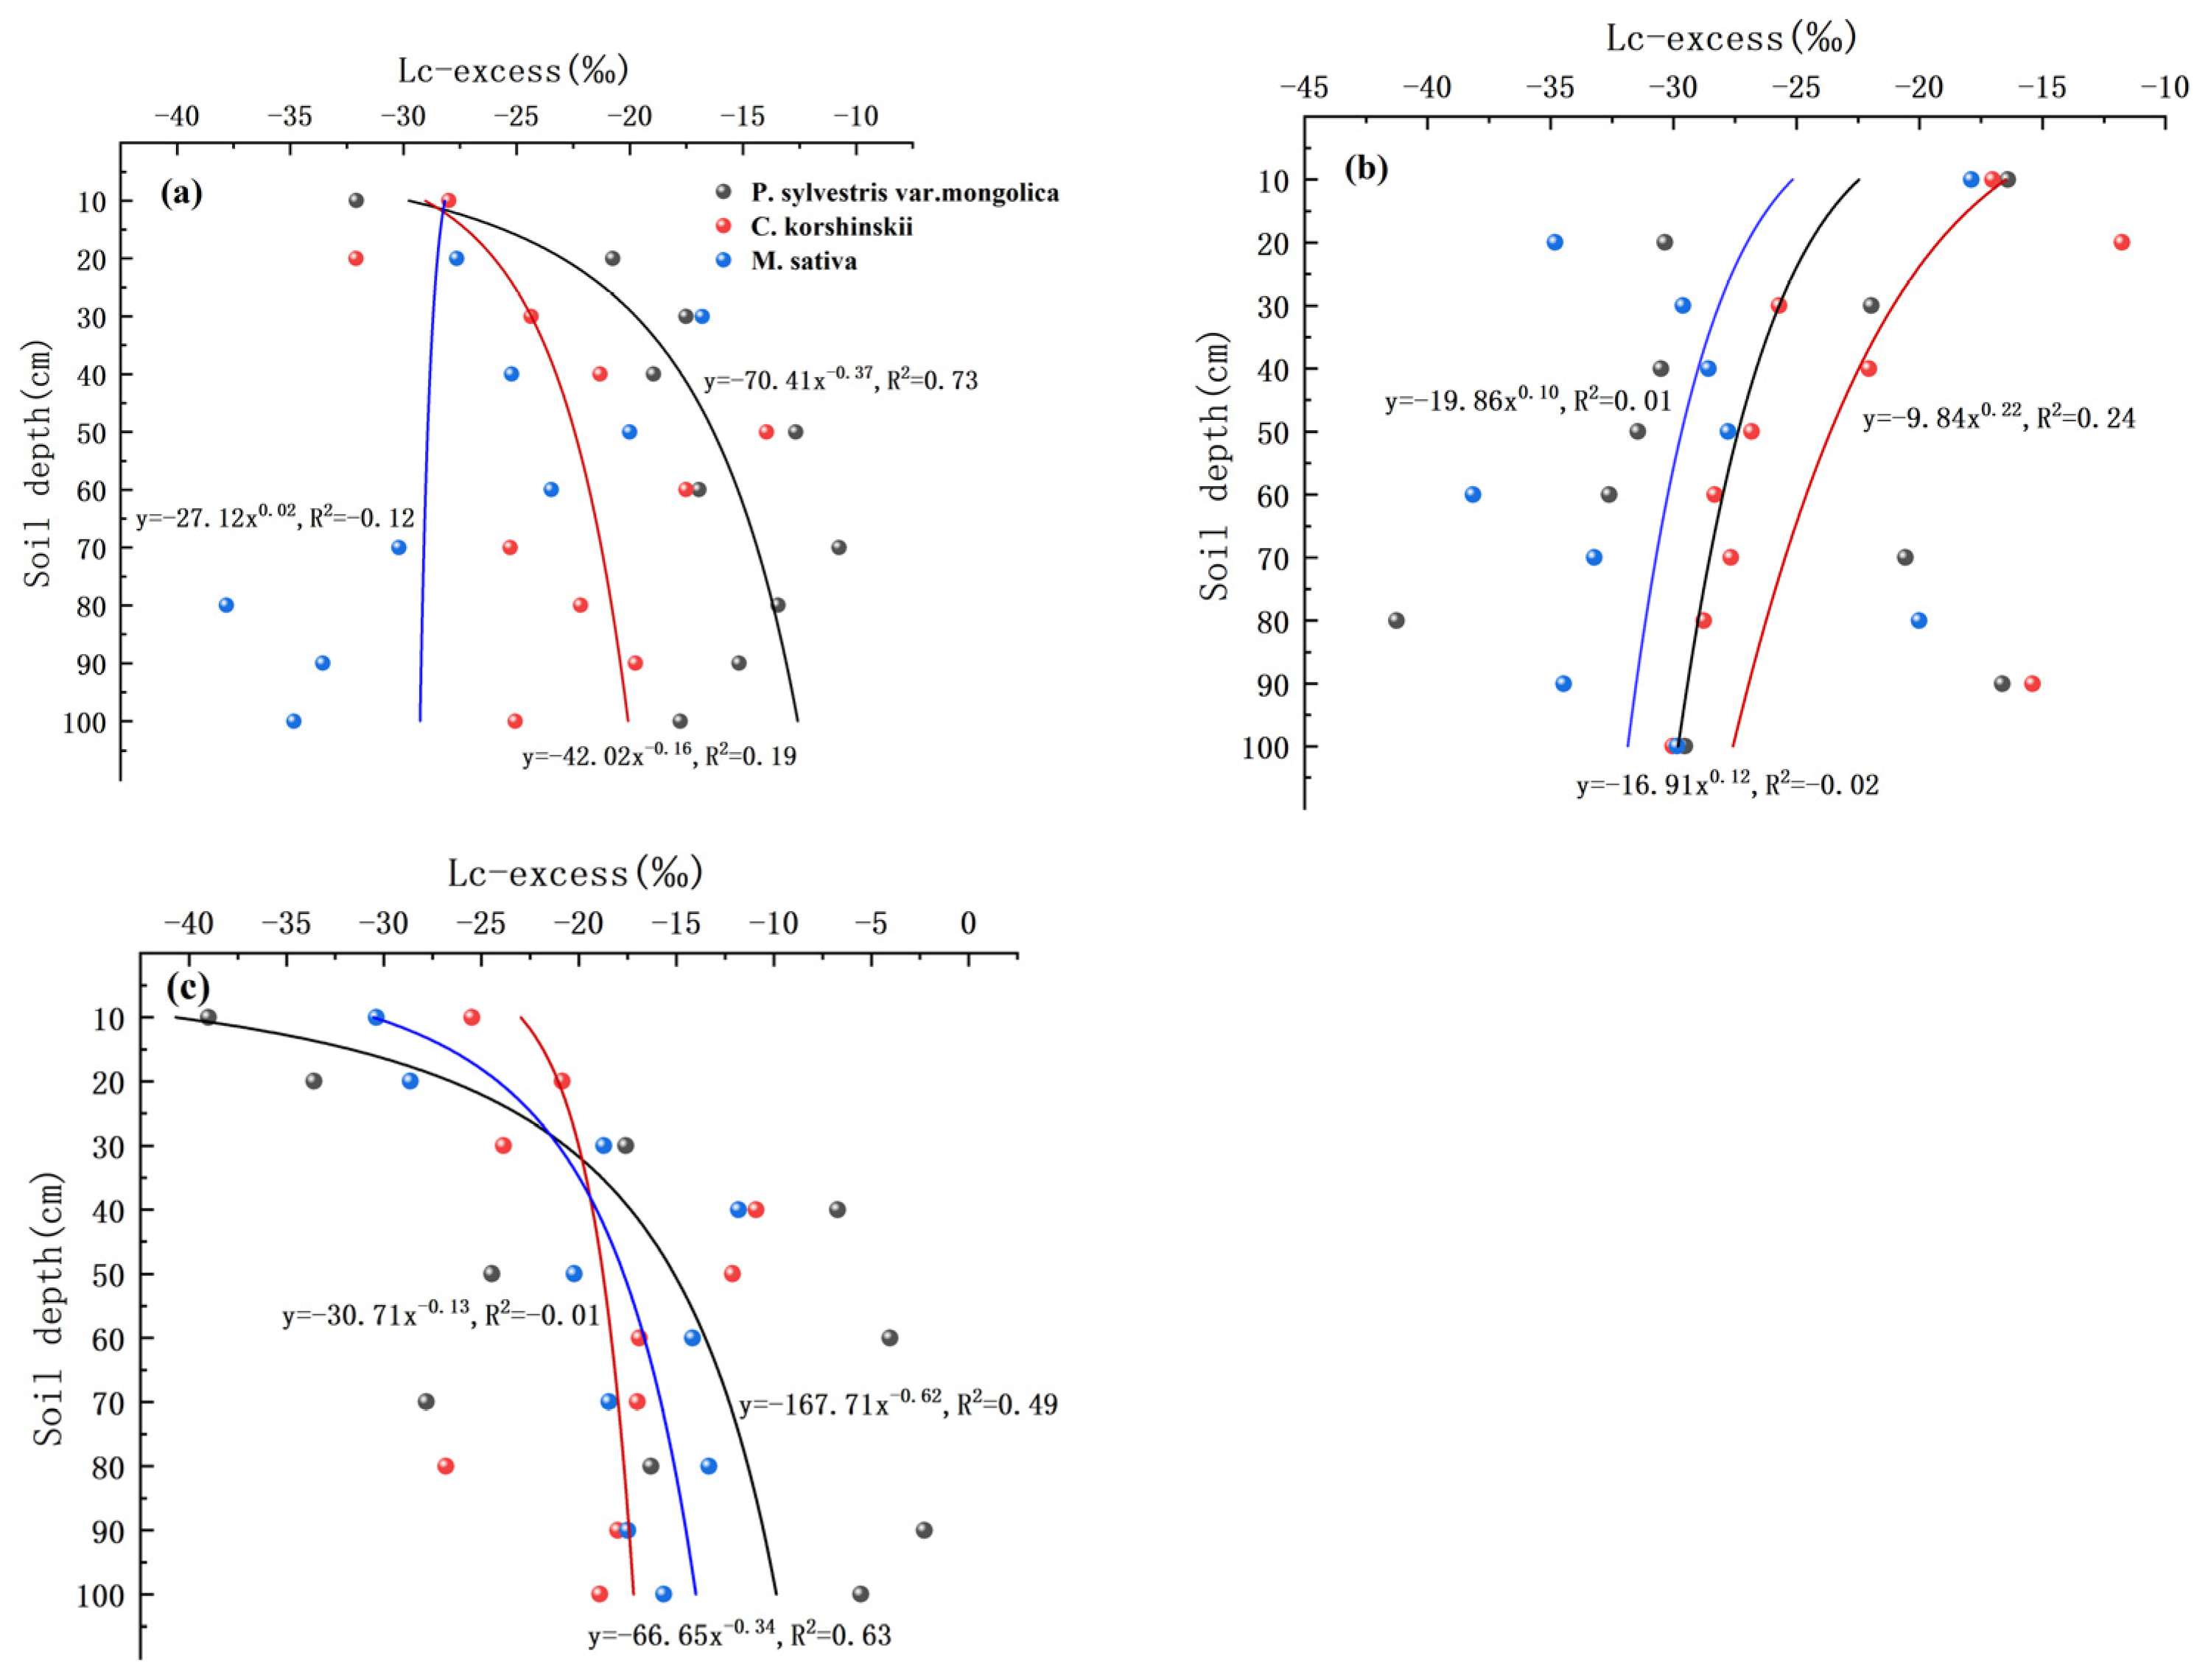
4.1. Distribution Characteristics of Soil Moisture and Stable Isotope

Significant differences are found in SWC and δ2H and δ18O composition at different depths. These two characteristics are mainly affected by precipitation recharge and evapotranspiration and are in a state of constant change [36,37]. June to August is the period of vigorous growth of plants. As the temperature, soil evaporation, and water required for plant transpiration increased, the SWC decreased. In August, the SWC decreased to its lowest value during the whole rainy season, which may have been caused by the strongest soil evaporation. In August, due to the strong evaporation of shallow soil, the water content of shallow soil was low and the δ18O value was high, contrary to the trend of high water content in shallow soil but low δ18O value in soil water in June (Figure 4). This outcome is attributed to the continuous rainfall in the early stage of sampling, which leads to the δ18O value in atmospheric precipitation having a greater impact on shallow soil water. The surface soil moisture of the C. korshinskii site is more sensitive to rainfall, and a significant difference was observed between shallow SWC and deep SWC. This was mainly because during rainfall infiltration, the water storage of shallow soil was larger, and the amount of water infiltrated into the middle and deep layers was less, causing the shallow soil to be affected more by evaporation than in the deep layer [38]. There was little difference in water content between shallow soil and deep soil in the M. sativa site because the surface soil evaporation was related to the atmosphere. In addition, the M. sativa canopy was smaller and the surface bare soil was more seriously affected by evaporation, which was offset by precipitation. This shows that under the combined action of rainfall and evaporation, there are temporal and spatial differences in soil moisture, and different soil layers are affected differently [39,40].
At different soil depths, the fractionation degree of stable isotopes in soil water is also significantly different. The values of δ2H and δ18O in shallow soil are relatively enriched due to the direct influence of precipitation and evaporation. With the increase in soil depth, the values of δ2H and δ18O in soil water gradually decreased. Su Wenxu et al. studied the soil isotope composition of artificial sand-fixing vegetation in the southern margin of Hunshandake Sandy Land. They found that the stable isotope differentiation in shallow soil water was significant due to the combined effect of rainfall infiltration and evaporation, while the stable isotope value in deep soil water was relatively stable [36], which was similar to the results of this study. In August, there was no significant difference in the δ2H and δ18O values of soil water between the P. sylvestris var. mongolica site and the C. korshinskii site. In other months, the δ2H and δ18O values of soil water in the C. korshinskii site were significantly higher than those in the P. sylvestris var. mongolica site, indicating that the higher rainfall limited the evaporation of the P. sylvestris var. mongolica site and the C. korshinskii site. In other months, the fractionation degree of δ2H and δ18O in soil water of the C. korshinskii site was higher than that of the P. sylvestris var. mongolica site. Owing to the abundant rainfall in August, the LC-excess value of soil water increased with the increase in soil depth. The stable isotope in soil water was diluted by rainfall, which inhibited the isotope enrichment caused by evaporation of shallow soil water. With the increase in soil depth, the infiltration of rainwater decreased gradually, and the influence of soil depth on the LC-excess value of deep soil water decreased. In July, the LC-excess value of soil water decreased with the increase in soil depth, indicating that the evaporation of shallow soil was large and attenuated with the increase in soil depth [41].

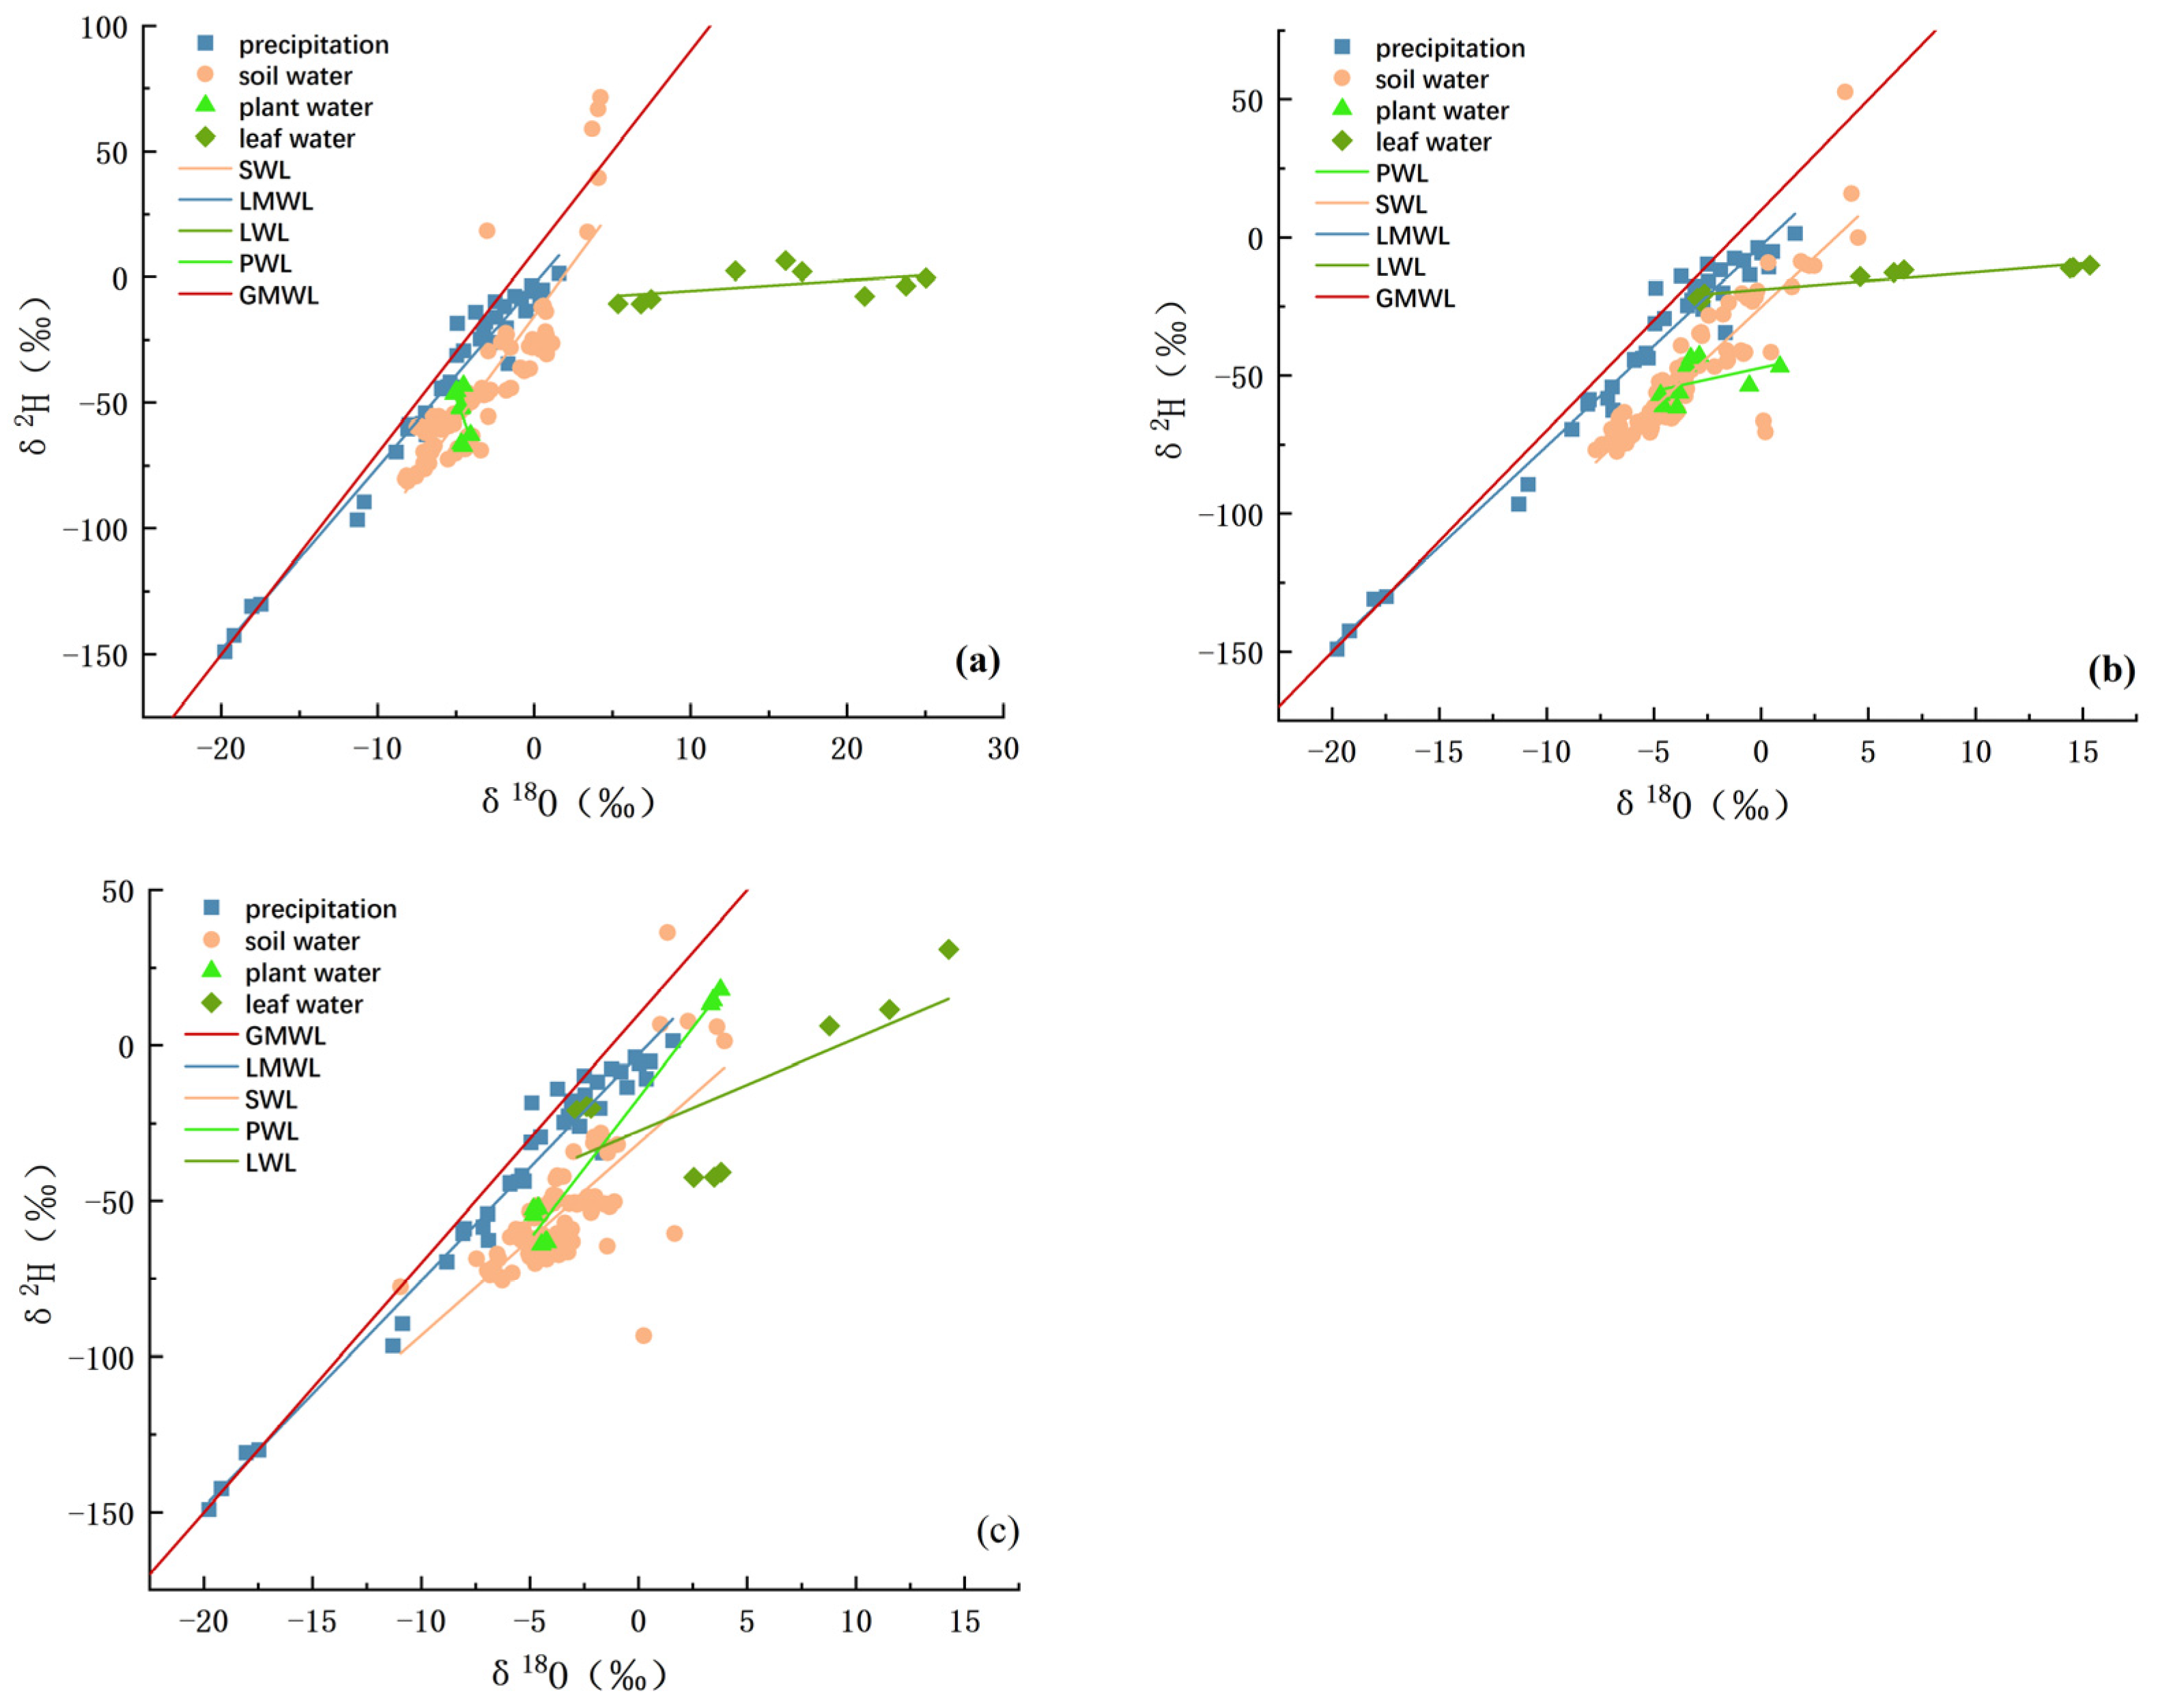
4.2. Characteristics of δ2H and δ18O Compositions in Precipitation, Soil Water, Stem Water, and Leaf Water

The analysis of the relationship between δ2H and δ18O of atmospheric precipitation, plant water, and soil water in the study area revealed that the slope and intercept of LMWL (δ2H = 7.27δ18O − 2.95) are smaller than those of GMWL (δ2H = 8δ18O + 10) [42], indicating that different degrees of evaporation fractionation exist in the process of water vapor transport and rainfall. Most of the isotopic compositions of soil water fall in the lower right of LMWL, and the slope and intercept of the soil water line are smaller than the MWL. This result indicates that the soil water supply in the study area is dominated by rainfall, and soil water is subjected to very strong non-equilibrium evaporation [43]. After rainfall enters the soil, some of it is absorbed by plants, while the remainder evaporates and infiltrates the deep soil from the surface. At the same time, plants transport the water absorbed by roots from the soil through transpiration from the catheter to the leaves, and finally releasing it through the stomata. The isotopic composition of most stem water is distributed near the soil water line, indicating that the main source of stem water is soil water. Plant leaves communicate with the outside atmosphere, and the leaf waterline is less than the slope and intercept of LMWL, indicating that there is a strong evaporation when the leaf water is converted to the atmosphere, which is consistent with the research results of He [44].

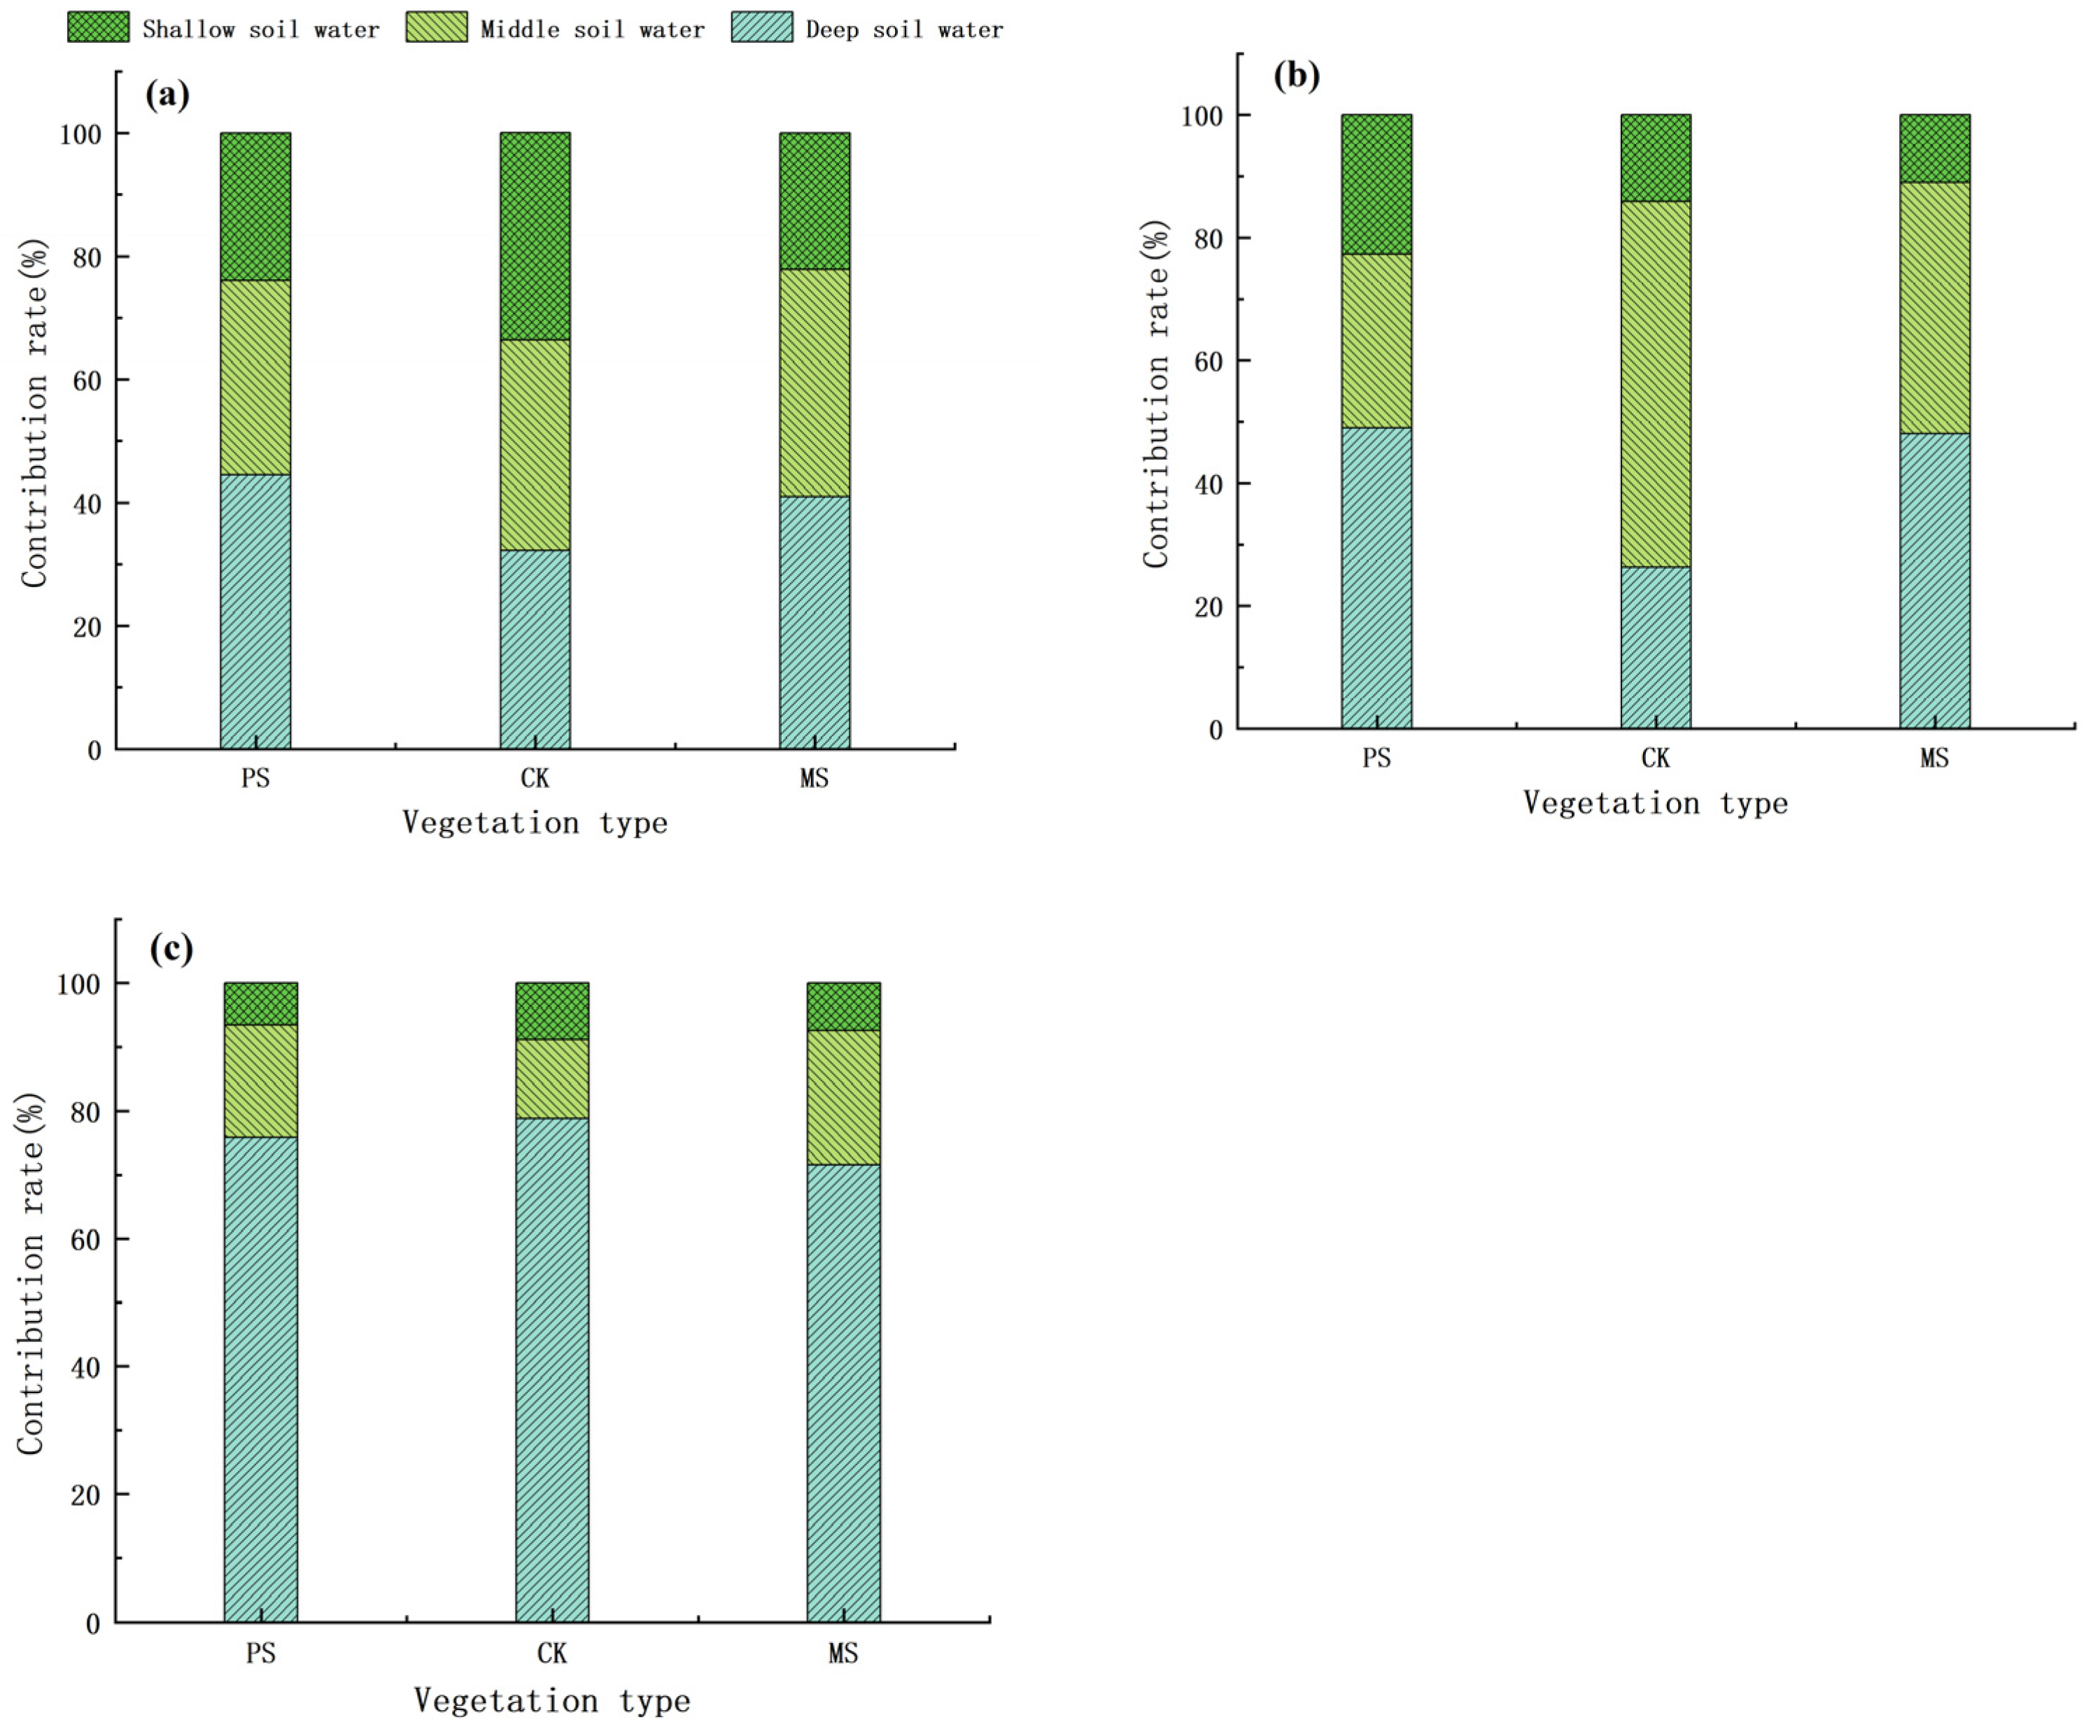
4.3. Different Restoration Plant Water Sources

In this study, the roots of P. sylvestris var. mongolica are mostly distributed in the 0–60 cm soil layer, and the lateral roots are more than 1.5 m long [25]. Therefore, P. sylvestris var. mongolica mainly uses middle and deep soil moisture, of which the soil moisture utilization rate of the 20–60 cm soil layer is 31.6%. As P. sylvestris var. mongolica is a large tree, it needs more water and nutrients to maintain its normal growth. Shallow and middle soil moisture cannot maintain the physiological metabolic process of P. sylvestris var. mongolica, so the lateral roots also use deep soil water. The soil moisture utilization rate of the 60–100 cm soil layer is 44.5%. Most of the fine roots of C. korshinskii are distributed between the 0 and 40 cm soil layer [41]. C. korshinskii not only used shallow soil water (33.7%) but also made full use of middle soil water (34.2%) and deep soil water (32.2%), mainly due to its root distribution characteristics. M. sativa roots are well developed, and most of its fine roots are distributed in the 0–80 cm soil layer [45]. Therefore, soil moisture in the shallow and middle layers is mainly used, with a total utilization ratio of 59%. In addition, plants are more inclined to absorb shallow soil water, mainly because the study area is dominated by loessial soil and the proportion of silt content in soil is the highest. Plant roots cannot extend well to deeper soil to absorb water. Second, shallow soil water has high effectiveness, and precipitation can directly recharge shallow soil water, enabling plants to maximize the use of precipitation resources [46]. The soil moisture content of the 50–60 cm soil layer in the M. sativa site is higher, which is not completely consistent with the water source measured by isotope δ18O. The reason for this phenomenon is the lag in vegetation water consumption, soil water infiltration, and vegetation water use [7]. Therefore, the depth of vegetation water consumption cannot be judged accurately by only the change in soil moisture.
When the soil moisture condition is poor, the shallow plant roots mainly absorb the soil water supplemented by precipitation, and the deep plant roots absorb the soil water supplemented by snowfall, rainfall, and irrigation water [47]. Given that shallow plant roots may be inactive under drought conditions, plant roots can only absorb water from the middle and deep soil when the shallow soil moisture content is low. In August, due to the infiltration of multiple rainfalls in the early stage and the decrease in surface soil moisture content caused by the increase in temperature, P. sylvestris var. mongolica, C. korshinskii, and M. sativa mainly used deep soil water, with utilization rates of 75.8%, 78.8%, and 71.6%, respectively, supported the first hypothesis in this research. Liu [48] studied the water use of typical trees in the Beijing mountainous area, including Platycladus orientalis and Quercus variabilis. The results showed that P. orientalis mainly used 0–20 cm soil water and groundwater in the rainy season and 60–80 cm soil water and groundwater in the dry season. The largest contribution rate of water use in Q. variabilis in the rainy season was 0–20 cm soil water and groundwater, while 0–20 and 60–80 cm soil water were mainly used in the dry season. McCole [26] et al.’s study in the Edwards Plateau shows that Alpine cedars mainly depend on the water in the shallow soil to grow in the rainy season, and in the dry season, they will use deep water and groundwater to maintain life activities. This shows that in the case of sufficient shallow soil moisture, plants will preferentially absorb and utilize shallow soil water [49,50].
Through the above analysis, it can be seen that in June and July, the water use of the three plants was mainly shallow and middle (0–60 cm) soil water. In soil layers with higher soil moisture, plant roots exhibit higher activity, thereby absorbing more water. During the observation period from June to August, the water content of each soil layer in the P. sylvestris var. mongolica site, the Caragana korshinskii site and the M. sativa site showed a downward trend with the passage of time. The water content of deep soil water (60–100 cm) decreased most significantly. The water source of the three plants was transferred from shallow soil water to deep soil water. The contribution rate of deep soil water to plants gradually increased, and the contribution rate of shallow and middle soil water to plants gradually decreased. The transformation of water sources reveals that the three plants have significant dimorphic characteristics, and similar conclusions have been reported in other semi-arid regions [51,52]. Heidaigou open-pit mine dump is located in a semi-arid area. Due to the uneven distribution of rainfall, there may be a long interval between the two rainfall events, resulting in an intermittent drought in the rainy season. The deep soil water in the rainy season had the highest contribution rate to the water of P. sylvestris var. mongolica, indicating that the main roots of P. sylvestris var. mongolica were more developed and showed a strong geotropism, so that it could resist water stress in the case of intermittent drought in the rainy season. For Caragana korshinskii and M. sativa, the utilization ratio of soil water in each layer is more balanced. However, under drought conditions, the shallow soil moisture content is low, forcing plants to use the water in the middle and deep soil instead. The two morphological characteristics of roots of P. sylvestris var. mongolica, Caragana korshinskii, and Medicago sativa are the results of long-term adaptation to the special environment of dump, which play a very important role in the survival and development of plants. The results showed that the water use of P. sylvestris var. mongolica and M. sativa had the same soil layer, so mixed planting should be avoided when selecting tree species for restoration in the dump, or a certain spacing should be kept as far as possible when planting different plant species.

5. Conclusions

In this research, hydrogen and oxygen stable isotopes and the IsoSource model were used to study the water absorption sources of typical plants capable of restoring (P. sylvestris var. mongolica, C. korshinskii, and M. sativa) in the Heidaigou open-pit mine dump. Results showed that the water sources of the three plants were mainly soil water. In different periods of the rainy season, the plants could change the water absorption depth according to the soil water conditions. Under the condition of sufficient soil moisture (June), P. sylvestris var. mongolica and M. sativa mainly absorb shallow and middle soil (0–60 cm) water, with utilization rates of 55.5% and 59%, respectively. The water absorption depth of Caragana korshinskii is more balanced, and the water absorption ratio of shallow, middle and deep soil water is not much different. When the soil moisture content decreased (August), deep soil water (60–100 cm) became the main source of water absorption for the three plants, and the utilization rate was more than 71.7%. For the survival of plants in arid and semi-arid regions, the conversion mechanism of soil water recharge is a key eco-hydrological process. In addition, the water use pattern of C.korshinskii has significant plasticity, and its water absorption depth will be adjusted with the change in soil water availability, it can flexibly use soil water in each layer, and can convert its utilization level to adapt to environmental changes during drought. It may be more suitable for the semi-arid environment of the local dump than P. sylvestris var. mongolica and M. sativa. The research results can provide reference for ecological vegetation restoration and ecosystem management of dumps in the future.

Author Contributions

Conceptualization, J.W. and L.Z.; methodology, J.W.; software, Q.L.; valida-tion, K.L.; formal analysis, L.L.; investigation, J.W., L.Z. and L.L; resources, Q.L.; data curation, K.L.; writing—original draft preparation, J.W.; writing—review and editing, L.L. and L.Z.; visualization, K.L.; supervision, Q.L.; project administration, L.L. All authors have read and agreed to the published version of the manuscript.

Funding

This study was funded by the Project of Integration and Demonstration of Synergistic Rehabilitation Technology of Nutrient Soil Layer Remodelling and Vegetation Construction in Ordos Open Pit Discharge Site (2022YY005), and the Project of Three-dimensional Configuration of Vegetation in Discharge Sites (2022EEDSKJZDZX012-2).

Data Availability Statement

The data presented in this study are available on request from the corresponding author.

Conflicts of Interest

The authors declare no conflicts of interest.

References

  1. Ding, D.; Jia, W.; Ma, X.; Wang, J. Water sources of dominant plants in subalpine shrubland of Qilian Mountains. Ecology 2018, 38, 1348–1356. [Google Scholar]
  2. Hao, S.; Li, F. Study on water use sources of typical desert vegetation in Ebinur Lake Basin. Geogr. J. 2021, 76, 1649–1661. [Google Scholar]
  3. Wu, H.W.; Li, X.Y.; Jiang, Z.Y.; Chen, H.Y.; Zhang, C.C.; Xiao, X. Contrasting water use pattern of introduced and native plants in an alpine desert ecosystem, Northeast Qinghai-Tibet Plateau. China Sci. Total Environ. 2016, 542, 182–191. [Google Scholar] [CrossRef]
  4. Wang, J.; Fu, B.J.; Lu, N.; Zhang, L. Seasonal variation in water uptake patterns of three plant species based on stable isotopes in the semi-arid Loess Plateau. Sci. Total Environ. 2017, 609, 27–37. [Google Scholar] [CrossRef]
  5. Su, P.; Zhang, M.; Qu, D.; Wang, J.; Zhang, Y.U.; Yao, X.; Xiao, H. Contrasting Water Use Strategies of Tamarix ramosissima in Different Habitats in the Northwest of Loess Plateau, China. Water 2020, 12, 2791. [Google Scholar] [CrossRef]
  6. Tang, J. Soil Environmental Effects of Vegetation Restoration in Opencast Coal Mine Dump in Loess Area. Master’s Thesis, Graduate School of Chinese Academy of Sciences (Soil and Water Conservation and Ecological Environment Research Center of Ministry of Education), Beijing, China, 2015. [Google Scholar]
  7. Yang, G.; Wang, L. Water sources and utilization strategies of two typical plants in the dump of Heidaigou open-pit mine. J. Nat. Resour. 2016, 31, 477–487. [Google Scholar]
  8. Peng, L. Study on Water Sources of Typical Desert Plants Based on Oxygen Stable Isotopes. Master’s Thesis, Xinjiang University, Urumqi, China, 2019. [Google Scholar]
  9. Shao, T. Screening of Suitable Plant Species for Vegetation Restoration in Grassland Opencast Coal Mine Dump. Master’s Thesis, Inner Mongolia Agricultural University, Hohhot, China, 2021. [Google Scholar]
  10. Qi, X. Study on the Effect of Vegetation Reconstruction and Restoration in the Dump of Open-Pit Coal Mine in Xilin Gol League. Master’s Thesis, Inner Mongolia Agricultural University, Hohhot, China, 2017. [Google Scholar]
  11. Lü, G. Study on Soil Hydrological Effects of Vegetation Restoration in Open-Pit Coal Mine Dump. Ph.D. Thesis, Shenyang Agricultural University, Shenyang, China, 2017. [Google Scholar]
  12. Xue, J. Study on Physical Characteristics and Improvement of Soil Moisture in Dump of Mining Area. Master’s Thesis, Northwest University of Agriculture and Forestry, Xianyang, China, 2015. [Google Scholar]
  13. Pang, Z. Research on the Present Situation and Control Countermeasures of Soil Erosion Disaster in the Northern Dump of Jinduicheng. Master’s Thesis, Chang’an University, Xi’an, China, 2014. [Google Scholar]
  14. Feng, Y. Effects of Mechanical Compaction on Soil Macropore Structure and Hydraulic Characteristics of Dump in Large Open-Pit Coal Mining Area. Ph.D. Thesis, China University of Geosciences (Beijing), Beijing, China, 2019. [Google Scholar]
  15. Gu, Y. Study on Water and Fertilizer Response and Spatial Variation of Vegetation Restoration in Opencast Coal Mine Dump in Loess Area. Master’s Thesis, China University of Geosciences (Beijing), Beijing, China, 2017. [Google Scholar]
  16. Xu, H.; Li, Y. Water-use strategy of three central Asian desert shrubs and their responses to rain pulse events. Plant Soil 2006, 285, 5–17. [Google Scholar] [CrossRef]
  17. Delzon, S.; Loustau, D. Age-related decline in stand water use: Sap flow and transpiration in a pine forest chronosequence. Agric. For. Meteorol. 2005, 129, 105–119. [Google Scholar] [CrossRef]
  18. Nie, Y.; Chen, H.; Wang, K. Study method of plant water source in shallow soil layer. Appl. Ecol. 2010, 21, 2427–2433. [Google Scholar]
  19. Hardanto, A.; Röll, A.; Hölscher, D. Tree soil water uptake and transpiration in mono-cultural and jungle rubber stands of Sumatra. For. Ecol. Manag. 2017, 397, 67–77. [Google Scholar] [CrossRef]
  20. Zhang, B.J.; Li, Z.X.; Wang, Y.; Li, Y.G.; Lü, Y.M.; Yuan, R.F.; Gui, J. Characteristics of stable isotopes and analysis of water vapor sources of precipitation at the northern slope of the Qilian mountains. Environ. Sci. 2019, 40, 5272–5285. [Google Scholar]
  21. Dawson, T.E.; Ehleringer, J.R. Streamside trees that do not use stream water. Nature 1991, 350, 335–337. [Google Scholar] [CrossRef]
  22. Yang, A.; Fu, Z.; Wang, L.; Xiao, F.; Wang, L.; Fan, P.; Zhang, J. Water use strategy of poplar in Horqin sandy land. J. Beijing For. Univ. 2018, 40, 63–72. [Google Scholar]
  23. Sprenger, M.; Leistert, H.; Gimbel, K.; Weiler, M. Illuminating hydrological processes at the soil-vegetation-atmosphere interface with water stable isotopes. Rev. Geophys. 2016, 54, 674–704. [Google Scholar] [CrossRef]
  24. McCole, A.A.; Stern, L.A. Seasonal water use patterns of Juniperus ashei on the Edwards Plateau, Texas, based on stable isotopes in water. J. Hydrol. 2007, 342, 238–248. [Google Scholar] [CrossRef]
  25. Pei, Y.; Huang, L.; Li, R.; Shao, M.; Zhang, Y. Sources and influencing factors of root water absorption of Pinus sylvestris var. mongolica plantation in southeastern margin of Mu Us Sandy Land. Soil Sci. J. 2022, 59, 1336–1348. [Google Scholar]
  26. Williams, D.G.; Ehleringer, J.R. Intra- and Interspecific Variation for Summer Precipitation Use In Pinyon-Juniper Woodlands. Ecol. Monogr. 2000, 70, 517–537. [Google Scholar]
  27. Martín-Gómez, P.; Barbeta, A.; Voltas, J.; Peñuelas, J.; Dennis, K.; Palacio, S.; Dawson, T.E.; Ferrio, J.P. Isotope-Ratio Infrared Spectroscopy a reliable tool for the investigation of plant-water sources? New Phytol. 2015, 207, 914–927. [Google Scholar] [CrossRef] [PubMed]
  28. Pu, H.; Song, W.; Wu, J. Using Soil Water Stable Isotopes to Investigate Soil Water Movement in a Water Conservation Forest in Hani Terrace. Water 2020, 12, 3520. [Google Scholar] [CrossRef]
  29. Dai, J.; Zhang, X.; Luo, Z.; Wang, R.; Liu, F.; He, X. Stable isotope characteristics of soil water in camphor forest in Changsha and its indication for soil water movement. Environ. Sci. Res. 2019, 32, 974–983. [Google Scholar]
  30. Ding, F.; Yuan, C.; Zhou, T.; Cheng, J.; Wu, P.; Ye, Y. Water-Use Strategies and Habitat Adaptation of Four Tree Species in Karstic Climax Forest in Maolan. Water 2023, 15, 203. [Google Scholar] [CrossRef]
  31. Landwehr, J.; Coplen, T.B. Line-conditioned excess: A new method for characterizing stable hydrogen and oxygen isotope ratios in hydrologic systems. Int. Conf. Isot. Environ. Stud. 2006, 118, 132–135. [Google Scholar]
  32. Sprenger, M.; Tetzlaff, D.; Soulsby, C. Soil water stable isotopes reveal evaporation dynamics at the soil–plant–atmosphere interface of the critical zone. Hydrol. Earth Syst. Sci. 2017, 21, 3839–3858. [Google Scholar] [CrossRef]
  33. Landwehr, J.M.; Coplen, T.B.; Stewart, D.W. Spatial, seasonal, and source variability in the stable oxygen and hydrogen isotopic composition of tap waters throughout the USA. Hydrol. Process. 2014, 28, 5382–5422. [Google Scholar] [CrossRef]
  34. Phillips, D.L.; Newsome, S.D.; Gregg, J.W. Combining sources in stable isotope mixing models: Alternative methods. Oecologia 2005, 144, 520–527. [Google Scholar] [CrossRef]
  35. Xu, X.; Li, Y.; Tan, Z.; Guo, Q. Isotope tracing of water use sources of typical mesophytes in Poyang Lake wetland. Lake Sci. 2020, 32, 1749–1760. [Google Scholar]
  36. Su, W.; Jia, D.; Gao, R.; Lu, J.; Lu, F.; Zhao, F.; Wang, F. Water use characteristics of artificial sand-fixing vegetation in the southern margin of Hunshandake Sandy Land. Appl. Ecol. 2021, 32, 1980–1988. [Google Scholar]
  37. Luo, L.; Gao, X.; Zhao, L.; An, Q.; Ma, N.; Zhao, X. Response of water use strategy of vegetation community to drought stress in loess hilly region. J. Soil Water Conserv. 2023, 37, 280–288. [Google Scholar]
  38. Liu, Z.; Yu, X.; Jia, G.; Jia, J.; Lou, Y.; Lu, W. Contrasting water sources of evergreen and deciduous tree species in rocky mountain area of Beijing, China. Catena 2017, 150, 108–115. [Google Scholar] [CrossRef]
  39. Archer, N.A.; Otten, W.; Schmidt, S.; Bengough, A.G.; Shah, N.; Bonell, M. Rainfall infiltration and soil hydrological characteristics below ancient forest, planted forest and grassland in a temperate northern climate. Ecohydrology 2016, 9, 585–600. [Google Scholar] [CrossRef]
  40. Piles, M.; Entekhabi, D.; Konings, A.G.; McColl, K.A.; Das, N.N.; Jagdhuber, T. Multi-temporal microwave retrievals of Soil Moisture and vegetation parameters from SMAP. In Proceedings of the 2016 IEEE International Geoscience and Remote Sensing Symposium (IGARSS), Beijing, China, 10–15 July 2016. [Google Scholar] [CrossRef]
  41. Liu, X.; Li, Z.; Liu, M.; Xu, B.; Gui, J.; Cui, Q.; Xue, J.; Duan, R. Quantitative analysis of plant water sources in the source region of the Yangtze River. China Desert 2024, 44, 102–110. [Google Scholar]
  42. Pei, Y.; Huang, L.; Shao, M.; Li, R. Characteristics and influencing factors of soil water recharge under different groundwater depths in Zhang Yinglong and Maowusu sandy land. Acta Agric. Eng. Sci. 2021, 37, 108–116. [Google Scholar]
  43. Brinkmann, N.; Seeger, S.; Weiler, M.; Buchmann, N.; Eugster, W.; Kahmen, A. Employing stable isotopes to determine the residence times of soil water and the temporal origin of water taken up by Fagus sylvatica and Picea abies in a temperate forest. New Phytol. 2018, 219, 1300–1313. [Google Scholar] [CrossRef] [PubMed]
  44. He, C.; Liu, T.; Duan, L.; Wang, G.; Hao, L. Water use characteristics of Artemisia halodendron in the Horqin Sandy Land. Deserts China 2022, 42, 190–198. [Google Scholar]
  45. Li, J.; Wu, H.; Zhao, B.; Chen, J.; Song, G. Root architecture characteristics of common slope protection plants at seedling stage under simulated slope conditions. Ecology 2023, 43, 10131–10141. [Google Scholar]
  46. Xu, S.; Zhu, Y.; Wu, C.; Li, Y. Water use strategies of three soil and water conservation tree species in Ordos Plateau. Appl. Ecol. 2020, 31, 2885–2892. [Google Scholar]
  47. Ehleringer, J.R. Water uptake by plants: Perspectives from stable isotope composition. Plant Cell Environ. 1992, 15, 1073–1082. [Google Scholar] [CrossRef]
  48. Liu, Z.Q.; Yu, X.X.; Jia, G.D.; Jia, J.B.; Lou, Y.H.; Zhang, K. Water use characteristics of Platycladus orientalis and Quercus variabilis in Beijing mountainous area. For. Sci. 2016, 52, 22–30. [Google Scholar]
  49. Kan, J.; Jia, D.; Guo, S.; Qian, L. Isotopic tracing of water source of Salix gordejevii growing season in Hunshandake Sandy Land in 2014. Arid Area Study 2017, 34, 350–355. [Google Scholar]
  50. Deng, W.; Yu, X.; Jia, G.; Li, Y.; Liu, Y. Water sources of three typical plants in Beijing mountainous area during rainy season. Study Arid Area 2014, 31, 649–657. [Google Scholar]
  51. Xu, Y.; Guan, J.; Deng, L. Characteristics and influencing factors of vegetation and soil moisture change in sandy land in alpine and semi-arid region. Acta Ecol. Sin. 2024, 13, 1–13. [Google Scholar] [CrossRef]
  52. Wu, G.; Zhang, D.; Zhang, Z.; Dan, L. Spatial structure characteristics of sand-fixing shrubs on semi-fixed dunes in Gurbantunggut Desert. J. Grassl. 2024, 1–21. Available online: http://kns.cnki.net/kcms/detail/11.3362.S.20240417.1338.014.html (accessed on 20 May 2024).
Figure 1. Location of the study area.
Forests 15 00906 g001
Figure 2. Plot images of the three plant species.
Forests 15 00906 g002
Figure 3. Variation characteristics of precipitation, temperature, and relative humidity at the (a) monthly scale and (b) seasonal scale in the study area.
Forests 15 00906 g003
Figure 4. Characteristics of soil moisture content and δ2H and δ18O values in soil water in different soil layers. ((AC): Represents the Pinus sylvestris var. mongolica site; (DF): Represents the Caragana korshinskii site; (GI): Represents the Medicago sativa site).
Forests 15 00906 g004
Figure 5. Vertical distribution characteristics of LC-excess value of soil water. ((ac): Represents the chronological months from June to August).
Forests 15 00906 g005
Figure 6. Relationship between δ2H and δ18O in precipitation, soil water, stem water, and leaf water in the study area from June to August: (a) Pinus sylvestris site, (b) Caragana korshinskii site, and (c) Medicago Sativa site; GMWL: global meteoric water line; LMWL: local meteoric water line; SWL: soil water line; PWL: plant water line; LWL: leaf water line.
Forests 15 00906 g006
Figure 7. Changes of δ18O in stem water and soil water of Pinus sylvestris var. mongolica, Caragana korshinskii, and Medicago sativa stem. (AC): Represents P. sylvestris var. mongolica; (DF): Represents C. korshinskii; (GI): Represents M. sativa).
Forests 15 00906 g007
Figure 8. Utilization ratio of potential water sources by Pinus sylvestris var. mongolica, Caragana korshinskii, and Medicago sativa. (PS: Pinus sylvestris; CK: Caragana korshinskii; MS: Medicago sativa) ((ac): Represents the chronological months from June to August).
Forests 15 00906 g008
Table 1. Basic physical and chemical properties of the study area.
Plot TypeNew Structure Covering SoilReclamation Years/aElevation above Sea Level/mSoil Composition/%Bulk Density/(g/cm3)Total Nitrogen/(g/kg)Total Phosphorus/(g/kg)Total Potassium/(g/kg)
ClaySiltSand
Pinus sylvestrisyellow loamy soil201412188.7351.6639.611.580.150.3715.71
Caragana korshinskiiyellow loamy soil201412248.2964.2127.51.570.180.4314.29
Medicago sativayellow loamy soil201412067.9365.526.571.480.170.4015.35
‘a’ represents the year.
Table 2. Plant growth status of sample plots.
Plant FormPosition
(° ′ ″)
OrientationElevation/mPlant Height/mCrown/mPlant Spacing/mLife Form
Pinus sylvestris39°79′17″ N
111°27′07″ E
Northwest12182.52 ± 0.3(2.53 ± 0.12) × (1.81 ± 0.05)2 × 2Evergreen trees
Caragana korshinskii39°78′51″ N
111°26′49″ E
South12241.55 ± 0.2(1.97 ± 0.1) × (1.74 ± 0.09)2 × 2Evergreen shrubs
Medicago sativa39°78′48″ N
111°26′51″ E
East12061.12 ± 0.15(1.76 ± 0.11) × (1.57 ± 0.07)2 × 2Perennial herbs
Table 3. The characteristics of δ2H and δ18O in each potential water source.
Water Body TypeVegetation Typeδ2Hδ18OFitting EquationR2
Atmospheric
precipitation
−149.1‰ to 1.44‰−19.77‰ to 0.53‰δ2H = 7.27δ18O − 2.950.97
Soil waterPinus sylvestris−81.37‰ to 71.36‰−8.25‰ to 4.25‰δ2H = 7.18δ18O − 15.590.77
Caragana korshinskii−77.51‰ to 52.73‰−7.71‰ to 4.52‰δ2H = 7.25δ18O − 25.280.77
Medicago sativa−93.35‰ to 36.34‰−10.95‰ to 3.96‰δ2H = 6.17δ18O − 31.490.52
Xylem waterPinus sylvestris−67.06‰ to −43.32‰−5.1‰ to 0.07‰δ2H = −16.83δ18O − 132.520.19
Caragana korshinskii−61.55‰ to −42.93‰−4.69‰ to 0.88‰δ2H = 1.70δ18O − 47.210.07
Medicago sativa−63.94‰ to −17.97‰−4.83‰ to 3.77‰δ2H = 9.07δ18O − 16.890.97
Leaf waterPinus sylvestris−10.69‰ to 6.47‰5.36‰ to 25.05‰δ2H = 0.41δ18O − 9.630.12
Caragana korshinskii−23.06‰ to −10.05‰−2.97‰ to 15.33‰δ2H = 0.64δ18O − 18.900.85
Medicago sativa−42.49‰ to 30.96‰−2.84‰ to 14.27‰δ2H = 2.98δ18O − 27.500.43
Disclaimer/Publisher’s Note: The statements, opinions and data contained in all publications are solely those of the individual author(s) and contributor(s) and not of MDPI and/or the editor(s). MDPI and/or the editor(s) disclaim responsibility for any injury to people or property resulting from any ideas, methods, instructions or products referred to in the content.

