Article

Monitoring Changes in Composition and Diversity of Forest Vegetation Layers after the Cessation of Management for Renaturalization

1
College of Civil and Architecture Engineering, Chuzhou University, Chuzhou 239000, China
2
College of Forestry and Landscape Architecture, Anhui Agricultural University, Hefei 230036, China
3
Key Laboratory of Vegetation Restoration and Management of Degraded Ecosystems, South China Botanical Garden, Chinese Academy of Sciences, Guangzhou 510650, China
4
University of Chinese Academy of Sciences, Beijing 100049, China
*
Author to whom correspondence should be addressed.
Forests 2024, 15(6), 907; https://doi.org/10.3390/f15060907
Submission received: 28 March 2024 / Revised: 20 May 2024 / Accepted: 21 May 2024 / Published: 23 May 2024
(This article belongs to the Special Issue Ecosystem-Disturbance Interactions in Forests)

Abstract

:
Overstory and understory vegetation play a vital role in forest ecosystem functionality. However, it is necessary to enhance the knowledge of their diversity and compositional dynamics following cessation of disturbance, which is required to inform restoration approaches and the mechanisms required for maintaining disturbance cessation. We conducted a chronosequence spanning 0–1, 5–6, 11–12, 20–24, and 28–34 years since disturbance cessation, and old-growth forests to investigate the dynamic changes in overstory and understory vegetation diversity and composition, as well as maintenance mechanisms following the cessation of anthropogenic disturbances in subtropical regions of Eastern China. The current study results indicated a decrease in understory cover and periodic fluctuations in the diversity of overstorey and understory vegetation following disturbance cessation efforts. Specifically, the shrub layer exhibited the highest richness in 28–34 years, while the herb layer showed the lowest evenness. Multivariate analysis using multiple-response permutation procedures indicated that the species composition and interspecific quantity ratio of understory plants in the forest at 28–34 years significantly differ from those in the early closure stage. An indicator species analysis revealed that more support was given to sun-loving plants after 0–1 years of the enclosure, while species with shade tolerance and low nutrient requirements were supported after 28–34 years. The structural equation model results show that 38.8% of the impact on herb evenness was related to light and substrate diversity. The ecological restoration time mainly indirectly affects understory vegetation by influencing the upper vegetation, light availability, and substrate heterogeneity. Overall, this study revealed that cessation of anthropogenic disturbance can maintain and care for understorey plant diversity and contribute to the sustainable management of forests.

1. Introduction

Human activities, including deforestation and excessive resource exploitation, have led to the degradation of global forests, posing significant threats to biodiversity and ecosystem functionality [1,2,3,4]. Consequently, restoring forest biodiversity, community structure, and ecological complexity has become paramount in global ecological research [5]. Central to the restoration of degraded forest ecosystems is the role of vegetation, which enhances soil nutrient cycling and energy flow and contributes significantly to ecosystem functioning [6,7]. Despite the importance of vegetation in ecological restoration efforts, there remains a critical gap in our understanding regarding the dynamics of vegetation diversity and composition, particularly in the subtropical forests of Eastern China. Comprehending these dynamics is essential for developing effective restoration strategies and maintaining restoration outcomes.
Numerous ecological processes influence vegetation dynamics, including species evolution, environmental factors, and disturbances [8,9,10]. These processes operate across various spatial and temporal scales, shaping patterns of vegetation regeneration and community development [11,12]. A longstanding debate exists regarding the extent of restoration achievable in degraded natural secondary forests, which are tree formations that replace climax forests due to alterations or loss of environmental conditions, often resulting from degradation of edaphic conditions [8]. According to phytosociological and symphytosociological models of vegetation succession, a secondary forest undergoes tree replacement and upward plant dynamics towards a climax stage within the vegetation series. This concept is supported by Cano-Ortiz et al. (2015) [13], Rivas-Martínez et al. (1999, 2011) [14,15], Corlett (1994) [16], Chokkalingam and De Jong (2001) [17], and other researchers in the field.
For example, Norden et al. (2009) [18] proposed that secondary rainforests exhibit high resilience and can rapidly recover species composition similar to undisturbed forests; others indicate that the loss of species richness may be irreversible, even over extended periods [19]. These differences highlight the complex interactions between factors affecting vegetation recovery outcomes following the cessation of anthropogenic disturbance, including species invasions and environmental conditions [8,20,21]. Moreover, the duration and intensity of restoration interventions, such as enclosure and cessation of anthropogenic disturbances, also influence vegetation recovery trajectories [22,23,24,25]. Over time, as ecosystems transition from early to mature stages of restoration, shifts in vegetation structure and composition occur, affecting the abundance and distribution of species across different strata.
Despite advancements in understanding these dynamics, significant gaps persist in our knowledge, particularly regarding the mechanisms underlying the maintenance of restoration outcomes and the interactions between overstory and understory vegetation [26,27,28,29]. Addressing these gaps is crucial for informing evidence-based restoration practices and enhancing the resilience of subtropical forests in Eastern China [26,27]. The existing literature provides valuable insights into the dynamics of vegetation diversity and composition during ecological restoration. However, there remains a notable research gap concerning the maintenance mechanisms of restoration outcomes, especially in subtropical forest ecosystems of Eastern China. Understanding how overstory and understory vegetation interact and influence each other’s dynamics following disturbance cessation efforts is essential for developing targeted restoration strategies and ensuring long-term ecological resilience [26,27,28,29,30].
To date, considerable insight has been accumulated into the effects of disturbance cessation on understory cover, diversity, and composition. To fill critical knowledge gaps in our understanding of vegetation dynamics following ecological restoration in subtropical forests, this study aimed to evaluate plant diversity and community composition changes over the years following disturbance cessation and after enclosure. Additionally, this study aimed to determine whether specific plant groups emerged during different stages of recovery, thereby shedding light on the succession patterns within these ecosystems. Lastly, this study sought to explore the mechanisms influencing understory herb diversity by considering factors such as overstory, light resources, and substrate diversity post-enclosure. Specifically, we hypothesized that (1) species richness in the overstory layer will exhibit an initial increase followed by a subsequent decline with increasing time since disturbance cessation; (2) increasing enclosure time will result in fluctuations in herb diversity, with different species indicative of each succession stage; and (3) tree stems’ basal area and species diversity will directly affect understory vegetation’s coverage and species diversity over time, with additional indirect effects mediated by changes in light availability and substrate diversity.

2. Materials and Methods
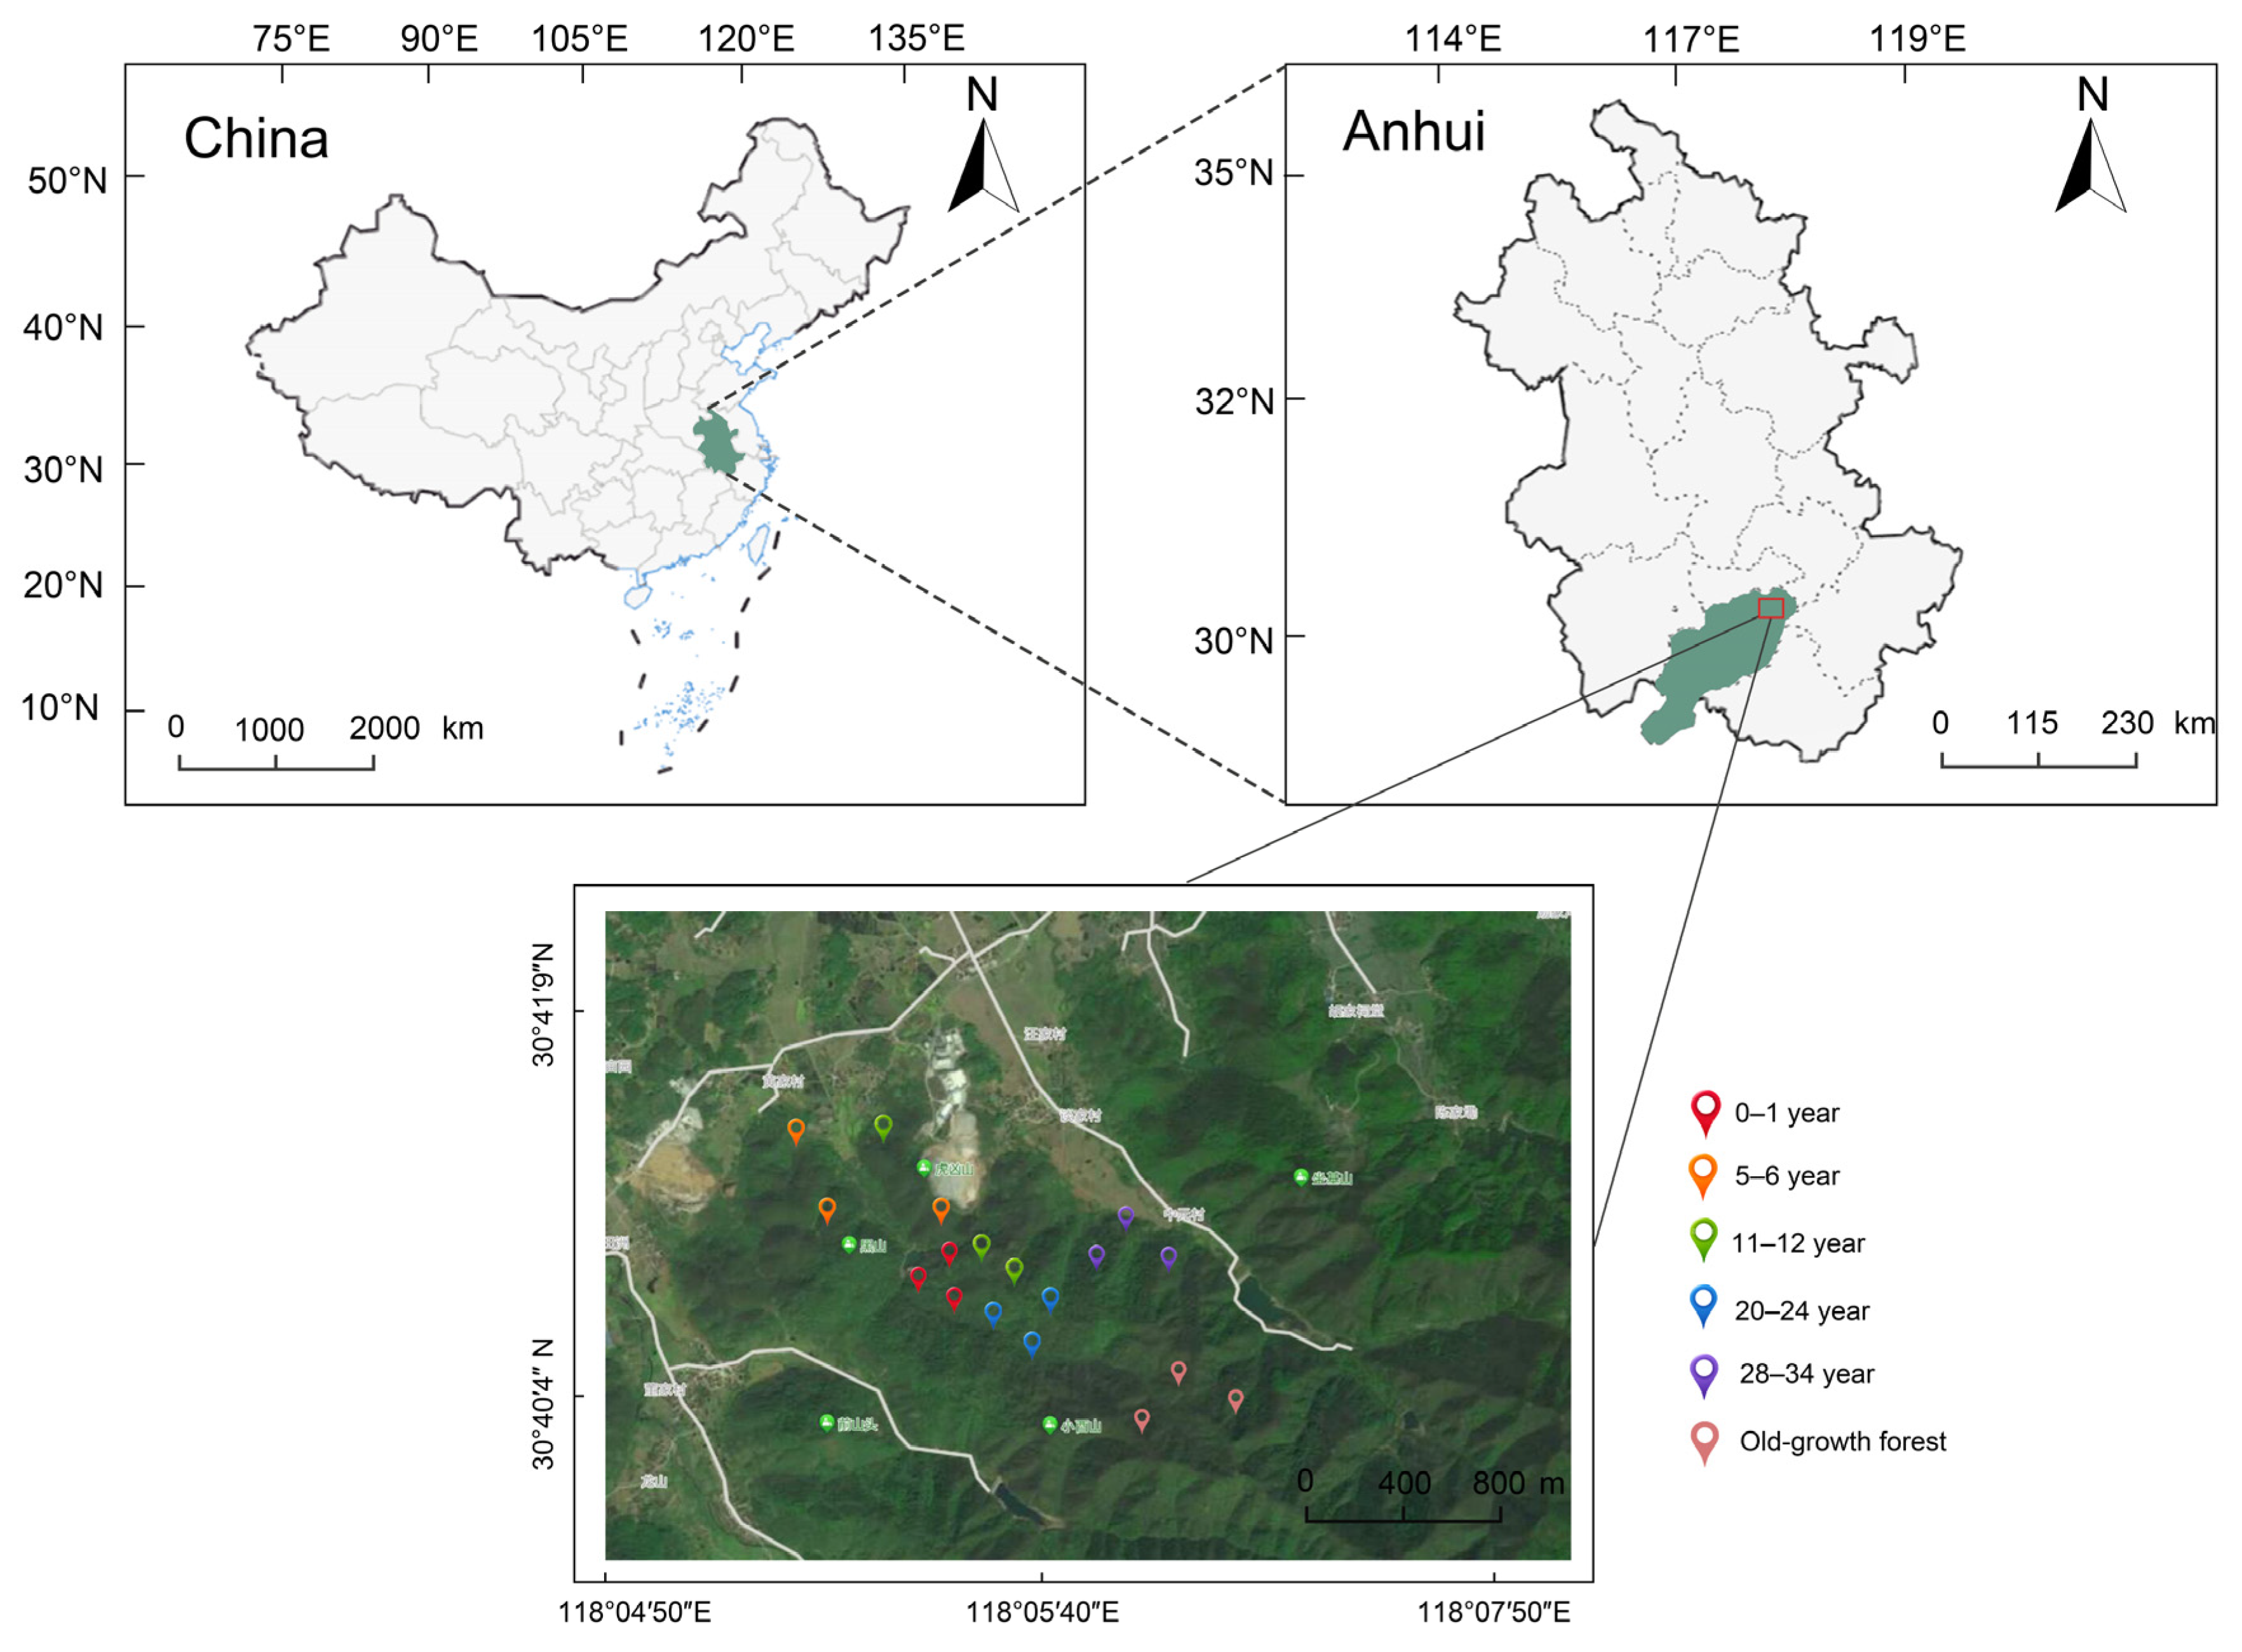
2.1. Study Area

This study was conducted in the forests of Qingyang County, Anhui Province, China (30°19′ to 30°50′ N and 117°40′ to 118°07′ E), characterized by a subtropical monsoon climate featuring hot summers, cold winters, and mild springs and autumns. The mean annual temperature is 16.1 °C, and the average annual precipitation is 1600 mm, recorded from 1985 to 2019 at the nearest meteorological station in Qingyang County, Anhui Province. The soils are classified as brown calcareous soils or Cambisols by the International Union of Soil Science (IUSS) Working Group (WRB 2014), originating from the weathering of limestone rock soil with a thickness ranging from 30 to 100 cm. These soils are characterized by medium to fine-textured parent materials and contain abundant potassium and calcium but limited phosphorus [31]. The forests within our research area have undergone a prolonged period of degradation due to excessive utilization, encompassing repeated instances of selective harvesting, firewood extraction, and grazing. Only a small area retains primary forest conditions, characterized by minimal human disturbance over the past 100 years and exhibiting the characteristics of climax communities (dominated by deciduous broad-leaved tree species Liquidambar formosana and Cornus kousa subsp. chinensis) [31,32]. Additionally, mountain closures have protected these study forests from anthropogenic disturbance since the early 1980s. This measure has been widely adopted due to its low cost and has become one of China’s main ecological restoration methods [31,32,33,34,35,36].

2.2. Sampling Design

The chronosequence approach, suitable for studying successional processes over decadal to centennial time scales, was utilized to sample stands varying in the time since disturbance cessation [31,32,33,34,35,36]. All sampled stands were established on similar-condition sites to ensure that time since disturbance cessation is the primary driver for changes in our sample stands. These sites share comparable topographic positions, such as middle slopes, and feature identical parent materials, such as calcareous and silty loam soils (confirmed through on-site investigation and ribbon tests). Furthermore, these sites shared a common origin regarding disturbances, specifically repetitive fuelwood harvesting and domestic grazing [31,32]. Following a preliminary investigation of stand age classes in the study area, we sampled six age classes in August 2019: 0–1 years, 5–6 years, 11–12 years, 20–24 years, and 28–34 years since disturbance cessation, and old-growth forests (Figure 1 and Table 1).
Multiple successional pathways are common in disturbance-driven forests, particularly those subjected to frequent disturbances from diverse agents [26,37]. This study focused on the broadleaf successional pathway, including Liquidambar formosana Hance, Quercus acutissima Carruth., and Lindera glauca var. kawakamii.
To mitigate spatial autocorrelation and minimize sampling subjectivity, we employed stratified random sampling, essential for any statistical test to make inferences about the population of interest [38]. Initially, we utilized forest history survey data to identify all available stands (with stand identification numbers) for each age class (i.e., the sampling frame). Subsequently, we utilized a random number generator in Microsoft Excel 2021 and R (version 4.0.4) to match random numbers with standard numbers in the database. The matched stands were selected as candidate stands for sampling. Further, we conducted a field survey to verify our candidate stands, additionally examining site conditions and disturbance history through interviews with nearby residents to determine the unenclosed stands and the degree of degradation (i.e., fuelwood felling) and the type of enclosed forests (i.e., broadleaf mixed forests such as Liquidambar formosana Hance and Quercus acutissima Carruth., etc.) of enclosed forests before disturbance cessation.
For each of the six classes, three replicate plots were selected to enhance forest-level inference in these rugged topographies, resulting in 18 sample plots, each spanning an area of over 1 ha. Distances between stands were set at >100 m to minimize spatial autocorrelation.

2.3. Field Measurements

A 20 m × 20 m plot was randomly allocated for each sampled stand, maintaining a minimum distance of 100 m from stand edges adjacent to agricultural areas, roads, or variably aged forests. Subsequently, tree species were identified, and their diameters at breast height (DBH 1.3 m above the root collar) were measured, along with the height of all live trees with a DBH of ≥2 cm. Species-specific basal areas were calculated at the plot level to determine Shannon’s index based on species-specific basal area proportions [26,37]. The total abundance at each plot was calculated as the sum of the percent cover of all vegetation species present, providing a comprehensive assessment of the ecological composition within the study area. Determination of total species richness relied on the number of species sampled at each site, while overall evenness quantified how evenly species were distributed within a site. Evenness was computed following Pielou et al. (1979) [39].
We followed the methodology described in Kumar’s paper [40], using the mean of the canopy openness measured in each sample (light mean) to express the average light availability (light availability) while using their standard deviation (light sd) to express the heterogeneity of light, i.e., the value of inhomogeneity (light variability). We estimated the percent cover of above-ground bare rock, apoplastic material, exposed soil, upturned rooted soil, and fallen coarse dead wood debris within each 20 m × 20 m sample plot and used the formula for Shannon’s diversity index to obtain a substrate diversity index to assess the heterogeneity of the soil substrate [26,37].

2.4. Data Analysis

To assess changes in soil properties and vegetation diversity over time since disturbance cessation, we conducted one-way analyses of variance (ANOVA) with a least significant difference (LSD) test, treating time since disturbance cessation as a fixed factor and soil properties along with vegetation diversity as responses. Before analysis, we confirmed assumptions of homogeneity and normality using the Bartlett test and Shapiro test, respectively. In cases where data did not meet the normality assumption, we also performed non-parametric Kruskal–Wallis tests. Significance was determined at p < 0.05 between groups.
Additionally, we utilized non-metric multidimensional scaling (NMDS) plots to visualize relationships between soil microbial community composition and years since disturbance cessation, employing Bray–Curtis distances computed with the “Vegan” package in R software (version 4.0.4). Subsequently, ANOSIM (999 permutations) in R was employed to assess significant differences in understory vegetation community composition across years since disturbance cessation. To investigate variations in understory composition with years since disturbance cessation, we conducted PerMANOVA (permutational multivariate analysis of variance) tests for understory species separately. PerMANOVA utilized Bray–Curtis dissimilarity matrices to summarize species composition and conducted 999 permutations to determine statistical significance. We further employed indicator species analyses using the “indicspecies” package to identify species associated with different years since disturbance cessation. The ‘multipatt’ command provided lists of species linked to specific sample groups, and 999 permutations were used to identify statistically significant species (p < 0.05). We calculated specificity (positive predictive value of species as an indicator of a site group) and sensitivity (probability of finding the species in sites belonging to the site group) associated with each indicator value.
A structural equation model (SEM) was used to investigate the pathways affecting the maintenance of understory plant diversity during the enclosure process. Initially, a model was developed to provide theoretical explanations for the correlation between upper canopy tree diversity, light availability, substrate diversity, and understory herbaceous plant diversity based on the observed effects of closure years on understory plants. Before conducting structural equation modeling, all data underwent a logarithmic transformation, correlation analysis, and removal of non-significant variables. Subsequently, the “lava” package was utilized in R software to establish and analyze a structural equation model. Model fit was evaluated using chi-square value (CHISQ), degrees of freedom (df), root mean square approximation error (RMSEA), and comparative fit index (CFI). All analyses were performed using R version 4.0.4.

3. Results

3.1. Overstory Stem Basal Area and Understory Vegetation Cover

Significant variations were observed in the stem basal area of the overstory (p < 0.001), shrub cover (p = 0.018), and herb cover (p < 0.001) concerning time since disturbance cessation (Figure 2 and Table 2). Initially, the stem basal area of the overstory was lowest at 0–1 years (2.0 m2 ha−1) but showed a consistent increase over time, reaching 42.9 m2 ha−1 in old-growth forests. In contrast to the overstory’s stem basal area, shrub and herb cover decreased gradually over the disturbance cessation period. While no discernible difference in shrub and herb cover was noted during the early stages of disturbance cessation, a significant decrease was observed after 30 years of recovery. Interestingly, the cover of shrubs and herbs in the 28–34 years stage and old-growth forests exhibited similar levels, indicating a stabilization or plateauing effect in vegetation cover at later stages of recovery.

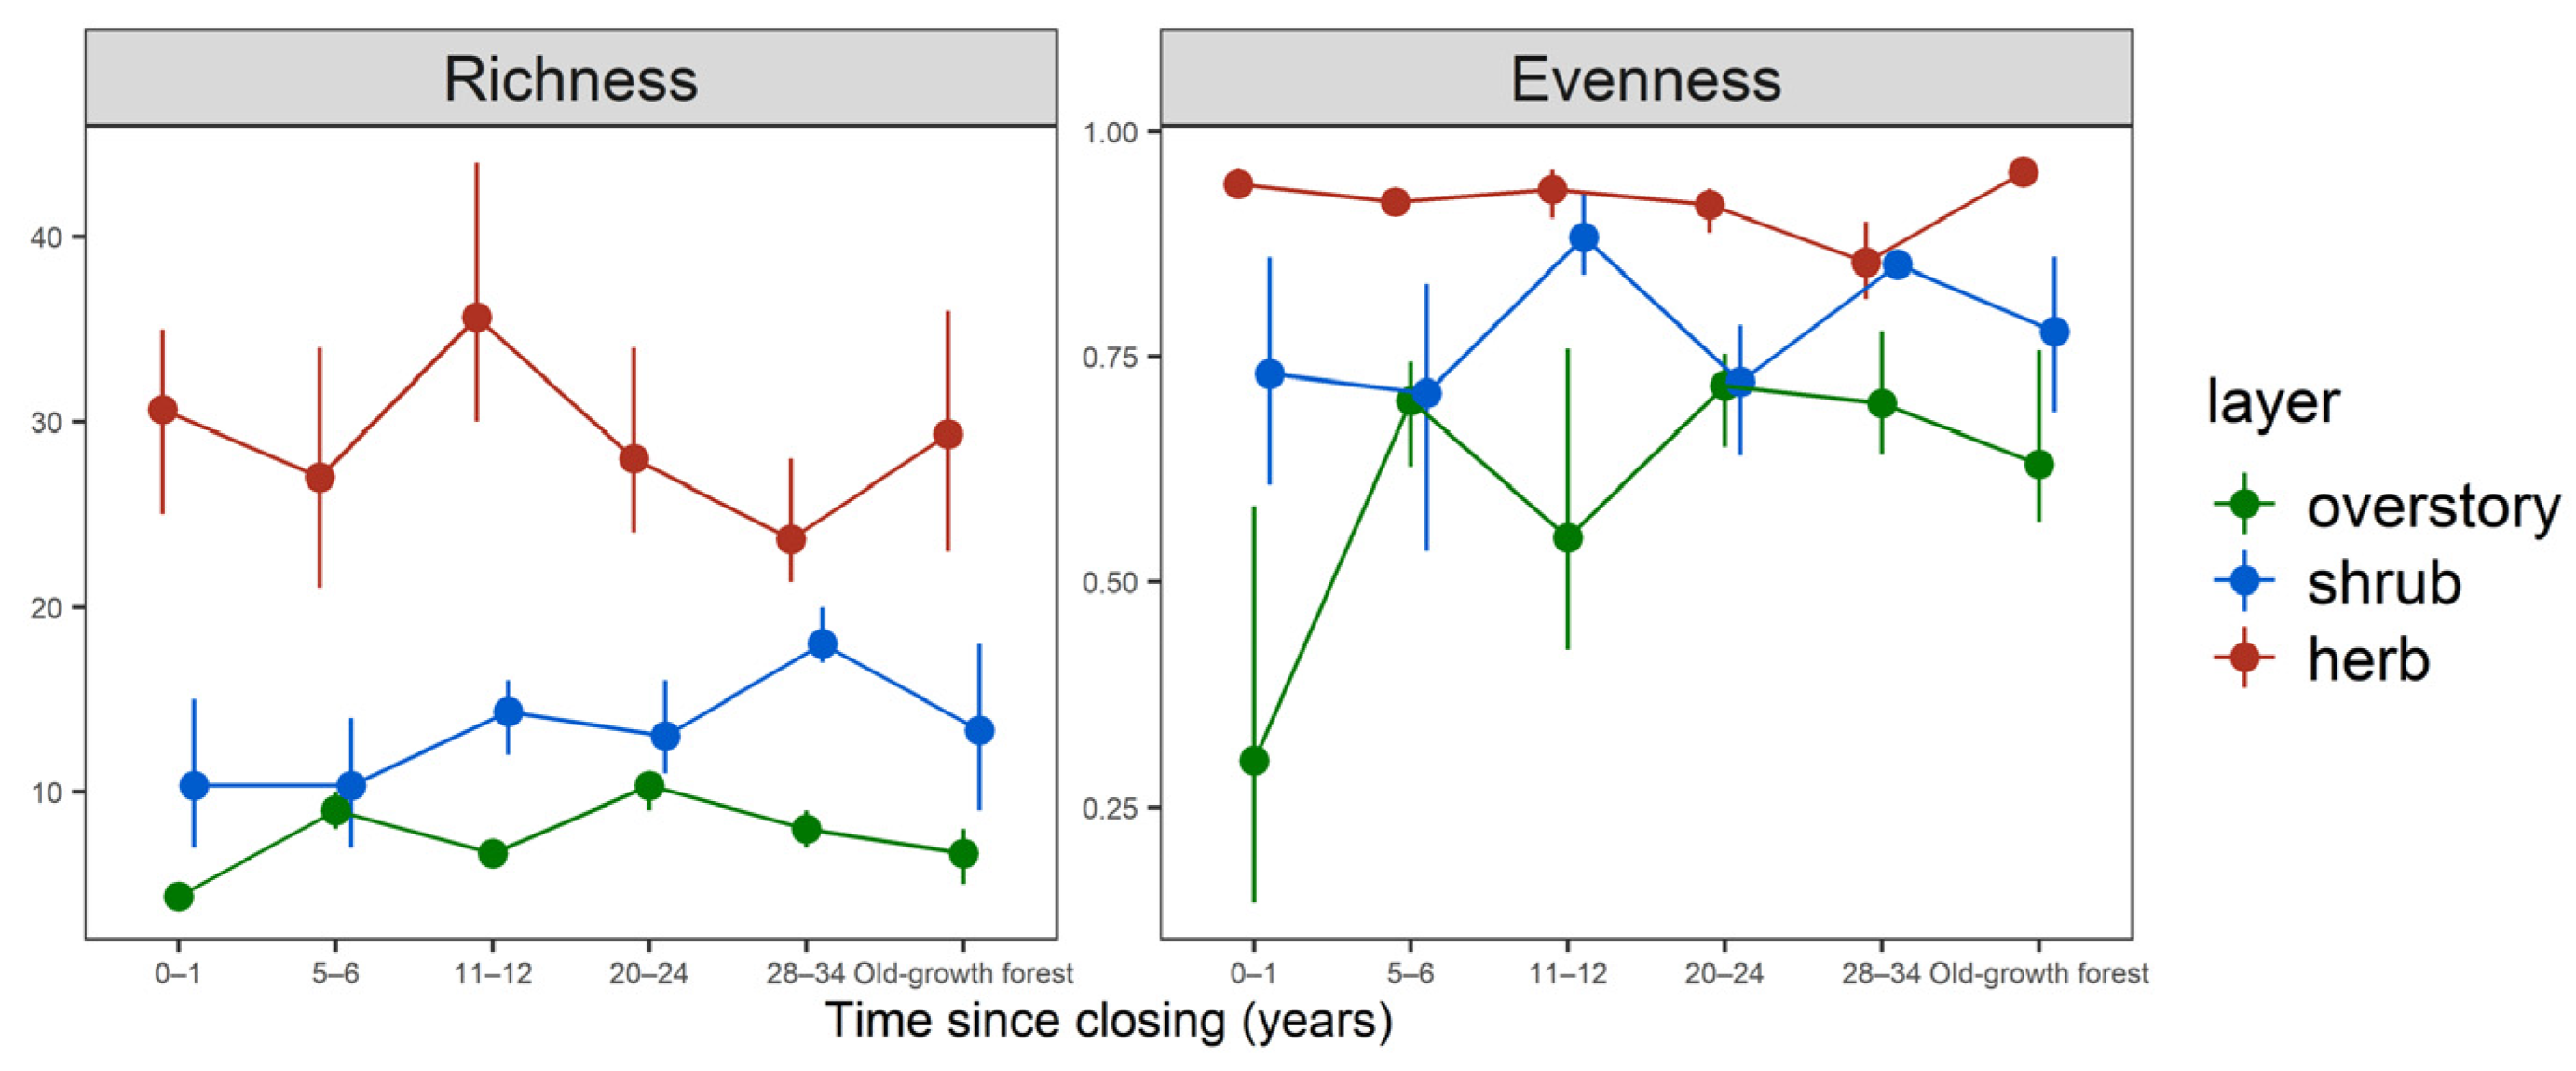
3.2. Species Richness and Evenness

The richness of the overstory (p < 0.001) and shrub layer (p = 0.036) exhibited significant influence based on the time elapsed since disturbance cessation (Table 2). In the initial phase of the enclosure, overstory richness exhibited a rapid increase, peaking at 5–6 years, followed by a gradual decline. Subsequently, it showed a resurgence after 11–12 years, reaching a second peak at 20–24 years before gradually decreasing again. Conversely, the richness of the shrub layer exhibited stability during the initial stages of enclosure, followed by a notable peak at 28–34 years post-enclosure, subsequently showing a gradual decline thereafter. Although the richness of the herb layer did not exhibit a statistically significant change over time (p = 0.156), it reached its maximum at 11–12 years post-closing time (Figure 3). Furthermore, the evenness in the overstory layer (p = 0.028) and herb layer (p = 0.009) showed significant variations with time since disturbance cessation (Table 3). Initially, the overstory evenness was at its lowest, but it increased rapidly with time, stabilizing after 5 years of enclosure. Herb evenness, on the other hand, reached its lowest point at 28–34 years. While there was no significant change in shrub evenness, it was noteworthy that it peaked at 11–12 years (Figure 3).

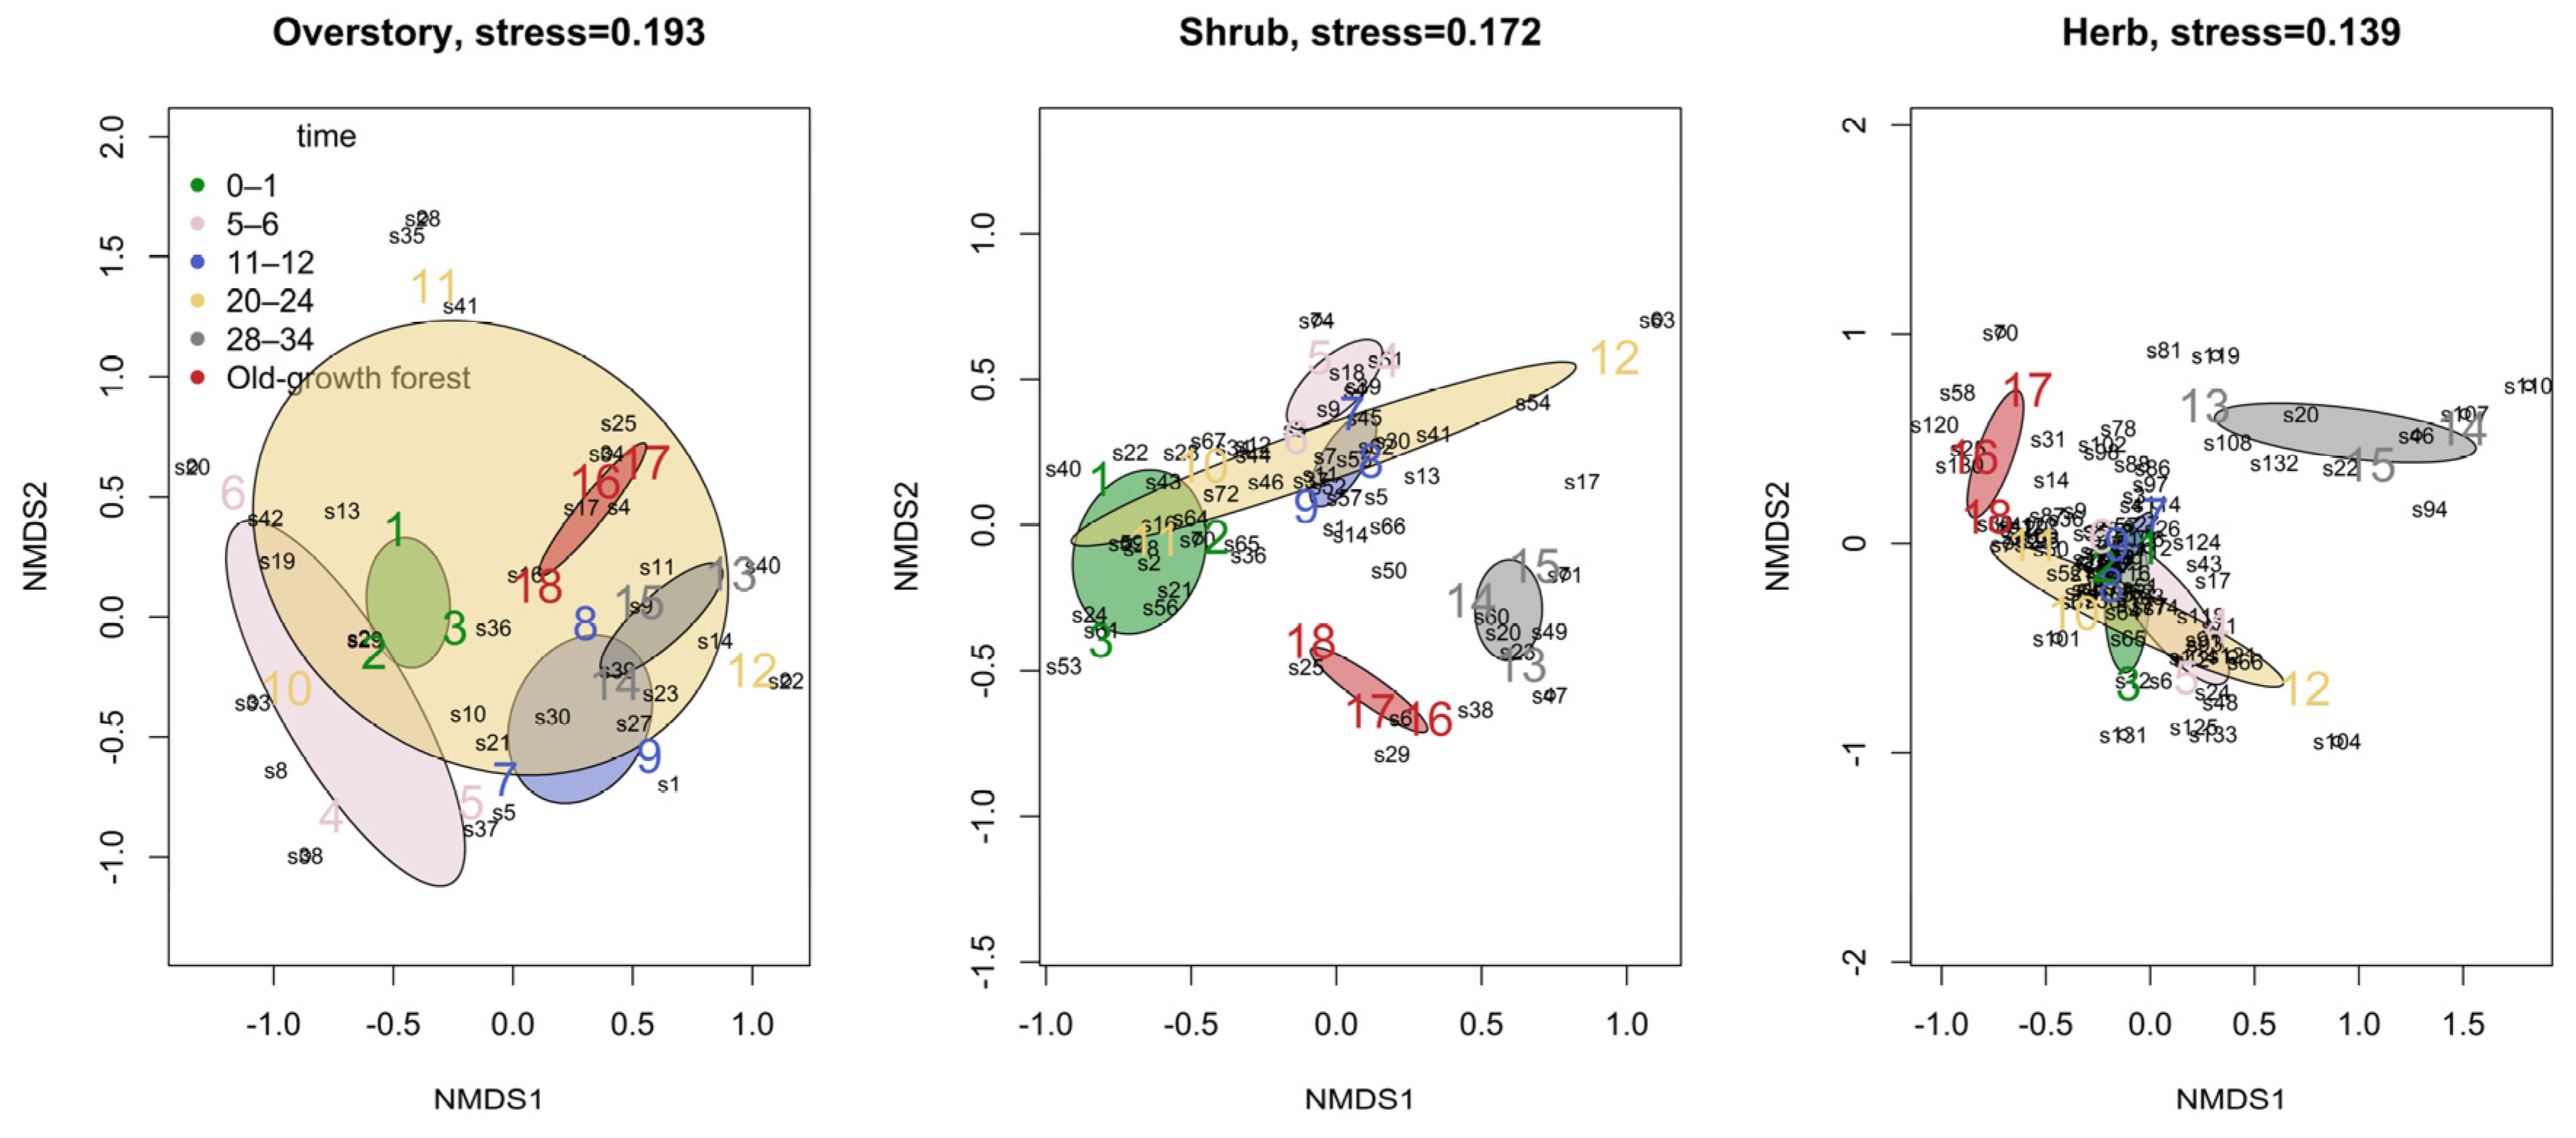
3.3. Species Composition

The Permanova analysis revealed significant changes in the species composition of the overstory layer (p = 0.001), shrub layer (p = 0.001), and herb layer (p = 0.001) since closing time (Table 2). Further analysis using a non-metric multidimensional scaling test indicated that species in the overstory layer (p < 0.05), shrub layer (p < 0.05), and herb layer (p < 0.05) exhibited distinct patterns associated with disturbance cessation time (Figure 4). In the overstory layer, the species composition and interspecific quantity proportion were similar between 0–1 and 5–6 years, while 11–12, 28–34 years, and old-growth forests showed noticeable differences compared to the 0-year composition, resulting in a clear segregation effect. Additionally, species in the 20–24 years and subsequent stages exhibited an aggregation effect.
Similarly, the shrub layer displayed significant differences in species composition and interspecific quantity proportion between 28–34 years and old-growth forests compared to the early disturbance cessation stages. The species composition in 5–6, 11–12, 28–34 years, and old-growth forests were distinctly separated from that of 0–1 years, indicating a pronounced segregation effect. However, the species composition in 20–24 years overlapped with 0–1 years, suggesting a transitional stage in shrub layer composition. In the ordination space of the herb layer, species composition in 28–34 years and old-growth forests significantly differed from that in 0–1 years forests, whereas species composition in 5–6, 11–12, 20–24, and 0–1 years overlapped. Notably, the composition and proportion of species in the herb layer in 28–34 years were markedly different from those in other years, indicating a unique community structure in this stage of disturbance cessation.
The indicator species analysis yielded valuable insights into the suitability of different disturbance cessation stages for specific plant species. During the initial 0–1 years stage, conditions favored the growth of gramineous herbs like Oplismenus undulatifolius and tree seedlings belonging to sun-loving plants such as Alangium chinense, indicating their preferential establishment in this early phase of disturbance cessation. As the disturbance cessation progressed to 5–6 years, new indicator species emerged, including woody plants favoring warm and humid environments and exhibiting shade tolerance, such as Nandina domestica and Pistacia chinensis. A broader array of indicator species appeared with the passage of disturbance cessation years, particularly in the 28–34 years stage. Here, the herb layer supported species characterized by shade tolerance and low nutrient demand, exemplified by species like Dryopteris uniformis Makino and Selaginella tamariscina. Notably, indicator species of sun-loving plants such as Liquidambar formosana and Cornus kousa subsp. chinensis, along with the presence of dead trees, distinguished the old-growth forest (Table 3).

3.4. Linking Resource Availability and Heterogeneity to Herb Diversity

Predictors that showed no significant effect were excluded from the models. The resulting SEM models provided satisfactory fits for species evenness in the herb layer (Figure 5). Notably, overstory evenness exhibited negative direct effects (standardized coefficient, r = −0.424) and indirect effects via substrate diversity (r = −0.010), and a positive indirect effect via light availability (r = 0.129) on herb evenness (Figure 5). Moreover, light availability exerted negative direct effects (r = −0.201) and indirect effects via substrate diversity (r = −0.205) on herb evenness. These relationships highlight the intricate interplay between overstory evenness, light availability, substrate diversity, and herb evenness in the studied ecosystem. The SEM analysis demonstrated that 38.8% of factors influencing herb evenness originated from overstory evenness, light availability, and substrate diversity, thereby emphasizing their combined significance in determining herb layer dynamics.

4. Discussion

The research findings reveal that the number of years of closure influences tree diversity, exhibiting a periodic pattern contrary to the initial hypothesis. In the early enclosure stages, trees experience rapid growth, possibly due to two factors. Firstly, human interference in forest ecosystems primarily damages aboveground plant organs or redundant root systems, allowing plants to thrive and reproduce, aligning with the moderate interference hypothesis. Secondly, ample resource availability in early enclosure stages favors the rapid establishment of tree species that prefer sunny conditions and have high nutrient requirements, facilitating the survival of niche species and contributing to increased species diversity [26,27].
As the number of years of closure increases, the basal area and biomass of the upper vegetation continue to rise while resource availability gradually decreases. This uneven competition for light and resources among tree species increases mortality rates for slower-growing species [40,41,42]. During the mid-enclosure period, limited resources in the habitat may result in less evident ecological niche differentiation among tree species, allowing for stable coexistence of multiple species. Ecological drift further contributes to increased species richness within the community [37,43]. After around 20 years of enclosure, tree richness reaches its highest level. As the community structure evolves, dominant species’ spatial positions also change. In the early enclosure stages, species like maple gradually retreat, while others like four flowers gain prominence. Subsequently, forest stand crowding affects resource absorption, reduces available space, and hinders individual tree crown growth [26,37,44,45]. This intensifies species competition, leading to the withdrawal of some species from competition. Zonal tree species eventually dominate, forming stable communities, and community succession trends toward top-level communities. Our findings align with the neutral and niche theories, highlighting the complex dynamics of forest ecosystem succession.
Previous studies on understory vegetation restoration have highlighted the influences of upper vegetation, light, nutrients, and water on understory vegetation coverage and richness [46,47,48]. It was predicted that with increasing closure time, the species richness of lower vegetation would exhibit a periodic fluctuation trend, initially increasing, then decreasing, and subsequently increasing again. Research indicates that during the early stages of the forest closure, low canopy density, ample growth space, and abundant light and nutrient resources promote the rapid growth of herbaceous plants and shrubs that thrive in well-lit environments [27,49]. As the forest matures and canopy density rises, a resource-filtering effect occurs in the upper vegetation layer, reducing the availability of light and nutrients [47,48]. This results in varying survival abilities among plants in dark environments due to differences in morphology and physiological characteristics [36,48]. Consequently, some herbaceous and light-loving plants with high nutrient requirements gradually withdraw from the community, reducing understory shrub and herbaceous coverage and diversity [48,49]. This study observed a decline in understory herbaceous coverage and diversity after 5–6 years of enclosure. After 11 to 12 years of enclosure, removing certain upper-level trees from the community increased resources and space availability, increasing species diversity in the understory shrubs and herbaceous layers. However, as enclosure time progresses, tree species diversity increases, increasing canopy density and decreasing light availability, reducing shrub and herbaceous plant richness. By 28 to 34 years of enclosure, the tree layer community pattern shifted, with dominant tree species such as maple and four flowers. This transition affected the spatial distribution of tree species, shifting from aggregation to uniformity and influencing understory vegetation diversity.
As the number of years of closure increases, certain tree species with larger growth capacities restrict water and nutrient transportation to the crown [36,50]. Concurrently, their physiological functions, such as photosynthesis rate, decline, leading to carbon starvation or susceptibility to slight disturbances, resulting in mortality [27,51] and gradual gap formation in the canopy. This process contributes to increased species diversity and evenness among herbaceous plants, fostering the emergence of shade-tolerant and low-resource-tolerant species, thereby enhancing the complexity of understory vegetation composition and structure [52]. These changes in understory vegetation can be attributed to resource diversity and availability shifts. The gradual accumulation of withered and fallen trees increases light availability, while the buildup of litter and coarse wood residues enhances substrate diversity. This reduction in intermediate competition facilitates species’ survival in different ecological niches. The correlation analysis indicated a positive relationship between herbaceous plant diversity and evenness with light availability, further supporting these observations.
The correlation analysis results also showed that the evenness of tree species was negatively correlated with the coverage of shrub species and the evenness of herbaceous species, and the diversity index of tree species was negatively correlated with the diversity and evenness of herbaceous species. This result also explains the complex correlation between different vegetation layers, with the tree layer being the driving factor for understory vegetation species diversity and coverage [8,53]. Previous studies have found a negative correlation between shrub coverage and herbaceous coverage, while our research has found a positive correlation between shrub and herbaceous coverage. This may be due to the filtering effect of trees on understory resources [47], which causes weak competition in the shrub layer and insufficient to affect herbaceous coverage.
Previous studies have found that gramineous plants that prefer light and nutrients will appear in the early stages of recovery [54,55,56]. In contrast, shade-tolerant ferns will appear in the later stages of forest development [26,27]. Our study also obtained the same results. Similarly, our indicator species analysis also found that different indicator plants appeared in different years of enclosure. In the early stage of the enclosure, there was sufficient light and resources, indicating that the species was the rice-seeking grass of the Poaceae family, while in the later stage of the enclosure, shade-tolerant plants such as the same-shaped fern and Selaginella were found.
The composition and distribution of understory vegetation communities are significantly influenced by the quantity and heterogeneity of environmental resources [48,49,54]. Light availability plays a crucial role in plant community renewal and succession, influencing the spatial distribution of plants. However, the correlation between light availability/heterogeneity and shrub and herbaceous plant coverage, diversity, and richness is insignificant (Figure 5). Light conditions impact germination, rooting conditions, growth status, and functional composition, shaping forest ecosystem vegetation renewal and succession. Herbaceous plants in particular are susceptible to changes in light resources compared to upper vegetation [46,47,48]. Small-scale variations in understory lighting conditions dictate herbaceous plant growth [37], fostering diverse habitats and species with varying light requirements. The current study revealed that tree diversity, richness, and evenness influence light availability and heterogeneity, correlating positively with shrub and herbaceous plant coverage, diversity, and richness. This suggests that tree species composition and diversity impact forest light environments, influencing understory vegetation distribution. Litter degradation and soil nutrient regulation affect understory shrubs and herbaceous plants’ coverage and diversity [37,48].
Light utilization decreases rapidly as the enclosure is implemented, resulting in upper vegetation succession and substrate diversity alterations. This is primarily due to the accumulation of litter, coarse woody residues, and fallen trees. These alterations subsequently impact the understory vegetation and herbaceous plants. The availability of light directly affects the diversity of herbaceous plants and indirectly influences it by altering temperature, humidity, and decomposition rates, thereby modifying substrate diversity. Furthermore, the findings of this study reveal that 38.8% of the herbaceous evenness is influenced by light, upper vegetation evenness, and substrate diversity. This underscores the significance of considering soil physicochemical properties and site conditions in comprehending the dynamics of herbaceous diversity. However, future studies must delve deeper into the mechanisms driving these dynamics to inform more effective restoration and management strategies for degraded forest ecosystems.

5. Conclusions

The present investigation offers insights into the vegetation dynamics of subtropical deciduous broad-leaved forests in Eastern China, following restoration through mountain closure. Over time, fluctuations in the diversity of the overstory and understory were observed, revealing specific indicator species prevalent during different closure stages. Contrary to expectations, soil resources were not the primary determinant of understory diversity. Instead, 38.8% of the variation in herbaceous evenness was found to be associated with light availability, while the overstory vegetation influenced substrate diversity. During the succession phase, these factors primarily influenced understory dynamics through their impact on the overstory and substrate, emphasizing the importance of considering the interactions between vegetation layers and environmental factors. This underscores the significance of disturbance cessation duration, light availability, and substrate diversity in shaping vegetation dynamics. Furthermore, the observed variations in herbaceous evenness were notably influenced by overstory evenness, providing valuable insights into the intricate interactions of vegetation in restored forest ecosystems. These findings emphasize that cessation of anthropogenic disturbance can maintain and care for understorey plant diversity and contribute to the sustainable management of planted forests.

Author Contributions

Conceptualization, Y.M. and X.L.; methodology, Y.M., J.W. and W.W.; software, Y.M.; validation, X.L.; formal analysis, Y.M., C.H. and C.F.; investigation, Y.M., J.W., W.W. and D.X.; data curation, Y.M.; writing—original draft preparation, Y.M.; writing—review and editing, Y.M., C.H., C.F., F.U.H. and X.L.; supervision, X.L.; project administration, Y.M.; funding acquisition, Y.M. All authors have read and agreed to the published version of the manuscript.

Funding

This research was funded by the Anhui Province University Natural Science Research Foundation (KJ2021A1100, 2022AH051123), the Provincial Forestry Research and Innovation Research Project of Anhui “Research on Forest Plant Diversity Restoration Techniques”, and grants from Chuzhou University (2023qd81).

Data Availability Statement

Data will be made available on request.

Conflicts of Interest

The authors declare no conflicts of interest.

References

  1. Trumbore, S.; Brando, P.; Hartmann, H. Forest health and global change. Science 2015, 349, 814–818. [Google Scholar] [CrossRef] [PubMed]
  2. Pott, R. Tropical rainforests and forest degradation: The global loss of biodiversity. In Proceedings of the International Symposium on Rehabilitation of Tropical Rainforest Ecosystems 2011, Kuala Lumpur, Malaysia, 24–25 October 2011; Baraplas Kreatif Enterprise: Seri Kembangan, Malaysia, 2011. [Google Scholar]
  3. Baccini, A.; Walker, W.; Carvalho, L.; Farina, M.; Sulla-Menashe, D.; Houghton, R.A. Tropical forests are a net carbon source based on aboveground measurements of gain and loss. Science 2017, 358, 230–234. [Google Scholar] [CrossRef]
  4. Giam, X. Global biodiversity loss from tropical deforestation. Proc. Natl. Acad. Sci. USA 2017, 114, 5775. [Google Scholar] [CrossRef] [PubMed]
  5. Menz, M.H.; Dixon, K.W.; Hobbs, R.J. Hurdles and opportunities for landscape-scale restoration. Science 2013, 339, 526–527. [Google Scholar] [CrossRef] [PubMed]
  6. Chandra, L.R.; Gupta, S.; Pande, V.; Singh, N. Impact of forest vegetation on soil characteristics: A correlation between soil biological and physico-chemical properties. 3 Biotech 2016, 6, 188. [Google Scholar] [CrossRef]
  7. Mori, A.S.; Lertzman, K.P.; Gustafsson, L. Biodiversity and ecosystem services in forest ecosystems. J. Appl. Ecol. 2017, 54, 12–27. [Google Scholar] [CrossRef]
  8. Chen, H.Y.H.; Biswas, S.R.; Sobey, T.M.; Brassard, B.W.; Bartels, S.F. Reclamation strategies for mined forest soils and overstory drive understorey vegetation. J. Appl. Ecol. 2018, 55, 926–936. [Google Scholar] [CrossRef]
  9. Fakhry, A.M.; Khazzan, M.M.; Aljedaani, G.S. Impact of disturbance on species diversity and composition of Cyperus conglomeratus plant community in southern Jeddah, Saudi Arabia. J. King Saud Univ.-Sci. 2020, 32, 600–605. [Google Scholar] [CrossRef]
  10. Harrison, S.; Spasojevic, M.J.; Li, D. Climate and plant community diversity in space and time. Proc. Natl. Acad. Sci. USA 2020, 117, 4464. [Google Scholar] [CrossRef]
  11. Azeria, E.T.; Bouchard, M.; Pothier, D.; Fortin, D.; Hébert, C. Using biodiversity deconstruction to disentangle assembly and diversity dynamics of understoreyunderstory plants along post-fire succession in boreal forest. Glob. Ecol. Biogeogr. 2011, 20, 119–133. [Google Scholar] [CrossRef]
  12. Rembold, K.; Mangopo, H.; Tjitrosoedirdjo, S.S.; Kreft, H. Plant diversity, forest dependency, and alien plant invasions in tropical agricultural landscapes. Biol. Conserv. 2017, 213, 234–242. [Google Scholar] [CrossRef]
  13. Cano-Ortiz, A.; Piñar Fuentes, J.C.; Pinto-Gomes, C.; Musarella, C.M.; Cano, E. Expansion of the Juniperus genus due to anthropic activity. In Old-Growth Forests and Coniferous Forests: Ecology, Habitat and Conservation; Nova Science Publishers, Inc.: New York, NY, USA, 2015. [Google Scholar]
  14. Rivas-Martínez, S.; Sánchez-Mata, D.; Costa, M. North American new phytosociological classes. Itinera Geobot. 1999, 13, 349–352. [Google Scholar]
  15. Rivas Martinez, S.; Aguiar, C.; Aguilella, A.; Alonso, R.; Alvarez, M.; Amich, F.; Arnaiz, C.; Baccheta, G.; Barbero, M.; Barbour, M.G.; et al. Map of series, geoseries and geopermaseries of vegetation in Spain [Memory of map of potential vegetation of Spain, 2011] Part II. Itinera Geobot. 2011, 18, 1–764. [Google Scholar]
  16. Corlett, R.T. What is secondary forest? J. Trop. Ecol. 1994, 10, 445–447. [Google Scholar] [CrossRef]
  17. Chokkalingam, U.; De Jong, W. Secondary forest: A working definition and typology. Int. For. Rev. 2001, 3, 19–26. [Google Scholar]
  18. Norden, N.; Chazdon, R.L.; Chao, A.; Jiang, Y.H.; Vílchez-Alvarado, B. Resilience of tropical rain forests: Tree community reassembly in secondary forests. Ecol. Lett. 2009, 12, 385–394. [Google Scholar] [CrossRef]
  19. Brown, K.A.; Gurevitch, J. Long-term impacts of logging on forest diversity in Madagascar. Proc. Natl. Acad. Sci. USA 2004, 101, 6045. [Google Scholar] [CrossRef] [PubMed]
  20. Brown, K.A.; Scatena, F.N.; Gurevitch, J. Effects of an invasive tree on community structure and diversity in a tropical forest in Puerto Rico. For. Ecol. Manag. 2006, 226, 145–152. [Google Scholar] [CrossRef]
  21. Chen, L.F.; He, Z.B.; Zhu, X.; Du, J.; Yang, J.J.; Li, J. Impacts of afforestation on plant diversity, soil properties, and soil organic carbon storage in a semi-arid grassland of northwestern China. Catena 2016, 147, 300–307. [Google Scholar] [CrossRef]
  22. Peichl, M.; Arain, M.A. Above- and belowground ecosystem biomass and carbon pools in an age-sequence of temperate pine plantation forests. Agric. For. Meteorol. 2006, 140, 51–63. [Google Scholar] [CrossRef]
  23. Li, X.; Aguila, L.C.R.; Wu, D.H.; Lie, Z.Y.; Xu, W.F.; Tang, X.L.; Liu, J.X. Carbon sequestration and storage capacity of Chinese fir at different stand ages. Sci. Total Environ. 2023, 904, 166962. [Google Scholar] [CrossRef] [PubMed]
  24. Klopf, R.P.; Baer, S.G.; Bach, E.M.; Six, J. Restoration and management for plant diversity enhances the rate of belowground ecosystem recovery. Ecol. Appl. 2017, 27, 355–362. [Google Scholar] [CrossRef] [PubMed]
  25. Wang, X.; Tong, S.; Li, Y.; Qi, Q.; Zhang, D.; Lyu, X.; Guo, Y.; Liu, Y. Plant diversity performance after natural restoration in reclaimed Deyeuxia angustifolia Wetland. Chin. Geogr. Sci. 2019, 29, 437–445. [Google Scholar] [CrossRef]
  26. Su, X.; Li, S.; Wan, X.; Huang, Z.; Liu, B.; Fu, S.L.; Kumar, P.; Chen, H.Y.H. Understory vegetation dynamics of Chinese fir plantations and natural secondary forests in subtropical China. For. Ecol. Manag. 2021, 483, 118750. [Google Scholar] [CrossRef]
  27. Su, X.; Wang, M.; Huang, Z.; Fu, S.L.; Chen, H.Y.H. Forest understoreyunderstory vegetation: Colonization and the availability and heterogeneity of resources. Forests 2019, 10, 944. [Google Scholar] [CrossRef]
  28. Tavora, A.C.; Carvalho-Silva, M.; Amaral, E.D.; Cupertino-Eisenlohr, M.A.; Nogueira, E.; Munhoz, C.B.R. Revealing the permanent and transient plant understory in gallery forests in the Cerrado of Central Brazil. For. Sci. 2023, 69, 254–264. [Google Scholar] [CrossRef]
  29. Wang, T.; Dong, L.; Liu, Z. Climate strengthens the positive effects of stand structure on understory plant diversity in Chinese temperate forests. Forests 2023, 14, 2138. [Google Scholar] [CrossRef]
  30. Rivas-Martinez, S. Mapa de series, geoseries y geopermaseries de vegetación de España: [Memory of the potential vegetation map of Spain]. Part I. [Salvador Rivas Martínez and collaborators]. Itinera Geobot. 2007, 17, 5–436. [Google Scholar]
  31. Feng, C.; Ma, Y.; Fu, S.L.; Chen, H.Y.H. Soil carbon and nutrient dynamics following cessation of anthropogenic disturbances in degraded subtropical forests. Land Degrad. Dev. 2017, 28, 2457–2467. [Google Scholar] [CrossRef]
  32. Ma, Y.H.; Feng, C.; Wang, Z.C.; Huang, C.; Huang, X.Z.; Wang, W.J.; Yang, S.B.; Fu, S.L.; Chen, H.Y.H. Restoration in degraded subtropical broadleaved forests induces changes in soil bacterial communities. Glob. Ecol. Conserv. 2021, 30, e01775. [Google Scholar] [CrossRef]
  33. Ouyang, Z.; Zheng, H.; Xiao, Y.; Polasky, S.; Liu, J.; Xu, W.; Wang, Q.; Zhang, L.; Xiao, Y.; Rao, E.; et al. Improvements in ecosystem services from investments in natural capital. Science 2016, 352, 1455–1459. [Google Scholar] [CrossRef] [PubMed]
  34. Li, X.; Ramos, A.L.C.; Luo, J.C.; Liu, Y.; Wu, T.; Lie, Z.Y.; Liu, X.J.; Cheng, Y.; Jiang, F.; Liu, J.X. Carbon storage capacity of Castanopsis hystrix plantations at different stand-ages in South China. Sci. Total Environ. 2023, 894, 164974. [Google Scholar] [CrossRef] [PubMed]
  35. He, N.; Wen, D.; Zhu, J.; Tang, X.; Xu, L.; Zhang, L.; Hu, H.; Huang, M.; Yu, G. Vegetation carbon sequestration in Chinese forests from 2010 to 2050. Glob. Chang. Biol. 2017, 23, 1575–1584. [Google Scholar] [CrossRef] [PubMed]
  36. Walker, L.R.; Wardle, D.A.; Bardgett, R.D.; Clarkson, B.D. The use of chronosequences in studies of ecological succession and soil development. J. Ecol. 2010, 98, 725–736. [Google Scholar] [CrossRef]
  37. Su, X.P.; Zheng, G.C.; Chen, H.Y.H. Understory diversity are driven by resource availability rather than resource heterogeneity in subtropical forests. For. Ecol. Manag. 2022, 483, 118750. [Google Scholar] [CrossRef]
  38. Avery, T.E.; Burkhart, H.E. Forest Measurements; McGraw Hill: New York, NY, USA, 2002. [Google Scholar]
  39. Pielou, E.C.; Grassle, J.F.; Patil, G.P.; Smith, W.; Taillie, C. Ecological diversity in theory and practice. Biometrics 1979, 36, 742. [Google Scholar] [CrossRef]
  40. Kumar, P.; Chen, H.Y.H.; Thomas, S.C.; Shahi, C. Linking resource availability and heterogeneity to understoreyunderstory species diversity through succession in boreal forest of Canada. J. Ecol. 2018, 106, 1266–1276. [Google Scholar] [CrossRef]
  41. Muller-Landau, H.C.; Condit, R.S.; Chave, J.; Thomas, S.C.; Bohlman, S.A.; Bunyavejchewin, S.; Davies, S.; Foster, R.; Gunatilleke, S.; Gunatilleke, N.; et al. Testing metabolic ecology theory for allometric scaling of tree size, growth and mortality in tropical forests. Ecol. Lett. 2006, 9, 575–588. [Google Scholar] [CrossRef]
  42. Larson, A.J.; Franklin, J.F. The tree mortality regime in temperate old-growth coniferous forests: The role of physical damage. Can. J. For. Res. 2010, 40, 2091–2103. [Google Scholar] [CrossRef]
  43. Jordan, S.M.R.; Barraclough, T.G.; Rosindell, J. Quantifying the effects of the break up of Pangaea on global terrestrial diversification with neutral theory. Philos. Trans. R. Soc. Lond. Ser. B Biol. Sci. 2016, 371, 20150221. [Google Scholar] [CrossRef]
  44. Canham, C.D.; LePage, P.T.; Coates, K.D. A neighborhood analysis of canopy tree competition: Effects of shading versus crowding. Can. J. For. Res. 2004, 34, 778–787. [Google Scholar] [CrossRef]
  45. Coates, K.D.; Canham, C.D.; LePage, P.T. Above- versus below-ground competitive effects and responses of a guild of temperate tree species. J. Ecol. 2009, 97, 118–130. [Google Scholar] [CrossRef]
  46. Barbier, S.; Gosselin, F.; Balandier, P. Influence of tree species on understory vegetation diversity and mechanisms involved-A critical review for temperate and boreal forests. For. Ecol. Manag. 2008, 254, 1–15. [Google Scholar] [CrossRef]
  47. Zhang, Y.; Chen, H.Y.H.; Taylor, A.R. Positive species diversity and above-ground biomass relationships are ubiquitous across forest strata despite interference from overstory trees. Funct. Ecol. 2017, 31, 419–426. [Google Scholar] [CrossRef]
  48. Chelli, S.; Bricca, A.; Tsakalos, J.L.; Andreetta, A.; Bonari, G.; Campetella, G.; Carnicelli, S.; Cervellini, M.; Puletti, N.; Wellstein, C.; et al. Multiple drivers of functional diversity in temperate forest understories: Climate, soil, and forest structure effects. Sci. Total Environ. 2024, 961, 170258. [Google Scholar] [CrossRef]
  49. Wyckoff, P.H.; Clark, J.S. The relationship between growth and mortality for seven co-occurring tree species in the Southern Appalachian Mountains. J. Ecol. 2002, 90, 604–615. [Google Scholar] [CrossRef]
  50. Bartels, S.F.; Chen, H.Y.H. Interactions between overstory and understoreyunderstory vegetation along an overstory compositional gradient. J. Veg. Sci. 2013, 24, 543–552. [Google Scholar] [CrossRef]
  51. Domec, J.C.; Lachenbruch, B.; Meinzer, F.C.; Woodruff, D.R.; Warren, J.M.; McCulloh, K.A. Maximum height in a conifer is associated with conflicting requirements for xylem design. Proc. Natl. Acad. Sci. USA 2008, 105, 12069–12074. [Google Scholar] [CrossRef] [PubMed]
  52. Lugo, A.E.; Scatena, F.N. Background and catastrophic tree mortality in tropical moist, wet, and rain forests. Biotropica 1996, 28, 585–599. [Google Scholar] [CrossRef]
  53. Koorem, K.; Moora, M. Positive association between understory species richness and a dominant shrub species (Corylus avellana) in a boreonemoral spruce forest. For. Ecol. Manag. 2010, 260, 1407–1413. [Google Scholar] [CrossRef]
  54. Evy, A.; Federico, S.; Harald, A.; Lander, B.; Sigrid, B.; Elisa, C.; Andrea, C.; Mariangela, F.; Kalliopi, R.; Nurlaila, S.N.; et al. Driving mechanisms of overstory-understorey diversity relationships in European forests. Perspect. Plant Ecol. Evol. Syst. 2016, 19, 21–29. [Google Scholar] [CrossRef]
  55. Reich, P.B.; Frelich, L.E.; Voldseth, R.A.; Bakken, P.; Adair, E.C. Understorey diversity in southern boreal forests is regulated by productivity and its indirect impacts on resource availability and heterogeneity. J. Ecol. 2012, 100, 539–545. [Google Scholar] [CrossRef]
  56. Zhang, S.T.; Yang, X.; Li, D.B.; Li, S.C.; Chen, Z.; Wu, J.P. A meta-analysis of understory plant removal impacts on soil properties in forest ecosystems. Geoderma 2022, 426, 116116. [Google Scholar] [CrossRef]
Figure 1. Location of sample sites.
Forests 15 00907 g001
Figure 2. Trends of overstory stem basal area and shrub cover and herb cover in different years since disturbance cessation.
Forests 15 00907 g002
Figure 3. Trends of overstory, shrub, and herb richness and evenness in different years since disturbance cessation.
Forests 15 00907 g003
Figure 4. Non-metric multidimensional scaling ordination of overstory, shrub, and herb layers species composition for various years since disturbance cessation. Note: Sites nearest each other in ordination space have similar floristic assemblages, whereas those farther apart are less similar. Ellipses represent standard errors of the weighted averages of scores corresponding to years since disturbance cessation.
Forests 15 00907 g004
Figure 5. Environmental drivers of herb evenness. (a) The structural equation modeling (SEM) analysis of the effect of overstory evenness, light availability, substrate diversity, and herb evenness. (b) Direction of total, direct, and indirect effects of overstory evenness, light availability, substrate diversity, and herb evenness. Note: Red and black solid arrows connecting the boxes represent significant positive and negative effects (p < 0.05), respectively. Values close to variables refer to the variance accounted for by the model (R2). Values associated with the arrows represent standardized path coefficients. *** p < 0.001.
Forests 15 00907 g005
Table 1. Stand characteristics and site properties for six forest types in the study area.
Time Since Closing (Years)0–15–611–1220–2428–34Old-Growth
Forest
Mean tree DBH (cm)8.4 ± 1.6 b6.7 ± 2.5 b7.4 ± 2.0 b7.7 ± 1.2 b9.7 ± 0.2 b15.9 ± 0.7 a
Mean tree height (m)8.1 ± 1.2 ab7.1 ± 0.8 ab8.7 ± 3 ab6.9 ± 0.8 b8.2 ± 0.8 ab9.8 ± 1.1 a
Stand density (trees ha−1)200.0 ± 25.0 b1358.3 ± 639.0 ab1167.0 ± 503.0 ab1433.0 ± 479.0 a1283.0 ± 414.0 ab1975.0 ± 1267.0 a
Stem basal area (m2 ha−1)2.0 ± 0.7 c8.6 ± 5.4 bc8.9 ± 5.7 bc9.7 ± 2.7 bc16.6 ± 5.9 b42.9 ± 7.1 a
Tree species richness4.3 ± 0.6 d9.0 ± 1.0 ab6.7 ± 0.6 c10.3 ± 1.2 a8.0 ± 1.0 bc6.7 ± 1.5 c
Overstory composition (% of stem basal area)
Alangium chinense0.11 ± 0.15 a0.06 ± 0.1 a00.21 ± 0.36 a00
Liquidambar formosana1.8 ± 0.8 c2.0 ± 0.7 c5.3 ± 2.6 bc3.0 ± 1.8 c8.2 ± 3.8 b24.6 ± 5.1 a
Cornus kousa subsp. chinensis0000.2 ± 0.4 c5.5 ± 2.9 b16.0 ± 4.6 a
Other broad leaves98.1 ± 0.7 a97.9 ± 0.8 a94.7 ± 2.6 a96.6 ± 1.8 a86.3 ± 3.1 b59.4 ± 7.5 c
Understory shrub layer cover (%)50.6 ± 44.5 a40.3 ± 10.7 a36.0 ± 19.1 a29.7 ± 3.9 a34.2 ± 12.1 a19.6 ± 8.8 a
Understory herb layer cover (%)107.2 ± 32.3 ab108.3 ± 38.6 ab116.5 ± 19.4 a82.2 ± 11.8 ab78.2 ± 21.8 ab70.5 ± 12.1 b
Light available15.7 ± 3.2 a7.1 ± 0.3 bc8.7 ± 1.3 b6.1 ± 1.2 bc5.6 ± 0.7 c6.6 ± 2.0 bc
Light variability4.1 ± 0.6 a1.0 ± 0.2 b1.6 ± 0.2 b1.3 ± 0.1 b1.7 ± 0.6 b1.5 ± 0.2 b
Substrate diversity1.1 ± 0.1 a0.8 ± 0.1 b0.8 ± 0.0 b0.8 ± 0.2 b0.7 ± 0.1 b1.1 ± 0.1 a
Soil C (g kg−1)13.5 ± 2.0 c20.0 ± 2.0 bc22.7 ± 1.5 bc23.6 ± 3.6 b36.6 ± 7.2 a41.1 ± 9.3 a
Soil N (g kg−1)1.7 ± 0.1 c2.2 ± 0.1 bc2.4 ± 0.2 bc2.5 ± 0.5 b3.5 ± 0.7 a2.2 ± 0.1 bc
Soil pH5.9 ± 0.2 a5.4 ± 0.6 ab5.0 ± 0.5 b4.7 ± 0.3 b4.7 ± 0.5 b4.8 ± 0.3 b
Soil water content (%)21.5 ± 4.5 c23.8 ± 3.7 bc28.0 ± 3.7 ab27.6 ± 3.1 abc28.7 ± 3.7 ab32.0 ± 3.0 a
Note: Data are mean ± SD, n = 3. DBH, diameters at breast height. Different letters indicate a significant difference at α = 0.05 between years since disturbance cessation. Other broadleaf species included Quercus acutissima, Lindera glauca, Litsea cubeba, Quercus serrata, Castanea mollissima, Quercus fabri, Pistacia chinensis, Toxicodendron vernicifluum, Ulmus pumila, Mallotus tenuifolius, Rhus chinensis, and additional rare species.
Table 2. The influence of time since disturbance cessation on vegetative cover, species richness, evenness, and species composition, examined separately for overstory, shrub layer, and herb layer.
AttributeDfOverstory LayerShrub LayerHerb Layer
Deviance or Variance Explained (%)pDeviance or Variance Explained (%)pDeviance or Variance Explained (%)p
Vegetative cover520.680.0004.280.01812.130.000
Stem basal area
Species richness516.870.0003.460.0361.970.156
Species evenness53.750.0282.020.1485.160.009
Shannon index511.080.0002.500.0903.470.036
Species composition53.560.0012.790.0012.730.001
Note: Deviance explained by each factor (%) is relative to null deviance. Significance at p < 0.05 is in bold.
Table 3. Indicator species for various years since disturbance cessation.
Time Since Closing (Years)Indicator SpeciesLife FormsSpecificitySensitivityIndicator Valuep
Overstory layer
5–6Pistacia chinensisTree0.95410.9770.018
11–12Quercus serrataTree1110.012
28–34Castanea mollissimaTree0.74210.8610.026
28–34Litsea cubebaTree0.5310.7280.036
Old-growth forestLiquidambar formosanaTree0.54210.7390.004
Old-growth forestCornus kousa subsp. chinensisTree0.88610.9410.004
Old-growth forestDead woodTree0.89710.9470.004
Shrub layer
0–1Alangium chinenseShrub0.88210.9390.008
5–6Nandina domesticaShrub0.7710.8770.008
11–12Celtis biondiiShrub0.68810.8290.021
28–34Spiraea salicifoliaShrub1110.007
Old-growth forestCornus kousa subsp. chinensisTree seedling0.78710.8870.005
Herb layer
0–1Oplismenus undulatifoliusGramineae0.64510.8090.031
5–6Nandina domesticaShrub seedling0.77210.8790.013
28–34Dryopteris uniformis MakinoFern0.78710.8870.026
28–34Selaginella tamariscinaFern0.65310.8080.028
Disclaimer/Publisher’s Note: The statements, opinions and data contained in all publications are solely those of the individual author(s) and contributor(s) and not of MDPI and/or the editor(s). MDPI and/or the editor(s) disclaim responsibility for any injury to people or property resulting from any ideas, methods, instructions or products referred to in the content.

