Abstract
Tsoongiodendron odorum Chun is a large evergreen tree in the Magnoliaceae family and an ancient relict species represented by small wild populations. It has excellent material quality, high ornamental value, and scientific significance. However, due to the complicated natural reproduction and notable habitat destruction, its wild populations must be urgently conserved. We used genotyping-by-sequencing to examine 17 natural populations of T. odorum in China, the species’ primary habitat, to better understand the genetic diversity of this species and use its germplasm resources. T. odorum had a very low level of genetic diversity; its mean values for Ho, He, Pi, and PIC were 0.175, 0.123, 0.160, and 0.053, respectively. With an average within-population Fst of 0.023 and an inter-population gene flow Nm of 10.918, population genetic variation was primarily found within populations, demonstrating minute genetic divergence between populations. The 17 natural populations of T. odorum were divided into two major categories: the Fujian populations in eastern China and the Jiangxi, Guangdong, Hunan, and Guangxi populations in central and western China. Our research contributes to the understanding of T. odorum’s genetic diversity and organization and offers a theoretical framework for the species’ conservation, breeding, and selection.
1. Introduction
Tsoongiodendron odorum Chun (Magnoliaceae), an endangered evergreen tree, is sporadically distributed in southern China and northern Vietnam [1]. Its wood is easy to work with: it is finely structured and has a straight grain, making it an excellent material for high-end furniture and woodcraft. The tree has a dense crown, produces fragrant flowers suitable for extracting perfumes, and bears unique fruits, making it an outstanding ornamental tree species for gardens and streets. Additionally, as an ancient relict plant belonging to a relatively evolved group within the Magnoliaceae, it holds notable scientific value for ancient flora, paleoclimate, and paleogeography studies. It was first found in Hainan, China, mainly distributed in the tropical and subtropical southern regions of China, including southern Jiangxi, Fujian, Guangdong, Hainan, Guangxi, and southeastern Yunnan [2]. However, owing to severe flower and fruit drop after blooming, easy loss of seed germination capability, and poor natural reproductive ability, its wild populations are small and often scattered. The size and number of T. odorum Chun wild populations are continuously decreasing because of climate change and severe habitat destruction. This species is listed as Near Threatened by the International Union for Conservation of Nature and a Class II nationally protected plant in China [2].
Genetic diversity, as the basis of broader biological diversity, is one of the core elements of conservation biology research [3]. Utilizing molecular markers to examine species’ genetic diversity and structure helps to establish the kinship relationship within and between different populations, understand adaptation mechanisms and evolutionary potential of the species, and generate reliable experimental evidence for phylogenetic and taxonomic studies. In particular, the study of rare and endangered organisms, such as T. odorum Chun, helps to clarify the reasons for their rarity or endangerment and offers a theoretical framework for the future creation of conservation measures [4]. The research on T. odorum Chun mainly focuses on pollination biology, community ecology, embryology, chemical composition, and timber applications [5,6,7,8]. Relatively few studies have been conducted on the population genetic structure and diversity of T. odorum Chun. Jiang (2011) et al. [7] used the amplified fragment length polymorphism technique to rapidly isolate eight polymorphic microsatellite loci in T. odorum Chun and analyzed the genetic diversity of 99 trees from two populations in Guangdong Province: 62 trees from Nankunshan and 37 trees from Lianshan. The results of the study suggested that T. odorum Chun may have relatively high genetic diversity. In the Nankun population, the number of alleles (A) per locus was 2–5, with an average of 3.3, and the observed heterozygosity (Ho) and expected heterozygosity (He) were 0.048–0.548 and 0.048–0.715, respectively. In the Lianshan population, the number of alleles per locus ranged from 2 to 5, with an average of 2.9, and Ho and He values of 0.351–0.838 and 0.311–0.749, respectively. However, owing to the small number of populations in the existing studies and the fact that the amplified fragment length polymorphism markers are dominant and often highly clustered near centromeres, the genetic variance of the populations might not be accurately estimated [9,10]. This consequently makes it impossible to accurately evaluate the genetic diversity, kinship, and organization of populations of T. odorum chun plants.
The development of molecular biology methods, such as high-throughput sequencing, has made it possible to accurately comprehend T. odorum Chun’s genetic diversity and population structure. Genotyping-by-sequencing (GBS) is a simplified genome sequencing technology based on second-generation high-throughput sequencing that detects a large number of single nucleotide polymorphism (SNP) loci rapidly, simply, and at a low cost [11]. This technique can analyze and type SNPs in non-model organisms to explore genomic variation without a reference genome [10,11,12,13,14]. GBS has been successfully applied in various fields, including the construction of genetic maps for plant populations [15,16], the development of molecular markers [17], the analysis of population genetic diversity and structure [18,19,20], and genome-wide association analysis [21]. Chen et al. [22] considered GBS as a fast and reliable method for genotyping conifers. Gong et al. used GBS to examine the genetic diversity and population structure of 40 camphor populations in China and Japan and their findings indicated that camphor tree populations had a medium level of genetic variety. Molecular analysis of variance showed that 92.03% of the genetic variation originated from within the populations and the degree of inter-population genetic differentiation was low. The 40 camphor tree populations that were characterized formed three main groupings and displayed a clear geographic distribution pattern with genetic movement between adjacent areas [23]. This study employs GBS technology to develop SNP molecular markers at the whole-genome level for 17 natural populations of T. odorum Chun distributed within China, aiming to 1) estimate the genetic diversity of existing T. odorum Chun in different regions; and 2) calculate population genetic structure. This may provide a theoretical basis for future research on the genetic variation sources and endangered causes of T. odorum Chun, as well as the efficient utilization and breeding of germplasm resources.
2. Materials and Methods
2.1. Plant Materials and DNA Isolation
Because of its scattered and sporadic distribution, T. odorum Chun is considered to have a lower wild population. Based on the preliminary surveys of its wild population distribution, we collected samples from adult trees with a diameter at breast height of more than 15 cm within its major distribution area, ensuring that samples were collected from trees more than 20 m apart. We collected samples from different regions in April 2023: Collected five healthy tender leaves from each sample, dried them with silica gel on site, stored them in dry ice, and brought them back to the laboratory for storage in an −80 degree freezer. After all samples were collected, they were processed uniformly. A total of 86 samples from 17 natural populations of T. odorum Chun were collected, with 1–10 samples from each population, 1 sample from the Fujian Yanping population, and 1 sample from the Guangxi Laibin population. Furthermore, based on the geographical origin of the samples, we categorized the 17 populations into 3 regions: the eastern region with 21 samples from 3 populations, the central region with 58 samples from 11 populations, and the western region with 7 samples from 3 populations (Figure 1 and Table 1, sample number can be found in Supplementary Materials Table S1). For each sample, five healthy leaves were dried with silica gel and brought back to the laboratory. Table S1 provides comprehensive details on the site name, sampling location, and sample identification numbers. The approach based on cetyltrimethylammonium bromide was used to extract DNA [23]. DNA purity and integrity were qualitatively assessed using agarose gel electrophoresis. DNA purity (OD260/280 ratio) was also quantitatively measured using a Nanodrop spectrophotometer (Thermo Fisher, Waltham, MA, USA); DNA concentration was determined using a Qubit®2.0 fluorometer (Invitrogen, Carlsbad, CA, USA).
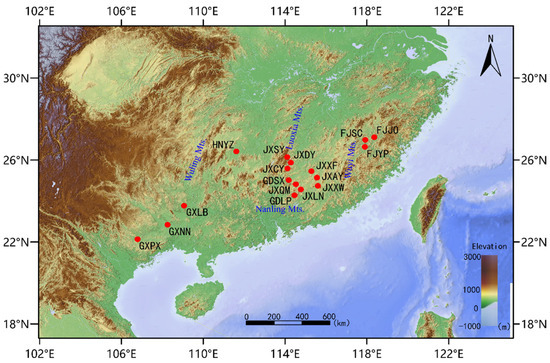
Figure 1.
Geographical distribution of plant materials. The denotations, such as GXPX and GXNN, are the names of the sampling sites. (Table 1).

Table 1.
Geographic locations and sample sizes of 17 natural populations of T. odorum Chun. (Figure 1).
2.2. GBS Library Construction and Population SNP Identification
Nla III+Ecorl I endonuclease (New England Biolabs, NEB, Beijing, China) was used to digest genomic DNA samples that met the necessary criteria. T4 DNA ligase (New England Biolabs, NEB, Beijing, China) was used to add the adaptor and barcode to both ends [24]. After PCR amplification, each DNA sample was combined. This was followed by further purification and recovery of the DNA fragments (215–265 bp) used for GBS library construction. Finally, the Illumina HiSeq 2500 sequencing platform (Illumina, San Diego, CA, USA) was used to perform paired-end sequencing at 150 bp per run.
CASAVA was used to analyze the raw data files that were obtained from the sequencing platform (http://support-docs.illumina.com/SW/ClarityLIMS/ClarityINT/Content/SW/ClarityLIMS/Integrations/CASAVA182SampleSheet.htm, accessed on 12 April 2024) [25]. Base calling was used to convert them into raw reads, which were filtered using fastp software (ver. 0.23.1) [26] to remove reads containing adapters, single-end sequencing reads where the N content exceeded 10% of the read length, and paired reads where the number of low-quality bases (quality ≤ 5) exceeded 50% of the read length. As a result, high-quality clean reads were obtained. The number of tags obtained for each sample was counted and sample FJYP1 with the highest number of tags was selected and used to construct the proposed reference genome using Stacks 1.45 ustacks package (using parameters -i 1 -m 1 -M 6 -N 6 -p 6). The clean reads were aligned to the reference genome using BWA 0.7.17 software [27] (me m --kt 4 32 -M) and the alignment results were sorted using Samtools 1.19.2 [28]. Population SNPs in the 86 samples were also detected using the Samtools 1.19.2 software. High-quality SNPs were obtained using the following filtering and screening parameters: main parameter-min DP2-miss 0.5-maf 0.01, with SNP loci separated by at least 5 bps, sequencing depth ranging from 1/3 to 5 times the average depth, and the proportion of missing genotypes in the 86 re-sequenced samples <50%.
2.3. Statistical Analysis
After SNP detection, the individual SNPs obtained can be used to calculate the distance between populations. The p-distance between two individuals i and j is calculated using the following formula: . In the formula, L represents the length of the high-quality SNP region and the allele at position 1 is A/C. Therefore . Using the neighbor-joining (NJ) approach to build the phylogenetic tree, a distance matrix was computed using TreeBest 1.9.2 software (http://treesoft.sourceforge.net/treebest.shtml, accessed on 12 April 2024). Bootstrap values were obtained after 1000 computations [29]. Eigenvectors and eigenvalues were calculated using GCTA 1.94.1 software (http://cnsgenomics.com/software/gcta/pca.html, accessed on 12 April 2024), and PCA distribution was plotted in R software [30]. Population structure analysis was performed using Admixture-1.23. First, the input Ped file for PLINK (http://pngu.mgh.harvard.edu/~purcell/plink/, accessed on 12 April 2024) was created and then Admixture 1.3.0 software (http://dalexander.github.io/admixture/, accessed on 12 April 2024) was used to construct population genetic structure and lineage information. Based on the included SNP loci, Ho and He values for each population were calculated using Stacks 1.45 population software [31]. The coefficient of genetic differentiation (Fst) between populations was calculated according to the formula Fst = (Ht − Hs)/Ht [32] (Hs: average heterozygosity in subpopulations, Ht: average heterozygosity in composite populations). Nm = (1 − Fst)/4Fst and other genetic diversity indicators were subsequently also calculated. Analysis of molecular variance (AMOVA) was performed using Arlequin ver. 3.5.2.2 [33]. The nucleotide diversity (π) of the populations was analyzed using Stacks 1.45 [34].
3. Results
3.1. GBS Analysis and SNP Identification
A total of 64.45 Gb bases was obtained from 86 samples of T. odorum Chun using GBS (Table S2). After the removal of low-quality sequence data, a total of 61.72 Gb of high-quality sequence data (Q20 ≥ 92.7% and Q30 ≥ 82.45%) was obtained, with an average of 0.72 Gb per sample and an average GC content of 41.46%. A total of 428,611,280 clean reads was obtained, ranging from 2,671,746 to 6,645,844, with an average of 4,983,852 per sample. The average alignment rate of population samples to the reference genome was 91.58%, with the highest value observed in sample FJYP-1 (97.72%) and the lowest observed in sample GXNN-2 (86.11%). The average sequencing depth of the assembled genomes (excluding the N region) ranged from 9× to 15× and the breadth of sequencing coverage at 1× (coverage of at least one base) was above 64%, indicating that the alignment results were normal and suitable for subsequent variant detection and related analysis. Population SNP detection was conducted in 86 samples, resulting in 207,217 SNPs. After filtering and selection, 21,155 high-quality SNPs were obtained for further analysis.
3.2. Population Genetic Structure
Based on the geographic distribution pattern, we categorized the 17 natural populations into three regions: western China (Guangxi populations), central China (Jiangxi, Guangdong, and Hunan populations), and eastern China (Fujian populations). The natural populations of T. odorum Chun displayed a clear regional distribution pattern, as indicated by the phylogenetic tree built using the genetic distance matrix and the NJ technique (Figure 2). The 17 populations were split into two major clusters, with the eastern China population from Fujian forming Cluster I on its own, and natural populations from central and western China, including Guangxi, Hunan, Jiangxi, and Guangdong, being grouped into Cluster II. Cluster I could be further classified into the Fujian Jian’ou and Fujian Shunchang/Fujian Yanping populations, indicating that populations from Fujian are genetically distinct from those in other regions. In addition, in central China, the populations from Guangxi, Hunan, Guangdong, and Jiangxi each formed separate sub-clusters. However, JXLN5, JXLN6, JXXF5, and JXCY9 clustered with the Guangdong population, and GDLP1 clustered with the Jiangxi population, suggesting some gene flow between these populations, which may be attributed to their geographical proximity.
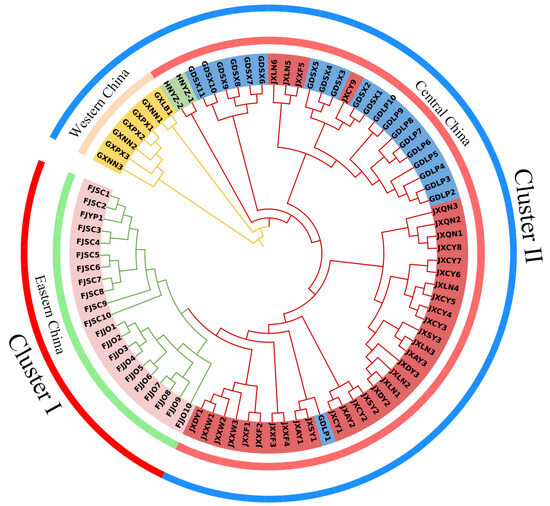
Figure 2.
Neighbor-joining phylogenetic tree of T. odorum Chun based on all SNPs, with evolutionary distances measured using p-distances in TreeBest. The central circle is divided into western China (orange), central China (red), and eastern China (green) based on geographical distribution, whereas the outermost circle is divided into Cluster I (red) and Cluster II (blue).
Population structure analysis (Figure 3, Supplementary Figure S1) and NJ phylogenetic tree clustering yielded similar results. The eastern China population (comprising only the Fujian population) was first separated from the other populations when K = 2. When K = 3, the eastern China population was further separated into two groups, with the Fujian Jian’ou population grouping on its own and the Fujian Shunchang/Yanping population forming a group with the western China populations (Guangxi populations), implying some gene flow between the Guangxi and Fujian Shunchang/Yanping populations; the central China populations (including the Jiangxi, Hunan, and Guangdong populations) formed a third group. When K = 4, the Guangxi populations formed a group on their own. PCA further verified the results of NJ phylogenetic tree clustering and structure analysis (Supplementary Figure S2). The 17 T. odorum Chun populations were divided into four clusters. The Guangxi populations in western China formed cluster 1 on their own, whereas the Fujian Shunchang/Yanping populations in eastern China formed cluster 2, the Fujian Jian’ou population in eastern China formed cluster 3, and the Guangdong, Jiangxi, and Hunan populations in central China formed cluster 4. In conclusion, a clear pattern of geographical distribution of T. odorum Chun populations was observed, and populations from distinct geographic regions had significant genetic differences.
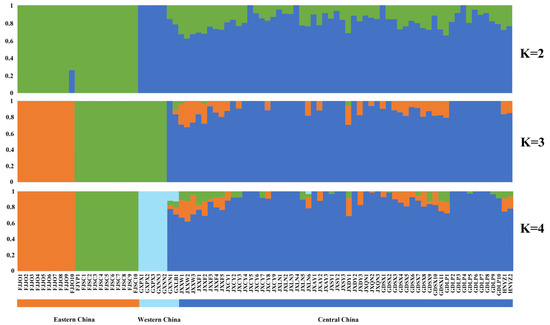
Figure 3.
Population genetic structure of 86 T. odorum Chun trees. Each color represents one cluster. Each individual is represented by a vertical bar and the length of each colored segment in each vertical bar represents the proportion contributed by ancestral populations. The K value represents the number of different populations.
3.3. Genetic Diversity Analysis
At the species level, T. odorum Chun had mean Ho and He values of 0.175 and 0.123, respectively (Table 2). The population in central China has the highest level of genetic heterozygosity, with Ho and He values of 0.182 and 0.130, respectively, according to the genetic diversity analysis of each region; the western China population had the second highest level, with Ho and He values of 0.178 and 0.106, respectively; and the eastern China populations had the lowest level, with Ho and He values of 0.167 and 0.112, respectively. All the populations of T. odorum Chun had significant excess heterozygotes, with average π and PIC values of 0.160 and 0.053, respectively, indicating low genetic diversity and relatively conservative nucleotide sequences. In addition, all loci deviated from the Hardy–Weinberg equilibrium (HWE).
Table 2.
Genetic diversity of T. odorum Chun in three different regions of China.
AMOVA revealed that most genetic variations in T. odorum Chun (85.77%) occurred within populations, while the genetic variation between populations and regions was only 10.20% and 4.03%, respectively (Table 3). This result was also consistent with the values of the population genetic differentiation coefficient, Fst, and gene flow, Nm, for T. odorum Chun, with mean values of 0.025 and 10.918 for Fst and Nm, respectively, across the three regions (Table 4). The degree of genetic differentiation among populations of T. odorum Chun in eastern, western, and central China was relatively low (0.018–0.026). The populations in eastern and western China had the lowest genetic differentiation coefficient, at 0.018, and the most frequent gene flow, with an Nm of 13.639. Conversely, the populations in western and central China had the highest genetic differentiation coefficient, at 0.026; however, they still had frequent gene flow, with an Nm of 9.366, implying considerable similarity in the genetic background of the wild populations of T. odorum Chun in China.
Table 3.
AMOVA for the three regions of geographical distribution of T. odorum Chun.
Table 4.
Genetic differentiation of T. odorum Chun across three geographical regions.
4. Discussion
As an ancient relict plant and an endangered species, T. odorum Chun, mainly distributed in southern China, has increasingly received widespread attention from conservation biologists. Current research suggests that the major reason for the endangerment of T. odorum Chun is the complication of natural reproduction owing to the biological characteristics of this species and the destruction of its natural environment. However, as genomic information about T. odorum Chun is relatively scarce, the genetic background and variation of this species remain largely unexplored, which hinders a deeper understanding of the causes of its endangerment and precludes the formulation of effective conservation strategies. GBS based on SNP molecular markers provided a fast and effective means of understanding the population genetic information of T. odorum Chun. We assessed the genetic diversity and structure of the natural T. odorum Chun populations to gain insight into its distributional characteristics and evolutionary history. Such data may provide a theoretical foundation and practical support for conservation efforts and rational utilization of T. odorum Chun germplasm resources [35,36].
The primary objective of conservation biology is to preserve the evolutionary potential of species by ensuring a sufficient level of genetic diversity, strengthening the ability of species to adapt to both long- and short-term environmental changes, and mitigating any threats that could result in extinction [37,38,39]. Genetic diversity encompasses the total genetic variation among all individuals within a species and is fundamental for the survival and development of populations. The translation of the sentence would be: “It is widely believed that the genetic diversity of endangered plant species is lower than that of common species due to factors such as lower abundance, genetic drift from inbreeding or self-pollination, and increased homozygosity” [40]. The genetic diversity of T. odorum Chun in this study was low, with He values ranging from 0.108 to 0.130. These values were much lower than those of simple sequence repeat markers analyzed in endangered plants in the same genus or family, including Michelia coriacea (He = 0.47), Michelia wilsonii (He = 0.418), Magnolia officinalis (He = 0.342), and Sinomanglietia glauca (He = 0.423) [41,42,43,44], which suggests that the very low-density distribution of individual T. odorum Chun plants and their spatial isolation from each other attenuate genetic variation in their populations [45]. In general, the causes of excess heterozygotes in a population include a lower number of breeding colonies, action of over-dominant genes, progressive selection against homozygotes, negative assortative mating, and asexual reproduction [46,47]. Many studies have shown that the excess of heterozygotes in a population is due to natural selection, which favors heterozygous individuals with greater fitness who therefore occupy a dominant position in the population, such as Arinica montana [48] or Berchemiella wilsonii var. pubipetiolata [49]. In the present study, a significant excess of heterozygotes was observed in all regional populations of T. odorum Chun. This may be attributed to the reproductive barriers between species, pollen limitation, inbreeding depression causing low fruit set rates, and low seed germination rates, leading to poor natural reproduction, fragmented reproducing populations, and a low number of individual plants. Additionally, Ho and He values are greatly decreased by the presence of null alleles, which may further underestimate genetic diversity [50,51]. All loci in this study deviated from the HWE, which is consistent with the scattered distribution of wild populations of T. odorum Chun, insufficient population size, and low overall number of individual plants. Typically, achieving Hardy–Weinberg Equilibrium (HWE) requires random mating and a sizable population [52]. Deviations from HWE can be attributed to factors such as high heterozygosity or a high frequency of null alleles at the locus [53,54].
The study of genetic structure in populations is essential for understanding and conserving species’ genetic diversity. The genetic structure of populations is influenced by various factors, including breeding systems, genetic drift, population size, seed dispersal, gene flow, evolutionary history, and natural selection [55]. In this study, a clear geographical pattern was observed among the T. odorum Chun populations, as those in Fujian, Jiangxi, Guangxi, Guangdong, and Hunan formed a separate cluster, likely owing to geographical isolation and genetic drift. Based on the distribution of mountain ranges, the eastern China populations are located east of the Wuyi Mountain Range; the central China populations are located west of the Wuyi Mountain Range and east of the Wuling Mountain Range and are concentrated mainly in the Luoxiao Mountain Range and Nanling area, whereas the western China populations are located southwest of the Wuling Mountain Range. This distribution implies that the habitats of these mountain ranges may have affected the genetic structure of T. odorum Chun. In support of this notion, studies of camphor trees [23], Liriodendron chinense [56], and Betula platyphylla Suk [57] also concluded that mountain ranges play an important role in species evolution. Endangered plants often suffer from severe habitat fragmentation, leading to geographical isolation between populations. This isolation, coupled with the influence of heterogeneous habitats, typically results in a higher degree of genetic differentiation compared to that observed in widely distributed species. Fst is an important index for measuring the degree of differentiation between populations and a small genetic differentiation between populations when Fst is less than 0.25 [58,59]. In this study, the genetic differentiation coefficients among the three populations of T. odorum Chun were in the range of 0.018–0.026, i.e., much lower than 0.25, and the values of Nm were all much larger than 1 (9.366–13.639), suggesting a low level of genetic differentiation among populations of T. odorum Chun. AMOVA also revealed that 85.77% of the genetic variance was within populations, consistent with findings from other studies of southern tree species [60,61]. The low level of genetic differentiation among populations is generally the result of pollen or seed dispersal and transportation over long distances [62]. Considering that T. odorum Chun is pollinated by insects, the long-distance dispersal of its pollen is relatively low. Nevertheless, the conspicuous red seeds of plants belonging to the Magnoliaceae family are readily noticed and consumed by birds [63]. The seeds can be dispersed over great distances by birds in flight, enhancing gene flow and partially counteracting the effects of genetic drift [64]. Therefore, we hypothesize that a high frequency of gene flow events is likely the primary reason for the low genetic differentiation in T. odorum Chun populations [65]. In addition, as T. odorum Chun is an ancient relict tree species, its modern distribution and the genetic diversity of its populations may have been profoundly affected by the Last Glacial Maximum. Future studies should delve deeply into its evolutionary history, including glacial refugia. However, it should not be overlooked that insect-pollinated plants with a predominance of outcrossing introduce a new form of isolation in reproductive systems and reduce pollen exchange between populations, leading to increased genetic differentiation and potential erosion between populations [62].
T. odorum Chun has been suggested to be endangered mainly owing to the difficulty of natural reproduction as well as degradation and loss of community habitats. The present study further indicates that the level of genetic diversity in T. odorum Chun is quite low. Therefore, it is recommended that a locally adapted strategy be adopted to conserve T. odorum Chun. Conservation efforts should focus on preserving natural populations with high genetic diversity, such as the Fujian Jian’ou population. Meanwhile, T. odorum Chun populations that are scarcely distributed or in severely damaged or fragmented habitats must be relocated and conserved, including through the establishment of an ex situ germplasm resource bank. For T. odorum populations within fragmented forests, each remnant patch or individual population plays a crucial role in maintaining connections between fragmented populations. It is recommended that these typical fragmented populations be effectively protected in situ to preserve their genetic diversity. In addition, research on the cultivation and propagation of T. odorum Chun should be carried out, and a highly efficient technology system for asexual propagation, such as cutting and tissue culture, should be constructed; highly heterozygous seedlings should be obtained through artificial cross-pollination and molecular mechanisms of propagation barriers and low germination rates should be explored using molecular biology methods. Finally, to efficiently and sustainably utilize the germplasm resources of T. odorum Chun, future research should establish an ecological niche simulation model to explore possible alternative habitats for T. odorum Chun, which will help to expand the distribution range of this species. Through local adaptation, more genetic variation will be generated, thereby enhancing the genetic diversity of T. odorum Chun populations. Therefore, the conservation of T. odorum Chun is urgent, and a combination of in situ and ex situ conservation should be adopted in the future to protect the genetic diversity of the existing germplasm resources. At the same time, relevant cultivation and propagation studies should be carried out to explore possible alternative habitats to increase genetic diversity. The findings of this study elucidate the present genetic diversity and structure of T. odorum Chun, offering a theoretical foundation for the implementation of suitable conservation measures and genetic enhancement strategies.
5. Conclusions
This study utilized GBS technology to analyze the genetic diversity and structure of 17 natural populations of T. odorum Chun in their primary distribution areas for the first time. The phylogenetic, population structure, and principal coordinate analyses revealed that the 17 natural populations formed two major clusters: the Fujian population and a mixed cluster of populations from Jiangxi, Guangdong, Hunan, and Guangxi, displaying a clear geographic pattern. The genetic diversity of T. odorum Chun is quite low relative to that of other endangered tree species. AMOVA as well as Fst and Nm values indicated that genetic differentiation among T. odorum Chun populations is low, suggesting that a certain degree of gene flow exists among subpopulations.
Supplementary Materials
The following supporting information can be downloaded at: https://www.mdpi.com/article/10.3390/f15060910/s1, Table S1: Location information for the 86 sampled T. odorum Chun plants, Table S2: Sequencing quality of the 86 sampled T. odorum Chun individuals, Figure S1: Cross-validation error and K values; Figure S2: Principal coordinate analysis of T. odorum Chun populations using all identified SNPs as markers.
Author Contributions
Conceptualization, Y.Z.; methodology, Y.W., H.L. and Z.Y.; software, Y.W., H.L. and Z.Y.; validation, Z.Y., B.L. and Y.L.; formal analysis, H.L.; investigation, Y.W., Z.Y., B.L., H.L. and Y.L.; resources, Y.W., Z.Y., B.L., H.L. and Y.L.; data curation, H.L. and Y.W.; writing—original draft preparation, H.L. and Y.Z.; writing—review and editing, Y.W., H.L. and Z.Y.; visualization, H.L. and Y.Z.; supervision, Y.Z.; project administration, Y.Z.; funding acquisition, Y.Z. All authors have read and agreed to the published version of the manuscript.
Funding
This research was funded by the National Government Guidance Fund for Regional Science and Technology Development (20192ZDD01004) and the Central Finance Forestry Reform and Development Fund for Forest Seed Cultivation Subsidy Project.
Data Availability Statement
The data presented in this study are available on request from the corresponding author.
Acknowledgments
We appreciate the assistance provided by Yuchen Zhang in creating the distribution map of plant materials.
Conflicts of Interest
The authors declare that they have no conflicts of interest.
References
- Liu, Y. Magnolias of China; Bright Sparks: Beijing, China, 2004. [Google Scholar]
- Fu, L.; Jin, J. Chinese Red Data Book of Rare and Endangered Plants; Science Press: Beijing, China, 1992; pp. 454–455. [Google Scholar]
- Nonić, M.; Šijačić-Nikolić, M. Genetic diversity: Sources, threats, and conservation. In Life on Land; Springer: Cham, Switzerland, 2021; pp. 421–435. [Google Scholar]
- Nugroho, K.; Terryana, R.; Manzila, I.; Priyatno, T.; Lestari, P. The Use of Molecular Markers to Analyze the Genetic Diversity of Indonesian Pepper (Capsicum spp.) Varieties Based on Anthracnose Resistance. Makara J. Sci. 2019, 23, 4. [Google Scholar] [CrossRef]
- Giang, T.; Minh, T.; Thi, L.; Ngoc, D.; Ajani, I. Chemical Constituents and Antimicrobial Activity of Tsoongiodendron odorum and Manglietia chevalieri Essential Oils from Vietnam. Chem. Nat. Compd. 2023, 59, 587–590. [Google Scholar]
- Fu, Y.; Liu, X.; Cheng, F.; Sun, J.; Qin, Z. Modification of the wood surface properties of Tsoongiodendron odorum Chun with silicon dioxide by a sol-gel method. BioResources 2016, 11, 10273–10285. [Google Scholar] [CrossRef]
- Jing, J.; Wang, J.; Kang, M.; Sun, W.; Huang, H. Isolation and characterization of microsatellite loci in Tsoongiodendron odorum (Magnoliaceae). Am. J. Bot. 2011, 98, e284–e286. [Google Scholar] [CrossRef] [PubMed][Green Version]
- Huang, Y.; Zeng, Q.; Fu, J.; Kou, Z.; Chang, R.; Jin, H.; Zhang, W. Chemical constituents from Tsoongiodendron odorum Chun. Biochem. Syst. Ecol. 2011, 39, 209–212. [Google Scholar] [CrossRef]
- Van Eck, H.; van der Voort, J.; Draaistra, J.; van Zandvoort, P.; van Enckevort, E.; Segers, B.; Bakker, J. The inheritance and chromosomal localization of AFLP markers in a non-inbred potato offspring. Mol. Breed. 1995, 1, 397–410. [Google Scholar] [CrossRef]
- Park, T.; Kim, B.; Hutten, R.; van Eck, H.; Jacobsen, E.; Visser, R. Genetic positioning of centromeres using half-tetrad analysis in a 4x-2x cross population of potato. Genetics 2007, 176, 85–94. [Google Scholar] [CrossRef] [PubMed]
- Poland, J.; Rife, T. Genotyping-by-sequencing forplant breeding and genetics. Plant Genome 2012, 5, 92–102. [Google Scholar]
- Chung, Y.; Choi, S.; Jun, T.; Kim, C. Genotyping-by-sequencing: A promising tool for plant genetics research and breeding. Hortic. Environ. Biote. 2017, 58, 425–431. [Google Scholar] [CrossRef]
- Nguyen, T.; Lim, J. Tools for chrysanthemum genetic research and breeding: Is genotyping-by-sequencing (GBS) the best approach. Hortic. Environ. Biote. 2019, 60, 625–635. [Google Scholar] [CrossRef]
- Wirulda, P. Genotyping by Sequencing (GBS) for Genome-Wide SNP Identification in Plants. Methods Mol. Biol. 2023, 2638, 1–8. [Google Scholar]
- Qi, H.; Wang, N.; Qiao, W.; Xu, Q.; Zhou, H.; Shi, J.; Huang, Q. Construction of a high-density genetic map using genotyping by sequencing (GBS) for quantitative trait loci (QTL) analysis of three plant morphological traits in upland cotton (Gossypium hirsutum L.). Euphytica 2017, 213, 1–17. [Google Scholar]
- Moumouni, K.; Kountche, B.; Jean, M.; Hash, C.; Vigouroux, Y.; Haussmann, B.; Belzile, F. Construction of a genetic map for pearl millet, Pennisetum glaucum (L.) R. Br., using a genotyping-by-sequencing (GBS) approach. Mol. Breed. 2015, 35, 5. [Google Scholar] [CrossRef]
- He, J.; Zhao, X.; Laroche, A.; Lu, Z.; Liu, H.; Li, Z. Genotyping-by-sequencing (GBS), an ultimate marker-assisted selection (MAS) tool to accelerate plant breeding. Front. Plant Sci. 2014, 5, 484. [Google Scholar] [CrossRef] [PubMed]
- Liu, Y.; Yi, F.; Yang, G.; Wang, Y.; Pubu, C.; He, R.; Ma, W. Geographic population genetic structure and diversity of Sophora moorcroftiana based on genotyping-by-sequencing (GBS). PeerJ 2020, 8, e9609. [Google Scholar] [CrossRef] [PubMed]
- Siadjeu, C.; Mayland-Quellhorst, E.; Albach, D. Genetic diversity and population structure of trifoliate Yam (Dioscorea dumetorum Kunth) in Cameroon revealed by genotyping-by-sequencing (GBS). BMC Plant Biol. 2018, 18, 359. [Google Scholar] [CrossRef] [PubMed]
- Jiang, X.; Fang, Z.; Lai, J.; Wu, Q.; Wu, J.; Gong, B.; Wang, Y. Genetic diversity and population structure of Chinese Chestnut(Castanea mollissima Blume) cultivars revealed by GBS resequencing. Plants 2022, 11, 3524. [Google Scholar] [CrossRef] [PubMed]
- Islam, A.; Sanders, D.; Mishra, A.; Joshi, V. Genetic Diversity and Population Structure Analysis of the USDA Olive Germplasm Using Genotyping-By-Sequencing (GBS). Genes 2021, 12, 2007. [Google Scholar] [CrossRef] [PubMed]
- Chen, C.; Mitchell, S.; Elshire, R.; Buckler, E.; El-Kassby, Y. Mining conifers’ mega-genome using rapid and efficient multiplexed high-throughput genotyping-by-sequencing (GBS) SNP discovery platform. Tree Genet. Genomes 2013, 9, 1537–1544. [Google Scholar] [CrossRef]
- Gong, X.; Yang, A.; Wu, Z.; Chen, C.; Li, H.; Liu, Q.; Fa, X.; Zhong, Y. Employing genome-wide SNP discovery to characterize the genetic diversity in Cinnamomum camphora using genotyping by sequencing. Forests 2021, 12, 1511. [Google Scholar] [CrossRef]
- Huang, X.; Feng, Q.; Qian, Q.; Zhao, Q.; Wang, L.; Wang, A.; Han, B. High-throughput genotyping by whole-genome resequencing. Genome Res. 2009, 19, 1068–1076. [Google Scholar] [CrossRef] [PubMed]
- Cock, P.J.A.; Fields, C.J.; Goto, N.; Heuer, M.L.; Rice, P.M. The Sanger FASTQ file format for sequences with quality scores, and the Solexa/Illumina FASTQ variants. Nucleic Acids Res. 2010, 38, 1767–1771. [Google Scholar] [CrossRef]
- Chen, S.; Zhou, Y.; Chen, Y.; Gu, J. fastp: An Ultra-Fast All-In-One FASTQ Preprocessor. Bioinformatics 2018, 34, i884–i890. [Google Scholar] [CrossRef] [PubMed]
- Li, H.; Durbin, R. Fast and accurate short read alignment with Burrows-Wheeler transform. Bioinformatics 2009, 25, 1754–1760. [Google Scholar] [CrossRef] [PubMed]
- Li, H.; Handsaker, B.; Wysoker, A.; Fennell, T.; Ruan, J.; Homer, N. The Sequence Alignment/Map format and SAMtools. Bioinformatics 2009, 25, 2078–2079. [Google Scholar] [CrossRef] [PubMed]
- Levy, D.; Yoshida, R.; Pachter, L. Beyond pairwise distances: Neighbor-joining with phylogenetic diversity estimates. Mol. Biol. Evol. 2006, 23, 491–498. [Google Scholar] [CrossRef]
- Yang, J.; Lee, S.; Goddard, M.; Visscher, P. GCTA: A tool for genome-wide complex trait analysis. Am. Hum. Genet. 2011, 88, 76–82. [Google Scholar] [CrossRef] [PubMed]
- Excoffier, L.; Lischer, H. Arlequin suite ver 3.5: A new series of programs to perform population genetics analyses under Linux and Windows. Mol. Ecol. Resour. 2010, 10, 564–567. [Google Scholar] [CrossRef] [PubMed]
- Weir, B.; Cockerham, C. Estimating F-statistics for the analysis of population structure. Evolution 1984, 38, 1358–1370. [Google Scholar]
- Peakall, R.; Smouse, P. GenAlEx 6.5: Genetic analysis in Excel. Population genetic software for teaching and research—An update. Bioinformatics 2012, 28, 2537–2539. [Google Scholar] [CrossRef]
- Catchen, J.; Amores, A.; Hohenlohe, P.; Cresko, W.; Postlethwait, J. Stacks: Building and genotyping Loci de novo from short-read sequences. G3 Genes|Genomes|Genet. 2011, 1, 171–182. [Google Scholar] [CrossRef] [PubMed]
- Lee, K.; Ranta, P.; Saarikivi, J.; Kutnar, L.; Vreš, B.; Dzhus, M.; Kvist, L. Using genomic information for management planning of an endangered perennial, Viola uliginosa. Ecol. Evol. 2020, 10, 2638–2649. [Google Scholar] [CrossRef] [PubMed]
- Feres, J.; Guidugli, M.; Mestriner, M.; Sebbenn, A.; Ciampi, A.; Alzate-Marin, A. Microsatellite diversity and effective population size in a germplasm bank of Hymenaea courbaril var. stilbocarpa (Leguminnosea), an endangered tropical tree: Recommendation for conservation. Genet. Resour. Crop. Ev. 2009, 56, 797–807. [Google Scholar] [CrossRef]
- Frankel, O.; Soulé, M. Conservation and Evolution; Cambridge University Press: Cambridge, UK, 1981. [Google Scholar]
- Lande, R.; Barrowclough, G. Effective population size, genetic variation, and their use in population management. In Viable Populations for Conservation; Cambridge University Press: Cambridge, UK, 1987; Volume 87, pp. 87–124. [Google Scholar]
- Rossetto, M.; Weaver, P.; Dixon, K. Use of RAPD analysis in devising conservation strategies for the rare and endangered Grevillea scapigera (Proteaceae). Mol. Ecol. 1995, 4, 321–330. [Google Scholar] [CrossRef] [PubMed]
- Xu, Y.; Zang, R. Theoretical and practical research on conservation of Wild Plants with Extremely Small Populations in China. Biodivers. Sci. 2022, 30, 84–105. [Google Scholar] [CrossRef]
- Xiong, M.; Tian, S.; Zhang, Z.; Fan, D.; Zhang, Z. Population genetic structure and conservation units of Sinomanglietia glauca (Magnoliaceae). Biodivers. Sci. 2014, 22, 476–484. [Google Scholar]
- Yu, H.; Yang, Z.; Sun, B.; Liu, R. Genetic diversity and relationship of endangered plant Magnolia officinalis (Magnoliaceae) assessed with ISSR polymorphisms. Biochem. Syst. Ecol. 2011, 39, 71–78. [Google Scholar] [CrossRef]
- Xiang, C.; Zhu, X.; Zhang, H.; Qiu, D. Genetic Diversity of Endangered Plant Michelia wilsonii. J. Northwest For. Univ. 2009, 24, 66–69. [Google Scholar]
- Zhao, X.; Ma, Y.; Sun, W.; Wen, X.; Milne, R. High genetic diversity and low differentiation of Michelia coriacea (Magnoliaceae), a critically endangered endemic in southeast Yunnan, China. Int. Mol. Sci. 2012, 13, 4396–4411. [Google Scholar] [CrossRef]
- Eckert, C.; Samis, K.; Lougheed, S. Genetic variation across species’ geographical ranges: The central–marginal hypothesis and beyond. Mol. Ecol. 2008, 17, 1170–1188. [Google Scholar] [CrossRef]
- Stoeckel, S.; Grange, J.; Fernandez-Manjarres, J.; Fernández-Manjarres, J.; Bilger, I.; Frascaria-Lacoste, N.; Mariette, S. Heterozygote excess in a self-incompatible and partially clonal forest tree species―Prunus avium L. Mol. Ecol. 2006, 15, 2109–2118. [Google Scholar] [CrossRef] [PubMed]
- Rasmussen, K.; Kollmann, J. Low genetic diversity in small peripheral populations of a rare European tree (Sorbus torminalis) dominated by clonal reproduction. Conserv. Genet. 2008, 9, 1533–1539. [Google Scholar] [CrossRef]
- Luijten, S.; Dierick, A.; Gerard, J.; Oostermeijer, B.; Raijmann, L.; Den Nijs, H. Population size, genetic variation, and reproductive success in a rapidly declining, self-incompatible perennial (Arnica montana) in The Netherlands. Conserv. Biol. 2000, 14, 1776–1787. [Google Scholar]
- Kang, M.; Jiang, M.; Huang, H. Genetic diversity in fragmented populations of Berchemiella wilsonii var. pubipetiolata (Rhamnaceae). Ann. Bot. 2005, 95, 1145–1151. [Google Scholar] [CrossRef] [PubMed][Green Version]
- Niu, Y.; Bhatt, A.; Peng, Y.; Chen, W.; Gao, Y.; Zhan, X.; Yu, Z. Genetic diversity and population structure analysis of Emmenopterys henryi Oliv., an endangered relic species endemic to China. Genet. Resour. Crop. Ev. 2021, 68, 1135–1148. [Google Scholar] [CrossRef]
- Deng, Y.; Liu, T.; Xie, Y.; Wei, Y.; Xie, Z.; Shi, Y.; Deng, X. High Genetic Diversity and Low Differentiation in Michelia shiluensis, an Endangered Magnolia Species in South China. Forests 2020, 11, 469. [Google Scholar] [CrossRef]
- Liu, Y.; Zheng, Y.; Li, C.; Lin, F.; Huang, P. Genomic Characteristics and Population Genetic Variation of Dalbergia cultrata Graham ex Benth in China. For. Res. 2022, 35, 44–53. [Google Scholar]
- Barros, J.; Winkler, F.; Velasco, L. Assessing the genetic diversity in Argopecten nucleus (Bivalvia: Pectinidae), a functional hermaphrodite species with extremely low population density and self-fertilization: Effect of null alleles. Ecol. Evol. 2020, 10, 3919–3931. [Google Scholar] [CrossRef]
- Chen, B.; Cole, J.; Grond-Ginsbach, C. Departure from Hardy Weinberg equilibrium and genotyping error. Front. Genet. 2017, 8, 167. [Google Scholar] [CrossRef]
- Kameyama, Y.; Furumichi, J.; Li, J.; Tseng, Y. Natural genetic differentiation and human-mediated gene flow: The spatiotemporal tendency observed in a long-lived Cinnamomum camphora (Lauraceae) tree. Tree. Genet. Genomes 2017, 13, 38. [Google Scholar] [CrossRef]
- Yang, A.; Zhong, Y.; Liu, S.; Liu, L.; Liu, T.; Li, Y.; Yu, F. New insight into the phylogeographic pattern of Liriodendron chinense (Magnoliaceae) revealed by chloroplast DNA: East–west lineage split and genetic mixture within western subtropical China. PeerJ 2019, 7, e6355. [Google Scholar] [CrossRef]
- Chen, T.; Lou, A. Phylogeography and paleodistribution models of a widespread birch (Betula platyphylla Suk.) across East Asia: Multiple refugia, multidirectional expansion, and heterogeneous genetic pattern. Ecol. Evol. 2019, 9, 7792–7807. [Google Scholar] [CrossRef]
- Wright, S. Evolution and Genetics of Populations: Variability within and among Natural Populations; University of Chicago Press: Chicago, IL, USA, 1978; p. 37. [Google Scholar]
- Slatkin, M. Gene flow and the geographic structure of natural populations. Science 1987, 236, 787–792. [Google Scholar] [CrossRef]
- Tan, J.; Zhao, Z.; Guo, J.; Wang, C.; Zeng, J. Genetic Diversity and Population Genetic Structure of Ervthrophleum fordii Oliv., an Endangered Rosewood Species in South China. Forests 2018, 9, 636. [Google Scholar] [CrossRef]
- Hartvig, I.; So, T.; Changtragoon, S.; Tran, H.; Bouamanivong, S.; Theilade, I.; Nielsen, L. Population genetic structure of the endemic rosewoods Dalbergia cochinchinensis and D. oliveri at a regional scale reflects the Indochinese landscape and life-history traits. Ecol. Evol. 2017, 8, 530–545. [Google Scholar] [CrossRef] [PubMed]
- Albaladejo, R.G.; Carrillo, L.F.; Aparicio, A.; Fernández-Manjarrés, J.F.; González-Varo, J.P. Population genetic structure in Myrtus communis L. in a chronically fragmented landscape in the Mediterranean: Can gene flow counteract habitat perturbation? Plant Biol. 2009, 11, 442–453. [Google Scholar] [PubMed]
- Tian, K.; Zhang, G.; Cheng, X.; He, S.; Yang, Y.; Yang, Y. The habitat fragility of Manglietiastrum sinicum. Acta Bot. Yunnanica. 2003, 25, 551–556. [Google Scholar]
- Wright, S. Evolution in Mendelian populations. Genetics 1931, 16, 97. [Google Scholar] [CrossRef]
- Allendorf, F. Isolation, gene flow, and genetic differentiation among populations. Genet. Conserv. 1983, 18, 51–65. [Google Scholar]


Disclaimer/Publisher’s Note: The statements, opinions and data contained in all publications are solely those of the individual author(s) and contributor(s) and not of MDPI and/or the editor(s). MDPI and/or the editor(s) disclaim responsibility for any injury to people or property resulting from any ideas, methods, instructions or products referred to in the content. |
© 2024 by the authors. Licensee MDPI, Basel, Switzerland. This article is an open access article distributed under the terms and conditions of the Creative Commons Attribution (CC BY) license (https://creativecommons.org/licenses/by/4.0/).