Article

Stand Structure and Functional Traits Determine Productivity of Larix principis-rupprechtii Forests

1
College of Forestry, Hebei Agricultural University, Baoding 071001, China
2
College of Life Sciences, Hebei Agricultural University, Baoding 071000, China
*
Author to whom correspondence should be addressed.
Forests 2024, 15(6), 924; https://doi.org/10.3390/f15060924
Submission received: 23 April 2024 / Revised: 11 May 2024 / Accepted: 24 May 2024 / Published: 26 May 2024
(This article belongs to the Section Forest Ecology and Management)

Abstract

:
Forest productivity (FP) depends not only on tree species diversity but also on functional traits, stand structure, and environmental factors; however, causation and relative importance remain controversial. The effects of tree species diversity (species richness), trait community-weighted mean (CWM), forest structure (forest density and maximum DBH), and environmental factors (soil nutrients and elevation) on larch (Larix principis-rupprechtii Mayr) forests’ productivity were investigated, and the relative importance of each factor in determining productivity was quantified. Our results showed that stand structure and functional traits had significant positive effects on the basal area increment (BAI) of larch stands (p < 0.05) and were more important than tree diversity and environmental factors in explaining BAI variations. The contribution ratio of each influencing factor was as follows: stand structure (59%), functional composition (30%), environmental factors (9%), and species diversity (SD) (2%). The biomass ratio hypothesis was more important than the niche complementarity hypothesis in explaining the relationship between species diversity and productivity. The structural equation model showed that environmental factors did not directly affect the BAI in larch forests but indirectly affected the BAI through tree diversity and stand structure. Therefore, in larch forests with low species richness, it is more important to adjust stand structure to maintain overyielding while also considering the influence of environmental factors.

1. Introduction

Forest productivity (FP) is the fundamental driving force affecting the maintenance and development of forest ecosystems. Investigating both internal biological factors and external ecological conditions to sustain forest productivity constitutes a vital aspect of contemporary ecological and forestry research [1,2]. FP is affected by many factors and varies with different spatial and temporal scales [3,4]. Previous results have shown that tree diversity [5], stand structure and diversity [4,6,7], functional traits [8], and environmental conditions [9,10] are closely associated with productivity. Therefore, it is important to compare the effects of different biotic and abiotic factors on FP and distinguish their relative importance.
In recent decades, the impact of species diversity (SD) loss on ecosystem function, especially on forest biomass and productivity, has attracted great attention from ecologists. Numerous studies have shown that there is a positive correlation between SD and productivity [1,3,11,12], but other studies have reported negative [13,14] and uncorrelated relationships [15]. In addition to tree diversity, the influence of functional diversity on FP has attracted increasing attention. Some studies have shown that functional diversity plays a more significant role in predicting FP than does tree species diversity. Two hypotheses have been proposed to account for the positive relationship between SD and FP: the niche complementarity hypothesis and the biomass ratio hypothesis [15,16]. The niche complementarity hypothesis holds that communities with more species can more effectively acquire and utilize limited resources through niche partitioning and/or facilitation [17], and this hypothesis is usually tested by diversity indices (such as species and functional diversity). According to the biomass ratio hypothesis, ecosystem function at a given time point is primarily determined by the functional values of the dominant species [18]. Variability in the relationships between tree diversity, functional diversity, and FP may be caused by differences in stand structure, tree composition, or environment-related differences [13,19].
When studying the direct and indirect effects of tree diversity on FP, the coupled effects of stand structure factors, such as stand age, stand density, tree size, and structural diversity, on FP should be considered simultaneously [20]. Age is a key driver of stand biomass and stand productivity [21]. Older stands often contain larger, older trees [22], increasing productivity through increases in tree size and size variation [5,23]. A higher stand density increases productivity by capturing more light in denser canopies [24]. Some studies have also shown that a higher stand density leads to an increased mixing effect and thus improves mixed FP [25,26]. In many cases, the positive relationship between structural diversity and productivity is often due to the canopy complexity formed by tree diversity [27,28]. In monocultures, structural diversity and productivity have been found to be more uncorrelated [29] or negatively correlated [27,30], and the negative effect may be due to the reduced light interception and light use efficiency of trees in the lower canopy [31]. Size heterogeneity sometimes does not affect tree growth directly, but indirectly through other variables [32].
In addition to tree diversity and stand structure, environmental factors (e.g., soil and climate) are also important in influencing FP. In general, stands with higher soil fertility are usually able to provide a greater abundance of nutrients and water, which contributes to tree growth. In contrast, trees in low-fertility soils may be nutrient-limited, so they may adopt conservative growth strategies such as slowing growth rates [33]. Elevation influences the local climate (e.g., precipitation and temperature) and soil characteristics, which in turn may influence the species distribution and community composition [34], ultimately determining FP. Therefore, environmental factors should be considered when studying the effects of biological factors on FP.
Larch (Larix principis-rupprechtii Mayr) stands as a prominent coniferous species in North China, playing a crucial role in timber production, carbon sequestration, and the provision of ecological services. In the original distribution areas of Hebei and Shanxi Provinces, larch forests face challenges such as low productivity and stability, primarily due to the region’s extremely arid climate and limited forest management techniques. As a result, these forests struggle to yield multifunctional benefits effectively [35]. Elucidating the maintenance mechanism of larch FP is thus of great importance. Despite the increasing attention given to functional traits and their diversity in the field of ecology and forestry, their specific links and mechanisms of action concerning FP (e.g., the niche complementarity hypothesis and biomass ratio hypothesis) still need to be further studied and clarified. Resolving this issue will lead to more precise enhancement of the productivity of larch forests. Considering the effects of tree species diversity, functional traits, stand structure, and environmental factors on productivity, improving the quality of larch forests holds significant theoretical and practical importance. In this study, we sought to address the following three questions: (1) Does stand structure have a significant impact on pure and mixed larch FP? (2) Which mechanism (the biomass ratio hypothesis or the niche complementarity hypothesis) is more important in explaining productivity variation in larch forests? (3) How do abiotic and biotic factors directly or indirectly affect productivity in larch forests? These findings will deepen our comprehension of the processes sustaining larch forest productivity and offer a scientific basis for tree planting and forest management.

2. Materials and Methods
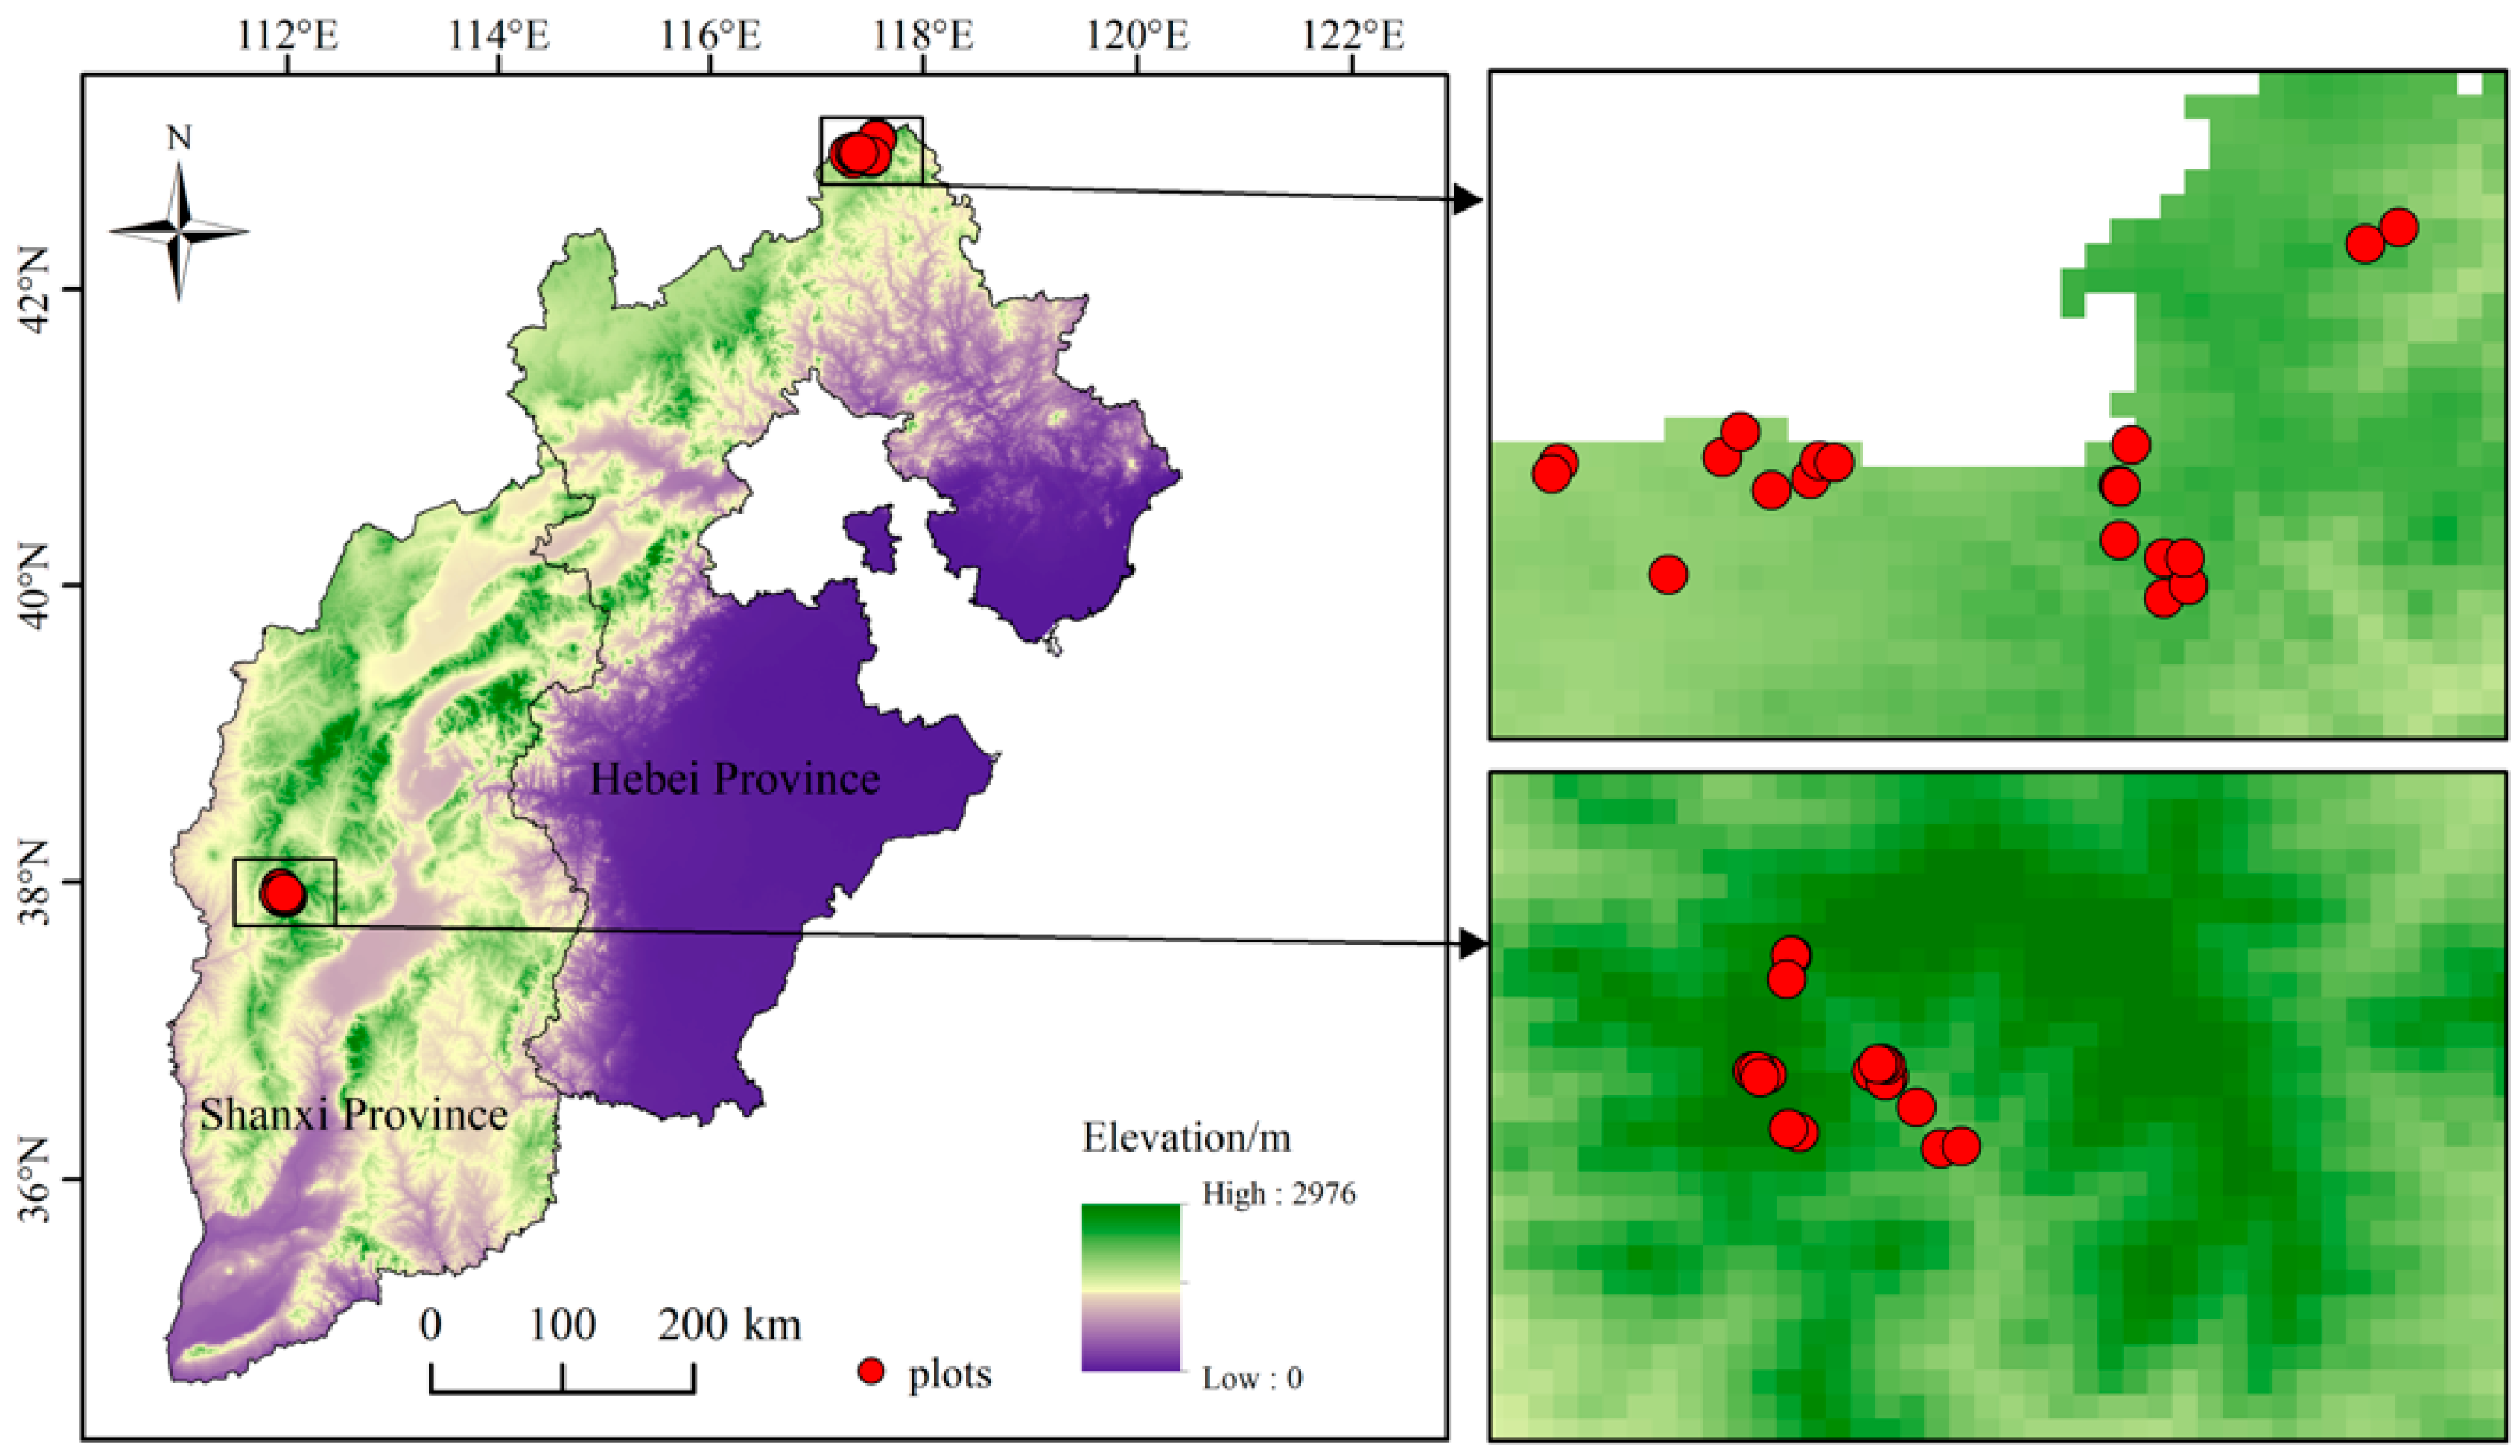
2.1. Study Area

The study areas are located on the Saihanba Mechanical Forest Farm (SMFF) (42°04′–42°36′ N, 116°53′–117°39′ E) in Weichang County, Chengde city, Hebei Province, and Pangquangou National Nature Reserve (PNNR) (37°45′ N–37°55′ N, 111°22′ E–111°33′ E), Jiaocheng County, Lvliang city, Shanxi Province (Figure 1). The climate of SMFF is characterized by a cold, temperate continental monsoon. The average annual temperature is −1.40 °C and the average annual rainfall is 452.6 mm. Soil types include brown earth, gray forest soil, chernozem soil, etc. Major tree species include larch (Larix principis-rupprechtii Mayr), birch (Betula platyphylla Suk.), spruce (Picea asperata Mast.), pine (Pinus sylvestris var. mongolica Litv.), and aspen (Populus davidiana Dode). PNNR has an average annual temperature of 4.2 °C and an average annual rainfall of 822.6 mm. It has continental mountain monsoon climate characteristics, and the rainfall area is transitive from sub-arid to sub-humid regions. The main tree species are larch (Larix principis-rupprechtii Mayr), pine (Pinus tabuliformis Carr.), and spruce (Picea asperata Mast.), and these species are occasionally accompanied by birch (Betula platyphylla Suk.), oak (Quercus liaotungensis Koidz.), and other trees.
The Saihanba area, once a royal hunting ground, underwent a significant transformation in the last century. Unwise human development and exploitation led to severe vegetation destruction. However, since 1962, the ecological state of the region has dramatically improved due to large-scale plantation initiatives. Afforestation approaches and projects to restore degraded forests were implemented. As a result, the area now has abundant larch plantations and mixed larch–birch forests. In 1980, the establishment of the Shanxi PNNR was approved, with the aim of preserving the region’s typical natural forests without commercial harvesting.

2.2. Data Collection

Nineteen and twenty plots (20 × 30 m) were established in July–August 2019 on SMFF and PNNR, respectively, and the longitude, latitude, and elevation information for each plot was recorded (Table 1). In most of the forests on SMFF, coniferous species like larch and spruce are planted, whereas broadleaf species like birch and aspen are generally naturally regenerated. On PNNR, pure larch forests less than 40 years old are plantations, while those older than 40 years are generally natural forests. Additionally, all mixed larch forests are natural forests. To avoid spatial autocorrelation, sample plots were spaced at least 1000 m apart. Each tree in the plots with a DBH (diameter at breast height) of 5 cm or larger was systematically numbered, measured, and recorded for its species, DBH, and height details. The number of trees used to obtain tree-ring cores in each plot was determined according to the distribution of the diameter classes. Based on a 2 cm diameter class interval, at least one sample tree was selected. A total of 5 to 10 sample trees per species were obtained in each plot. The criteria for selecting sample trees included being healthy, straight, disease-free, and evenly distributed within the plot. At breast height (1.3 m), two cores were drilled from sampled trees, following both east to west and south to north directions, using an increment borer. A total of 480 cores from 240 trees were returned to the laboratory. All sample cores were dried, stabilized, and sand-blasted until the boundaries of the rings were clearly visible. Tree ring widths were measured using WinDENDRO image analysis system 2022b [36]. Inspection and quality control of the crossdating data were analyzed using the program COFECHA [37].
In this study, leaf samples were collected from 39 sample plots in Hebei and Shanxi Provinces. We sampled leaves from every tree species in the sample plots using pruning shears. For each tree species, five disease-free trees with DBH ≥ 5 cm were randomly selected. The functional traits of all sample trees in the plots were measured (see Supplementary Table S1 for details); these functional traits are commonly used in studies of community ecology and are closely correlated with FP [38,39,40]. The following nine functional traits were included: wood density (WD, g/cm3), leaf area (LA, cm2), specific leaf area (SLA, cm2/g), maximum tree height (Hmax, m), leaf dry matter content (LDMC, g/g), leaf carbon content (LCC, g/kg), leaf nitrogen content (LNC, g/kg), leaf phosphorus content (LPC, g/kg), and leaf potassium content (LKC, g/kg). Measurements of leaf traits were based on standardized methods [41]. Hmax data were obtained from the Chinese Flora [42]. Five healthy, undamaged, and sun-exposed leaves were clipped from each sample tree for measuring LA. LA was determined using LI-COR 3100C Area Meter (LI-COR Biosciences, Lincoln, NE, USA). A sufficient number of leaves were taken from each sample tree and brought back to the laboratory. The leaves were dried at 68 °C until reaching a consistent weight, then pulverized using a grinder to measure LCC, LNC, LPC, and LKC. The leaves were soaked in ionized water for 12 h, and the removed leaves were dried with filter paper, at which time the leaf saturated fresh weight was obtained. Then, the leaves were dried, and the leaf dry weight was measured. The LDMC was the ratio of the leaf dry weight to the leaf saturated fresh weight. The SLA was the ratio of the leaf area to the leaf dry mass. Five healthy trees of each species were randomly selected around the sample plot, and a core was drilled at 1.3 m above the ground using a growth cone with an inner diameter of 5.15 mm. The volume of the tree core was obtained by measuring the length of the annual ring strips, and then dried in a 103 °C oven for about 72 h to constant weight. The measurement of the WD involved dividing its dry weight by its fresh volume. Soil samples at depths of 0–10 cm and 10–20 cm were gathered using a soil auger with an internal diameter of 4 cm. Five randomly selected sampling points were set up in the sample plot [43]. Soil samples were dried and sieved with a 20-mesh sieve for the determination of total nitrogen (TN), total phosphorus (TP), total potassium (TK), available phosphorus (AP), available potassium (AK), and pH [44].

2.3. Calculation of Productivity

To measure tree growth, the annual increase in ring width was converted into the basal area increment (BAI), a metric less affected by age and size compared to the annual ring width alone [45]. The BAI at the individual tree level was calculated from the raw width measurements using the following equation:
B A I i = π × ( R n 2 R n T 2 ) / T
where BAIi is the mean annual BAI (cm2/year) of tree i sampled in T years; Rn and Rn−T are the radii of n years and n−T years, respectively; and T is the study period.
At the stand level, the BAI for each smpled tree was allocated to those with identical diameter sequences using DBHc/DBHss weighting, where DBHc represents the square of the subject tree’s diameter and DBHss is the average of squared diameters of all trees in the stand at that order [12].

2.4. Stand Structure

The stand structure factors used in this study included stand density (N, trees/ha), maximum diameter at breast height (maximum DBH, cm), and stand age (age). To estimate stand age, we selected the five dominant trees in each plot. SD can be thought of as a component of forest structure; however, for the purposes of this study, we distinguished between structural diversity and tree species diversity and quantified the former as the Gini coefficient of basal area (GCba) [46]. In order to represent the degree of diameter inequality in a stand [47,48], the Gini coefficient was calculated using the “ineq” package in R [49].

2.5. Functional Traits and Tree Species Diversity

Functional diversity (FD) and tree diversity were calculated to investigate their effects on productivity. The species richness (S) was used to represent the tree diversity. The FD package in R [50] was used to compute the functional evenness index (FEve), functional dispersion index (FDis), the Rao’s quadratic entropy index (FDQ), and the CWMs of each of the traits (WD, LA, SLA, Hmax, LDMC, LCC, LNC, LPC, LKC). The CWMs represent the means of the functional traits of all tree species within the community [8,51], and FD represents the variation in functional trait values among tree species [52]. If S, FEve, FDis, or FDQ were found to influence the BAI, the niche complementarity hypothesis was supported, and if CWMs were found to influence BAI, then the biomass ratio hypothesis was supported.

2.6. Environmental Variables

Environmental variables included soil nutrients (TN, TP, TK, AP, AK, and pH), elevation, and climate factors (the average annual temperature and average annual precipitation). Climate is an important factor affecting tree growth. Using the geographic coordinates (longitude and latitude) and elevation of the plots, the average annual temperature and average annual precipitation for each plot were estimated using the Climate AP software [53].

2.7. Statistical Analysis

The Pearson correlation coefficient was used to examine the correlation between forest productivity and various independent factors (Figure 2). Prior to correlation analysis, the data were log-transformed. A multiple linear regression model was developed using ordinary least squares (OLS), and the independent variables were transformed for standardization (average = 0 and SD = 1) before analysis. In order to eliminate multicollinearity of the variables, the “vif” function in the “car” package in R [49] was used for testing, and all of the variance inflation factors were less than 5, which indicates that there was no covariance in the variables (Table S2). We employed the “regsubsets” function from the “leaps” R package to perform comprehensive subset regression, selecting the optimal model from 17 potential models based on the Akaike information criterion (AIC) and modified R2 values (Figure S1). Standardized regression coefficients were used to assess the relative importance of each variable, and the final regression model met the conditions of the hypotheses.
Based on the a priori structural equation modeling shown in Figure 3, we constructed structural equation models (SEMs) using the “psem” function of the R “piecewiseSEM” package [54] to assess the direct and indirect effects of each predictive variable on BAI. We performed bootstrapping procedures before building the model. Bootstrapping makes it possible to measure the accuracy and reliability of sample estimates and is often recommended for small samples and samples with unknown or non-normal distributions [55]. Six soil variables (TN, TP, TK, AP, AK, PH) (“soil” in Figure 3) and the CWMs of the nine traits (WD, LA, SLA, Hmax, LDMC, LCC, LNC, LPC, LKC) (“functional composition”) were entered into the SEM as candidate variables. The results of Pearson analysis showed that the functional diversity indices (FEve, FDis, and FDQ) were not significantly correlated with BAI, so no functional diversity was entered into the SEM, and SD in the SEM only represented tree richness (S). Elevation usually affects temperature and precipitation. According to the Pearson analysis results, the impact of temperature and precipitation on productivity was similar to that of elevation. Therefore, only elevation was included in the SEM. SEM fit was assessed using a directed separation test. The p-value of the Fisher’s C statistic was 0.1 > 0.05, which indicated that the structure in the model was reasonable. All the statistical analyses were implemented in R, version 3.4.1 [49].

3. Results

3.1. Effect of Stand Structure on the BAI

Stand density explained the greatest variation in the BAI (Figure 4a; slope = 0.0001, R2 = 0.37, p < 0.001), followed by stand age (Figure 4d; slope = –0.003, R2 = 0.22, p < 0.01) and maximum DBH (Figure 4b; slope = –0.004, R2 = 0.13, p < 0.05). When environmental factors, tree diversity, and functional traits were considered in the multiple regression model, density and maximum DBH still had a significant (p < 0.001) positive effect on the BAI (Table 2).

3.2. Relative Importance of the Effects of SD and Functional Traits on the BAI

There was no significant correlation between species richness and BAI, but the CWM_LCC (3f; slope = 0.002, R2 = 0.11, p < 0.05) and CWM_LPC (Figure 4g; slope = 0.060, R2 = 0.11, p < 0.05) explained the same variation in the BAI, followed by the CWM_LKC (Figure 4h; slope = 0.035, R2 = 0.10, p < 0.05). The effects of stand structure and functional traits on the BAI were more significant than those of environmental factors and SD (Figure 5a). Stand density had the most positive and significant effect on the BAI, while elevation and species richness had negative but insignificant effects. In descending order, the percentage contribution was as follows: stand structure (59%), functional composition (30%), environmental factors (9%), and SD (2%) (Figure 5b).

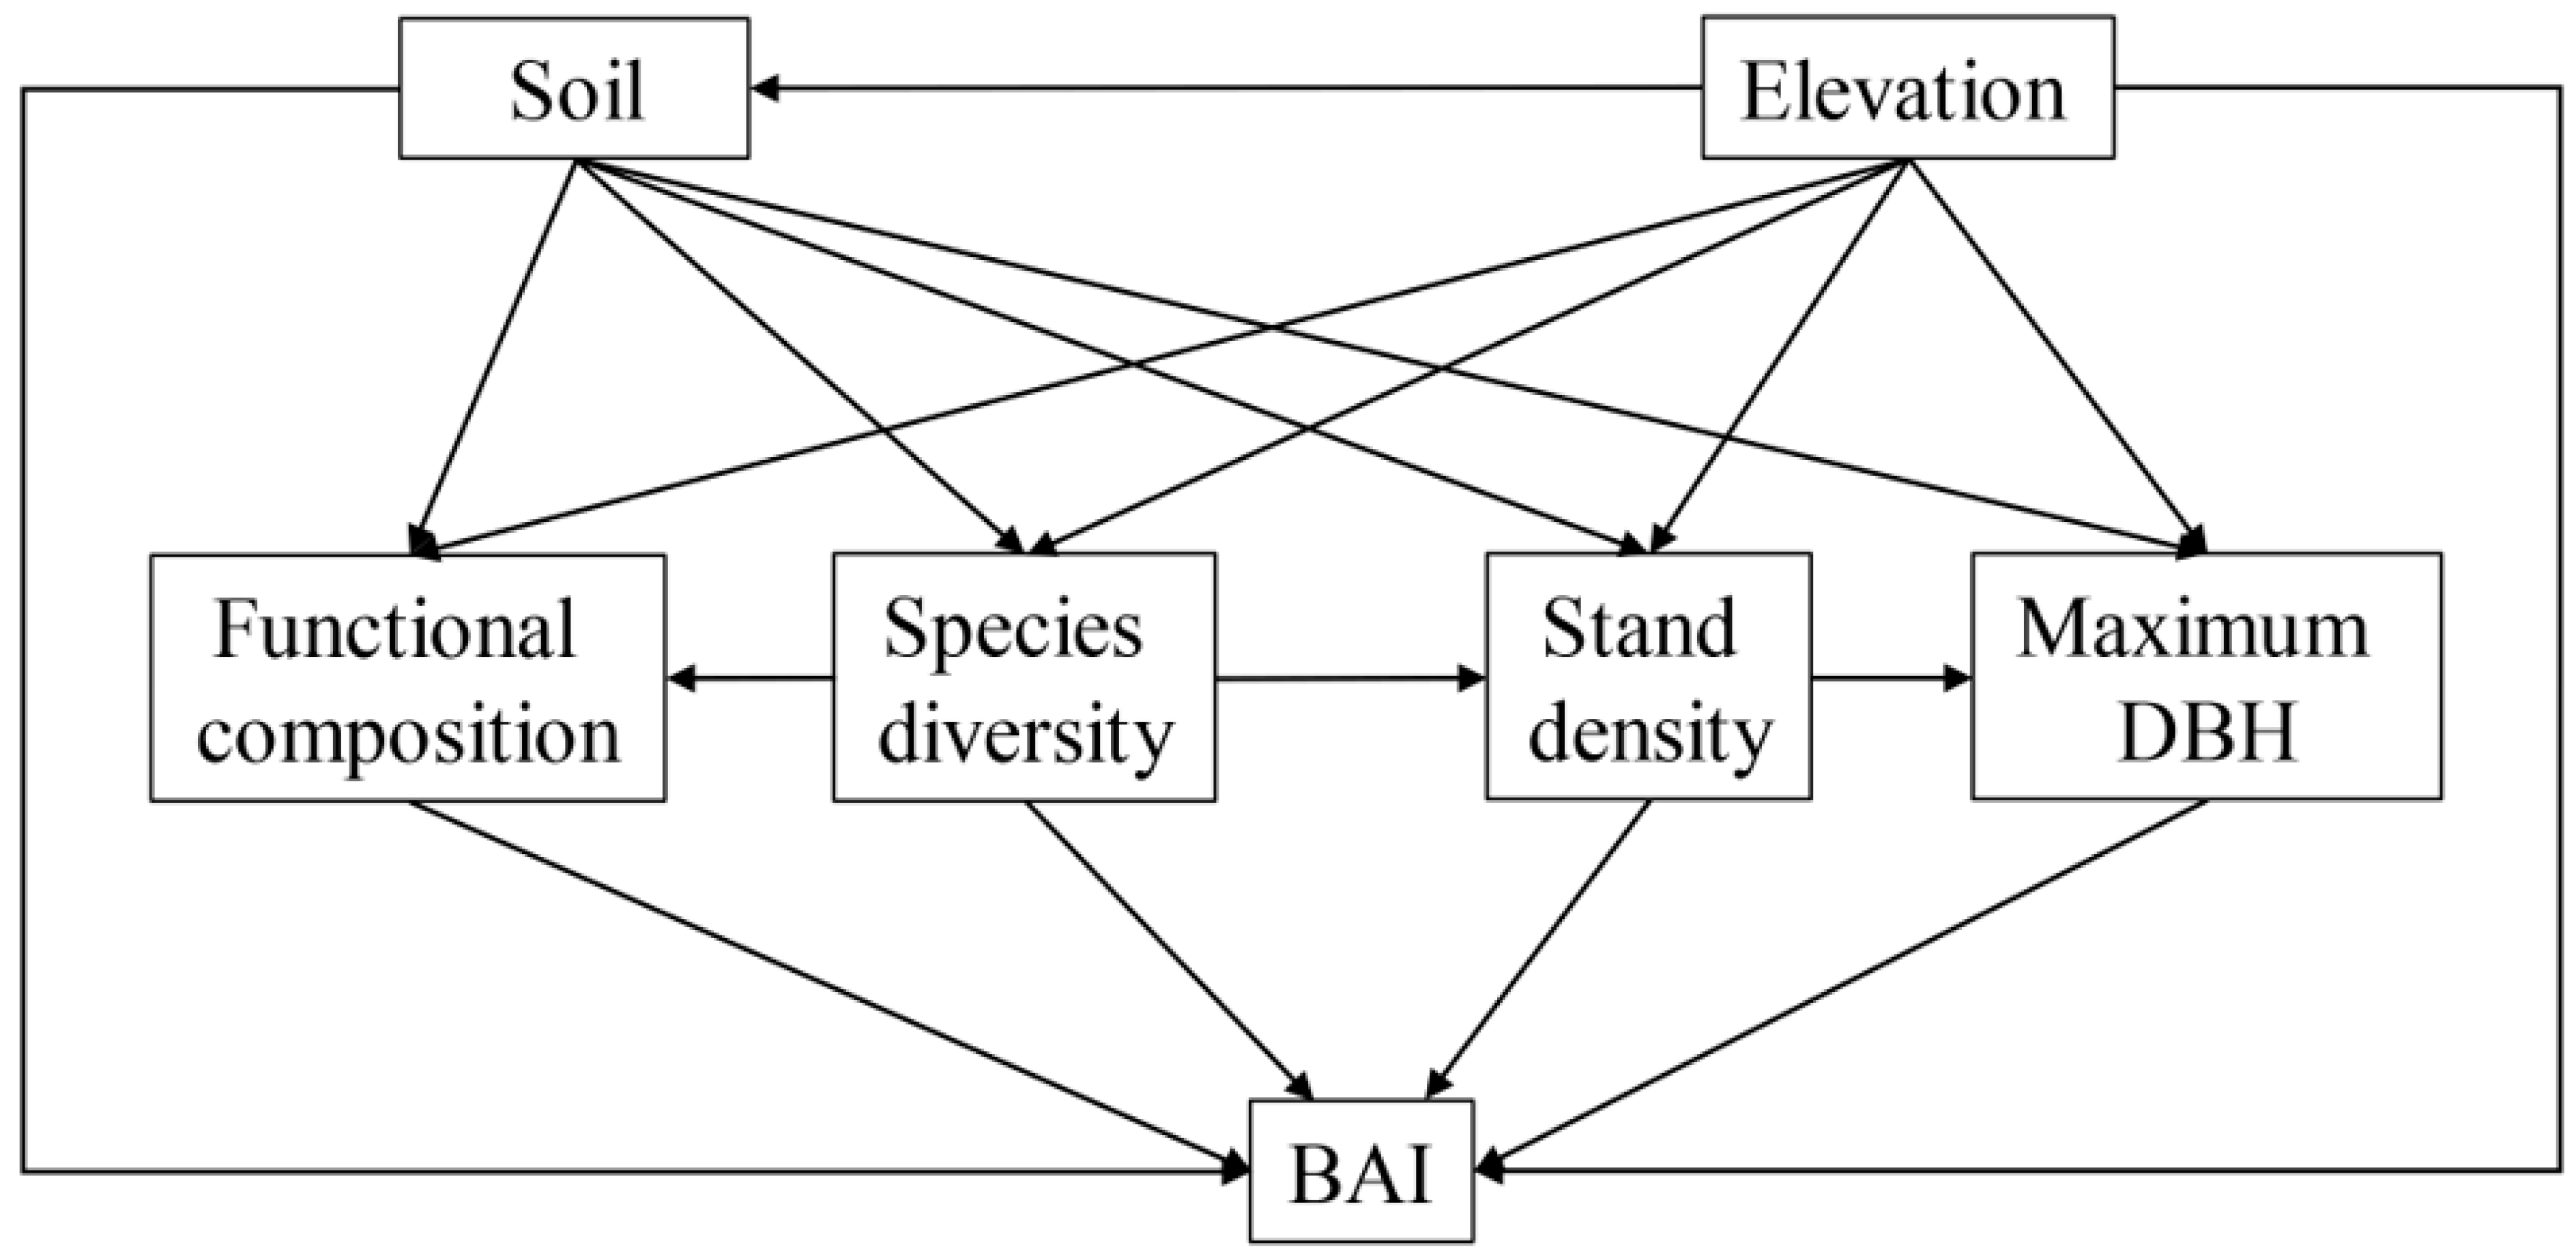
3.3. Impact Factors Directly and Indirectly Affect BAI

Through structural equation modeling, it was discovered that each predictor had both direct and indirect impacts on the BAI, accounting for 62% of the total variance in the BAI. (Figure 6). Functional composition, stand density, and maximum DBH had significant positive effects on the BAI, and SD had significant negative effects on the BAI. Environmental factors (soil and elevation) mainly played an indirect role on the BAI. Soil factors had a significant positive effect on the BAI through SD and maximum DBH, and elevation had a significant positive effect on the BAI through maximum DBH. SD had a significant positive effect on the BAI through stand density. Stand density had a significant negative effect on the BAI through maximum DBH (Figure 6, Table S3).

4. Discussion

4.1. Stand Structure Plays an Important Role in Explaining the Variation in Larch FP

This study found that stand density had a significant positive effect on larch’s productivity and was a better determinant of productivity than tree species richness (Figure 5, Table 2). The positive effect of stand density on FP may be due to a higher vertical physical spatial structure leading to greater canopy accumulation density, which in turn promotes the capture and use of above-ground light in the stand [56,57]. Recent studies have shown that complementary effects between larch and birch do not occur when the stand density is low, and that both individual and stand level productivity are lower than that of corresponding pure stands. However, when the stand density is high, birch can significantly promote the growth of larch [58]. In contrast, no significant effect of stand density on productivity was found in the other two coniferous mixed forests [59]. This indicates that the effect of stand density on productivity depends on the species composition. The maximum stand density may be influenced by species composition. However, when stand density is below the maximum level, it should consistently be associated with increased productivity, regardless of species composition. In this study, SD indirectly influenced the productivity of larch by affecting stand density (Figure 6), indicating that the effect of SD should be considered when studying the effect of stand density on productivity.
Our results showed that large trees could significantly increase stand productivity (Figure 5). This result may be due to the vertical and horizontal stratification structure resulting in larger trees occupying a dominant position in the canopy layer, thus capturing more light and accessing more nutrients, water, and other resources, making them more competitive and thus increasing stand productivity [60]. The negative bivariate relationship observed in Figure 4 contradicted the positive correlations we found in our multiple regression and structural equation modeling analyses. We suggest that this contradiction may stem from the complex interplay of factors that influence FP. Although the bivariate analysis provided a simple test of the relationship between tree maximum DBH and BAI, it did not account for other influences. However, our subsequent analyses included additional covariates such as elevation, soil, species richness, density, and community-weighted means of leaf traits, which likely influenced the observed relationships. Small trees do not compete directly with larger trees, but make full use of above-ground resources in later successional stages and contribute additional productivity to the entire stand [61]. However, this result often depends on silvicultural interventions, and they can only play a limited role in increasing stand productivity when there is a relatively small proportion of large trees [62]. The same was verified in the SEM results of this study, where stand density indirectly influenced stand productivity by affecting tree maximum DBH, and there was a negative correlation between stand density and maximum DBH (Figure 6). Recent research shows that in young stands aged 39 years, large trees exhibit a growth advantage, while low-density stands show significantly greater growth compared to high-density stands. In the stands over 40 years old, the drought index had a more significant effect on tree growth [63]. This means that as stands age, the influence of environmental factors on tree growth is likely to intensify, with drought becoming an increasingly important factor. In North China, larch forests are a major potential carbon sink and play an important role in timber production. Forest production and sustainable forest management can benefit from explaining these important forest stand structures [12].

4.2. The Biomass Ratio Hypothesis Is More Important Than the Niche Complementarity Hypothesis to Explain Variation in Larch Productivity

The results of the multiple regression in this study (Figure 5) indicated that functional composition played a more important role in determining productivity than did species richness, which supports the biomass ratio hypothesis [18]. The biomass ratio hypothesis indicates that dominant species or traits drive ecosystem function and that the positive relationship between biodiversity and productivity is simply because diverse communities are more likely to contain a small number of highly productive species and highly functional traits [39,64]. Our results were consistent with other studies showing that the CWMs have important effects on ecosystem properties, processes, and services [52,65]. In the semi-arid forests of western Iran affected by human activities, the dominant tree species, Persian oak, significantly contributes to above-ground biomass. This contribution tends to decrease in stands with a higher tree mixture, supporting the biomass ratio hypothesis [66]. Also in temperate deciduous forests, the carbon stocks of large trees (DBH≥ 50 cm) were mainly affected by biomass ratio effects and soil fertility, rather than niche complementarity effects or large tree effects [67]. This study was conducted in temperate regions. Temperate larch forests are characterized by low temperatures and low species richness. If ecological traits remain constant within the evolutionary spectrum in temperate forests, environmental filtering may tend to select species with similar ecological functions, resulting in a mass ratio effect. And if the competitive exclusion effect is stronger than the environmental filtering effect, functional differentiation may occur [38]. It has been suggested that species with high functional dominance, low functional dispersion, and species evenness are more likely to be highly productive at the whole community level [68]. However, most of the plots in this study were dominated by larch, so it is likely that the high functional trait (leaf potassium content) of larch enhances FP, thus supporting the biomass ratio hypothesis.
Species richness was negatively, but not significantly correlated with productivity (Figure 5, Table 2). This finding failed to support the niche complementarity hypothesis. It has been suggested that the positive mixing effect is driven by selection effects independent of species richness, possibly due to the inhibition of competition between some deciduous dominant species and evergreen species [39]. We found a positive relationship between diversity and productivity only prior to canopy closure or in early successional forests, and this relationship declined after canopy closure and in late successional stages [69]. However, in this study, most of the sample sites were mature forests, resulting in a weak relationship between diversity and productivity. Contrary to the findings of Drössler et al. [14], who observed a positive correlation between stand age and mixing effects in stands older than 70 years, this discrepancy may arise from differences in study subjects and regions. We hope that future research can further investigate these factors to gain a more comprehensive understanding of the influence of stand age and mixing effects on FP.

4.3. Relationship between Environmental Factors and Larch Productivity

The structural equation modeling indicated that elevation and soil indirectly affected productivity through SD and maximum DBH (Figure 6). This suggests that tree growth in the study area may not be primarily limited by climate, soil, and elevation conditions alone. In other words, the range of environmental factors may not be sufficient to cause significant changes in forest productivity in the study area. Another study suggests that soil and topography affect stand structure, such as stand density, but not productivity in mature rainforests [70]. Even in subtropical forests with small elevation gradients, elevation indirectly affects above-ground biomass by influencing biotic traits [15].
Factors such as resource availability, climatic conditions, and stand structure can alter the relationship between diversity and productivity [13]. For example, it has been shown that Scots pine and Norway spruce mixed stands are more productive than pure stands [14]. Elevation influences the local climate (e.g., precipitation and temperature) and the soil characteristics, which in turn may affect species distribution and community composition [71] and ultimately determine productivity. Some studies have shown that above-ground biomass in closed canopy types is higher than that in open canopy types, which is caused by the positive correlation between tree density and above-ground biomass. However, varying outcomes have been observed with changes in elevation [72]. These findings indicate that changes in forest productivity can result from intricate interactions between site factors, human disturbances, and also depend on species diversity. Therefore, it is necessary to consider the effects of abiotic variables while studying the effects of biotic variables on productivity.

5. Conclusions

In recent years, the relationship between SD and FP has garnered increased attention, yet the exact connection between SD and FP remains a topic of debate. Our results suggest that functional traits (CWM_LKC) have a significant positive effect on productivity, thus supporting the biomass ratio hypothesis in terms of explaining the species diversity–productivity relationship. Given the substantial impact of CWM_LKC on forest productivity, it is advisable to optimize soil potassium management to ensure that it meets the growth requirements of larch. Stand structure, including stand density and maximum DBH, was found to explain a greater proportion of the variation in productivity compared to SD and environmental factors. Therefore, there should be a focus on increasing stand density and the proportion of large trees appropriately. Environmental factors indirectly affected productivity by influencing SD and stand structure, so the influence of environmental factors on biological factors should be considered when studying the influence of biological factors on productivity. Future studies are expected to further explore the mechanisms influencing forest productivity, considering both biological and abiotic factors. Special emphasis should be placed on analyzing the relationship between larch productivity and factors including species diversity, stand structure, functional traits, and environmental factors. These efforts aim to provide more effective management and protection strategies for larch forest.

Supplementary Materials

The following supporting information can be downloaded at: https://www.mdpi.com/article/10.3390/f15060924/s1, Figure S1. 16 candidate models were screened using full subset regression; Table S1. Nine functional traits related to plant growth and forest productivity and their significance; Table S2. The results of variance inflation factors for larch forests; Table S3. The coefficients of each path in the structural equation model

Author Contributions

Conceptualization, J.Z.; methodology, software, and visualization, J.Z., M.L. and Z.G.; investigation and data curation, J.Z. and R.C.; writing—original draft preparation, J.Z. and C.L.; writing—review and editing, Z.Z. All authors have read and agreed to the published version of the manuscript.

Funding

This work was funded by the State Key Research and Development Program, grant number 2023YFD2200803; the National Natural Science Foundation of China, grant number 32071759; the Natural Science Foundation of Hebei Province, China, grant number C2020204026; the Hebei Province Forest and Grass Science and Technology Demonstration Project, grant number TG [2022]018; and the Hebei Province Key R & D Program of China, grant number 22326803D.

Data Availability Statement

Data are available upon request to the corresponding authors.

Acknowledgments

The authors thank everyone who helped with the field survey and the anonymous reviewers for their valuable comments.

Conflicts of Interest

The authors declare no conflicts of interest.

References

  1. Liang, J.J.; Crowther, T.W.; Picard, N.; Wiser, S.; Zhou, M.; Alberti, G.; Schulze, E.D.; McGuire, A.D.; Bozzato, F.; Pretzsch, H. Positive biodiversity-productivity relationship predominant in global forests. Science 2016, 354, aaf8957. [Google Scholar] [CrossRef] [PubMed]
  2. Yuan, Z.Q.; Ali, A.; Wang, S.P.; Gazol, A.; Freckleton, R.; Wang, X.G.; Lin, F.; Ye, J.; Zhou, L.; Hao, Z.Q. Abiotic and biotic determinants of coarse woody productivity in temperate mixed forests. Sci. Total Environ. 2018, 630, 422–431. [Google Scholar] [CrossRef] [PubMed]
  3. Ouyang, S.; Xiang, W.H.; Wang, X.P.; Xiao, W.F.; Chen, L.; Li, S.G.; Sun, H.; Deng, X.W.; Forrester, D.I.; Zeng, L.X. Effects of stand age, richness and density on productivity in subtropical forests in China. J. Ecol. 2019, 107, 2266–2277. [Google Scholar] [CrossRef]
  4. Zeller, L.; Pretzsch, H. Effect of forest structure on stand productivity in Central European forests depends on developmental stage and tree species diversity. For. Ecol. Manag. 2019, 434, 193–204. [Google Scholar] [CrossRef]
  5. Poorter, L.; van der Sande, M.T.; Thompson, J.; Arets, E.J.; Alarcón, A.; Álvarez-Sánchez, J.; Ascarrunz, N.; Balvanera, P.; Barajas-Guzmán, G.; Boit, A.; et al. Diversity enhances carbon storage in tropical forests. Glob. Ecol. Biogeogr. 2015, 24, 1314–1328. [Google Scholar] [CrossRef]
  6. Brunner, A.; Forrester, D.I. Tree species mixture effects on stem growth vary with stand density–An analysis based on individual tree responses. For. Ecol. Manag. 2020, 473, 118334. [Google Scholar] [CrossRef]
  7. Jucker, T.; Bouriaud, O.; Coomes, D.A. Crown plasticity enables trees to optimize canopy packing in mixed-species forests. Funct. Ecol. 2015, 29, 1078–1086. [Google Scholar] [CrossRef]
  8. Díaz, S.; Lavorel, S.; de Bello, F.; Quétier, F.; Grigulis, K.; Robson, T.M. Incorporating plant functional diversity effects in ecosystem service assessments. Proc. Natl. Acad. Sci. USA 2007, 104, 20684–20689. [Google Scholar] [CrossRef] [PubMed]
  9. Ali, A.; Lin, S.L.; He, J.K.; Kong, F.M.; Yu, J.H.; Jiang, H.S. Climate and soils determine aboveground biomass indirectly via species diversity and stand structural complexity in tropical forests. For. Ecol. Manag. 2019, 432, 823–831. [Google Scholar] [CrossRef]
  10. Stegen, J.C.; Swenson, N.G.; Enquist, B.J.; White, E.P.; Phillips, O.L.; Jørgensen, P.M.; Weiser, M.D.; Mendoza, A.M.; Vargas, P.N. Variation in above-ground forest biomass across broad climatic gradients. Global. Ecol. Biogeogr. 2010, 20, 744–754. [Google Scholar] [CrossRef]
  11. Wu, Z.F.; Fan, C.Y.; Zhang, C.Y.; Zhao, X.H.; von Gadow, K. Effects of biotic and abiotic drivers on the growth rates of individual trees in temperate natural forests. For. Ecol. Manag. 2022, 503, 119769. [Google Scholar] [CrossRef]
  12. Zhang, J.; Zhao, J.M.; Cheng, R.M.; Ge, Z.X.; Zhang, Z.D. Effects of neighborhood competition and stand structure on the productivity of pure and mixed Larix principis-rupprechtii forests. Forests 2022, 13, 1318. [Google Scholar] [CrossRef]
  13. Forrester, D.I.; Bauhus, J. A review of processes behind diversity—Productivity relationships in forests. Curr. For. Rep. 2016, 2, 45–61. [Google Scholar] [CrossRef]
  14. Drössler, L.; Agestam, E.; Bielak, K.; Dudzinska, M.; Koricheva, J.; Liziniewicz, M.; Löf, M.; Mason, B.; Pretzsch, H.; Valkonen, S. Over-and underyielding in time and space in experiments with mixed stands of scots pine and Norway Spruce. Forests 2018, 9, 495. [Google Scholar] [CrossRef]
  15. Ding, Y.; Zang, R.G. Determinants of aboveground biomass in forests across three climatic zones in China. For. Ecol. Manag. 2021, 482, 118805. [Google Scholar] [CrossRef]
  16. Fan, C.Y.; Tan, L.Z.; Zhang, C.Y.; Zhao, X.H.; Gao, L.S.; von Gadow, K. Scale-dependent effects of neighborhood biodiversity on individual tree productivity in a coniferous and broad-leaved mixed forest in China. Ecol. Evol. 2020, 10, 8225–8234. [Google Scholar] [CrossRef] [PubMed]
  17. Tilman, D.; Knops, J.; Wedin, D.; Reich, P.; Ritchie, M.; Siemann, E. The influence of functional diversity and composition on ecosystem processes. Science 1997, 277, 1300–1302. [Google Scholar] [CrossRef]
  18. Grime, J. Benefits of plant diversity to ecosystems: Immediate, filter and founder effects. J. Ecol. 1998, 86, 902–910. [Google Scholar] [CrossRef]
  19. Pretzsch, H.; Bielak, K.; Block, J.; Bruchwald, A.; Dieler, J.; Ehrhart, H.P.; Kohnle, U.; Nagel, J.; Spellmann, H.; Zasada, M. Productivity of mixed versus pure stands of oak (Quercus petraea (Matt.) Liebl.; Quercus robur L.) and European beech (Fagus sylvatica L.) along an ecological gradient. Eur. J. Forest. Res. 2013, 132, 263–280. [Google Scholar] [CrossRef]
  20. Kweon, D.; Comeau, P.G. Relationships between tree survival, stand structure and age in trembling aspen dominated stands. For. Ecol. Manag. 2019, 438, 114–122. [Google Scholar] [CrossRef]
  21. Pretzsch, H.; Biber, P.; Schütze, G.; Uhl, E.; Rötzer, T. Forest stand growth dynamics in Central Europe have accelerated since 1870. Nat. Commun. 2014, 5, 4967. [Google Scholar] [CrossRef]
  22. Campetella, G.; Botta-Dukát, Z.; Wellstein, C.; Canullo, R.; Gatto, S.; Chelli, S.; Mucina, L.; Bartha, S. Patterns of plant trait–environment relationships along a forest succession chronosequence. Agric. Ecosyst. Environ. 2011, 145, 38–48. [Google Scholar] [CrossRef]
  23. Barry, K.E.; Mommer, L.; van Ruijven, J.; Wirth, C.; Wright, A.J.; Bai, Y.; Connolly, J.; De Deyn, G.B.; De Kroon, H.; Isbell, F. The future of complementarity: Disentangling causes from consequences. Trends. Ecol. Evol. 2019, 34, 167–180. [Google Scholar] [CrossRef]
  24. Forrester, D.I.; Ammer, C.; Annighöfer, P.J.; Barbeito, I.; Bielak, K.; Bravo-Oviedo, A.; Coll, L.; del Río, M.; Drössler, L.; Heym, M. Effects of crown architecture and stand structure on light absorption in mixed and monospecific Fagus sylvatica and Pinus sylvestris forests along a productivity and climate gradient through Europe. J. Ecol. 2018, 106, 746–760. [Google Scholar] [CrossRef]
  25. Amoroso, M.; Turnblom, E. Comparing productivity of pure and mixed Douglas-fir and western hemlock plantations in the Pacific Northwest. Can. J. Forest. Res. 2006, 36, 1484–1496. [Google Scholar] [CrossRef]
  26. Bauhus, J.; Van Winden, A.P.; Nicotra, A.B. Aboveground interactions and productivity in mixed-species plantations of Acacia mearnsii and Eucalyptus globulus. Can. J. Forest. Res. 2004, 34, 686–694. [Google Scholar] [CrossRef]
  27. Bourdier, T.; Cordonnier, T.; Kunstler, G.; Piedallu, C.; Lagarrigues, G.; Courbaud, B. Tree size inequality reduces forest productivity: An analysis combining inventory data for ten European species and a light competition model. PLoS ONE 2016, 11, e0151852. [Google Scholar] [CrossRef]
  28. Zhang, Y.; Chen, H.Y. Individual size inequality links forest diversity and above-ground biomass. J. Ecol. 2015, 103, 1245–1252. [Google Scholar] [CrossRef]
  29. Long, J.N.; Shaw, J.D. The influence of compositional and structural diversity on forest productivity. Forestry 2010, 83, 121–128. [Google Scholar] [CrossRef]
  30. Soares, A.A.; Leite, H.G.; Souza, A.L.; Silva, S.R.; Lourenço, H.M.; Forrester, D.I. Increasing stand structural heterogeneity reduces productivity in Brazilian Eucalyptus monoclonal stands. For. Ecol. Manag. 2016, 373, 26–32. [Google Scholar] [CrossRef]
  31. Ali, A.; Yan, E.R. The forest strata-dependent relationship between biodiversity and aboveground biomass within a subtropical forest. For. Ecol. Manag. 2017, 401, 125–134. [Google Scholar] [CrossRef]
  32. Forrester, D.I. Linking forest growth with stand structure: Tree size inequality, tree growth or resource partitioning and the asymmetry of competition. For. Ecol. Manag. 2019, 447, 139–157. [Google Scholar] [CrossRef]
  33. Poorter, L.; van der Sande, M.T.; Arets, E.J.; Ascarrunz, N.; Enquist, B.J.; Finegan, B.; Licona, J.C.; Martínez-Ramos, M.; Mazzei, L.; Meave, J.A. Biodiversity and climate determine the functioning of Neotropical forests. Global. Ecol. Biogeogr. 2017, 26, 1423–1434. [Google Scholar] [CrossRef]
  34. Sundqvist, M.K.; Sanders, N.J.; Wardle, D.A. Community and ecosystem responses to elevational gradients: Processes, mechanisms, and insights for global change. Annu. Rev. Ecol. Evol. Syst. 2013, 44, 261–280. [Google Scholar] [CrossRef]
  35. Xu, A.Y.; Wang, D.Z.; Liu, Q.; Zhang, D.Y.; Zhang, Z.D.; Huang, X.R. Incorporating stand density effects and regression techniques for stem taper modeling of a Larix principis-rupprechtii plantation. Front. Plant. Sci. 2022, 13, 902325. [Google Scholar] [CrossRef]
  36. Duchesne, L.; Houle, D.; Ouimet, R.; Caldwell, L.; Gloor, M.; Brienen, R. Large apparent growth increases in boreal forests inferred from tree-rings are an artefact of sampling biases. Sci. Rep. 2019, 9, 6832. [Google Scholar] [CrossRef] [PubMed]
  37. Holmes, R.L. Computer-assisted quality control in tree-ring dating and measurement. Tree-Ring Bull. 1983, 43, 51–67. [Google Scholar]
  38. Finegan, B.; Peña-Claros, M.; de Oliveira, A.; Ascarrunz, N.; Bret-Harte, M.S.; Carreño-Rocabado, G.; Casanoves, F.; Díaz, S.; Eguiguren Velepucha, P.; Fernandez, F. Does functional trait diversity predict above-ground biomass and productivity of tropical forests? Testing three alternative hypotheses. J. Ecol. 2015, 103, 191–201. [Google Scholar] [CrossRef]
  39. Tobner, C.M.; Paquette, A.; Gravel, D.; Reich, P.B.; Williams, L.J.; Messier, C. Functional identity is the main driver of diversity effects in young tree communities. Ecol. Lett. 2016, 19, 638–647. [Google Scholar] [CrossRef]
  40. van der Sande, M.T.; Peña-Claros, M.; Ascarrunz, N.; Arets, E.J.; Licona, J.C.; Toledo, M.; Poorter, L. Abiotic and biotic drivers of biomass change in a Neotropical forest. J. Ecol. 2017, 105, 1223–1234. [Google Scholar] [CrossRef]
  41. Perez-Harguindeguy, N.; Diaz, S.; Garnier, E.; Lavorel, S.; Poorter, H.; Jaureguiberry, P.; Bret-Harte, M.; Cornwell, W.; Craine, J.; Gurvich, D. New handbook for standardised measurement of plant functional traits worldwide. Aust. Bot. 2013, 61, 167–234. [Google Scholar] [CrossRef]
  42. Luo, Y.; Li, D. Flora of China. J. Plant. Classif. Resour. 2013, 35, 742. [Google Scholar]
  43. Chen, L.; Xiang, W.H.; Ouyang, S.; Wu, H.L.; Xia, Q.; Ma, J.N.; Zeng, Y.L.; Lei, P.F.; Xiao, W.F.; Li, S.G. Tight coupling of fungal community composition with soil quality in a Chinese fir plantation chronosequence. Land Degrad. Dev. 2021, 32, 1164–1178. [Google Scholar] [CrossRef]
  44. Jiang, Y.; Zang, R.G.; Lu, X.H.; Huang, Y.F.; Ding, Y.; Liu, W.D.; Long, W.X.; Zhang, J.Y.; Zhang, Z.D. Effects of soil and microclimatic conditions on the community-level plant functional traits across different tropical forest types. Plant Soil 2015, 390, 351–367. [Google Scholar] [CrossRef]
  45. Marqués, L.; Camarero, J.J.; Zavala, M.A.; Stoffel, M.; Ballesteros-Cánovas, J.A.; Sancho-García, C.; Madrigal-González, J. Evaluating tree-to-tree competition during stand development in a relict Scots pine forest: How much does climate matter? Trees 2021, 35, 1207–1219. [Google Scholar] [CrossRef]
  46. Weiner, J.; Solbrig, O.T. The meaning and measurement of size hierarchies in plant populations. Oecologia 1984, 61, 334–336. [Google Scholar] [CrossRef] [PubMed]
  47. Binkley, D.; Kashian, D.M.; Boyden, S.; Kaye, M.W.; Bradford, J.B.; Arthur, M.A.; Fornwalt, P.J.; Ryan, M.G. Patterns of growth dominance in forests of the Rocky Mountains, USA. For. Ecol. Manag. 2006, 236, 193–201. [Google Scholar] [CrossRef]
  48. Lexerød, N.L.; Eid, T. An evaluation of different diameter diversity indices based on criteria related to forest management planning. For. Ecol. Manage. 2006, 222, 17–28. [Google Scholar] [CrossRef]
  49. R Core Team. R: A Language and Environment for Statistical Computing; R Foundation for Statistical Computing: Vienna, Austria, 2021. [Google Scholar]
  50. Laliberté, E.; Legendre, P. A distance-based framework for measuring functional diversity from multiple traits. Ecology 2010, 91, 299–305. [Google Scholar] [CrossRef]
  51. Van der Plas, F.; Schröder-Georgi, T.; Weigelt, A.; Barry, K.; Meyer, S.; Alzate, A.; Barnard, R.L.; Buchmann, N.; De Kroon, H.; Ebeling, A. Plant traits alone are poor predictors of ecosystem properties and long-term ecosystem functioning. Nat. Ecol. Evol. 2020, 4, 1602–1611. [Google Scholar] [CrossRef]
  52. Bongers, F.J.; Schmid, B.; Bruelheide, H.; Bongers, F.; Li, S.; von Oheimb, G.; Li, Y.; Cheng, A.; Ma, K.; Liu, X. Functional diversity effects on productivity increase with age in a forest biodiversity experiment. Nat. Ecol. Evol. 2021, 5, 1594–1603. [Google Scholar] [CrossRef] [PubMed]
  53. Wang, T.L.; Wang, G.Y.; Innes, J.L.; Seely, B.; Chen, B.Z. ClimateAP: An application for dynamic local downscaling of historical and future climate data in Asia Pacific. Front. Agric. Sci. Eng. 2017, 4, 448–458. [Google Scholar] [CrossRef]
  54. Lefcheck, J.S. piecewiseSEM: Piecewise structural equation modelling in r for ecology, evolution, and systematics. Methods. Ecol. Evol. 2016, 7, 573–579. [Google Scholar] [CrossRef]
  55. Egbert, J.; Plonsky, L. Bootstrapping techniques. A Practical Handbook of Corpus Linguistics; Springer International Publishing: Cham, Switzerland, 2021; pp. 593–610. [Google Scholar]
  56. Jucker, T.; Sanchez, A.C.; Lindsell, J.A.; Allen, H.D.; Amable, G.S.; Coomes, D.A. Drivers of aboveground wood production in a lowland tropical forest of West Africa: Teasing apart the roles of tree density, tree diversity, soil phosphorus, and historical logging. Ecol. Evol. 2016, 6, 4004–4017. [Google Scholar] [CrossRef] [PubMed]
  57. Yachi, S.; Loreau, M. Does complementary resource use enhance ecosystem functioning? A model of light competition in plant communities. Ecol. Lett. 2007, 10, 54–62. [Google Scholar] [CrossRef] [PubMed]
  58. Dong, X.T.; Zhang, J.; Zhang, Z.D.; Huang, X.R. Effects of tree species interaction, stand density, and tree size on the productivity of Larix principis-rupprechtii. Chin. J. Appl. Ecol. 2021, 32, 2722–2728. [Google Scholar]
  59. Garber, S.M.; Maguire, D.A. Stand productivity and development in two mixed-species spacing trials in the central Oregon cascades. Forest Sci. 2004, 50, 92–105. [Google Scholar] [CrossRef]
  60. Bordin, K.M.; Esquivel-Muelbert, A.; Bergamin, R.S.; Klipel, J.; Picolotto, R.C.; Frangipani, M.A.; Zanini, K.J.; Cianciaruso, M.V.; Jarenkow, J.A.; Jurinitz, C.F. Climate and large-sized trees, but not diversity, drive above-ground biomass in subtropical forests. For. Ecol. Manag. 2021, 490, 119126. [Google Scholar] [CrossRef]
  61. Silva Pedro, M.; Rammer, W.; Seidl, R. Disentangling the effects of compositional and structural diversity on forest productivity. J. Veg. Sci. 2017, 28, 649–658. [Google Scholar] [CrossRef]
  62. Ligot, G.; Gourlet-Fleury, S.; Ouédraogo, D.Y.; Morin, X.; Bauwens, S.; Baya, F.; Brostaux, Y.; Doucet, J.L.; Fayolle, A. The limited contribution of large trees to annual biomass production in an old-growth tropical forest. Ecol. Appl. 2018, 28, 1273–1281. [Google Scholar] [CrossRef]
  63. Li, J.J.; Chen, D.S.; Yang, X.; Fan, N.Q.; Wang, Y.W.; Zhang, Z.D. Effects of stand density, age, and drought on the size–growth relationship in Larix principis-rupprechtii forests. Forests 2024, 15, 413. [Google Scholar] [CrossRef]
  64. Michel, L.; Andy, H. Partitioning selection and complementarity in biodiversity experiments. Nature 2001, 412, 72–76. [Google Scholar]
  65. Conti, G.; Díaz, S. Plant functional diversity and carbon storage–an empirical test in semi-arid forest ecosystems. J. Ecol. 2013, 101, 18–28. [Google Scholar] [CrossRef]
  66. Su, L.; Heydari, M.; Omidipour, R.; Soheili, F.; Cheraghi, J.; Villa, P.M.; Prévosto, B. Stand structural diversity and elevation rather than functional diversity drive aboveground biomass in historically disturbed semiarid oak forests. For. Ecol. Manag. 2023, 543, 121139. [Google Scholar] [CrossRef]
  67. Larsary, M.K.; Pourbabaei, H.; Salehi, A.; Yousefpour, R.; Ali, A. Few functionally acquisitive big-sized trees restrict but soil nutrients promote soil organic carbon storage in temperate deciduous forests. For. Ecol. Manag. 2023, 541, 121059. [Google Scholar] [CrossRef]
  68. Chun, J.H.; Ali, A.; Lee, C.B. Topography and forest diversity facets regulate overstory and understory aboveground biomass in a temperate forest of South Korea. Sci. Total Environ. 2020, 744, 140783. [Google Scholar] [CrossRef] [PubMed]
  69. Guo, Q.F.; Ren, H. Productivity as related to diversity and age in planted versus natural forests. Glob. Ecol. Biogeogr. 2014, 23, 1461–1471. [Google Scholar] [CrossRef]
  70. Clark, D.B.; Clark, D.A. Landscape-scale variation in forest structure and biomass in a tropical rain forest. For. Ecol. Manag. 2000, 137, 185–198. [Google Scholar] [CrossRef]
  71. Sullivan, M.J.; Talbot, J.; Lewis, S.L.; Phillips, O.L.; Qie, L.; Begne, S.K.; Chave, J.; Cuni-Sanchez, A.; Hubau, W.; Lopez-Gonzalez, G. Diversity and carbon storage across the tropical forest biome. Sci. Rep. 2017, 7, 39102. [Google Scholar] [CrossRef]
  72. Khadanga, S.S.; Jayakumar, S. Tree biomass and carbon stock: Understanding the role of species richness, elevation, and disturbance. Trop. Ecol. 2020, 61, 128–141. [Google Scholar] [CrossRef]
Figure 1. The spatial distribution of the sampling plots across North China.
Forests 15 00924 g001
Figure 2. The Pearson correlation coefficients (r) among variables within the larch forests in Hebei and Shanxi Provinces, China. Note: BAI, basal area increment; MAT, mean annual temperature; MAP, mean annual precipitation; TN, total nitrogen; TP, total phosphorus; TK, total potassium; AP, available phosphorus; AK, available potassium; GCba, Gini coefficient of basal area; MDBH, maximum diameter at breast height; S, species richness; FEve, functional evenness index; FDis, functional dispersion index; RaoQ, Rao’s quadratic entropy index; CWM, the trait community-weighted mean; WD, wood density; MH, maximum tree height; LA, leaf area; SLA, specific leaf area; LDMC, leaf dry matter content; LCC, leaf carbon content; LNC, leaf nitrogen content; LPC, leaf phosphorous content; LKC, leaf potassium content.
Forests 15 00924 g002
Figure 3. Structural equation models (SEMs) and the a priori conceptual framework for the effect of environmental variables (soil and elevation) and biotic variables (functional composition, SD, stand density, and maximum DBH) on the BAI.
Forests 15 00924 g003
Figure 4. Bivariate relationships between the BAI (log-transformed) and stand structure [(a) stand density, (b) maximum diameter at breast height (DBH), (c) Gini coefficient, and (d) stand age]; SD [(e) richness]; (f) community-weighted mean trait value of leaf carbon content (CWM_LCC); (g) community-weighted mean trait value of leaf phosphorus content (CWM_LPC); and (h) leaf potassium content (CWM_LKC).
Forests 15 00924 g004
Figure 5. (a) Variance contribution rates of elevation, richness, TN, stand density, maximum DBH, CWM_LCC, and CWM_LKC to the BAI of larch, and (b) the relative contributions of the environment, stand structure, SD, and functional composition. *** (p < 0.001).
Forests 15 00924 g005
Figure 6. Structural equation model explaining the BAI of Larix principis-rupprechtii Mayr forests in North China. Here, we show the effects of soil total phosphorus (TP), elevation, functional composition (CWM_LKC), SD, stand density, and maximum DBH on the BAI of temperate forests. The solid lines indicate significant (p < 0.05) effects. The gray dashed lines indicate nonsignificant (p > 0.1) effects. *, p < 0.05; **, p < 0.01; *** p < 0.001.
Forests 15 00924 g006
Table 1. Basic conditions of sampling plots.
VariablePure Larch ForestsMixed Larch Forests
MinMaxMeanSDMinMaxMeanSD
Age (year)10.0076.0032.0719.2332.0088.0053.3316.88
DBH (cm)8.5333.9817.828.0312.7838.7620.395.46
dq (cm)8.8032.5018.157.8313.6031.5022.234.69
Elevation (m)148222821736.73253.70149122241797.25238.68
BAI (m2/ha/year)0.511.600.990.360.211.130.720.22
Larch proportion 0.200.800.480.20
SR 2.005.002.960.81
No. plots1623
Age, stand age; DBH, diameter at breast height; dq, quadratic mean diameter; BAI, basal area increment; larch proportion, the proportion of larch basal area to the total stand basal area. SR, species richness.
Table 2. An overview of the most effective multiple regression model, employing ordinary least squares (OLS), to assess the impact of environmental (elevation and TN), stand structure (stand density and maximum DBH), and species diversity factors on FP. * (p < 0.05); *** (p < 0.001).
VariableEstimateSEt-Valuep-ValueSig.
Intercept3.910.02267.99<0.001***
Elevation–0.030.02–1.290.21
TN0.020.021.360.19
Richness–0.020.02–1.190.24
Density (trees/ha)0.130.02–1.19<0.001***
Maximum DBH0.050.032.090.04*
CWM_LCC0.040.021.980.06
CWM_LKC0.050.023.51<0.01***
Disclaimer/Publisher’s Note: The statements, opinions and data contained in all publications are solely those of the individual author(s) and contributor(s) and not of MDPI and/or the editor(s). MDPI and/or the editor(s) disclaim responsibility for any injury to people or property resulting from any ideas, methods, instructions or products referred to in the content.

