Article

Utilizing Multi-Source Data and Cloud Computing Platform to Map Short-Rotation Eucalyptus Plantations Distribution and Stand Age in Hainan Island

by
Xiong Yin
1,
Mingshi Li
1,*,
Hongyan Lai
2,
Weili Kou
3,
Yue Chen
4 and
Bangqian Chen
2,*
1
Co-Innovation Center for Sustainable Forestry in Southern China, Nanjing Forestry University, Nanjing 210037, China
2
Rubber Research Institute (RRI), Chinese Academy of Tropical Agricultural Sciences (CATAS), Hainan Danzhou Agro-Ecosystem National Observation and Research Station, State Key Laboratory Incubation Base for Cultivation & Physiology of Tropical Crops, Haikou 571101, China
3
College of Big Data and Intelligence Engineering, Southwest Forestry University, Kunming 650224, China
4
College of Forestry, Southwest Forestry University, Kunming 650224, China
*
Authors to whom correspondence should be addressed.
Forests 2024, 15(6), 925; https://doi.org/10.3390/f15060925
Submission received: 7 May 2024 / Revised: 20 May 2024 / Accepted: 22 May 2024 / Published: 26 May 2024
(This article belongs to the Special Issue Forest Ecosystem Services: Modelling, Mapping and Valuing)

Abstract

:
Short-rotation eucalyptus plantations play a key positive role in the forestry economy due to their fast-growing and high-yielding properties. However, some studies have suggested that eucalyptus plantations introductions may have negative impacts on biodiversity and ecosystems’ stability. In order to precisely and promptly determine the influence of eucalyptus plantations on soil characteristics and hydrological processes, based on the rotation change rules of eucalyptus plantations, this study combined the continuous change detection and classification and spectral mixture analysis (CCDC-SMA) algorithm and the random forest (RF) algorithm to map the distribution and stand age of short-rotation eucalyptus plantations in Hainan Island. First, the forest distribution map was used to mask out the rubber plantations, and forest disturbances were extracted through the CCDC-SMA algorithm to determine the potential short-rotation eucalyptus plantations distribution. Second, using CCDC-SMA algorithm fitting coefficients, field surveys, original spectral bands, vegetation indices, and digital elevation models (DEM) as inputs to the RF algorithm, short-rotation eucalyptus plantations distribution maps were created and evaluated based on Google Earth images. Finally, the stand age of the newly mapped short-rotation eucalyptus plantations was estimated based on the breakpoints of the CCDC-SMA algorithm. The results showed that the producer, user, and overall accuracies of the 2022 short-rotation eucalyptus plantations map were estimated at 0.95, 0.95, and 0.94, respectively, and the validation R2 of the estimated stand ages was at 0.97. The eucalyptus plantations in Hainan Island had a total area of roughly 9.93 × 10⁴ ha in 2022. Danzhou City had the highest planting area of eucalyptus plantations, followed by Changjiang County, Chengmai County, and Lingao County. It was worth noting that the eucalyptus plantations were mostly located in places with low altitudes (<200 m) and flat slopes (<10°). Approximately 43.91% of eucalyptus plantations were located in the three major watersheds. In addition, the 1-year-old eucalyptus plantations accounted for the highest areal percentage of 30.58%. These datasets are valuable tools to aid sustainable production, ecological assessment, and conservation of eucalyptus plantations.

1. Introduction

Eucalyptus (Eucalyptus spp.) is a significant tree species planted in numerous countries [1]. In pursuit of forestry economic development, eucalyptus has emerged as a prominent tree species for planting in high-yielding, fast-growing forests in southern China, owing to its adaptability to a diverse array of environmental conditions, ecological advantages, and substantial economic value. On one hand, eucalyptus plantations provide wood for uses such as construction, furniture, and paper production. On the other hand, eucalyptus oil extracted from the leaves can be used as a food supplement, industrial solvent, antiseptic, and mosquito repellent [1,2]. However, several researchers contend that the potential adverse environmental effects of eucalyptus plantations are primarily attributed to their short rotation period, high water consumption characteristics, and the loss of biodiversity that occurs when natural forests are converted into plantations [1,3]. In addition, structural parameters such as stand age play a crucial role in determining appropriate forest management practices, including undergrowth clearing, fertilization, thinning, and even harvesting, all of which are highly dependent on the plantation’s stand age [4,5]. Therefore, accurately and timely acquiring information on the distribution and age of short-rotation eucalyptus plantations is crucial for developing targeted forestry planning, management, and ecological restoration actions.
Field surveys are the traditional method to obtain information on the distribution and stand age of short-rotation eucalyptus plantations, which collect in situ accurate and diverse data by making comprehensive observations at a specific location or area [6]. However, due to the high renewal frequency and short-rotation characteristics, field surveys of eucalyptus plantations are high in time and labor costs, low in efficiency, and have limited accessibility, and are therefore especially difficult to implement in wide forest areas. In comparison, remote sensing technology, boasting its broad coverage, swift access to information across the plantations, and the capability for regular updates, offers an effective alternative to facilitate real-time or periodic monitoring and evaluation [7,8].
In terms of spatial information extraction of plantations, many scholars used the obvious phenological characteristics or spectral characteristics of specific tree species derived from remotely sensed images. For example, rubber plantations have a defoliation season that lasts two months out of the year [9,10,11], while mangroves are regularly flooded by aquatic environments [12,13,14], making these tree species relatively easy to identify. However, for eucalyptus plantations, the lack of obvious phenological or distinctive spectral characteristics makes their accurate identification difficult [1]. Zhang et al. developed a knowledge-based approach to map the distribution of eucalyptus plantations in Guangxi, China, at a spatial resolution of 10 m [2]. Deng et al. produced a map of eucalyptus plantations in Guangxi in 2018 using time series segmentation and statistical hypothesis testing [1]. The knowledge-based approach is more suitable for eucalyptus plantations that are large-scale and significantly different from other plantations. In contrast, due to the short growth period and rapid renewal of short-rotation eucalyptus plantations, time series analysis is a more suitable approach for monitoring eucalyptus plantations. However, short time series analysis may lead to an underestimation of the actual size of eucalyptus plantations due to the short period of monitoring. Therefore, long time series analysis based on remote sensing is regarded as a potent approach to monitoring periodic variations in eucalyptus plantations. In addition, the long time series analysis algorithm is able to estimate the stand age of those promptly regenerated eucalyptus plantations following disturbances.
Long time series analysis algorithms, which utilize multi-temporal satellite data to identify change points or trends in a time series, are one of the most extensively used methods for precisely detecting long-term changes in forests [15]. Several renowned methods, such as breaks for additive season and trend (BFAST) [16], Landsat-based disturbance and trend recovery (LandTrendr) [17], and continuous change detection and classification algorithms (CCDC) [18], have been widely used to monitor forest changes at the pixel scale. BFAST primarily processes and analyzes seasonal and trend changes in time series data, while LandTrendr focuses on identifying surface cover changes such as disturbance and recovery processes. However, when faced with eucalyptus plantations that need to be continuously monitored and accurately capture changes over a short period of time, the CCDC algorithm is more suitable for detection. By detecting continuous changes in time series data, the CCDC algorithm can effectively capture subtle changes in the short-rotation eucalyptus plantations rotation period, including growth, withering, and regeneration stages, and provides more detailed information for understanding the dynamics of short-rotation eucalyptus plantations. Furthermore, the CCDC algorithm based on all available Landsat images can detect gradual changes, sudden changes, and seasonal changes in forests, and its change detection results are more comprehensive than using only annual composite images [2,19]. In addition, spectral mixture analysis (SMA) can provide proportional information on different ground objects in each pixel, making the classification of ground objects more detailed [20,21,22]. Combined with the CCDC algorithm, this fine feature information can be fully utilized to more accurately identify and monitor short-rotation eucalyptus plantations [20,22,23]. This combined approach also allows more precise inferences about the spatial distribution of short-rotation eucalyptus plantations at different stand ages.
Maximum likelihood [24], support vector machine [25], decision tree [26], neural network [27], deep learning [28], and random forest (RF) methods [29] are often used in studies of mapping tree species. A great deal of investigations have also been devoted to the comparative analysis of various classifiers with a special focus on their strengths and weaknesses [30,31,32]. However, there is no consistent conclusion about the classification performance. This could be attributed, in part, to the utilization of diverse evaluation metrics for evaluating the effectiveness of classifiers, including classification accuracy and classifier robustness. Notably, RF has become a widely adopted classifier because of its advantages including possessing superior classification accuracy, handling high-dimensional data, and exhibiting robustness to outliers and noise [29,33,34,35]. A review by Fassnacht et al. suggests that if the dataset and variables adequately match the requirements of the classified object, the choice of classifier is relatively unimportant [36]. Therefore, it is more important to focus on the relationship between key features and a particular tree species to be classified than on classifier selection.
Hainan Island is one of China’s primary tropical areas. Hainan Island possesses extensive tracts of tropical forests, and significant alterations in both size and composition have been witnessed in the forests during recent decades [37,38,39]. Between the mid and late 1990s, the area of eucalyptus plantations increased rapidly under the government’s promotion [40]. However, there have been limited reports regarding the stand age and distribution of short-rotation eucalyptus plantations on an island scale in Hainan Province. Furthermore, the implementation of management practices, including frequent felling and post-harvest regeneration, in short-rotation eucalyptus plantations, has resulted in a multitude of ecological and environmental complications that have disrupted the equilibrium of the initial ecosystem. For ecosystem protection, research, and decision-making, a timely and comprehensive comprehension of the spatial distribution and age of short-rotation eucalyptus plantations is crucial. The main aims of this study were the following: 1) based on the time characteristics of rapid growth and rotation of eucalyptus plantations, to use the CCDC-SMA algorithm and RF algorithm to extract short-rotation eucalyptus plantations; and 2) to analyze the spatial characteristics of short-rotation eucalyptus plantations in Hainan Island and changes in stand age characteristics.

2. Materials and Methods
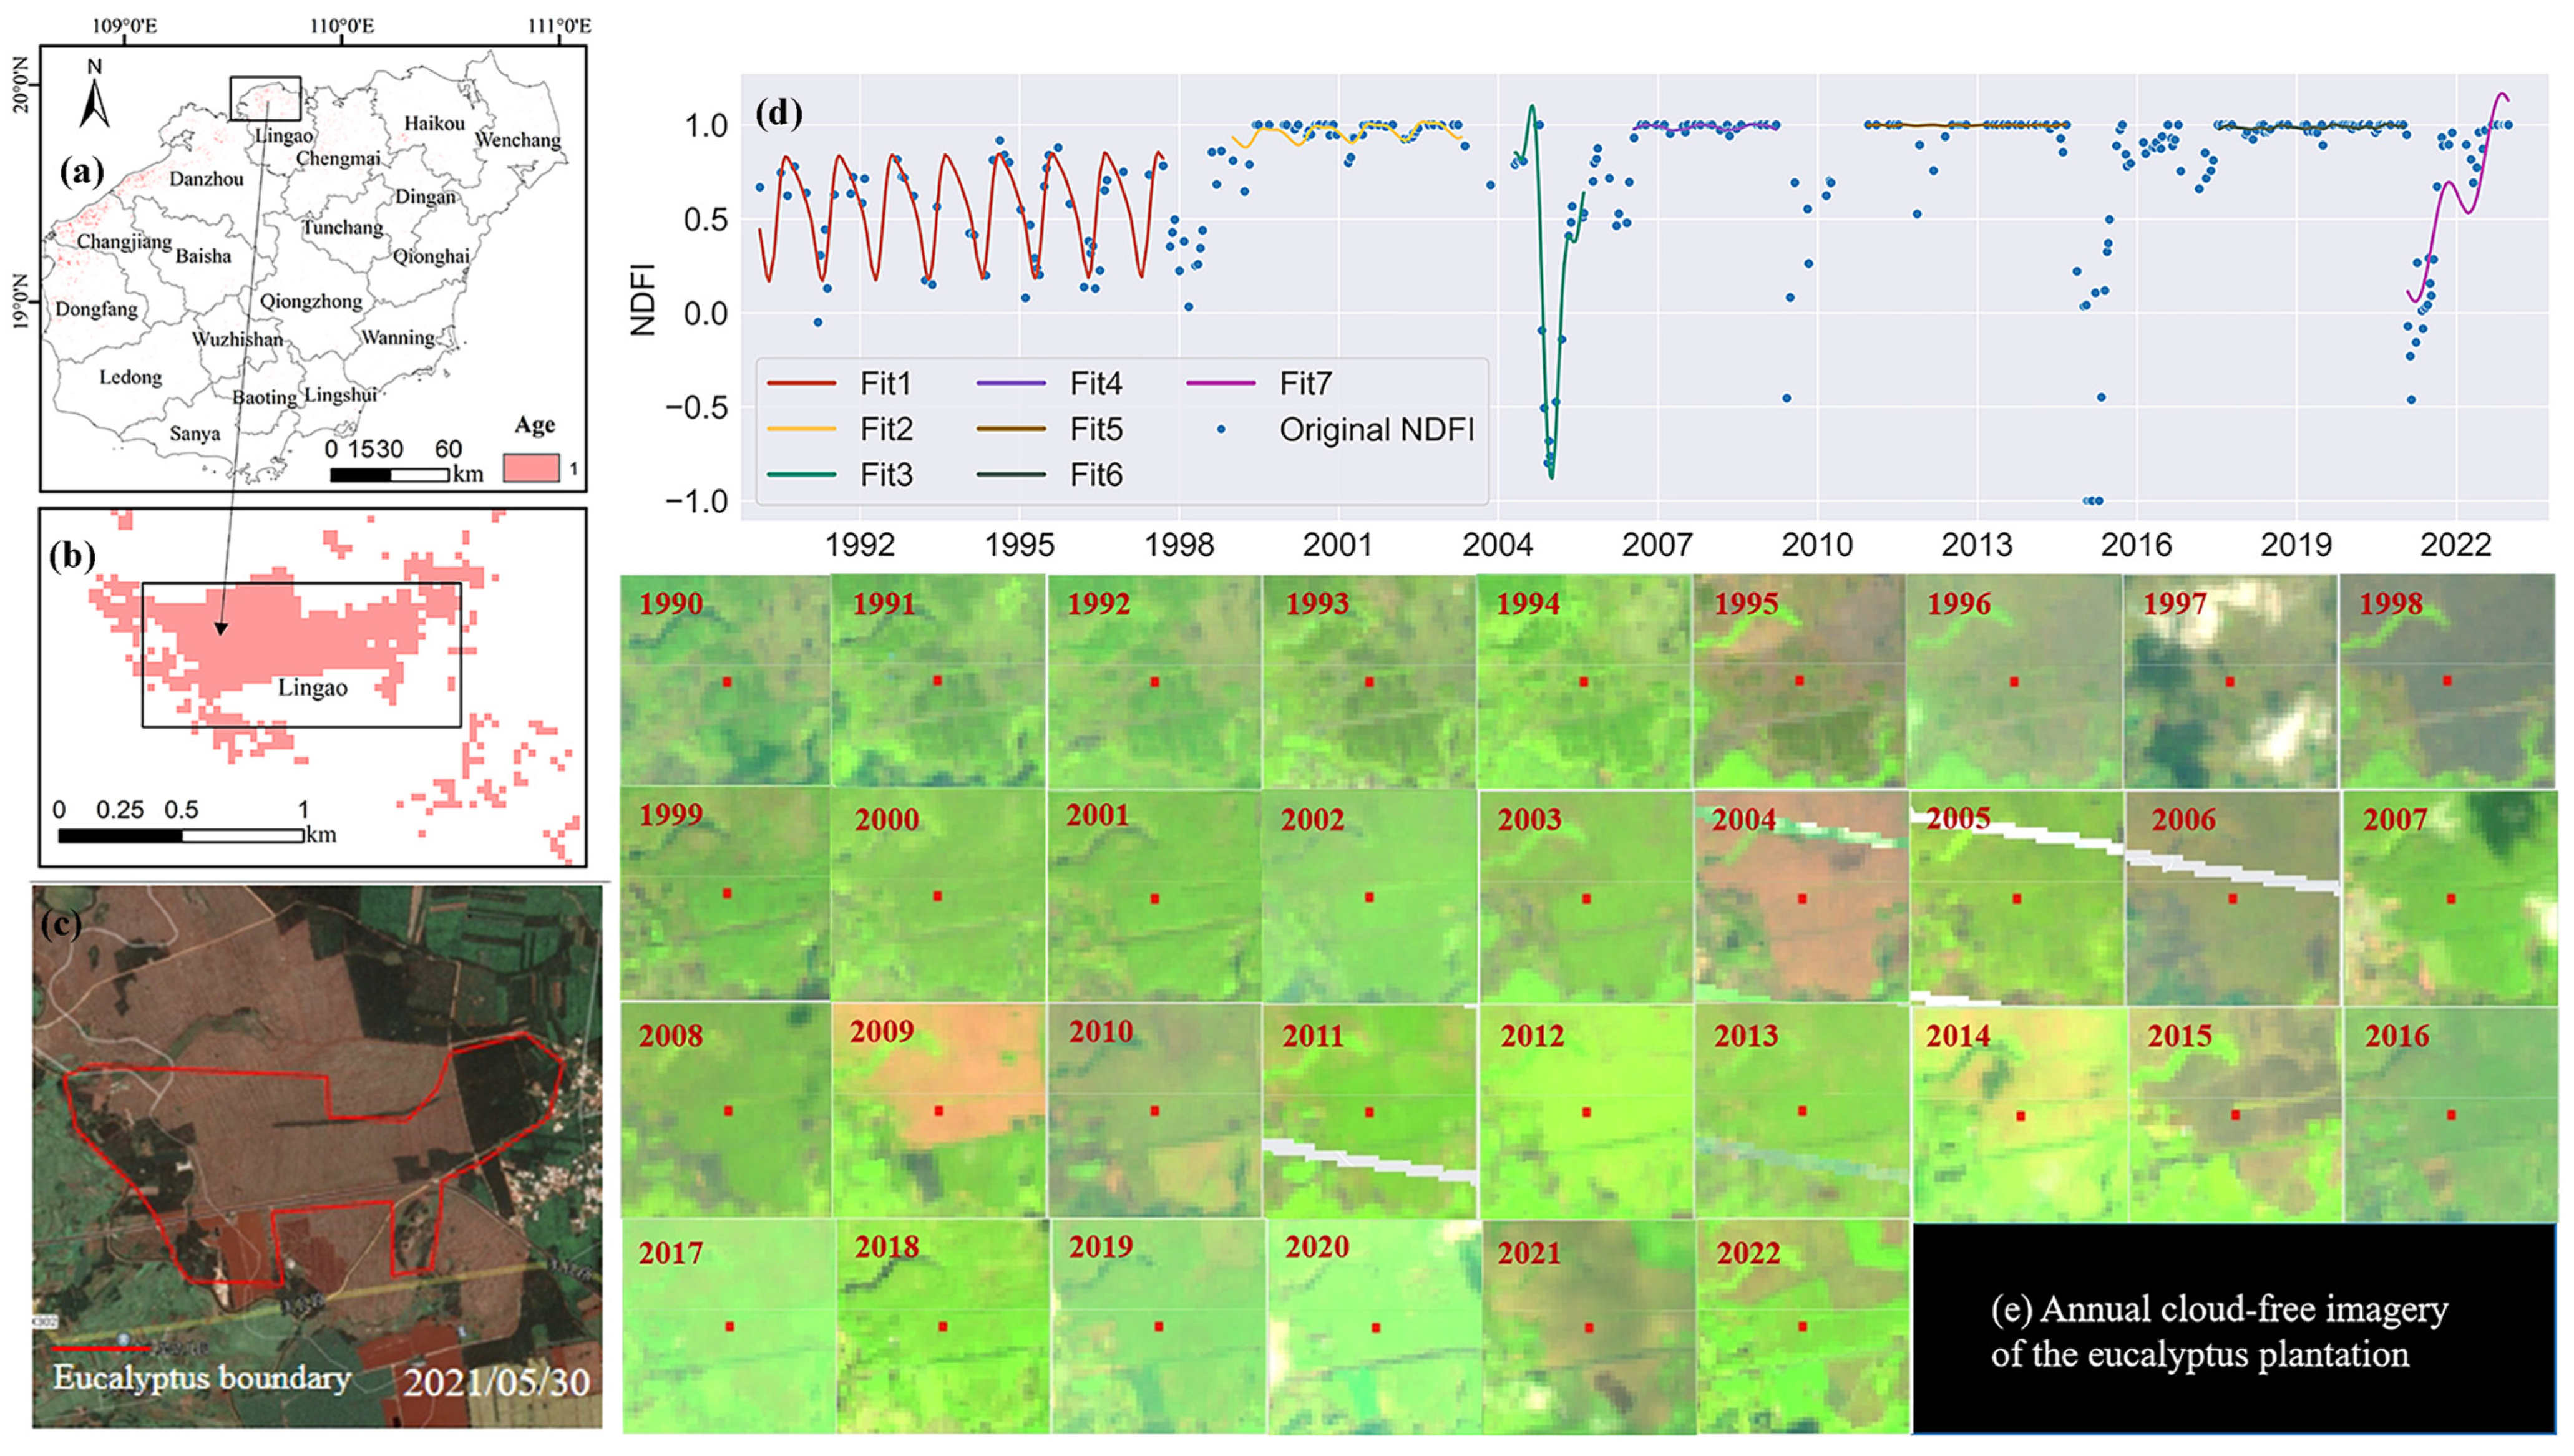
2.1. Study Area

Hainan Island (18°10′–20°10′ N, 108°37′–111°03′ E) is located in Southern China and holds the distinction of being the second biggest island in China. Hainan Island is the primary component of Hainan Province, which consists of 18 cities and counties, encompassing an approximate land area of 3.54 × 10⁴ km2 (Figure 1). Hainan Island exhibits a predominantly flat terrain in all directions, although with elevated landforms at its center. It boasts a total coastline stretching over 1823 km. The island experiences a tropical monsoon climate, with an average temperature throughout the year ranging from between 22 and 27 and an annual rainfall between 923 mm and 2459 mm [41]. Rubber (Hevea brasiliensis) tree, eucalyptus, Acacia mangium, and Casuarina equisetifolia are the predominant plantation forest species on Hainan Island. Eucalyptus plantations began to be planted in large quantities in the 1990s and have now become the most dominant tree species in artificial afforestation on Hainan Island. Eucalyptus plantations are managed by both farmers and state-owned forestry enterprises, resulting in a wide range of sizes for the eucalyptus stands, ranging from a few hectares to hundreds of hectares.

2.2. Datasets

2.2.1. Satellite Imagery and Corresponding Derivatives

We used all Landsat Collection 2 surface reflectance images covering Hainan Island including Landsat 5 TM, Landsat 7 ETM+, Landsat 8 OLI, and Landsat 9 OLI-2 were compiled from the Google Earth Engine (GEE) cloud platform. As a result, a total of 4932 images spanning from 1 January 1990 to 31 December 2022 were collected. Each of the images contains 4 visible and near-infrared bands and 2 short-wave infrared bands, which have been atmospherically and geometrically corrected by the USGS EROS Data Center. The Landsat images stored in the GEE platform are high-quality, and their spectral consistencies among several sensors are maintained [42,43]. Therefore, there was no requirement for us to carry out any extra pre-processing tasks [44,45]. The bitmask information provided by the C Function mask (CFMask) algorithm was utilized to mask the clouds and shadows in the images for the respective quality assessment bands [46,47]. Based on these preprocessed images, the Normalized Difference Vegetation Index (NDVI), Normalized Burn Ratio (NBR), Enhanced Vegetation Index (EVI), Normalized Difference Water Index (NDWI), and Green Normalized Difference Vegetation Index (GNDVI) were then derived to support subsequent identification of eucalyptus plantations. The specific calculation formulas of these vegetation indices were as follows:
NDVI = ρ N I R ρ r e d ρ N I R + ρ r e d
NBR = ρ N I R ρ S W I R ρ N I R + ρ S W I R
EVI = 2.5 × ( ρ N I R ρ r e d ) ( ρ N I R + 6 × ρ red 7.5 × ρ b l u e + 1 )
NDWI = ρ green ρ N I R ρ g r e e n + ρ N I R
GNDVI = ρ N I R ρ g r e e n ρ N I R + ρ g r e e n
where NIR, red, SWIR, green, and blue are the surface reflectance values in the near-infrared, red, and short-wave infrared bands of the Landsat imagery.

2.2.2. Forest Distribution Data and Rubber Plantations Distribution Data

This study utilized the Dynamic World data from the GEE as the source of forest distribution data. This data, created by Brown et al. is a globally consistent, high-resolution, near real-time (NRT) land cover product produced from using the 10 m Sentinel-2 imagery and semi-supervised deep learning methods [48]. In order to make forest distribution data more accurate, we chose forest pixel frequency greater than 60% in the Dynamic World data as real forest to facilitate subsequent analysis.
The rubber plantations distribution data came from our team’s previous research results. Chen et al. used the Land Surface Water Index (LSWI) minimum and mean annual images from 1987 to 2015 to synthesize all Landsat images for the corresponding year’s growing season, respectively, to map the distribution of rubber plantations on Hainan Island in 2015 [49]. And it has a good level of accuracy (R2 = 0.85, RMSE = 2.34 years). The 2022 map of rubber plantations distribution on Hainan Island was generated using identical techniques and thresholds.

2.2.3. Ground Reference Data and Auxiliary Data

We collected eucalyptus plantations samples from three sources. First, we obtained field photographs and KML files containing the geographical coordinates of Hainan Island, China, from the Global Georeferenced Field Photo Library (https://www.ceom.ou.edu/photos/, accessed on 5 January 2024) and compared them with Google Earth Geolink collected samples from eucalyptus plantations. Second, we conducted field surveys in April 2023 on Hainan Island eucalyptus plantations and recorded their ages, locations, and other land cover categories. We selected image pixels of pure areas and recorded the coordinates of all sample points and the corresponding eucalyptus plantations stand age in detail. Third, we visually interpreted the results produced by our models and dynamically labeled correct and incorrect classifications. Finally, we collected 504 eucalyptus plantations and 378 non-eucalyptus plantations (excluding rubber plantations) (Figure 1).
The administrative division vector data was collected from the National Geomatics Center of China (www.ngcc.cn, accessed on 5 January 2024). The river basin vector data came from OpenStreetMap (www.openstreetmap.org, accessed on 5 January 2024). The terrain data utilized were sourced from the Shuttle Radar Topography Mission (SRTM) digital elevation data (roughly a 30 m spatial resolution). The data was given by the National Aeronautics and Space Administration (NASA) Jet Propulsion Laboratory (JPL) [50].

2.3. Methods

The primary procedure of this study included four stages (Figure 2): (1) Collection of Landsat surface reflectance dataset, spectral mixing analysis of spectral bands and endmembers, and cloud removal and calculation of vegetation indices. (2) Using the distribution map of forest and rubber plantation to exclude rubber plantations to obtain the distribution map of non-rubber plantations (i.e., the potential area of short-rotation eucalyptus plantations, and non-forest areas were excluded). (3) Using the CCDC-SMA algorithm, the fitting coefficients were obtained through pixel-scale time segmentation and segmentation fitting, and combined with the RF algorithm to classify short-rotation eucalyptus plantations and non-eucalyptus plantations and verify its accuracy. (4) Using the breakpoints of the CCDC-SMA algorithm to determine the age of short-rotation eucalyptus plantations, and verifying its accuracy. (5) Based on the administrative units (cities and counties) and relative area of terrain, the spatial distribution of short-rotation eucalyptus plantations was analyzed; we analyzed the stand age characteristics of short-rotation eucalyptus plantations according to the determined stand ages. In addition, different buffer zones (1 km, 2 km, 3 km, and beyond 3 km with overlapping buffer zones) were set up to explore in depth the distribution of short-rotation eucalyptus plantations in different river buffer zones.

2.3.1. CCDC-SMA

CCDC-SMA developed by Chen et al. combines continuous change detection and classification (CCDC) and spectral mixture analysis (SMA) [23]. CCDC-SMA uses Normalized Difference Fraction Index (NDFI) and endmember fraction instead of raw spectral bands to detect breakpoints [51]. The observation data were first obtained by removing clouds using the QA (Quality Assessment) band of Landsat data. Then, they were coupled with the endmember fraction for spectral mixing analysis, and the NDFI was calculated. Next, the NDFI was used as an input to the CCDC algorithm in GEE to find breakpoints. In the CCDC algorithm, the harmonic model was used to fit and predict the NDFI for any time period based on the pixel scale. After a certain number of consecutive observations (here, we set it to 5), the point was recognized as a breakpoint when the model fit prediction was significantly different (greater than three times of RMSE) from the actual observation. After a break, a new model (temporal segment) was initiated again. This process was repeated for the whole time series [18]. Each segment contained three types of coefficients: harmonic model fitting coefficients (the 1st, 2nd, and 3rd sine and cosine terms, the slope, and the intercept), spectral phase coefficients (1st, 2nd, and 3rd amplitudes, phase, and the root mean square error of the fit) and breakpoint indication coefficients (the start time of one segment, the end time of one segment, the breakpoint detection time, the magnitude of the change from one segment to the next segment). We selected the last segment for short-rotation eucalyptus plantation identification and stand age estimation. Spectral mixture analysis had 5 endmembers: green vegetation (GV), non-photosynthetic vegetation (NPV), soil, shadow, and clouds. For GV, NPV, and soil endmembers, we adopted the parameters used by Chen et al. [23]. The endmembers of the shade were assigned zero values in all bands [21]. The Normalized Difference Fraction Index was proposed by Souza et al. and was calculated using Equation (6)
NDFI = G V s h a d e ( N P V + S o i l ) G V s h a d e + ( N P V + S o i l )
where
GV shade = G V 100 S h a d e
GV is the fraction of green vegetation; Shade is the shadow endmember; NPV is the fraction of nonphotosynthetic vegetation and Soil is the soil endmember [21].

2.3.2. Feature Selection

This study considered four types of data as potential input features to support the classification of eucalyptus plantations, including original spectral features, vegetation indices, topographic features, and segmentation coefficients data generated by CCDC-SMA. We obtained a total of 64 features, comprising 6 spectral features (BLUE, GREEN, RED, NIR, SWIR1, and SWIR2 bands for the full year 2022), 7 vegetation indices (NDVI, NBR, EVI, NDWI, and GNDVI for the full year 2022), 3 terrain features (Slope, Aspect, and Elevation), and 48 CCDC-SMA coefficients. Before classification, it is common to reduce the number of features and select a few essential features in order to reduce the model’s complexity, accelerate model construction, and reduce the occurrence of overfitting issues. In this study, we selected the final features for classification by using the Boruta algorithm [52]. The algorithm first shuffled the original target feature values to produce shadow attributes, and then combined the shuffled features with the original true features to create a new feature matrix. Next, a RF classifier was executed with the new feature matrix as input to calculate the Z scores of the real and shadow features. Third, in order to find the maximum Z score among shadow attributes (MZSA), the real features that were larger than MZSA were labeled as “confirmed” and those that were smaller than MSZA were labeled as “rejected” and removed. Finally, the process was repeated until all the features were categorized as “confirmed” or “rejected”. This process was performed in Python using the Boruta package 0.3.0 [52].

2.3.3. RF Classification

In this study, short-rotation eucalyptus plantations were mapped utilizing the RF classifier available on the GEE cloud platform [53]. Numerous studies have demonstrated that the RF model is currently one of the most popular algorithms for land cover classification [54,55,56,57,58,59,60,61]. The RF model offers numerous benefits: (1) by generating numerous decision trees and combining their predictions, RF may effectively decrease the variability of the model and enhance the accuracy of the forecasts; (2) compared to a single decision tree, RF effectively mitigates the problem of overfitting by introducing randomness in the samples and features; (3) in many application scenarios [62,63], its classification accuracy is typically higher than other classifiers, such as support vector machine, k-nearest neighbor algorithm, or multi-label classification; and (4) enhance data processing efficiency by carefully choosing those most important variables for classification or regression. We used the subset of the feature selected (Section 2.3.2), eucalyptus plantation sample points, and non-eucalyptus plantation sample points as inputs to RF. In RF, only two parameters, ntree (the number of trees) and mtry (the number of random variables used in each tree), need to be specified. Based on recommendations from previous studies and pre-testing of our data [60,64], we chose 100 trees (ntree = 100) and mtry was set to the default value (square root of the total number of features).

2.3.4. Accuracy Assessment

To evaluate the accuracy of the identification of short-rotation eucalyptus plantations, we used a confusion matrix approach to compare the classification output with ground truth data [65,66]. The confusion matrix provides measures such as overall accuracy (OA), kappa coefficient, producer accuracy (PA), and user accuracy (UA). These metrics properly measure the level of agreement between the classification results and the ground truth data. The percentage of correct classifications is directly correlated with OA, whereas kappa evaluates the effectiveness of RF. PA and UA offer precise accuracy values for reference and classification categories, respectively. For the stand age validation, we compared the mapped ages from our models with the actual ages collected in the field surveys via a scattergram to derive a determination coefficient to represent the accuracy of age mapping.

3. Results

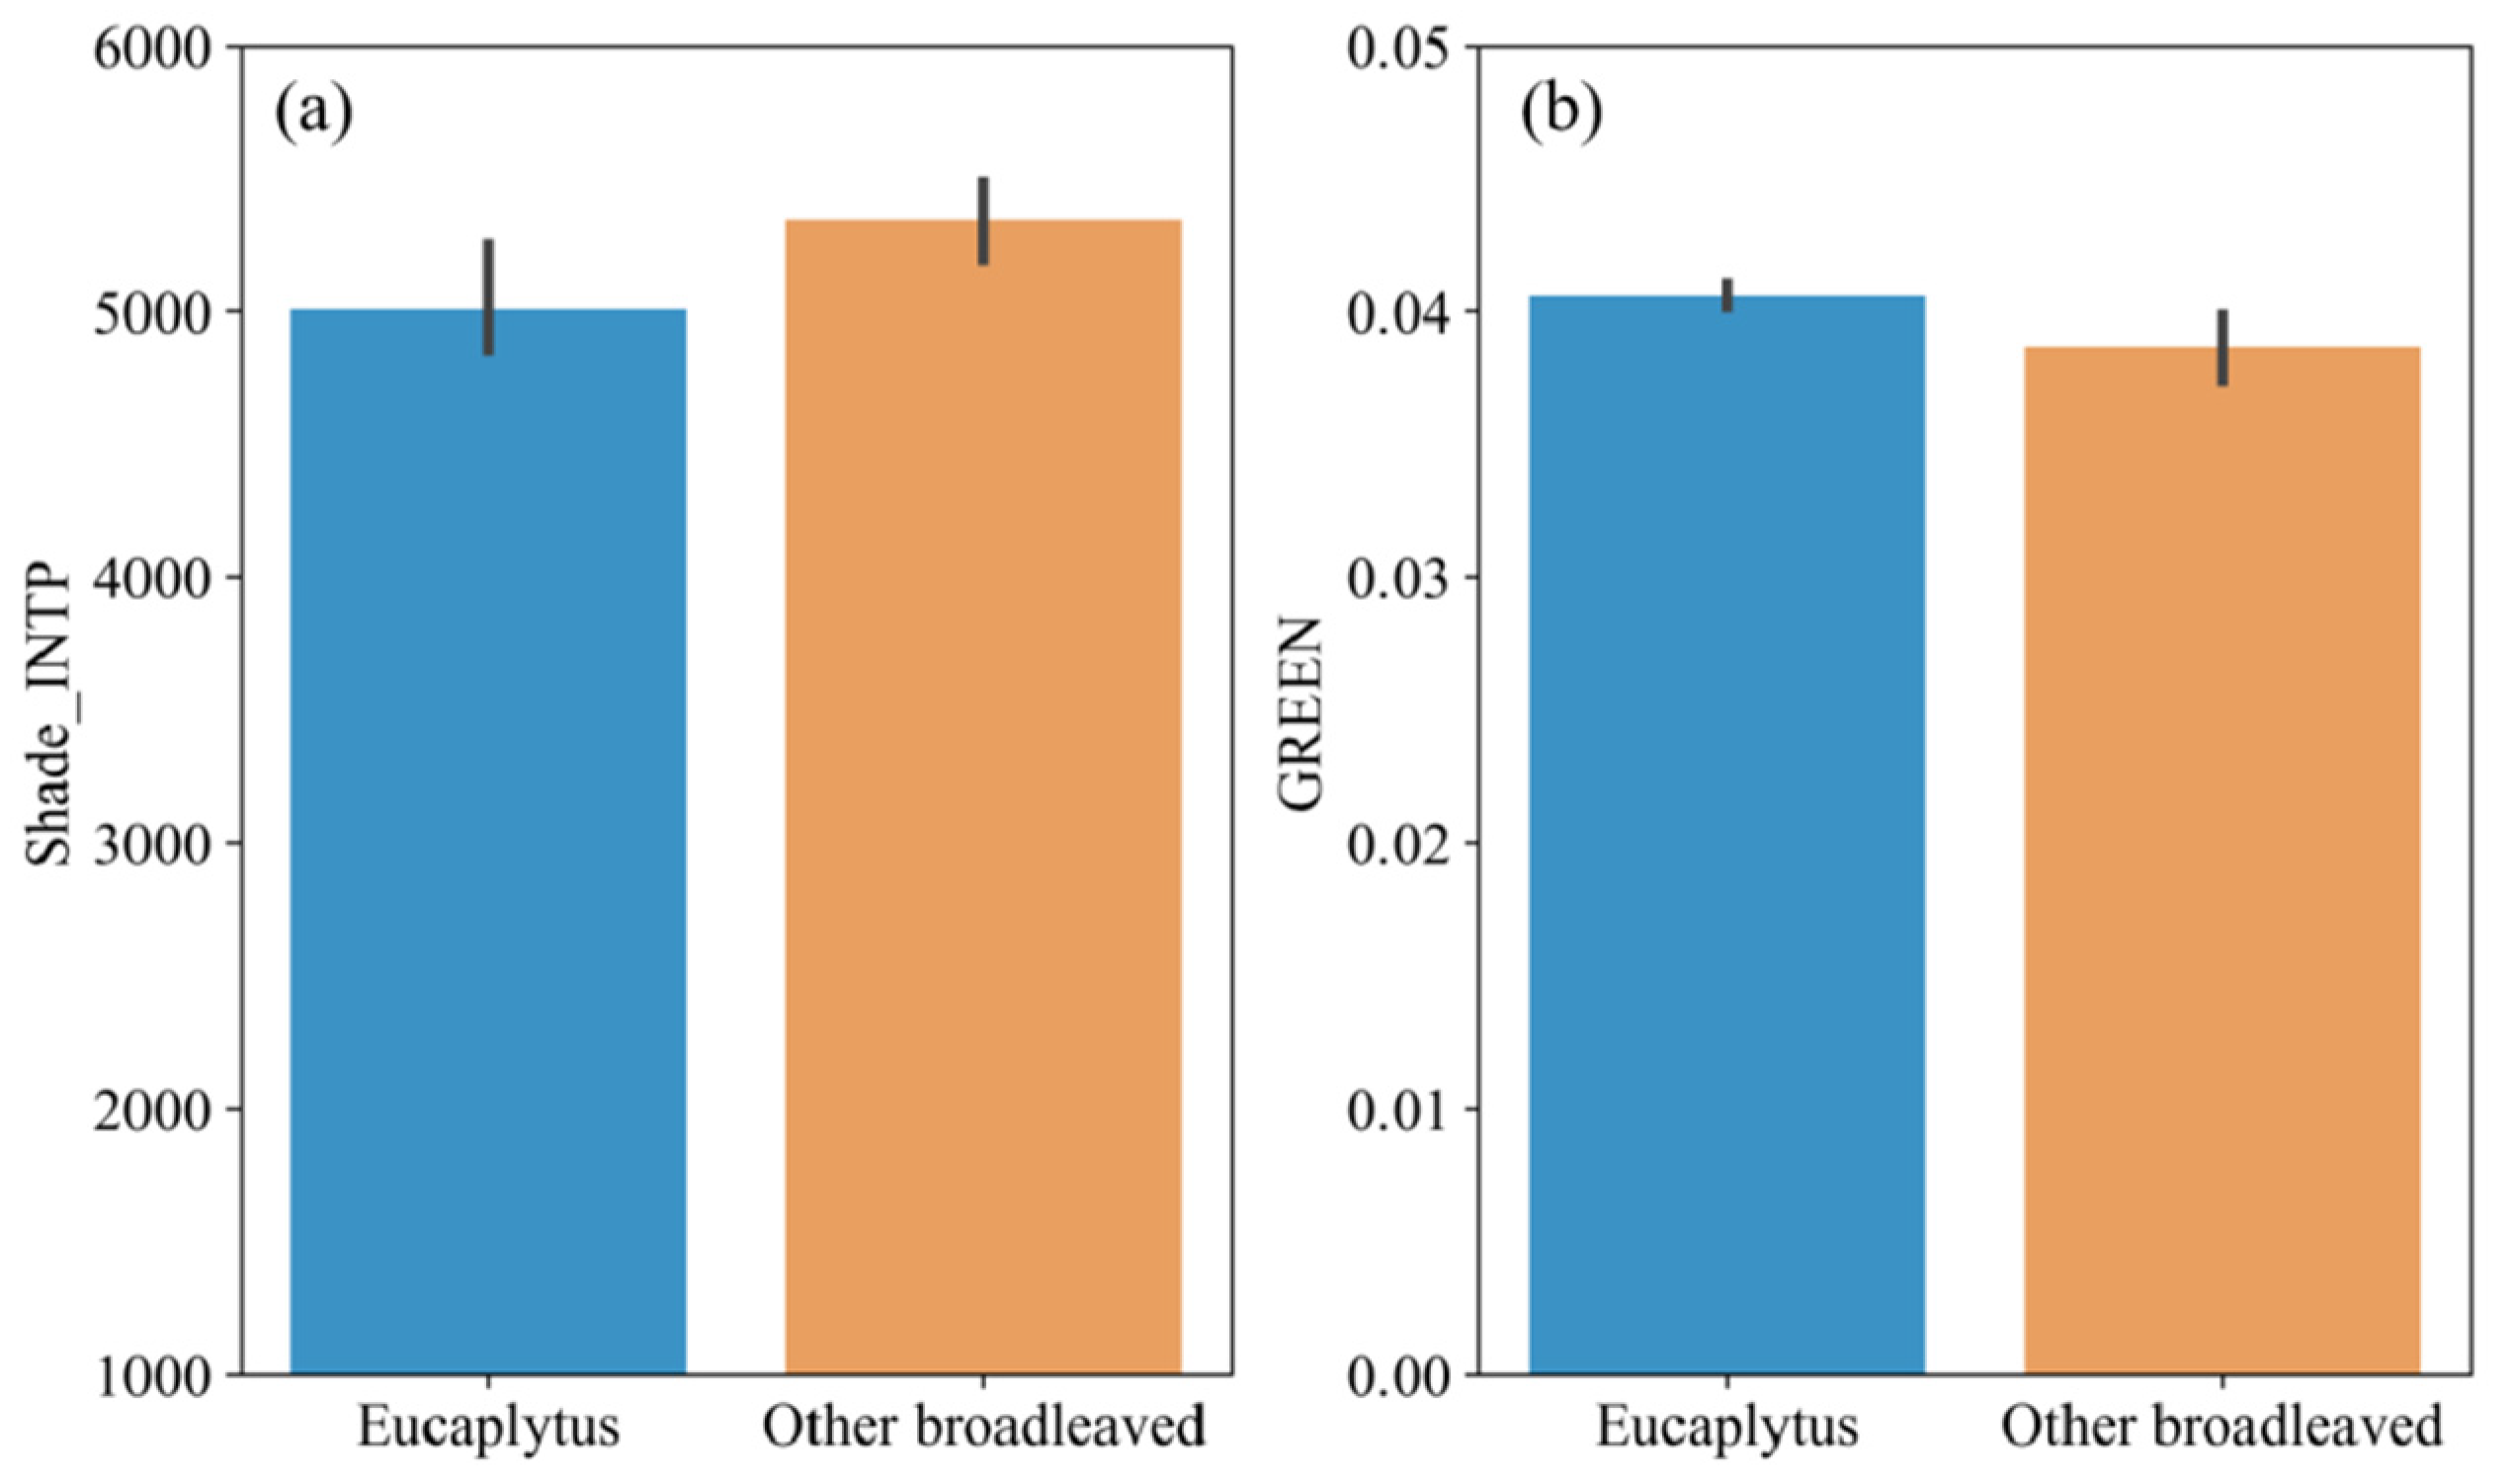
3.1. Feature Selection

For short-rotation eucalyptus plantations classification, the feature selection by the Boruta algorithm resulted in a subset of 46 features with the highest overall accuracy. Figure 3 shows the importance ranking results of these selected 46 features, including 6 spectral features, 5 vegetation indices, 3 terrain features, and 32 CCDC-SMA coefficients. Among them, the most significant feature in the classification of eucalyptus plantations was Slope, accounting for about 18.20%, followed by Shade_INTP (12.62%), Elevation (12.35%), and GREEN (12.80%). The GV_SIN3 had the lowest characteristic importance of 0.12%, and Shade_SIN3 (0.13%), NDFI_COS2 (0.22%), NDFI_COS3 (0.23%), and GV_SIN2 (0.28%) all exhibited poor capabilities in classifying short-rotation eucalyptus plantations.

3.2. Accuracy Assessment of the Short-Rotation Eucalyptus Plantations Map and Stand Age

The accuracy of the distribution map for eucalyptus plantations was rigorously evaluated by utilizing the remaining 30% of the independent sampling data. The validation results are summarized in Table 1. Clearly, an overall accuracy of 94.32% was achieved in the classifications, with a kappa coefficient of 0.88. Both the producer accuracy and the user accuracy were higher than 90% for both eucalyptus and non-eucalyptus plantations. This indicates that the classification model demonstrates a high level of consistency and accuracy in identifying eucalyptus plantations.
Figure 4 shows the scattergram of stand age information for eucalyptus plantations from the remaining independent 30% sampling data corresponding to the CCDC-SMA estimated. The conspicuous linear correlation with a R2 value of 0.97 and an RMSE value of 1.07 year was observed. In addition, the data points were clustered in close proximity to the 1:1 line, and the fitted line displayed a minor deviation from the 1:1 line, but the difference was not significant. The points located below the 1:1 line indicate a drop in NDFI one to two years after the planting of eucalyptus. Points above the 1:1 line indicated that CCDC-SMA may have missed the actual occurrence of the planting event; therefore, planting was determined to be a growth state prior to the non-eucalyptus state. Figure A1 (in Appendix A) shows the detailed time series verification results.

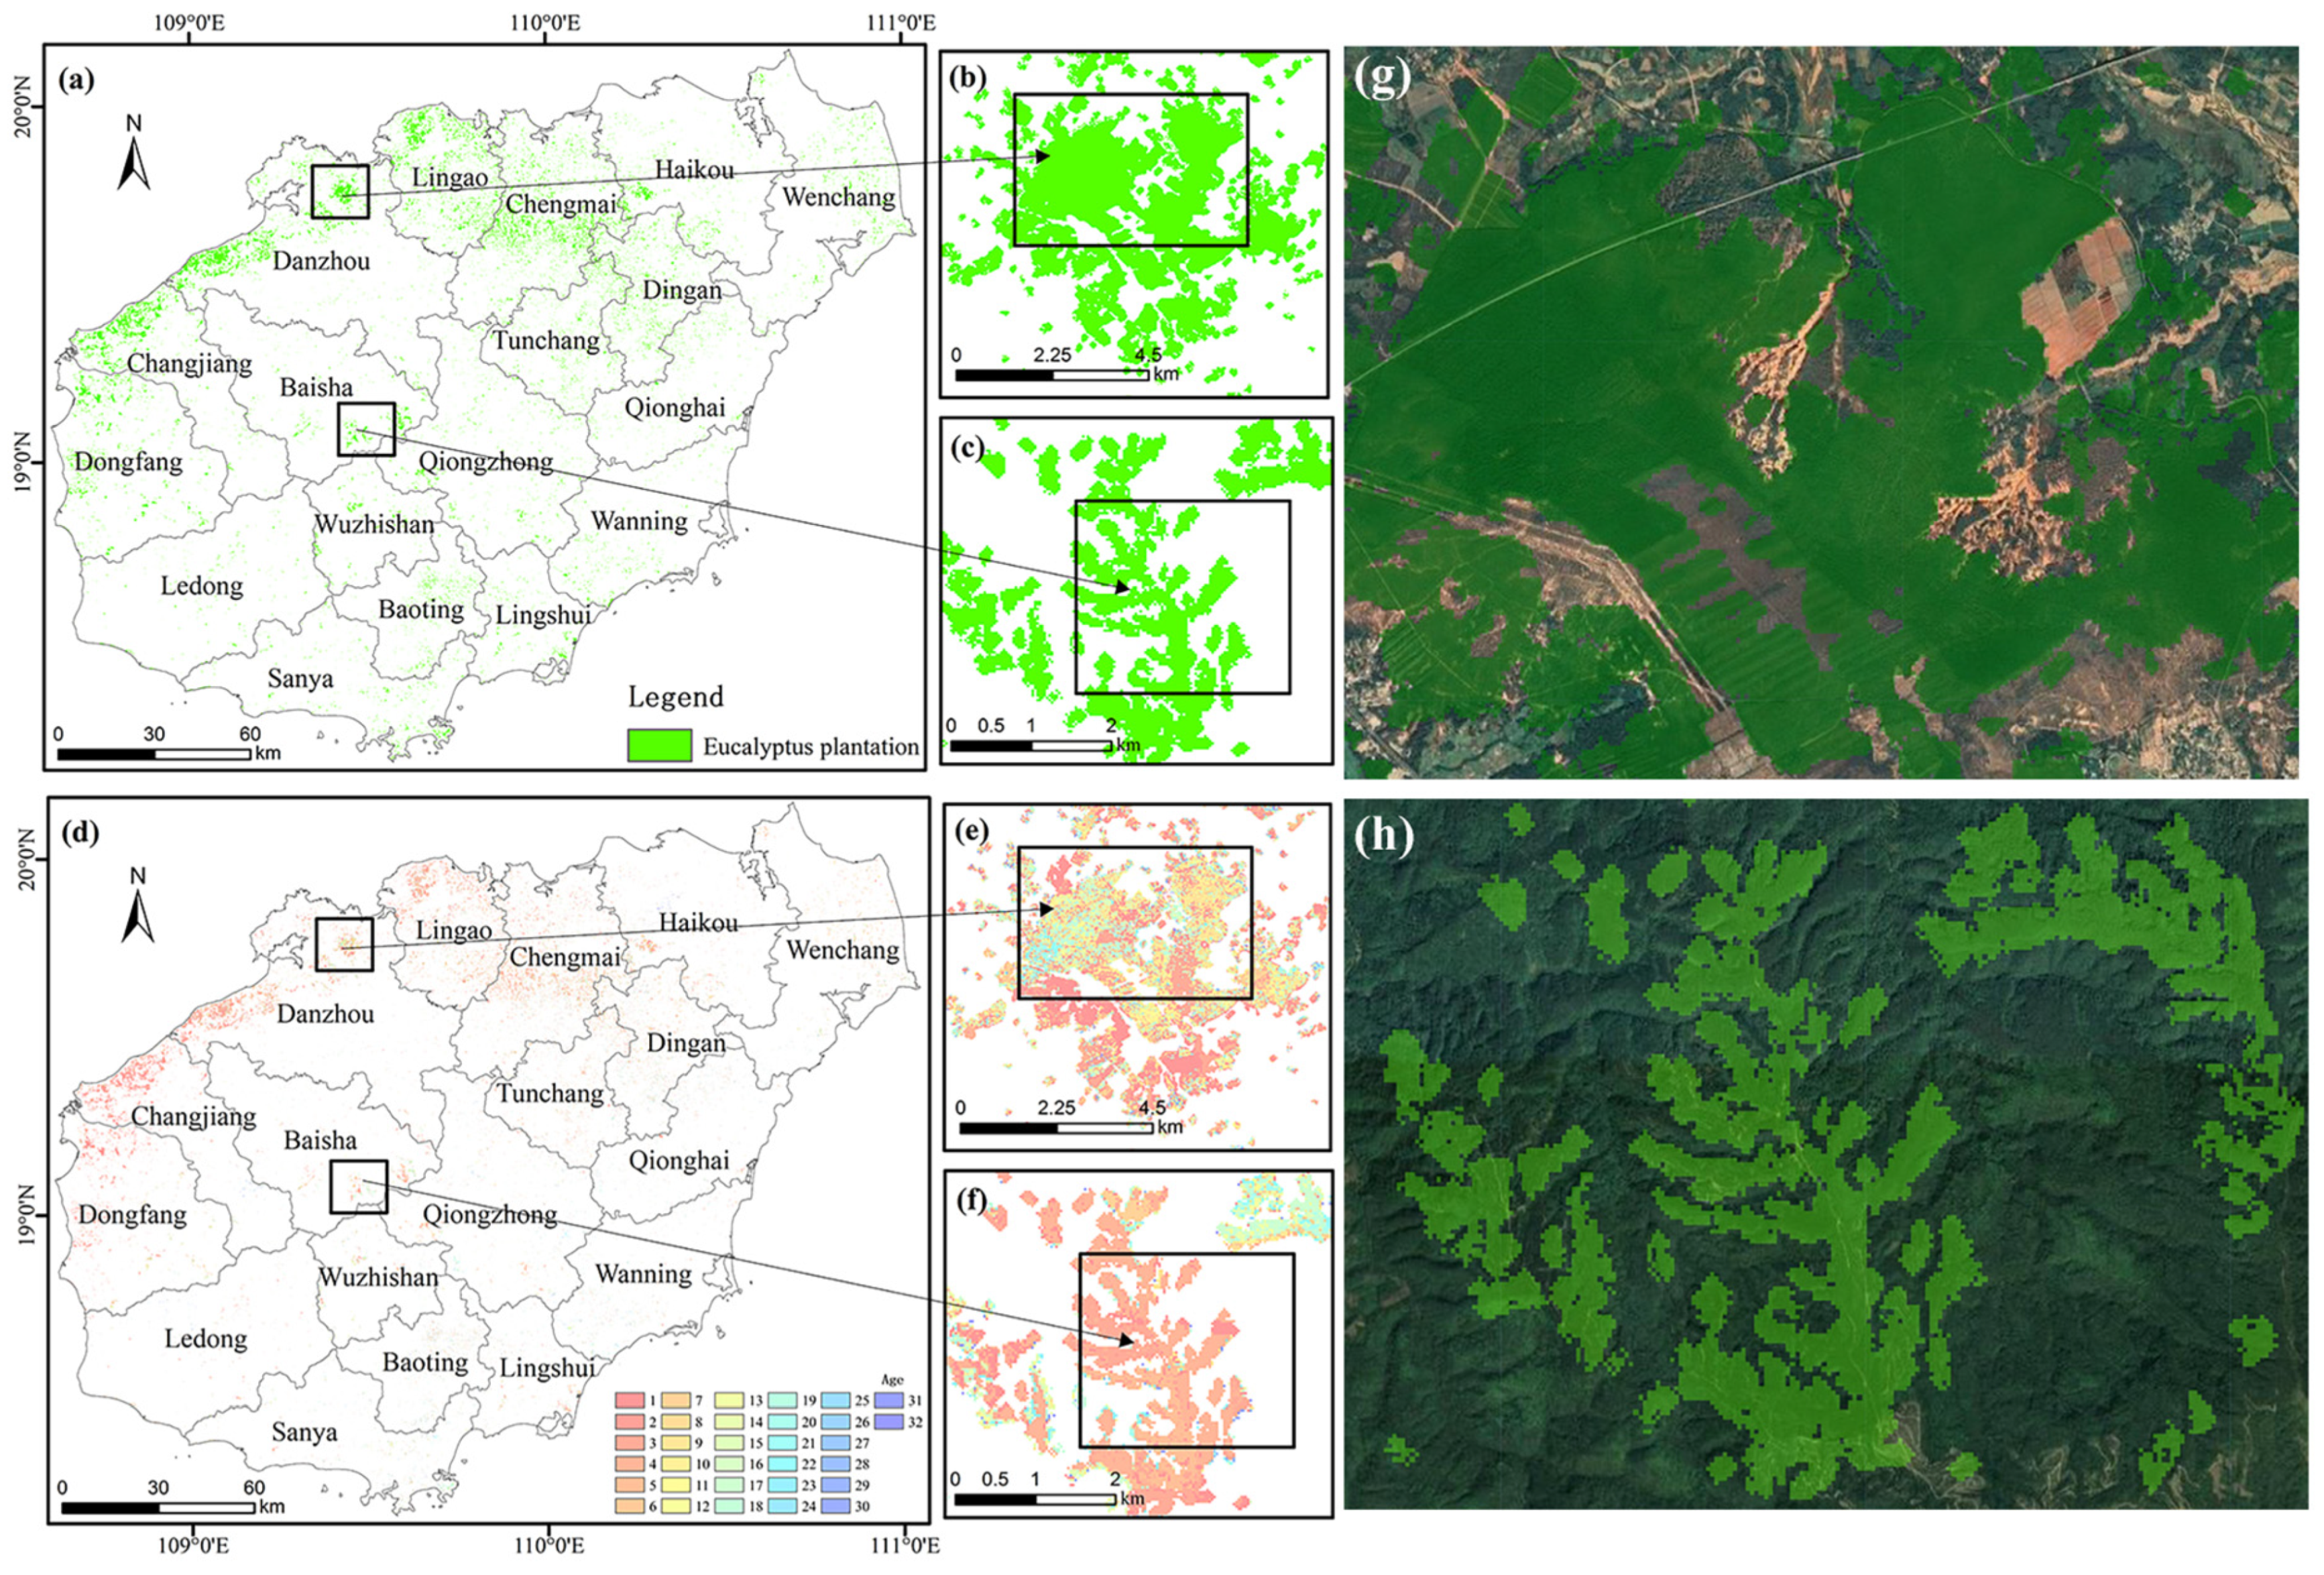
3.3. Spatial and Area Distribution of the 2022 Short-Rotation Eucalyptus Plantations

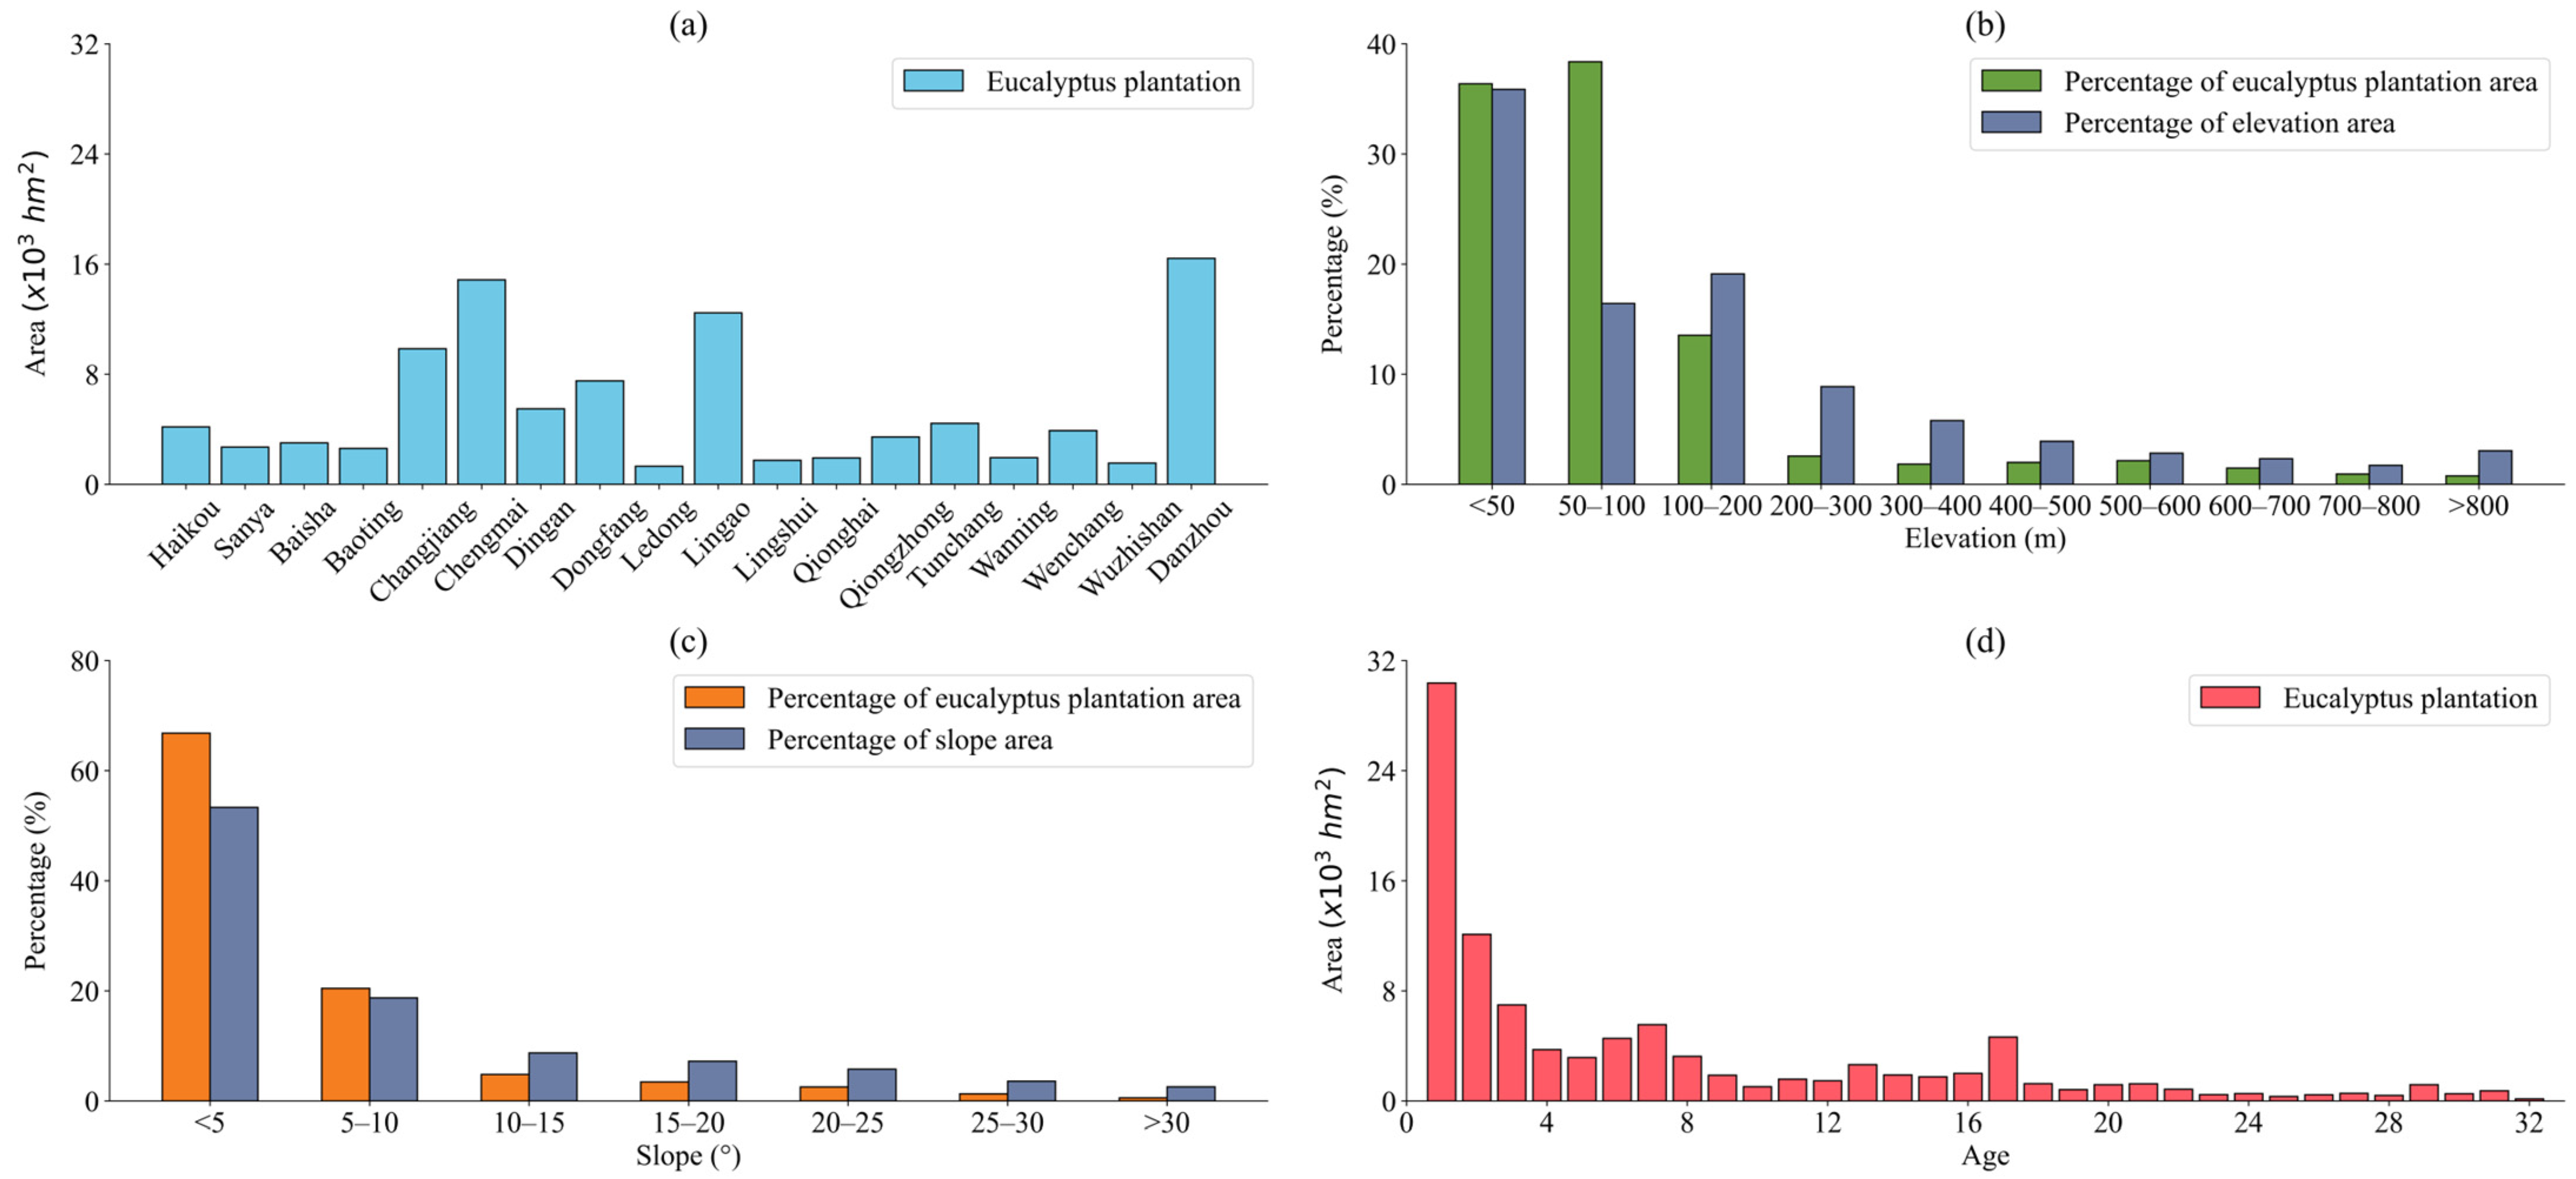
3.3.1. Short-Rotation Eucalyptus Plantations over Different Cities and Counties

The eucalyptus plantations in Hainan Island were mainly located along the northwestern coastline and in the north-central regions, mainly in Danzhou City, Changjiang County, Chengmai County, and Lingao County (Figure 5a–c,g,h). In the east, south, and northeast, eucalyptus plantations were relatively sparsely distributed, especially in Ledong County, Lingshui County, and Qionghai City.
Eucalyptus plantations covered approximately 9.93 × 10⁴ ha on Hainan Island in 2022, which represents 4.67% of the total forest area (2.13 × 10⁶ ha) on the Island (Figure 6a). Danzhou City has the biggest expanse of eucalyptus plantations among the 18 administrative units, covering an area of 1.64 × 10⁴ ha. Following closely behind were Chengmai County (1.49 × 10⁴ ha), Lingao County (1.25 × 10⁴ ha), and Changjiang County (9.85 × 10³ ha). These areas account for 53.95% of the total area of eucalyptus plantations. The smallest area of eucalyptus plantations was only 1.32 × 10³ ha in Ledong County. There was also a small amount of eucalyptus plantations in Wuzhishan City (1.55 × 10³ ha), Lingshui County (1.75 × 10³ ha), and Qionghai City (1.92 × 10³ ha). These regions only account for 6.58% of the total area of eucalyptus plantations.

3.3.2. Short-Rotation Eucalyptus Plantations in Different Terrain Areas

Approximately 71.41% of Hainan Island’s land area is situated below an elevation of 200 m and eucalyptus plantations were mainly distributed in areas below 200 m elevation, with substantial differences in the distribution of eucalyptus plantations in different elevation ranges (Figure 6b). The areas of eucalyptus plantations at 0–50 m, 50–100 m, and 100–200 m elevation account for 36.37%, 38.38%, and 13.54% of the total area of eucalyptus plantations on Hainan Island, respectively. Eucalyptus plantations in areas above 200 m elevation account for 28.59% of the land area of Hainan Island, and the area of eucalyptus plantations accounts for 11.72% of the total area of eucalyptus plantations on Hainan Island. In particular, the region above 800 m elevation has the smallest area, comprising only 0.77% of the total area of eucalyptus plantations. This trend shows that the area of eucalyptus plantations decreases with increases in elevation.
Approximately 72.06% of Hainan Island’s land area consists of places with slopes below 10°. Eucalyptus plantations are primarily distributed in these areas as well. The distribution of eucalyptus plantations varies substantially across different slope ranges (Figure 6c). Eucalyptus plantations with slopes of 0°–5° and 5°–10° account for 66.81% and 20.45% of the total eucalyptus plantation area, respectively. Areas with slopes above 10° account for 27.94% of the land area of Hainan Island, and eucalyptus plantations account for 28.59% of the total eucalyptus plantation area of Hainan Island. The area with a slope range above 30° had the smallest eucalyptus plantations distribution, comprising a mere 5.78% of the overall eucalyptus plantations. This distribution pattern shows that the area of eucalyptus plantations decreases with increasing slope.

3.3.3. Short-Rotation Eucalyptus Plantations of Different Stand Ages

The stand ages of eucalyptus plantations in the northwest coastal and north-central regions of Hainan Island primarily consist of trees that were between 1 and 8 years old (Figure 5d–f). In particular, they were extensively dispersed throughout Danzhou City, Changjiang County, Dongfang City, Lingao County, and Chengmai County. The distribution of eucalyptus plantations stands older than 8 years old was relatively scarce, and they were more concentrated in Danzhou City and Chengmai County and less distributed in other cities and counties.
The areas of eucalyptus plantations stand ages at 1–8 years were 3.04 × 10⁴ ha, 1.21 × 10⁴ ha, 6.98 × 10³ ha, 3.73 × 10³ ha, 3.16 × 10³ ha, 4.55 × 10³ ha, 5.54 × 10³ ha, and 3.24 × 10³ ha, respectively, accounting for 70.17% of the total area of the mapped eucalyptus plantations (Figure 6d). Among them, the 1-year-old area was the largest, approximately 3.04 × 10⁴ ha, accounting for 30.58% of the total area of eucalyptus plantations. The area of eucalyptus plantations stands aged above 8 years old accounted for 29.83% of the total area of the mapped eucalyptus plantations.

3.4. Distribution of Short-Rotation Eucalyptus Plantations in River Buffer Zones

Among the three major river basins on Hainan Island, eucalyptus plantations were mainly distributed in the Nandu River basin, covering an area of about 3.11 × 10⁴ ha, which represents 31.33% of the total eucalyptus plantations area (Figure 7a), followed by the Changhua River basin (7.27 × 10³ ha) and Wanquan River basin (5.23 × 10³ ha), accounting for 7.32% and 5.27% of the eucalyptus plantations area, respectively.
There were also apparent differences in eucalyptus plantations distribution across river buffer zones. The three major river basins account for 44.19% of the land area of Hainan Island (Figure 7b). As the river buffer expanded, eucalyptus plantations expanded in all three river basins. In the Nandu River Basin, the area of eucalyptus plantations within the 1 km buffer zone was relatively small, about 935.15 ha. Nevertheless, the overall number of eucalyptus plantations within the 2 km buffer zone showed a substantial and rapid growth trend, reaching 2.47 × 10³ ha, with an increase rate of 62.07%. Compared to the 2 km buffer zone, the area of eucalyptus plantations in the 3 km buffer zone increased by 43.75% less quickly. Compared with the 3 km buffer zone, the area of eucalyptus plantations beyond the 3 km buffer zone outwards increased at a faster rate of 81.22%. In the Changhua River Basin, the total area of eucalyptus plantations in the 1 km buffer zone was 474.16 ha. Nevertheless, the overall number of eucalyptus plantations within the 2 km buffer zone showed a substantial and rapid growth trend, with an increase rate of 60.09% to 1.19 × 10³ ha compared to the 1 km buffer zone. As for the area of eucalyptus plantations in the 3 km and beyond the 3 km buffer zones outwards, the growth rate was slower, with a growth rate of 46.49% and 65.00% compared with the 2 km buffer zone. In the Wanquan River Basin, the area of eucalyptus plantations within the 1 km, 2 km, and 3 km buffer zones were all less than 1.00 × 10³ ha in size, presenting a relatively small scale of distribution. The area of eucalyptus planted in the buffer zone beyond 3 km was relatively large, reaching 3.45 × 10³ ha (Figure 7b).

4. Discussion

4.1. Key Features

Numerous previous studies have demonstrated that the choice of features may be more crucial than the choice of classifiers [60,67,68,69]. Utilizing all available features directly may result in an increase in feature dimensionality, which has a negative impact on the classifier’s performance and diminishes classification accuracy. Therefore, it is crucial to identify key features for mapping tree species. For some tree species with phenological or spectral characteristics variations, determining the optimal characteristics available to support tree species classification or identification is relatively straightforward. For example, deciduous trees (such as rubber plantations [10,70,71] and larch forests [72,73]) have obvious seasonal characteristics, and these tree species can be readily identified through NDVI, EVI, LSWI, and phenological changes. However, most tree species, such as eucalyptus plantations, lack these distinct phenological or spectral characteristics, making it difficult to determine the key features. Therefore, other data and methods need to be introduced to determine the key features to identify short-rotation eucalyptus plantations.
In this study, we used the Boruta algorithm to screen the 64 original features required to recognize eucalyptus plantations. After a careful feature selection process, a total of 46 features were included in the optimal feature subset (Figure 3). The findings of the analysis indicated that the top four features including Slope, Shade_INTP, Elevation, and GREEN were significantly effective in identifying eucalyptus plantations. The selection of Slope and Elevation as key features may primarily stem from the variations in spatial distribution between eucalyptus plantations and other types of forests. The non-eucalyptus plantations represent a collection of other forest types, so direct comparisons of Shade_INTP and GREEN cannot be made. Considering that the forest types in Hainan Island are mainly broadleaf forests, we compared shade_INTP and GREEN between eucalyptus plantations and other broadleaved forests (Figure 8). Figure 8 shows that eucalyptus plantations differ from other broadleaf in Shade_INTP and GREEN values substantially. Therefore, shade_INTP and GREEN were identified as key features to recognize eucalyptus plantations. The lower Shade_INTP of eucalyptus plantations might be due to the fact that they have erectophile leaves that hang vertically and expose the soil more easily compared to trees with planophile leaves [74]. In addition, eucalyptus plantations' stand ages are younger and have uniform tree height and thus little shading of the canopy. The green band reflects vegetation growth, and the higher green reflectance in the eucalyptus plantation may be due to the fact that eucalyptus trees are healthier than other broadleaved forests [9,75]. This is consistent with the research results of Chen et al. [23] and Koskinen et al. [76].

4.2. Implications of the Spatial Distribution of Short-Rotation Eucalyptus Plantations on River Basins

In comparison to other plantations, short-rotation eucalyptus plantations covered only 9.93 × 10⁴ ha of the total land area. Despite the fact that eucalyptus plantations occupied only a minor portion of the region’s land, 43.91% (4.36 × 10⁴ ha) of its distribution area is located in the three major river basins. Given the high rate of water withdrawal from eucalyptus plantations, this phenomenon may have an adverse effect on the region’s future water supplies. Consequently, the issue of decreased river volumes caused by plantation species such as eucalyptus has garnered significant government attention [77,78]. According to Dye (2013) [79], each eucalyptus tree utilizes between 15 and 64 L of water per day, which has a detrimental effect on the dwindling water supply. Many studies have shown that removing eucalyptus plantations from riparian areas is beneficial in increasing runoff from rivers [75,80,81,82]. In addition, the Forestry Law of the People’s Republic of China stipulates that the capacity of forests to contain water should be improved by selecting suitable tree species and adopting sustainable forestry management practices in rivers and riparian areas [83]. Given the large number of rivers and abundant vegetation on Hainan Island, eucalyptus plantations in river and riparian buffer zones have the potential to negatively affect the water table in the area, leading to chronic water shortages. Nonetheless, it is important to note that eucalyptus is a plant species with contradictory characteristics. Although they provide basic materials such as wood, their negative impact on water resources and the environment is of great concern.
Although almost 56.09% of the eucalyptus plantations in this study extend beyond the river buffer zones by a distance of 3 km, it still has a substantial impact on local biodiversity and groundwater resources. Specifically, the allelopathic properties of eucalyptus plantations on the ecosystem release certain chemicals to inhibit the growth of other plants. These allelopathic properties lead to a simplification of the community structure within the forest and a scarcity of shrubs and herbs in the understory, which in turn leads to more serious soil erosion problems and a decline in biodiversity [75,84]. Moreover, eucalyptus consumes a substantial quantity of soil water and nutrients during their growth, which has a negative impact on the sustainability of soil and water resources [85,86,87]. Therefore, although eucalyptus plantations provide some economic benefits, the impacts of their cultivation on the ecosystem and water resources need to be adequately addressed and managed.

5. Conclusions

In this study, we used the CCDC-SMA algorithm and RF algorithm as well as other auxiliary data to conduct image recognition, mapping, and stand age estimation of short rotation eucalyptus plantations in Hainan Island at 30 m spatial resolution. Our methods produced reliable distribution maps of short-rotation eucalyptus plantations and stand age in 2022. The distribution of short-rotation eucalyptus plantations was primarily concentrated in the northwest coastal, eastern, and north-central regions. From the perspective of topography, eucalyptus plantations were mainly distributed in low-altitude areas, while eucalyptus plantations were rare in high-altitude areas. In terms of stand ages, eucalyptus plantations were mainly concentrated at under 8 years old. In addition, eucalyptus plantations were also relatively concentrated in the three major watersheds. Overall, this study successfully demonstrated the potential of using the CCDC-SMA algorithm and the RF algorithm to rapidly map large-scale short-rotation eucalyptus plantations. The map of short-rotation eucalyptus plantations with a spatial resolution of 30 m offers crucial data for the planning, management, ecological assessment, and protection of sustainable eucalyptus plantations.

Author Contributions

Conceptualization, M.L. and B.C.; methodology, X.Y.; software, X.Y.; validation, X.Y., H.L. and Y.C.; resources, X.Y. and Y.C.; writing—original draft preparation, X.Y.; writing—review and editing, M.L., W.K. and B.C.; visualization, X.Y.; supervision, W.K.; funding acquisition, M.L. and B.C. All authors have read and agreed to the published version of the manuscript.

Funding

This research was jointly funded by the National Natural Science Foundation of China (grant No. 31971577, No. 42071418), the Priority Academic Program Development (PAPD) of Jiangsu Higher Education Institutions, and the joint special key project of Yunnan Province agricultural fundamental research (grant No. 202301BD070001-160).

Institutional Review Board Statement

Not applicable.

Informed Consent Statement

Not applicable.

Data Availability Statement

Data are contained within the article.

Acknowledgments

The authors express gratitude to Google Earth Engine for generously providing free satellite imagery data and comprehensive data assistance for this research.

Conflicts of Interest

The authors declare no conflicts of interest.

Appendix A

As shown in Figure A1, the stand age of eucalyptus plantations can be accurately identified using the time series trajectories fitted by the CCDC-SMA algorithm and verified by historical satellite images. The disturbance years captured by the time series trajectories fitted by the CCDC-SMA algorithm were 1998, 2004, 2006, 2009, 2015, and 2021 (Figure A1d). Historical image thumbnails show that disturbances occurred in 1998, 2004, 2006, 2009, 2015, and 2021 (Figure A1e).
Figure A1. Diagram for monitoring eucalyptus plantations distribution and stand age based on CCDC-SMA algorithm: (a) 1-year-old eucalyptus plantations in Hainan Island, (b) 1-year-old eucalyptus plantations magnified distribution map in Lingao County coastal area, (c) typical high spatial resolution Google Earth Maps of the eucalyptus plantations area (109.608617° E, 19.931188° N), (d) corresponding annual NDFI time series and fitted CCDC-SMA trajectory, and (e) historical satellite image of the thumbnail.
Forests 15 00925 g0a1

References

  1. Deng, X.; Guo, S.; Sun, L.; Chen, J. Identification of Short-Rotation Eucalyptus Plantation at Large Scale Using Multi-Satellite Imageries and Cloud Computing Platform. Remote Sens. 2020, 12, 2153. [Google Scholar] [CrossRef]
  2. Zhang, C.; Xiao, X.; Zhao, L.; Qin, Y.; Doughty, R.; Wang, X.; Dong, J.; Yang, X. Mapping Eucalyptus plantation in Guangxi, China by using knowledge-based algorithms and PALSAR-2, Sentinel-2, and Landsat images in 2020. Int. J. Appl. Earth Obs. 2023, 120, 103348. [Google Scholar] [CrossRef]
  3. Jagger, P.; Pender, J. The role of trees for sustainable management of less-favored lands: The case of eucalyptus in Ethiopia. For. Policy Econ. 2003, 5, 83–95. [Google Scholar] [CrossRef]
  4. Bertomeu, M.; Diaz-Balteiro, L.; Giménez, J.C. Forest management optimization in Eucalyptus plantations: A goal programming approach. Can. J. For. Res. 2009, 39, 356–366. [Google Scholar] [CrossRef]
  5. Grossman, J.J. case study of smallholder eucalyptus plantation silviculture in Eastern Paraguay. Forest. Chron. 2012, 88, 528–534. [Google Scholar] [CrossRef]
  6. Thompson, I.D.; Maher, S.C.; Rouillard, D.P.; Fryxell, J.M.; Baker, J.A. Accuracy of forest inventory mapping: Some implications for boreal forest management. For. Ecol. Manag. 2007, 252, 208–221. [Google Scholar] [CrossRef]
  7. Roughgarden, J.; Running, S.W.; Matson, P.A. What does remote sensing do for ecology? Ecology 1991, 72, 1918–1922. [Google Scholar] [CrossRef]
  8. Wu, H.; Li, Z. Scale Issues in Remote Sensing: A Review on Analysis, Processing and Modeling. Sensors 2009, 9, 1768–1793. [Google Scholar] [CrossRef] [PubMed]
  9. Chen, Y.; Peng, Z.; Ye, Y.; Jiang, X.; Lu, D.; Chen, E. Exploring a uniform procedure to map Eucalyptus plantations based on fused medium—High spatial resolution satellite images. Int. J. Appl. Earth Obs. 2021, 103, 102462. [Google Scholar] [CrossRef]
  10. Xiao, C.; Li, P.; Feng, Z. Monitoring annual dynamics of mature rubber plantations in Xishuangbanna during 1987-2018 using Landsat time series data: A multiple normalization approach. Int J. Appl Earth Obs. 2019, 77, 30–41. [Google Scholar] [CrossRef]
  11. Lin, Y.; Zhang, Y.; Zhao, W.; Dong, Y.; Fei, X.; Song, Q.; Sha, L.; Wang, S.; Grace, J. Pattern and driving factor of intense defoliation of rubber plantations in SW China. Ecol. Indic. 2018, 94, 104–116. [Google Scholar] [CrossRef]
  12. Chen, B.; Xiao, X.; Li, X.; Pan, L.; Doughty, R.; Ma, J.; Dong, J.; Qin, Y.; Zhao, B.; Wu, Z.; et al. A mangrove forest map of China in 2015: Analysis of time series Landsat 7/8 and Sentinel-1A imagery in Google Earth Engine cloud computing platform. ISPRS J. Photogramm. 2017, 131, 104–120. [Google Scholar] [CrossRef]
  13. Zhao, C.; Qin, C.; Wang, Z.; Mao, D.; Wang, Y.; Jia, M. Decision surface optimization in mapping exotic mangrove species (Sonneratia apetala) across latitudinal coastal areas of China. ISPRS J. Photogramm. 2022, 193, 269–283. [Google Scholar] [CrossRef]
  14. Meng, Y.; Gou, R.; Bai, J.; Moreno-Mateos, D.; Davis, C.C.; Wan, L.; Song, S.; Zhang, H.; Zhu, X.; Lin, G. Spatial patterns and driving factors of carbon stocks in mangrove forests on Hainan Island, China. Glob. Ecol. Biogeogr. 2022, 31, 1692–1706. [Google Scholar] [CrossRef]
  15. Zhou, Q.; Wang, L.; Tang, F.; Zhao, S.; Huang, N.; Zheng, K. Mapping spatial and temporal distribution information of plantations in Guangxi from 2000 to 2020. Front. Ecol. Evol. 2023, 11, 1201161. [Google Scholar] [CrossRef]
  16. Verbesselt, J.; Herold, M.; Hyndman, R.; Zeileis, A.; Culvenor, D. A robust approach for phenological change detection within satellite image time series. In Proceedings of the 2011 6th International Workshop on the Analysis of Multi-temporal Remote Sensing Images (Multi-Temp), Trento, Italy, 12–14 July 2011; IEEE: New York, NY, USA, 2011; pp. 41–44. [Google Scholar]
  17. Kennedy, R.E.; Yang, Z.; Cohen, W.B. Detecting trends in forest disturbance and recovery using yearly Landsat time series: 1. LandTrendr—Temporal segmentation algorithms. Remote Sens. Environ. 2010, 114, 2897–2910. [Google Scholar] [CrossRef]
  18. Zhu, Z.; Woodcock, C.E. Continuous change detection and classification of land cover using all available Landsat data. Remote Sens. Environ. 2014, 144, 152–171. [Google Scholar] [CrossRef]
  19. Pasquarella, V.J.; Arévalo, P.; Bratley, K.H.; Bullock, E.L.; Gorelick, N.; Yang, Z.; Kennedy, R.E. Demystifying LandTrendr and CCDC temporal segmentation. Int. J. Appl. Earth Obs. Geoinf. 2022, 110, 102806. [Google Scholar] [CrossRef]
  20. Cai, Y.; Shi, Q.; Xu, X.; Liu, X. A novel approach towards continuous monitoring of forest change dynamics in fragmented landscapes using time series Landsat imagery. Int. J. Appl. Earth Obs. 2023, 118, 103226. [Google Scholar] [CrossRef]
  21. Souza, C.M.; Roberts, D.A.; Cochrane, M.A. Combining spectral and spatial information to map canopy damage from selective logging and forest fires. Remote Sens. Environ. 2005, 98, 329–343. [Google Scholar] [CrossRef]
  22. Chen, S.; Olofsson, P.; Saphangthong, T.; Woodcock, C.E. Monitoring shifting cultivation in Laos with Landsat time series. Remote Sens. Environ. 2023, 288, 113507. [Google Scholar] [CrossRef]
  23. Chen, S.; Woodcock, C.E.; Bullock, E.L.; Arévalo, P.; Torchinava, P.; Peng, S.; Olofsson, P. Monitoring temperate forest degradation on Google Earth Engine using Landsat time series analysis. Remote Sens. Environ. 2021, 265, 112648. [Google Scholar] [CrossRef]
  24. Garlaschelli, D.; Loffredo, M.I. Maximum likelihood: Extracting unbiased information from complex networks. Phys. Review. E Stat. Nonlinear Soft Matter Phys. 2008, 78, 15101. [Google Scholar] [CrossRef] [PubMed]
  25. Hearst, M.A.; Dumais, S.T.; Osuna, E.; Platt, J.; Scholkopf, B. Support vector machines. IEEE Intell. Syst. Their Appl. 1998, 13, 18–28. [Google Scholar] [CrossRef]
  26. Quinlan, J.R. Induction of decision trees. Mach. Learn. 1986, 1, 81–106. [Google Scholar] [CrossRef]
  27. Bishop, C.M. Neural networks and their applications. Rev. Sci. Instrum. 1994, 65, 1803–1832. [Google Scholar] [CrossRef]
  28. LeCun, Y.; Bengio, Y.; Hinton, G. Deep learning. Nature 2015, 521, 436–444. [Google Scholar] [CrossRef] [PubMed]
  29. Breiman, L. Random Forests. Mach. Learn. 2001, 45, 5–32. [Google Scholar] [CrossRef]
  30. Chen, Y.; Zhao, S.; Xie, Z.; Lu, D.; Chen, E. Mapping multiple tree species classes using a hierarchical procedure with optimized node variables and thresholds based on high spatial resolution satellite data. Gisci. Remote Sens. 2020, 57, 526–542. [Google Scholar] [CrossRef]
  31. Ma, L.; Li, M.; Ma, X.; Cheng, L.; Du, P.; Liu, Y. A review of supervised object-based land-cover image classification. ISPRS J. Photogramm. 2017, 130, 277–293. [Google Scholar] [CrossRef]
  32. Xie, Z.; Chen, Y.; Lu, D.; Li, G.; Chen, E. Classification of Land Cover, Forest, and Tree Species Classes with ZiYuan-3 Multispectral and Stereo Data. Remote Sens. 2019, 11, 164. [Google Scholar] [CrossRef]
  33. Wu, F.; Ren, Y.; Wang, X. Application of Multi-Source Data for Mapping Plantation Based on Random Forest Algorithm in North China. Remote Sens. 2022, 14, 4946. [Google Scholar] [CrossRef]
  34. Shimabukuro, Y.E.; Arai, E.; da Silva, G.M.; Dutra, A.C.; Mataveli, G.; Duarte, V.; Martini, P.R.; Cassol, H.L.G.; Ferreira, D.S.; Junqueira, L.R. Mapping and Monitoring Forest Plantations in São Paulo State, Southeast Brazil, Using Fraction Images Derived from Multiannual Landsat Sensor Images. Forests 2022, 13, 1716. [Google Scholar] [CrossRef]
  35. Purwanto, A.D.; Wikantika, K.; Deliar, A.; Darmawan, S. Decision Tree and Random Forest Classification Algorithms for Mangrove Forest Mapping in Sembilang National Park, Indonesia. Remote Sens. 2023, 15, 16. [Google Scholar] [CrossRef]
  36. Fassnacht, F.E.; Latifi, H.; Stereńczak, K.; Modzelewska, A.; Lefsky, M.; Waser, L.T.; Straub, C.; Ghosh, A. Review of studies on tree species classification from remotely sensed data. Remote Sens. Environ. 2016, 186, 64–87. [Google Scholar] [CrossRef]
  37. Zhang, G.; Wang, S.; Xia, J. Research on Evolution Characteristics of Pattern and Service Function for Natural, Rubber and Wood Pulp Forests in Hainan, China. J. Minzu Univ. China 2020, 29, 28–35. [Google Scholar]
  38. Wang, B.; Peng, S.; Guo, L.; Ye, Y. Diversity of tropical forest landscape types in Hainan Island, China. Acta Ecologica Sinica 2007, 27, 1690–1695. [Google Scholar] [CrossRef]
  39. Xiao, H.; Zhang, X.; Yan, M.; Zhang, L.; Wang, H.; Ma, Y.; Liu, J. The Temporal-Based Forest Disturbance Monitoring Analysis: A Case Study of Nature Reserves of Hainan Island of China From 1987 to 2020. Front. Environ. Sci. 2022, 10, 891752. [Google Scholar] [CrossRef]
  40. Zhu, M.; Wang, X.; Wang, S.; Wang, W.; Zou, Y.; Liang, Q. Carbon storage and distribution of rubber and eucalyptus plantations in Danzhou, Hainan Island. Ecol. Sci. 2016, 35, 43–51. [Google Scholar]
  41. Sun, R.; Wu, Z.X.; Chen, B.Q.; Lan, G.Y.; Qi, D.L. Change Features of Precipitation Events in Hainan Island from 1959 to 2013. Chin. J. Trop. Crops 2017, 38, 2176–2182. [Google Scholar]
  42. Roy, D.P.; Kovalskyy, V.; Zhang, H.K.; Vermote, E.F.; Yan, L.; Kumar, S.S.; Egorov, A. Characterization of Landsat-7 to Landsat-8 reflective wavelength and normalized difference vegetation index continuity. Remote Sens. Environ. 2016, 185, 57–70. [Google Scholar] [CrossRef] [PubMed]
  43. Zhu, Z.; Wulder, M.A.; Roy, D.P.; Woodcock, C.E.; Hansen, M.C.; Radeloff, V.C.; Healey, S.P.; Schaaf, C.; Hostert, P.; Strobl, P.; et al. Benefits of the free and open Landsat data policy. Remote Sens. Environ. 2019, 224, 382–385. [Google Scholar] [CrossRef]
  44. Masek, J.G.; Vermote, E.F.; Saleous, N.E.; Wolfe, R.; Hall, F.G.; Huemmrich, K.F.; Gao, F.; Kutler, J.; Lim, T.K. A Landsat Surface Reflectance Dataset for North America, 1990–2000. IEEE Geosci. Remote Sens. Lett. 2006, 3, 68–72. [Google Scholar] [CrossRef]
  45. Vermote, E.; Justice, C.; Claverie, M.; Franch, B. Preliminary analysis of the performance of the Landsat 8/OLI land surface reflectance product. Remote Sens. Environ. 2016, 185, 46–56. [Google Scholar] [CrossRef] [PubMed]
  46. Quintero, N.; Viedma, O.; Urbieta, I.R.; Moreno, J.M. Assessing Landscape Fire Hazard by Multitemporal Automatic Classification of Landsat Time Series Using the Google Earth Engine in West-Central Spain. Forests 2019, 10, 518. [Google Scholar] [CrossRef]
  47. Zhu, Z.; Wang, S.; Woodcock, C.E. Improvement and expansion of the Fmask algorithm: Cloud, cloud shadow, and snow detection for Landsats 4-7, 8, and Sentinel 2 images. Remote Sens. Environ. 2015, 159, 269–277. [Google Scholar] [CrossRef]
  48. Brown, C.F.; Brumby, S.P.; Guzder-Williams, B.; Birch, T.; Hyde, S.B.; Mazzariello, J.; Czerwinski, W.; Pasquarella, V.J.; Haertel, R.; Ilyushchenko, S.; et al. Dynamic World, Near real-time global 10 m land use land cover mapping. Sci. Data 2022, 9, 251. [Google Scholar] [CrossRef]
  49. Chen, B.; Yun, T.; Ma, J.; Kou, W.; Li, H.; Yang, C.; Xiao, X.; Zhang, X.; Sun, R.; Xie, G.; et al. High-Precision Stand Age Data Facilitate the Estimation of Rubber Plantation Biomass: A Case Study of Hainan Island, China. Remote Sens. 2020, 12, 3853. [Google Scholar] [CrossRef]
  50. Farr, T.G.; Rosen, P.A.; Caro, E.; Crippen, R.; Duren, R.; Hensley, S.; Kobrick, M.; Paller, M.; Rodriguez, E.; Roth, L.; et al. The shuttle radar topography mission. Rev. Geophys. 2007, 45, RG2004. [Google Scholar] [CrossRef]
  51. Bullock, E.L.; Woodcock, C.E.; Olofsson, P. Monitoring tropical forest degradation using spectral unmixing and Landsat time series analysis. Remote Sens. Environ. 2020, 238, 110968. [Google Scholar] [CrossRef]
  52. Kursa, M.B.; Rudnicki, W.R. Feature Selection with the Boruta Package. J. Stat. Softw. 2010, 36, 1–13. [Google Scholar] [CrossRef]
  53. Gorelick, N.; Hancher, M.; Dixon, M.; Ilyushchenko, S.; Thau, D.; Moore, R. Google Earth Engine: Planetary-scale geospatial analysis for everyone. Remote Sens. Environ. 2017, 202, 18–27. [Google Scholar] [CrossRef]
  54. Amani, M.; Mahdavi, S.; Afshar, M.; Brisco, B.; Huang, W.; Mohammad Javad Mirzadeh, S.; White, L.; Banks, S.; Montgomery, J.; Hopkinson, C. Canadian Wetland Inventory using Google Earth Engine: The First Map and Preliminary Results. Remote Sens. 2019, 11, 842. [Google Scholar] [CrossRef]
  55. Jin, Y.; Liu, X.; Chen, Y.; Liang, X. Land-cover mapping using Random Forest classification and incorporating NDVI time-series and texture: A case study of central Shandong. Int. J. Remote Sens. 2018, 39, 8703–8723. [Google Scholar] [CrossRef]
  56. Kelley, L.C.; Pitcher, L.; Bacon, C. Using Google Earth Engine to Map Complex Shade-Grown Coffee Landscapes in Northern Nicaragua. Remote Sens. 2018, 10, 952. [Google Scholar] [CrossRef]
  57. Li, X.; Chen, W.; Cheng, X.; Wang, L. A Comparison of Machine Learning Algorithms for Mapping of Complex Surface-Mined and Agricultural Landscapes Using ZiYuan-3 Stereo Satellite Imagery. Remote Sens. 2016, 8, 514. [Google Scholar] [CrossRef]
  58. Maxwell, A.E.; Strager, M.P.; Warner, T.A.; Ramezan, C.A.; Morgan, A.N.; Pauley, C.E. Large-Area, High Spatial Resolution Land Cover Mapping Using Random Forests, GEOBIA, and NAIP Orthophotography: Findings and Recommendations. Remote Sens. 2019, 11, 1409. [Google Scholar] [CrossRef]
  59. Millard, K.; Richardson, M. On the Importance of Training Data Sample Selection in Random Forest Image Classification: A Case Study in Peatland Ecosystem Mapping. Remote Sens. 2015, 7, 8489–8515. [Google Scholar] [CrossRef]
  60. Phan, T.N.; Kuch, V.; Lehnert, L.W. Land Cover Classification using Google Earth Engine and Random Forest Classifier—The Role of Image Composition. Remote Sens. 2020, 12, 2411. [Google Scholar] [CrossRef]
  61. Teluguntla, P.; Thenkabail, P.S.; Oliphant, A.; Xiong, J.; Gumma, M.K.; Congalton, R.G.; Yadav, K.; Huete, A. A 30-m landsat-derived cropland extent product of Australia and China using random forest machine learning algorithm on Google Earth Engine cloud computing platform. ISPRS J. Photogramm. 2018, 144, 325–340. [Google Scholar] [CrossRef]
  62. Rodriguez-Galiano, V.F.; Chica-Rivas, M. Evaluation of different machine learning methods for land cover mapping of a Mediterranean area using multi-seasonal Landsat images and Digital Terrain Models. Int. J. Digit. Earth. 2014, 7, 492–509. [Google Scholar] [CrossRef]
  63. Abdel-Rahman, E.M.; Mutanga, O.; Adam, E.; Ismail, R. Detecting Sirex noctilio grey-attacked and lightning-struck pine trees using airborne hyperspectral data, random forest and support vector machines classifiers. ISPRS J. Photogramm. 2014, 88, 48–59. [Google Scholar] [CrossRef]
  64. Ghimire, B.; Rogan, J.; Rodríguez Galiano, V.; Panday, P.; Neeti, N. An evaluation of bagging, boosting, and random forests for land-cover classification in Cape Cod, Massachusetts, USA. Gisci. Remote Sens. 2012, 49, 623–643. [Google Scholar] [CrossRef]
  65. Congalton, R.G. A review of assessing the accuracy of classifications of remotely sensed data. Remote Sens. Environ. 1991, 37, 35–46. [Google Scholar] [CrossRef]
  66. Liu, C.; Frazier, P.; Kumar, L. Comparative assessment of the measures of thematic classification accuracy. Remote Sens. Environ. 2007, 107, 606–616. [Google Scholar] [CrossRef]
  67. Cheng, K.; Wang, J. Forest Type Classification Based on Integrated Spectral-Spatial-Temporal Features and Random Forest Algorithm—A Case Study in the Qinling Mountains. Forests 2019, 10, 559. [Google Scholar] [CrossRef]
  68. Kumbula, S.; Mafongoya, P.; Peerbhay, K.; Lottering, R.; Ismail, R. Using Sentinel-2 Multispectral Images to Map the Occurrence of the Cossid Moth (Coryphodema tristis) in Eucalyptus Nitens Plantations of Mpumalanga, South Africa. Remote Sens. 2019, 11, 278. [Google Scholar] [CrossRef]
  69. Persson, M.; Lindberg, E.; Reese, H. Tree Species Classification with Multi-Temporal Sentinel-2 Data. Remote Sens. 2018, 10, 1794. [Google Scholar] [CrossRef]
  70. Li, P.; Zhang, J.; Feng, Z. Mapping rubber tree plantations using a Landsat-based phenological algorithm in Xishuangbanna, southwest China. Remote Sens Lett. 2015, 6, 49–58. [Google Scholar] [CrossRef]
  71. Han, P.; Chen, J.; Han, Y.; Yi, L.; Zhang, Y.; Jiang, X. Monitoring rubber plantation distribution on Hainan Island using Landsat OLI imagery. Int. J. Remote Sens. 2018, 39, 2189–2206. [Google Scholar] [CrossRef]
  72. Punalekar, S.M.; Planque, C.; Lucas, R.M.; Evans, D.; Correia, V.; Owers, C.J.; Poslajko, P.; Bunting, P.; Chognard, S. National scale mapping of larch plantations for Wales using the Sentinel-2 data archive. For. Ecol. Manag. 2021, 501, 119679. [Google Scholar] [CrossRef]
  73. Grabska, E.; Hostert, P.; Pflugmacher, D.; Ostapowicz, K. Forest Stand Species Mapping Using the Sentinel-2 Time Series. Remote Sens. 2019, 11, 1197. [Google Scholar] [CrossRef]
  74. Sun, Z.; Wu, D.; Lv, Y.; Lu, S. Optical Properties of Reflected Light from Leaves: A Case Study from One Species. IEEE Trans. Geosci. Remote 2019, 57, 4388–4406. [Google Scholar] [CrossRef]
  75. Sibanda, M.; Buthelezi, S.; Ndlovu, H.S.; Mothapo, M.C.; Mutanga, O. Mapping the Eucalyptus spp woodlots in communal areas of Southern Africa using Sentinel-2 Multi-Spectral Imager data for hydrological applications. Phys. Chem. Earth Parts A/B/C 2021, 122, 102999. [Google Scholar] [CrossRef]
  76. Koskinen, J.; Leinonen, U.; Vollrath, A.; Ortmann, A.; Lindquist, E.; D’Annunzio, R.; Pekkarinen, A.; Käyhkö, N. Participatory mapping of forest plantations with Open Foris and Google Earth Engine. ISPRS J. Photogramm. 2019, 148, 63–74. [Google Scholar] [CrossRef]
  77. Long, Y.; Li, X. Ecological Review of Eucalyptus Industry Development in Southern Region under the Perspective of “Two Mountains” Theory. J. Nanning Coll. Vocat. Technol. 2023, 31, 54–65. [Google Scholar]
  78. Ni, G. Water use strategies of alien trees and their impacts on water resource. Acta Ecol. Sin. 2021, 41, 934–942. [Google Scholar]
  79. Dye, P. A review of changing perspectives on Eucalyptus water-use in South Africa. For. Ecol. Manag. 2013, 301, 51–57. [Google Scholar] [CrossRef]
  80. Marais, C.; Wannenburgh, A.M. Restoration of water resources (natural capital) through the clearing of invasive alien plants from riparian areas in South Africa—Costs and water benefits. S. Afr. J. Bot. 2008, 74, 526–537. [Google Scholar] [CrossRef]
  81. Scott, D.F. Managing riparian zone vegetation to sustain streamflow: Results of paired catchment experiments in South Africa. Can. J. For. Res. 1999, 29, 1149–1157. [Google Scholar] [CrossRef]
  82. Modiba, R.V.; Joseph, G.S.; Seymour, C.L.; Fouché, P.; Foord, S.H. Restoration of riparian systems through clearing of invasive plant species improves functional diversity of Odonate assemblages. Biol. Conserv. 2017, 214, 46–54. [Google Scholar] [CrossRef]
  83. China Forestry Publishing House. Forest Law of the People’s Repubic of China; China Forestry Publishing House: Beijing, China, 2020. [Google Scholar]
  84. Qin, Y. Analysis on the development status of eucalyptus industry and its impact on ecological environment. South China Agric. 2019, 13, 115–116. [Google Scholar]
  85. Lin, W. Eucalyptus Robusta Planting Status and Sustainable Development Countermeasures Based on Ecological Concept. For. Sci. Technol. Inf. 2020, 52, 23–25. [Google Scholar]
  86. Lv, H. Current status of eucalyptus plantations and sustainable development strategies. Agric. Technol. Serv. 2020, 37, 115–116. [Google Scholar]
  87. Liu, D. Discussion on ecological issues and sustainable development of eucalyptus plantations. Seed Sci. Technol. 2021, 39, 137–138. [Google Scholar]
Figure 1. Location of the study area, including the topography and ground samples distribution generated in the Python package geemap 0.29.6 (https://geemap.org/, accessed on 20 December 2023).
Forests 15 00925 g001
Figure 2. Workflow of identification eucalyptus plantation.
Forests 15 00925 g002
Figure 3. Importance ranking of the potential classification features. Slope, Aspect, and Elevation are terrain features; Shade is the shadow endmember; GREEN, SWIR1, SWIR2, NIR, BLUE, and RED are spectral features; Shade_INTP, Soil_INTP, GV_SIN, Shade_COS, NPV_COS, Shade_SIN, Shade_SIN2, Soil_SIN, Soil_SIN3, GV_SLP, Shade_SLP, Shade_COS2, GV_COS2, GV_INTP, NPV_SIN2, GV_COS, NPV_SIN, NDFI_SLP, NDFI_SIN2, Soil_COS2, Soil_SLP, NPV_INTP, NDFI_COS, GV_SIN2, NDFI_COS3, NDFI_COS2, Shade_SIN3, and GV_SIN3 are harmonic model fitting coefficients; Shade_RMSE, GV_RMSE, and NDFI_RMSE are spectral phase coefficients; NBR, EVI, GNDVI, NDWI, and NDVI are vegetation indices.
Forests 15 00925 g003
Figure 4. Scatter plots with linear regression of the observed and estimated stand ages (estimated stand ages were estimated from the breakpoints identified by CCDC).
Forests 15 00925 g004
Figure 5. (a,d) Spatial and stand age distributions of the 2022 eucalyptus plantations on Hainan Island, (b,c,e,f) zoom view of eucalyptus plantations, and (g,h) extremely high-resolution satellite image from Google Earth showing eucalyptus plantations (109.424898° E, 19.767752° N and 109.59786° E, 19.10863° N), generated with the ArcGIS 10.8 software (www.esri.com, accessed on 20 January 2024).
Forests 15 00925 g005
Figure 6. (a) Area of eucalyptus plantations by city (county) level, (b) percentage of eucalyptus plantations in different elevations and percentage of land area in different elevations, (c) percentage of eucalyptus plantations in different slopes and percentage of land area in different slopes, and (d) area of eucalyptus plantations stand age on Hainan Island.
Forests 15 00925 g006
Figure 7. (a) Spatial distributions of eucalyptus plantations in major river buffer zones, generated with the ArcGIS 10.8 software (www.esri.com, accessed on 20 January 2024), and (b) areas of the mapped eucalyptus plantations in major river buffer zones.
Forests 15 00925 g007
Figure 8. Comparison of (a) Shade_INTP and (b) GREEN values in eucalyptus plantations and other broadleaved forests.
Forests 15 00925 g008
Table 1. The validation accuracy of the RF-based eucalyptus plantations classifications.
ClassifiedGround ReferenceTotalPA (%)
Eucalyptus PlantationNon-Eucalyptus Plantation
Eucalyptus plantation154816295.06
Non-eucalyptus plantation79510293.14
Total161103264-
UA (%)95.6592.23-94.32
Overall accuracy = 94.32%
Kappa coefficient = 0.88
Disclaimer/Publisher’s Note: The statements, opinions and data contained in all publications are solely those of the individual author(s) and contributor(s) and not of MDPI and/or the editor(s). MDPI and/or the editor(s) disclaim responsibility for any injury to people or property resulting from any ideas, methods, instructions or products referred to in the content.

