

Moisture and Temperature Profiles of Heartwood Pinus pinaster Ait. Wood Specimens during Microwave Drying

 , ,
, ,  and
and 
Abstract
1. Introduction
2. Experimental
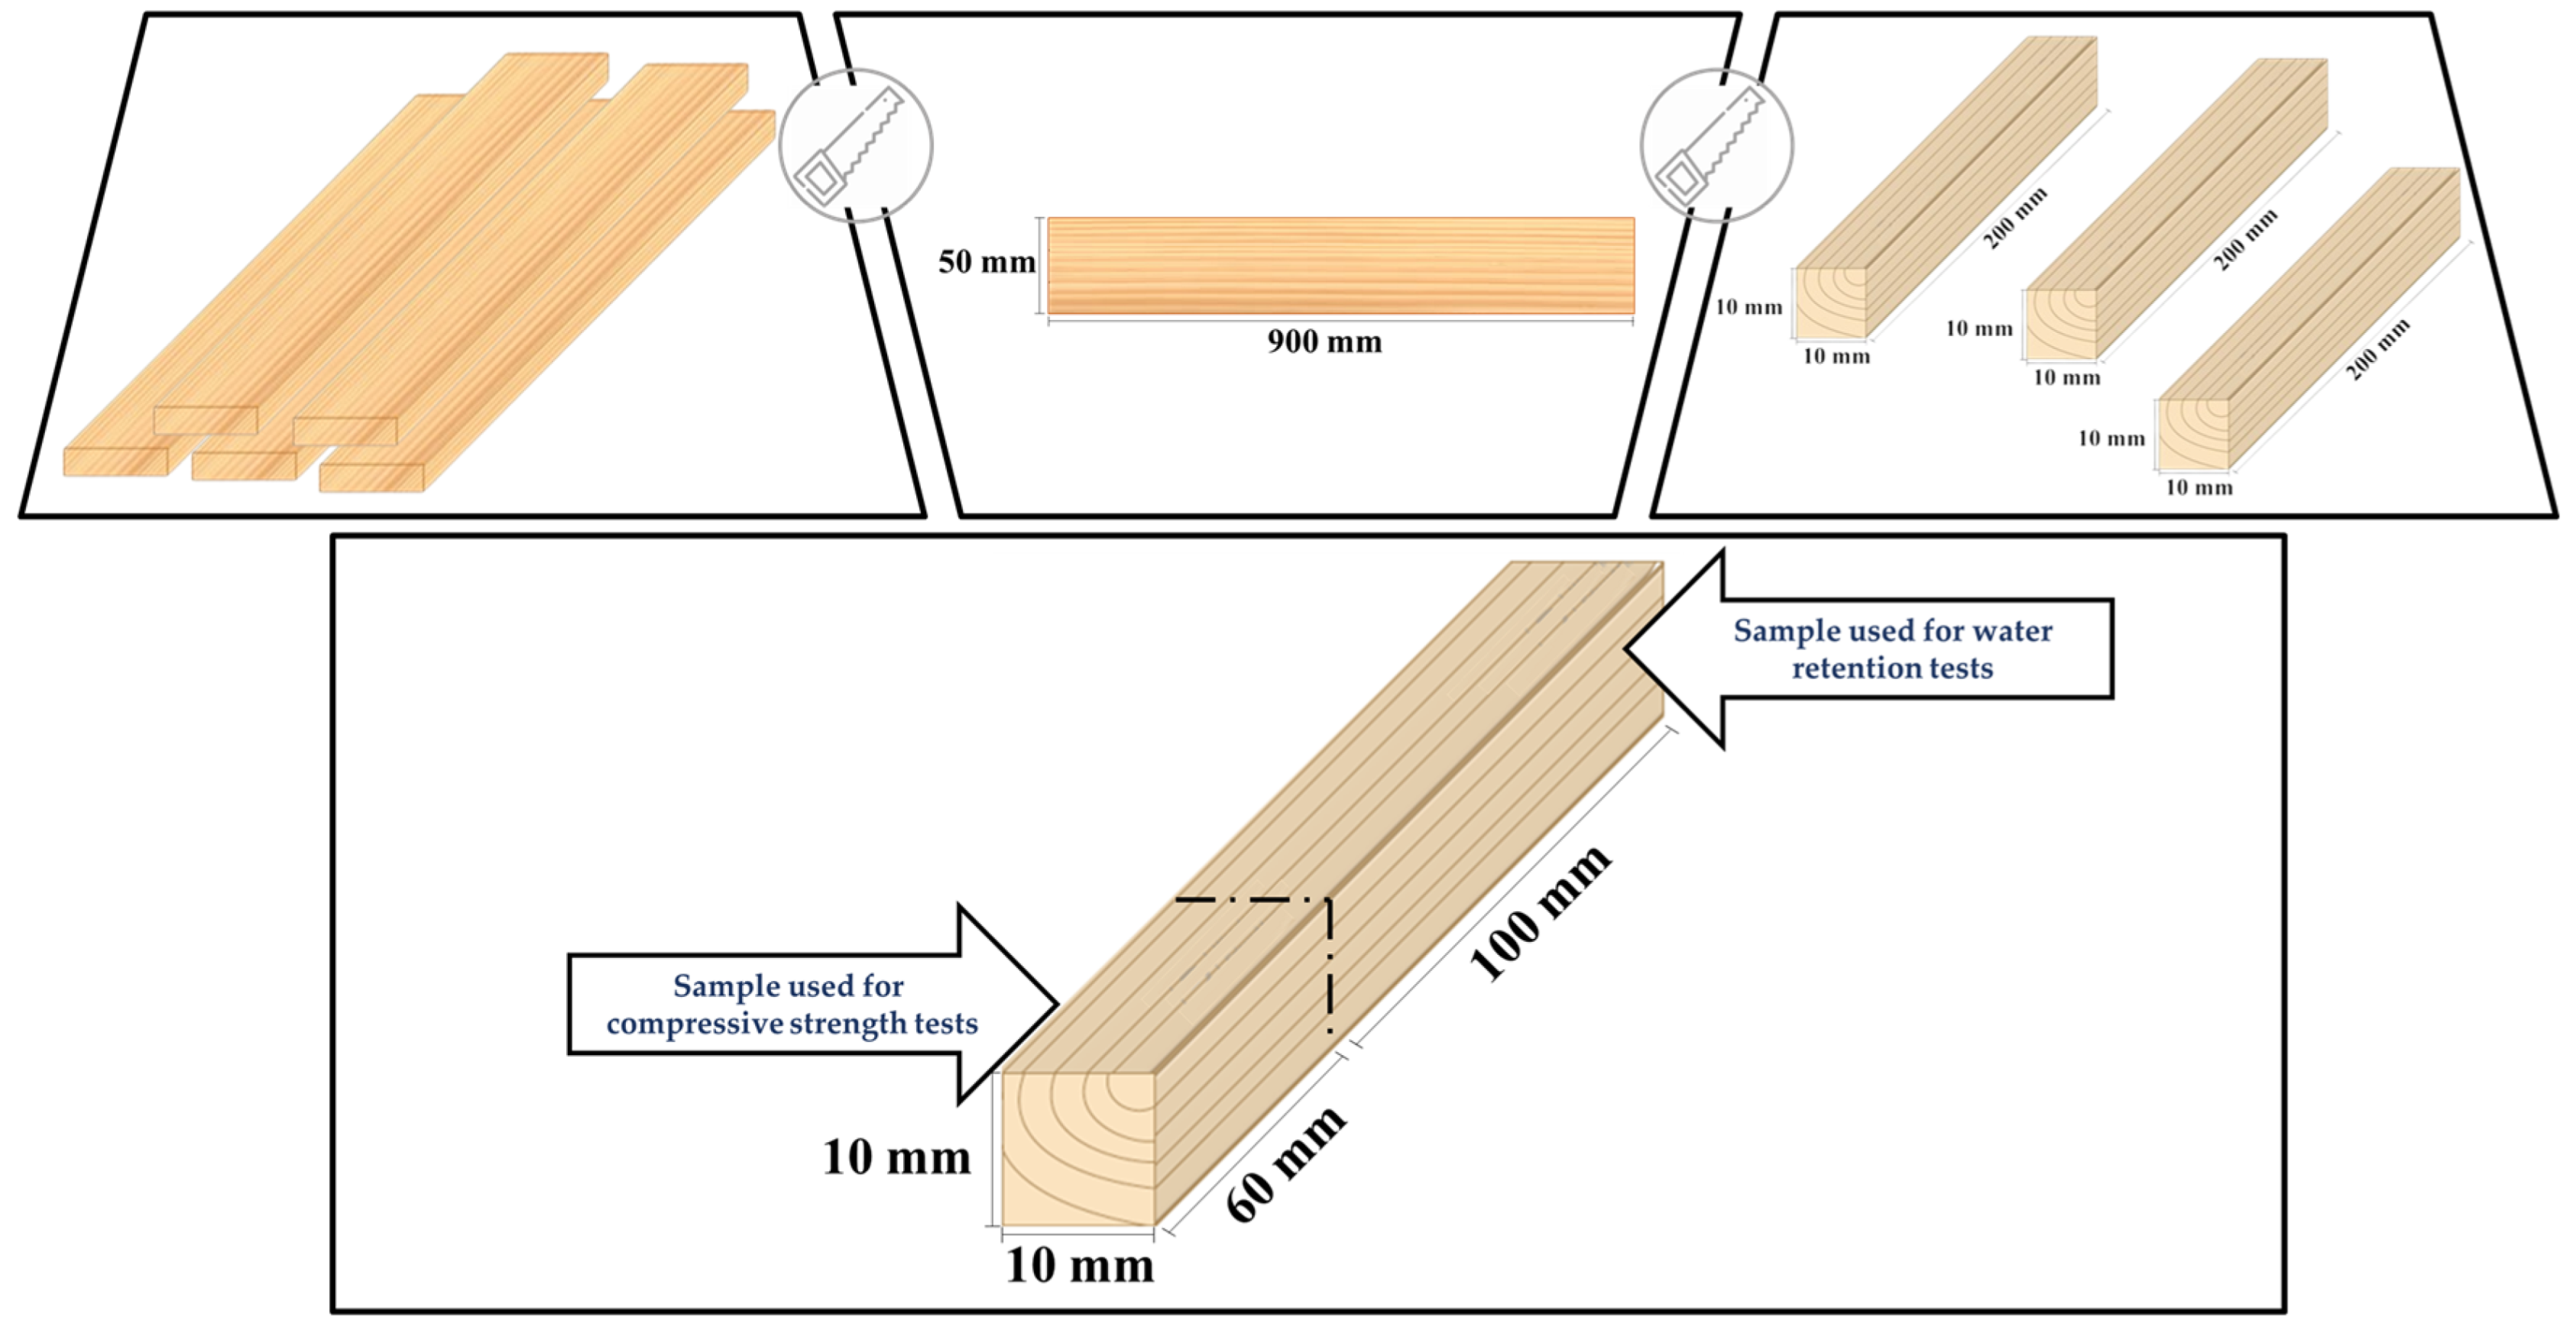
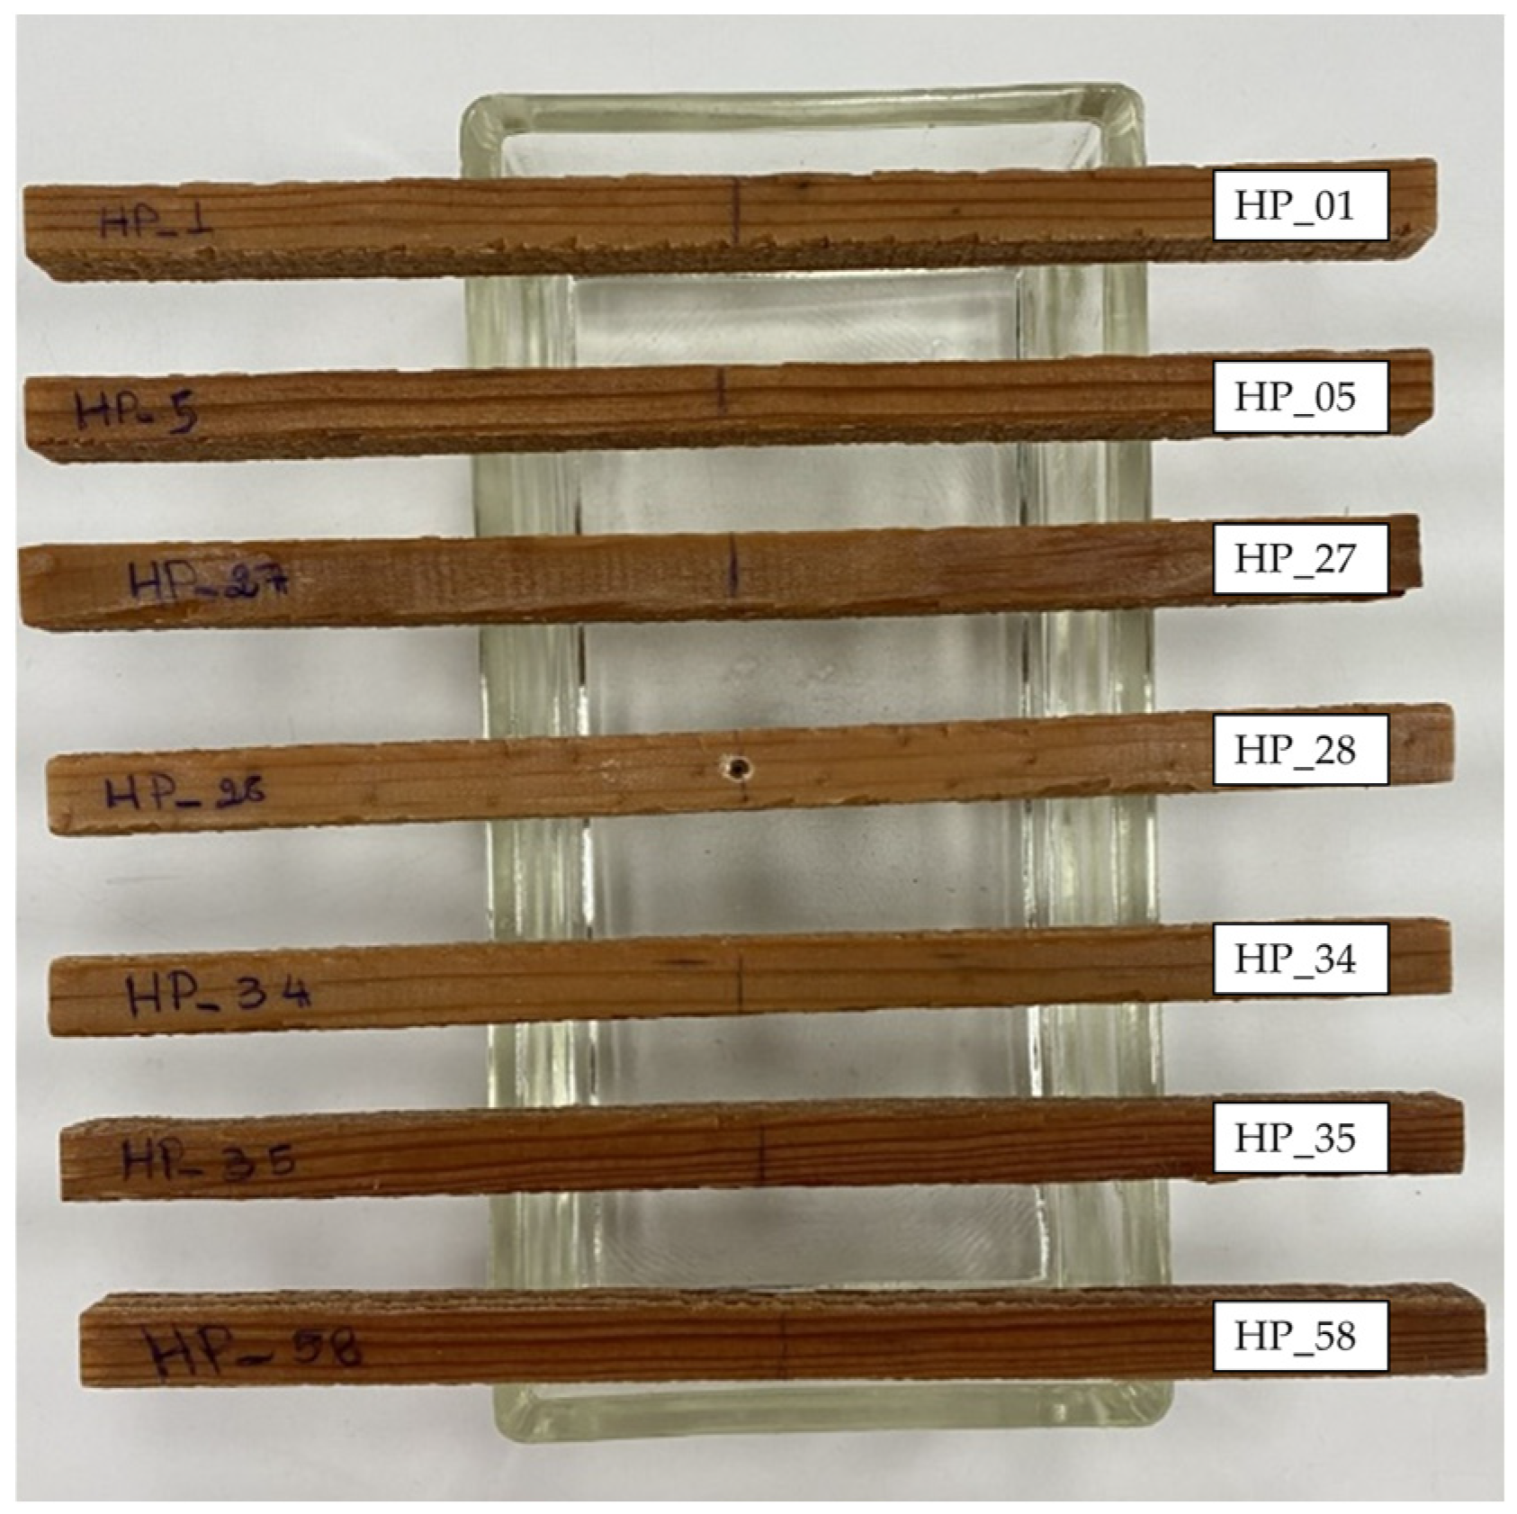
2.1. Material
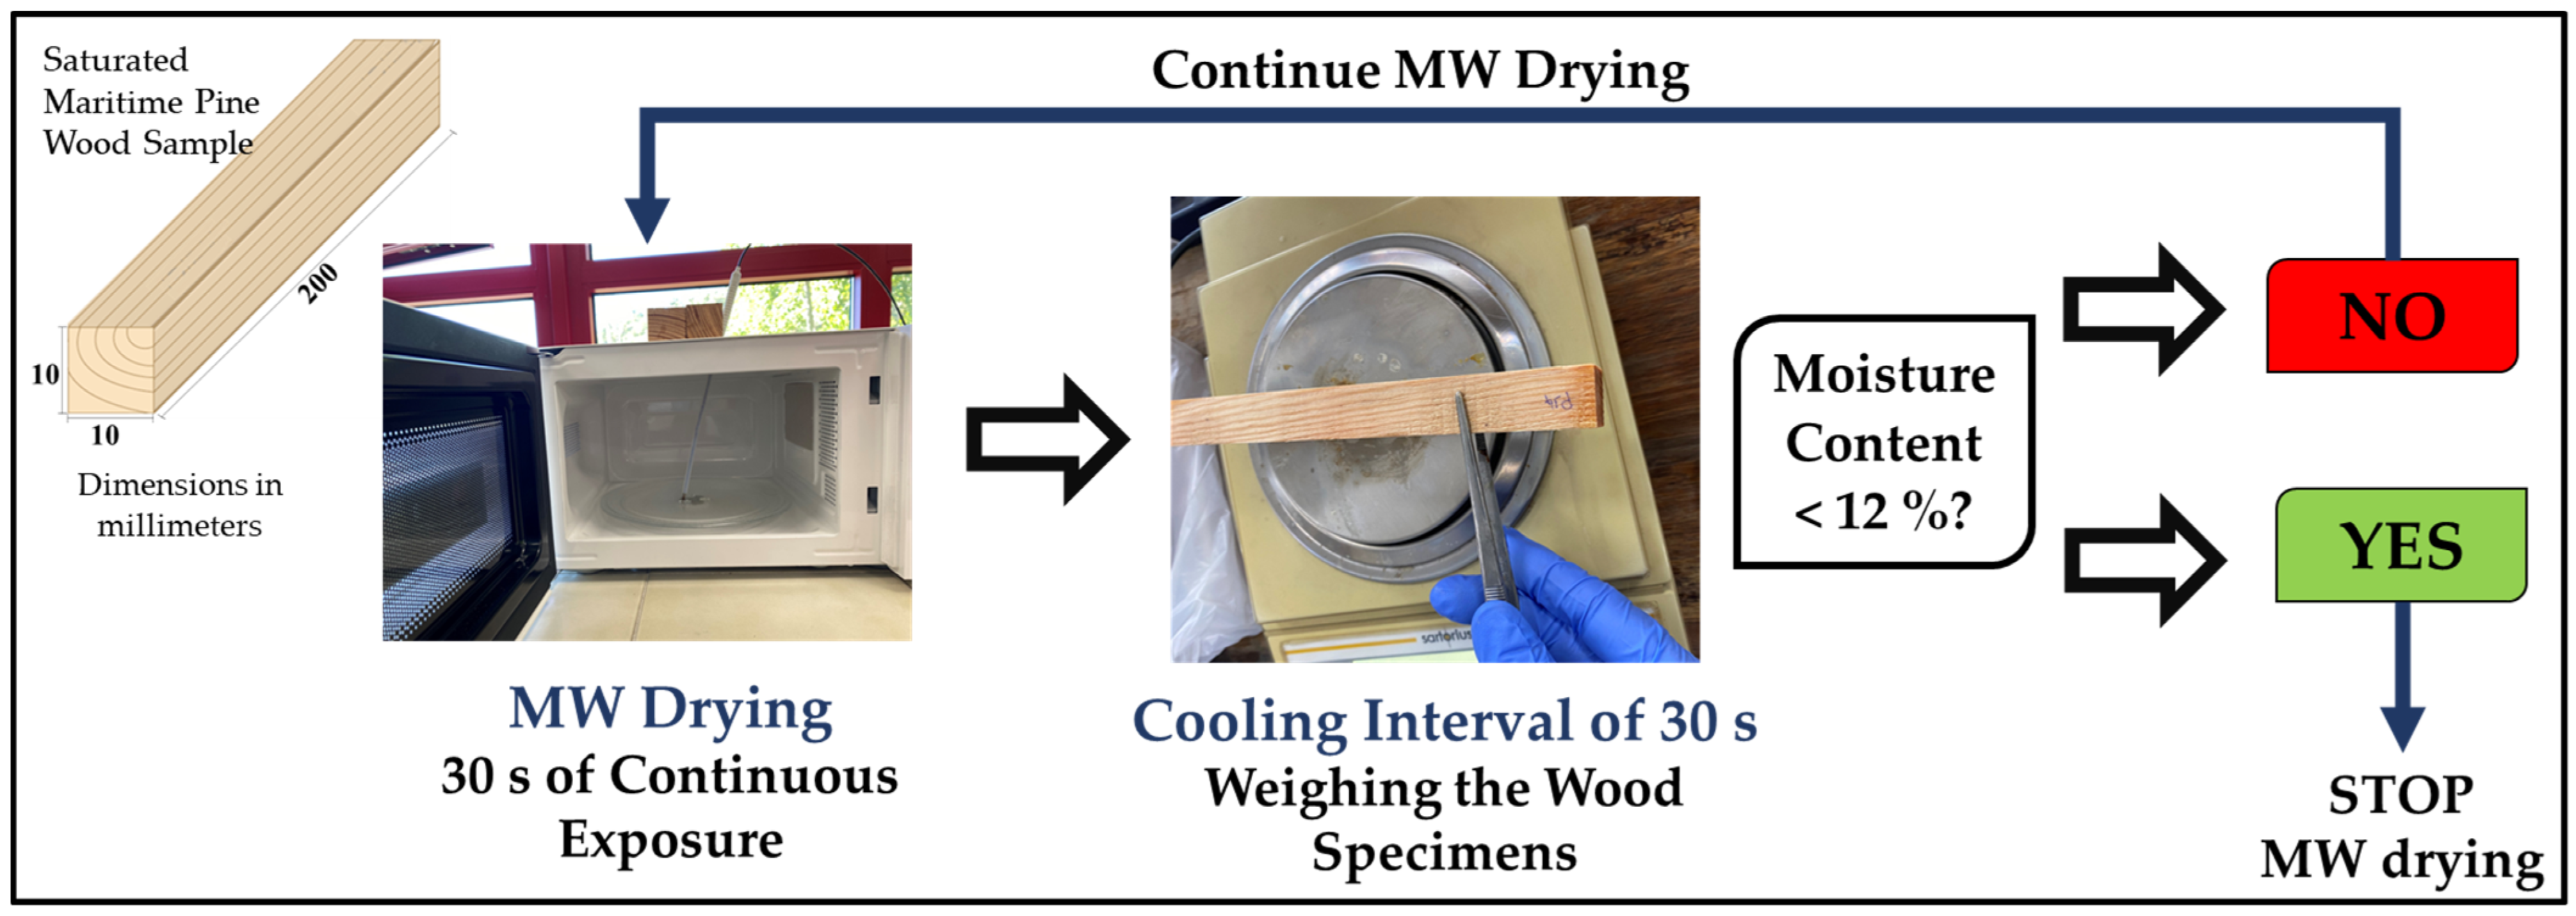
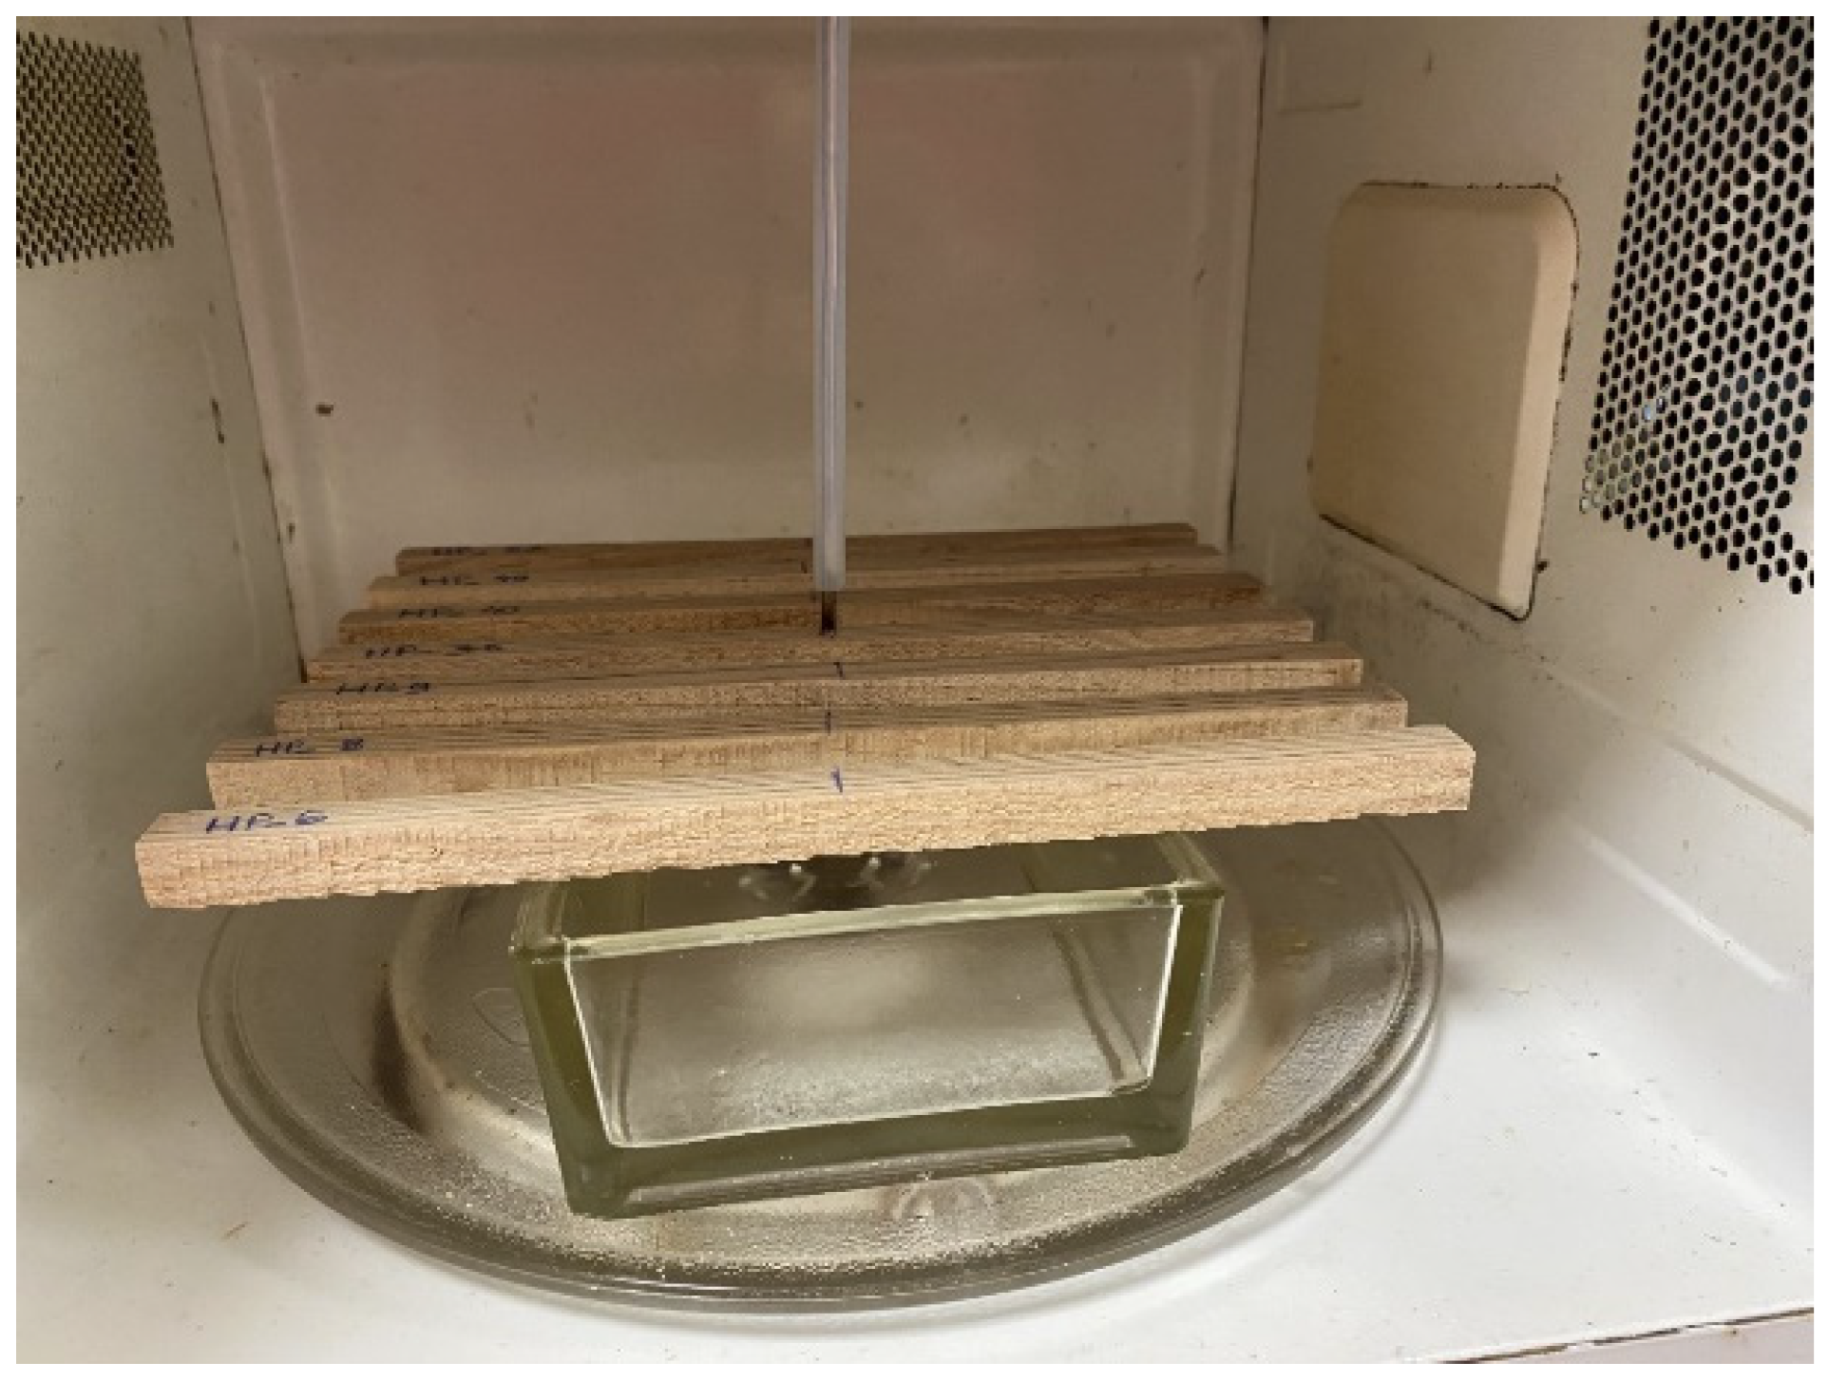
2.2. Microwave Drying
2.3. Temperature Measurements
2.4. Water Uptake and Compressive Strength Parallel to the Grain Tests
2.5. Analysis of the Results
3. Results and Discussion
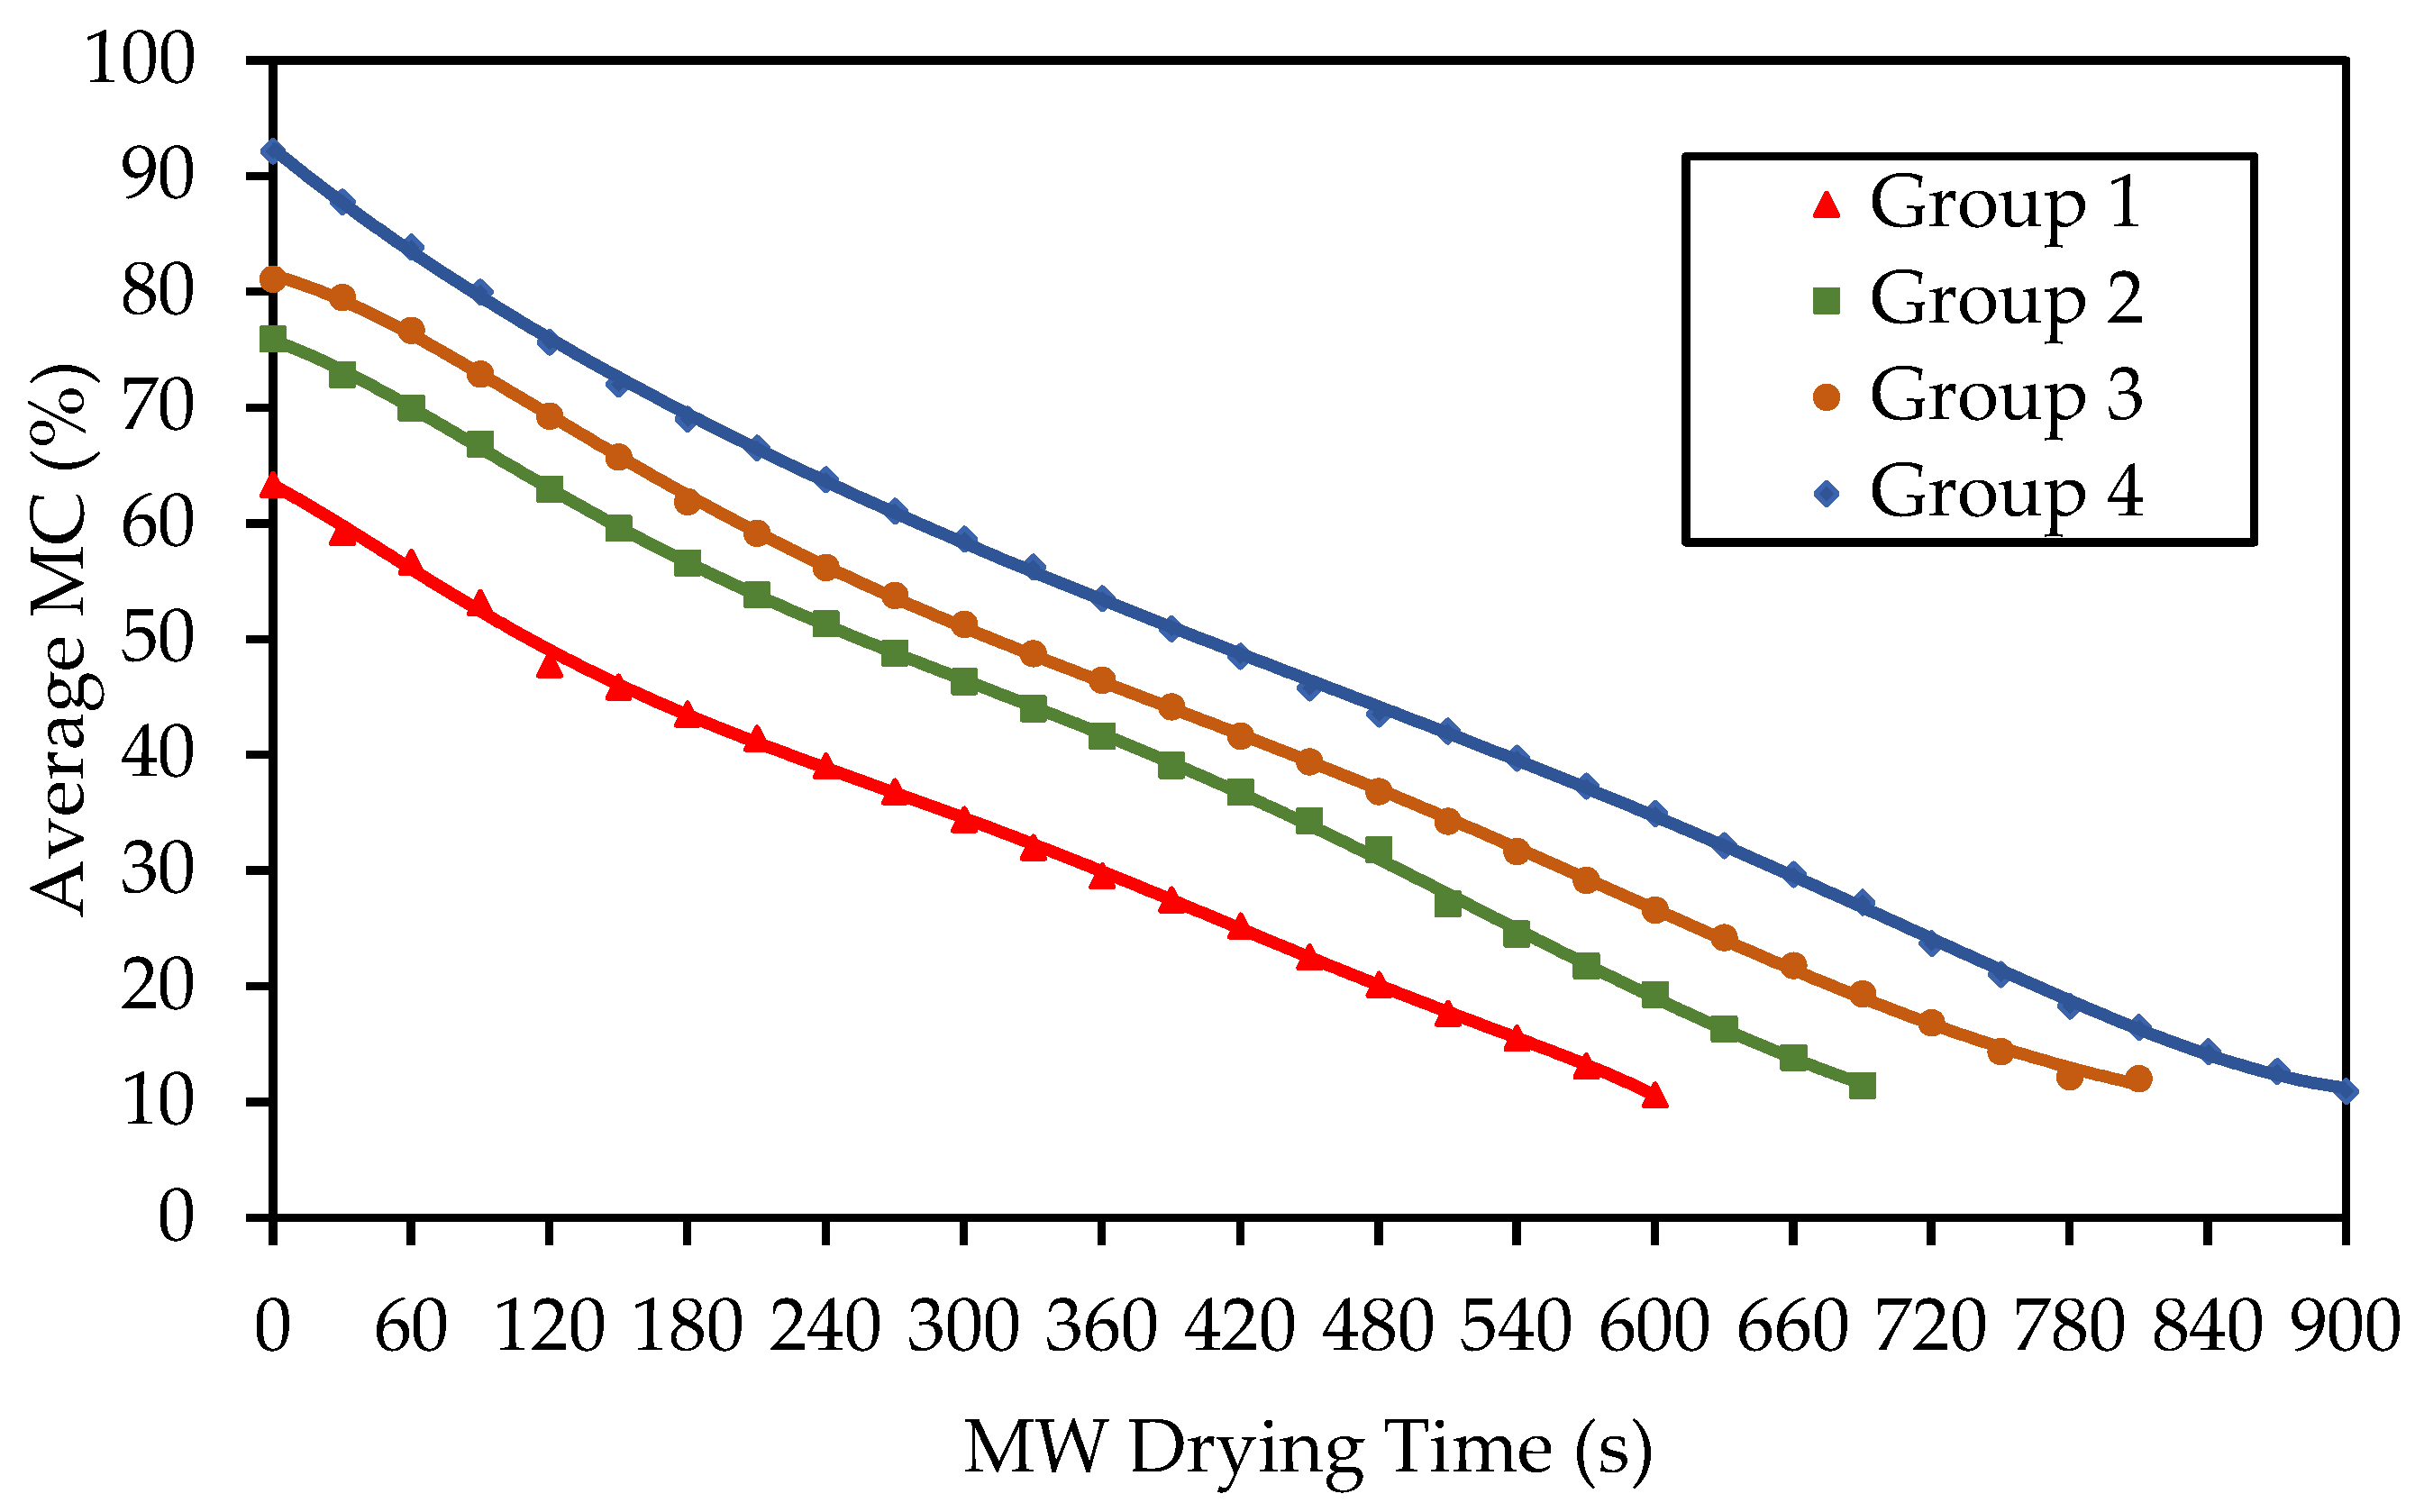
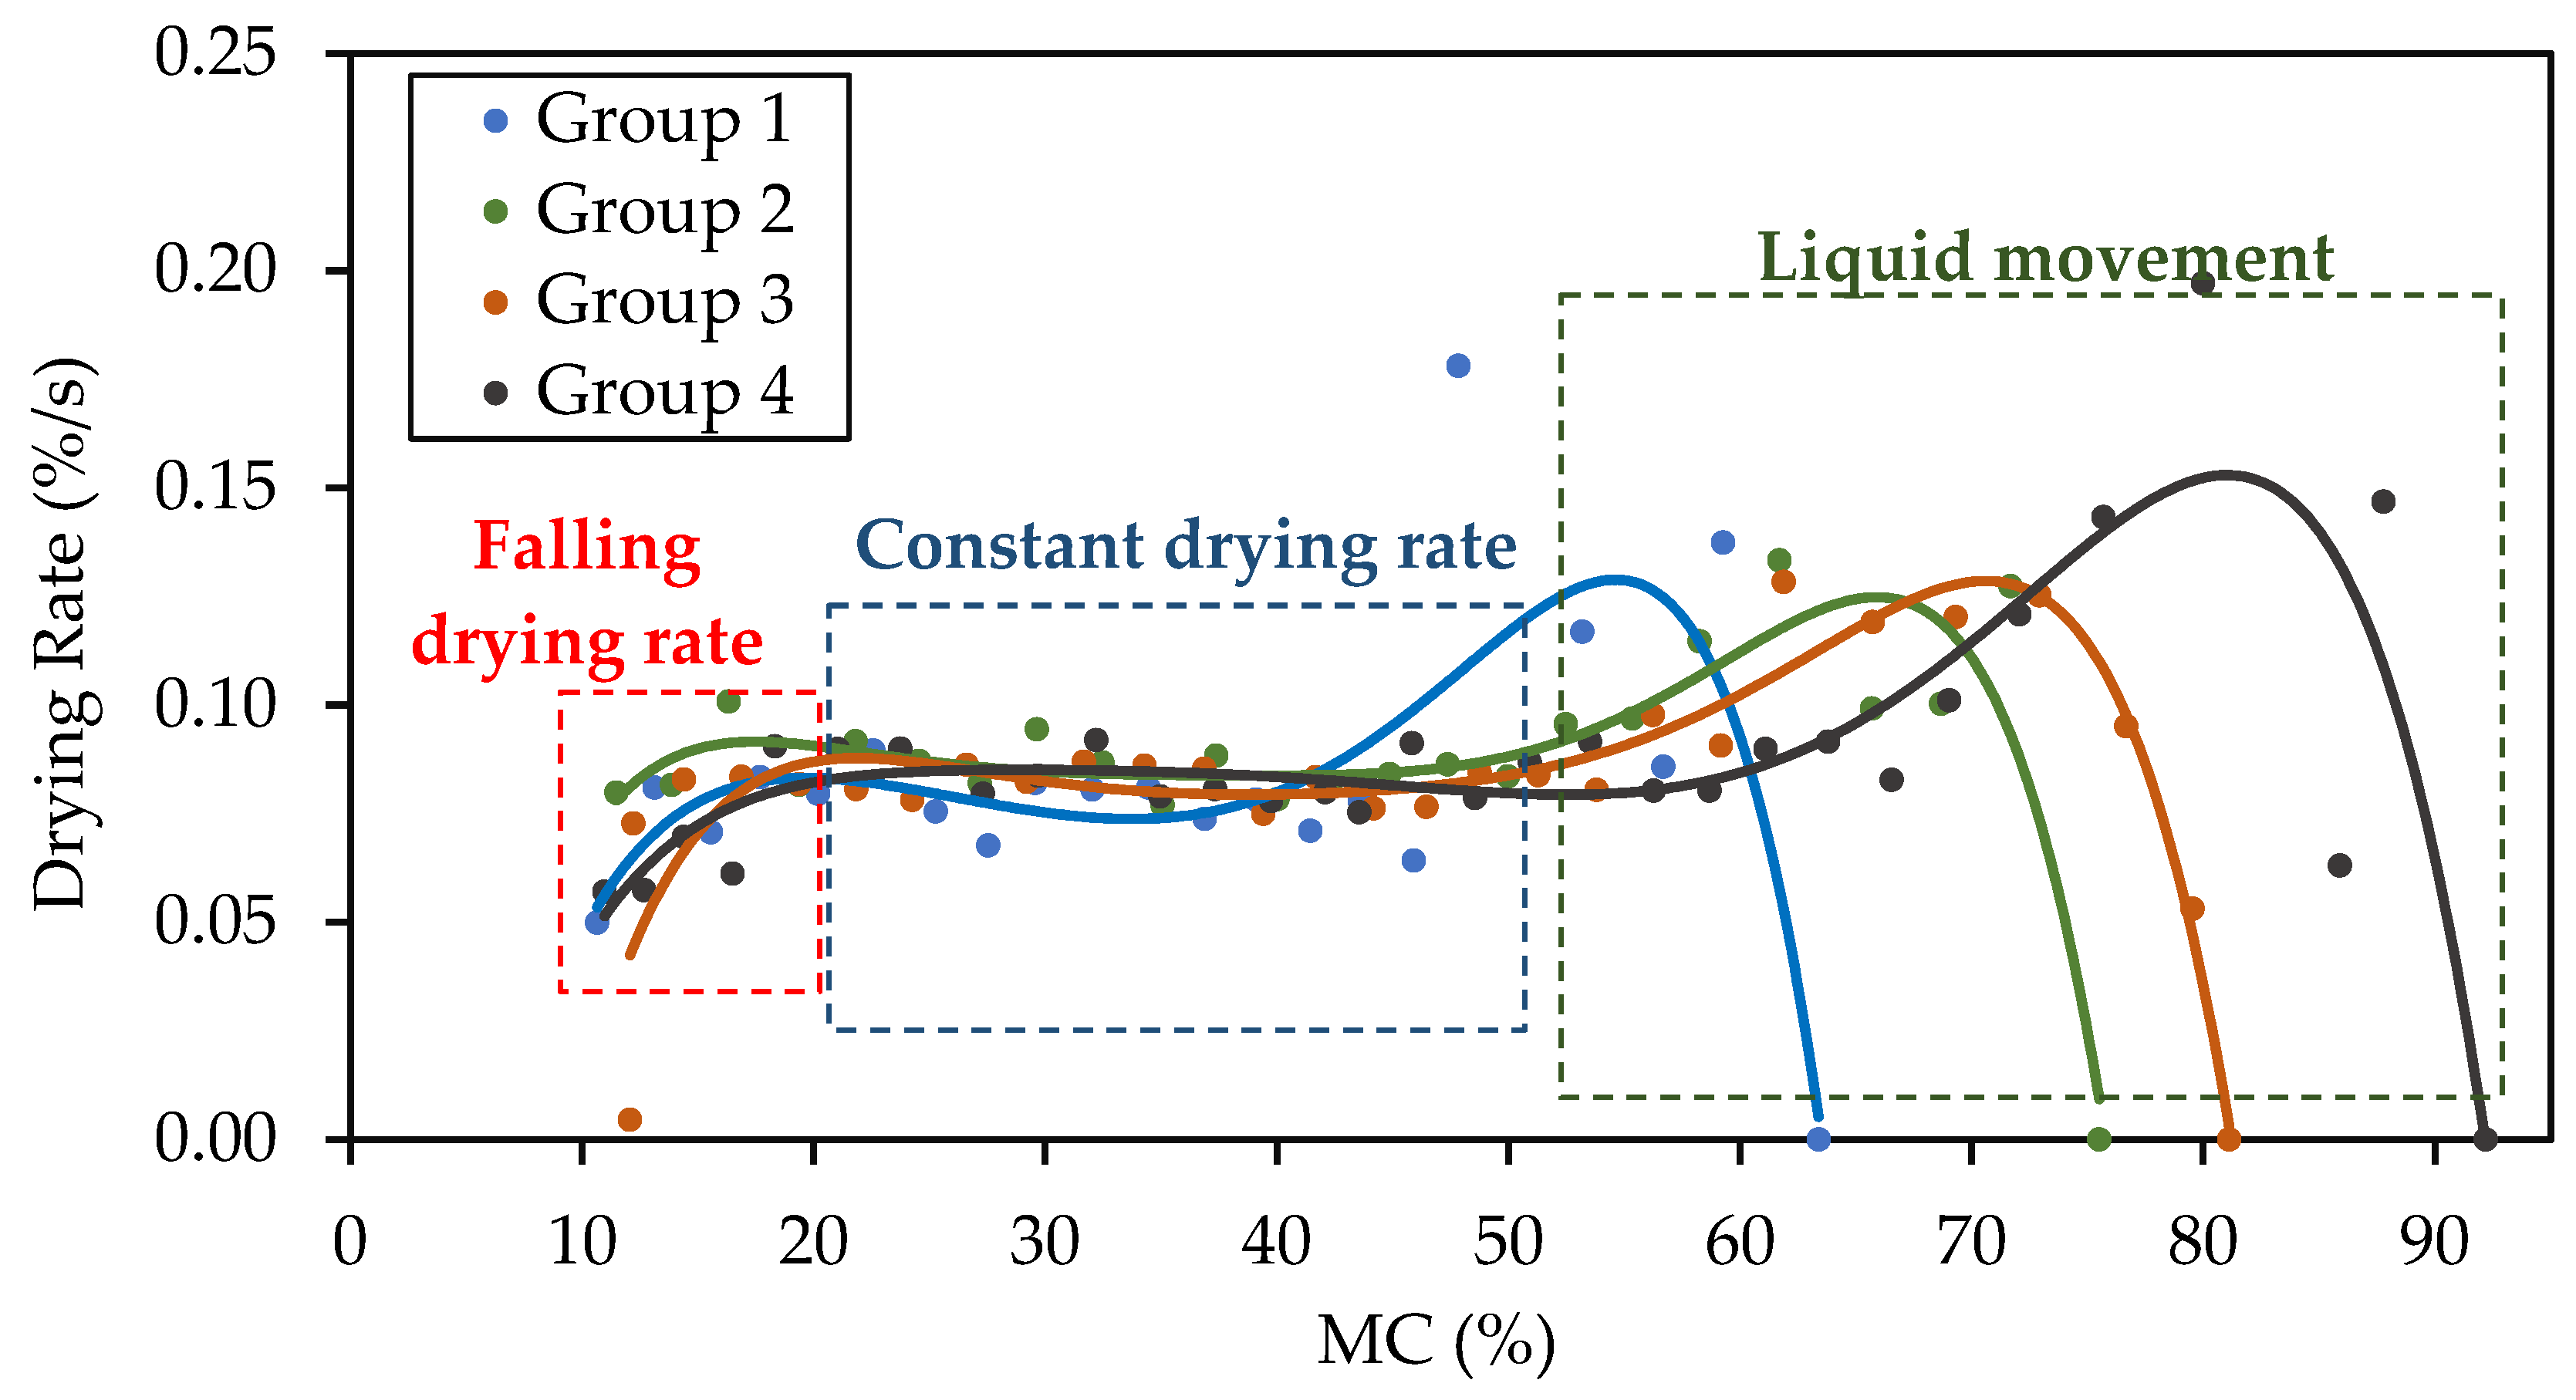
3.1. MW Drying Profile
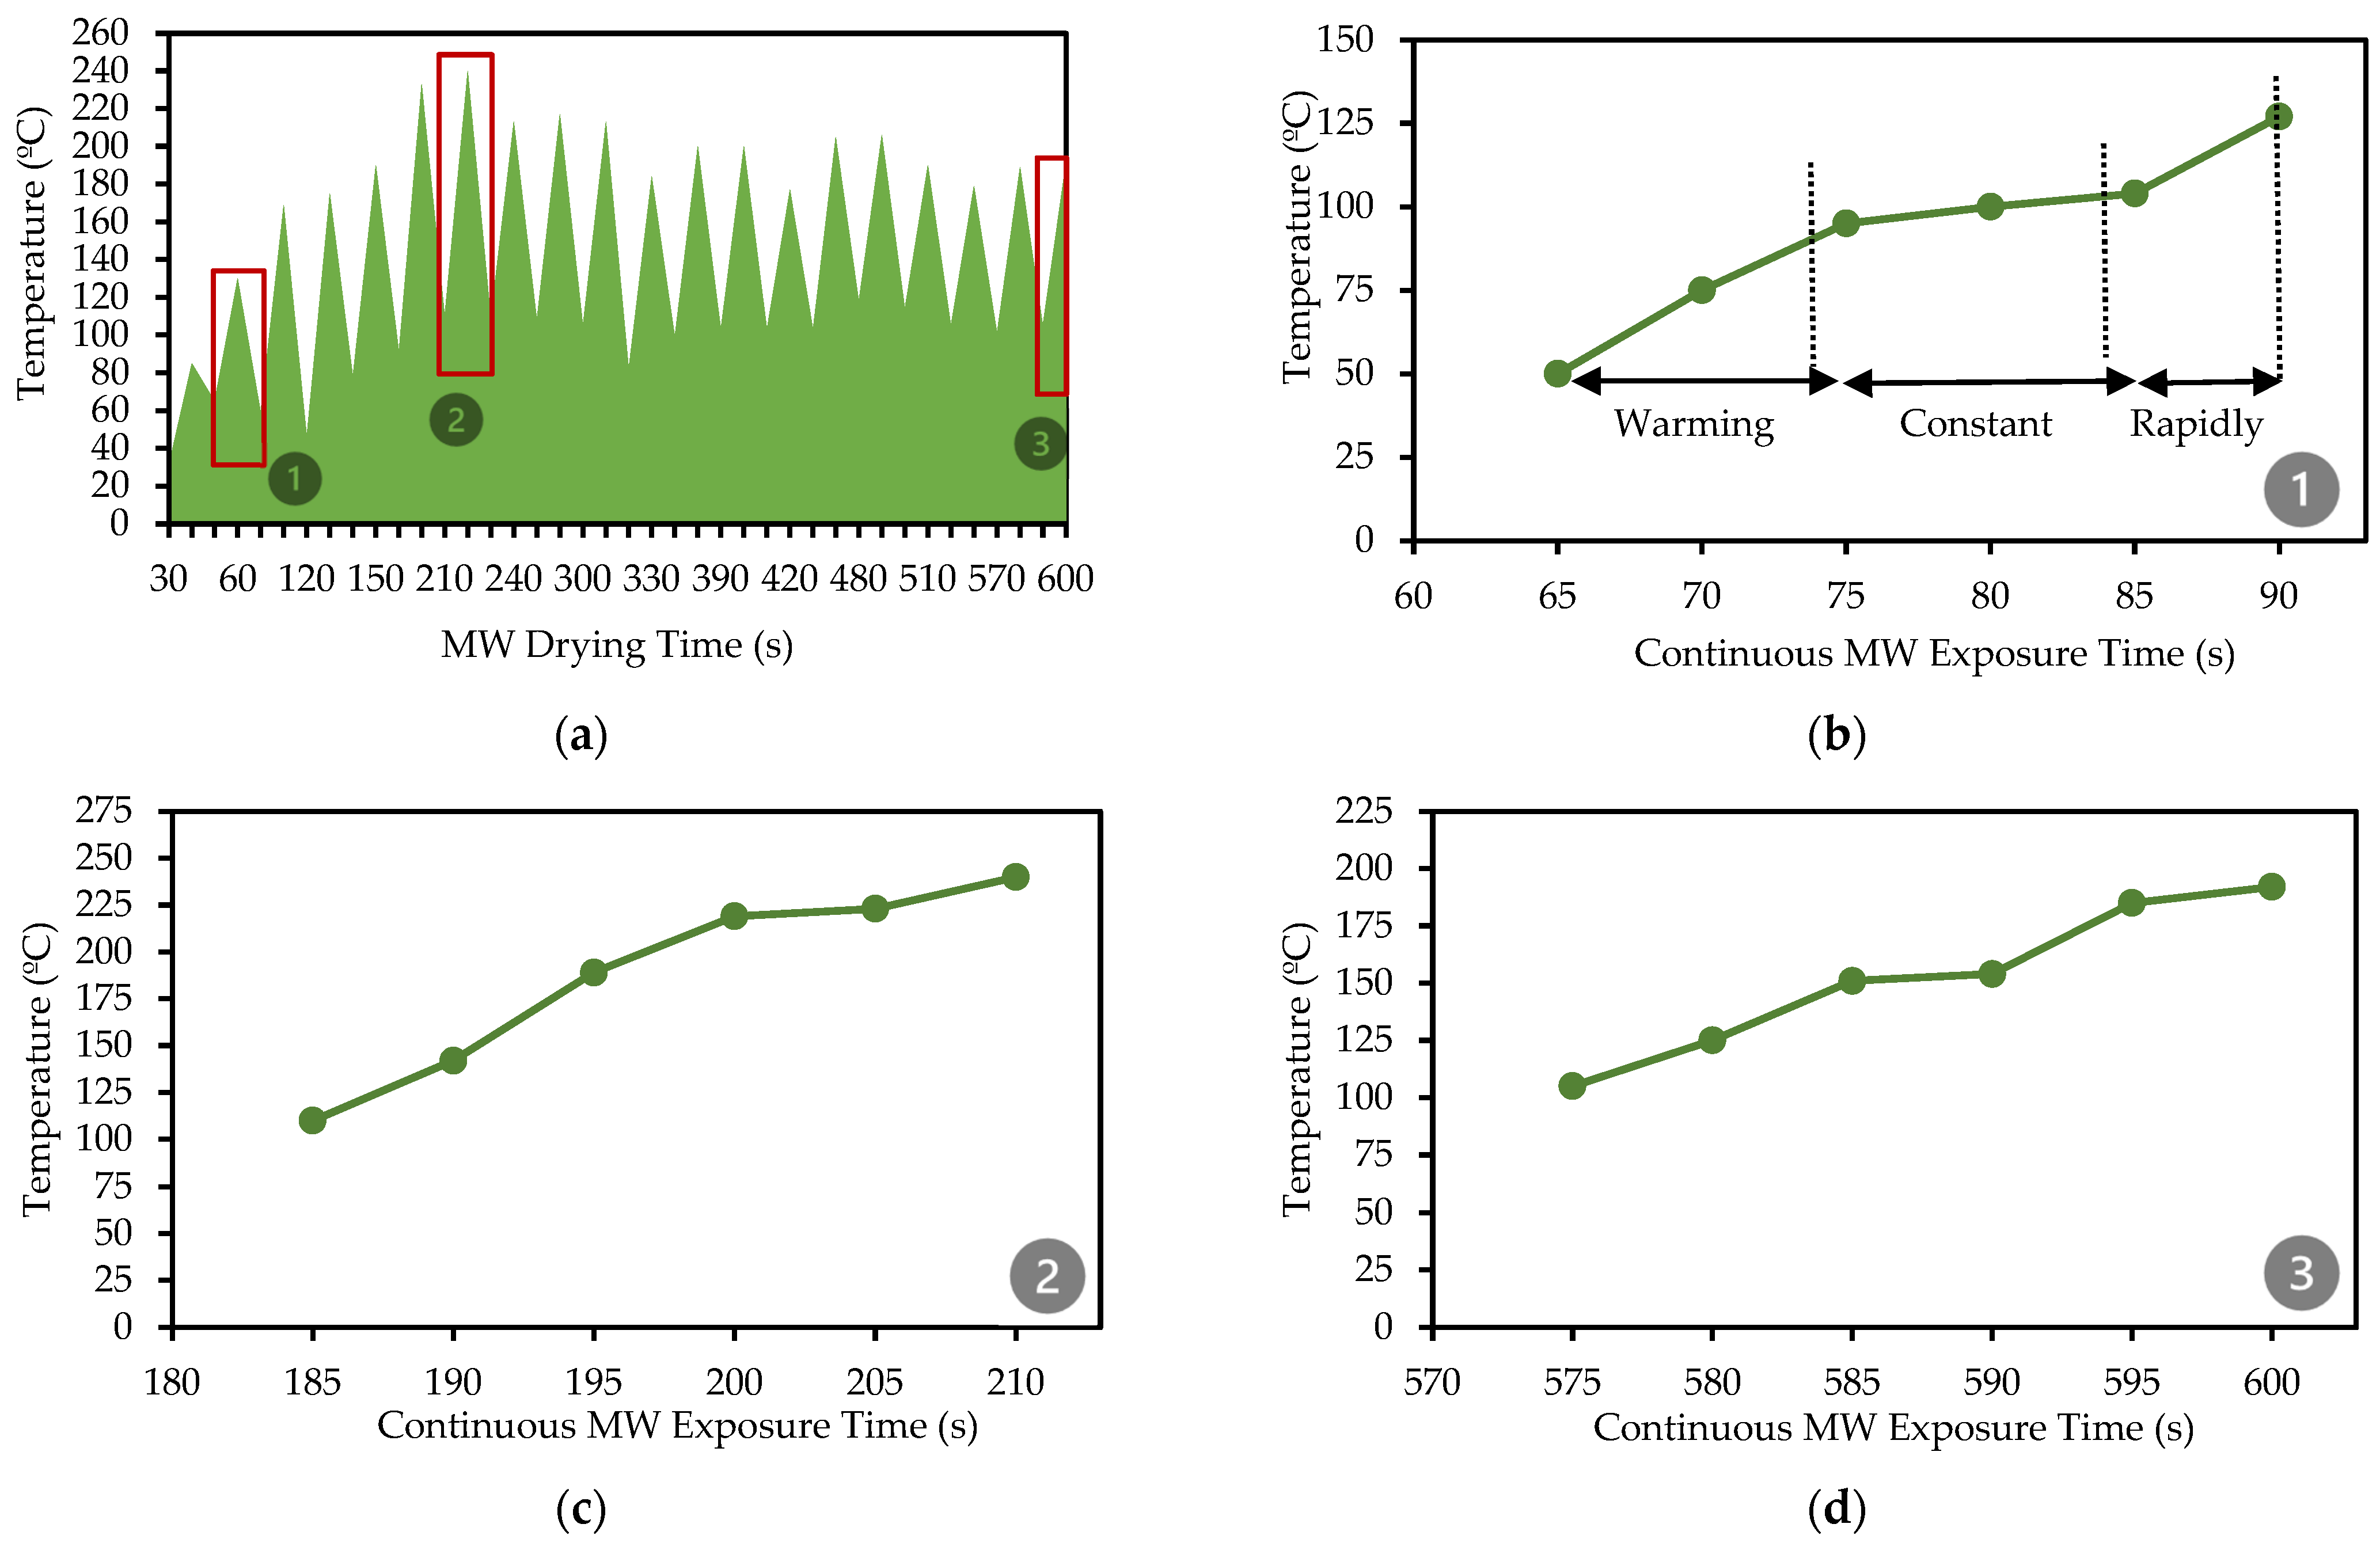
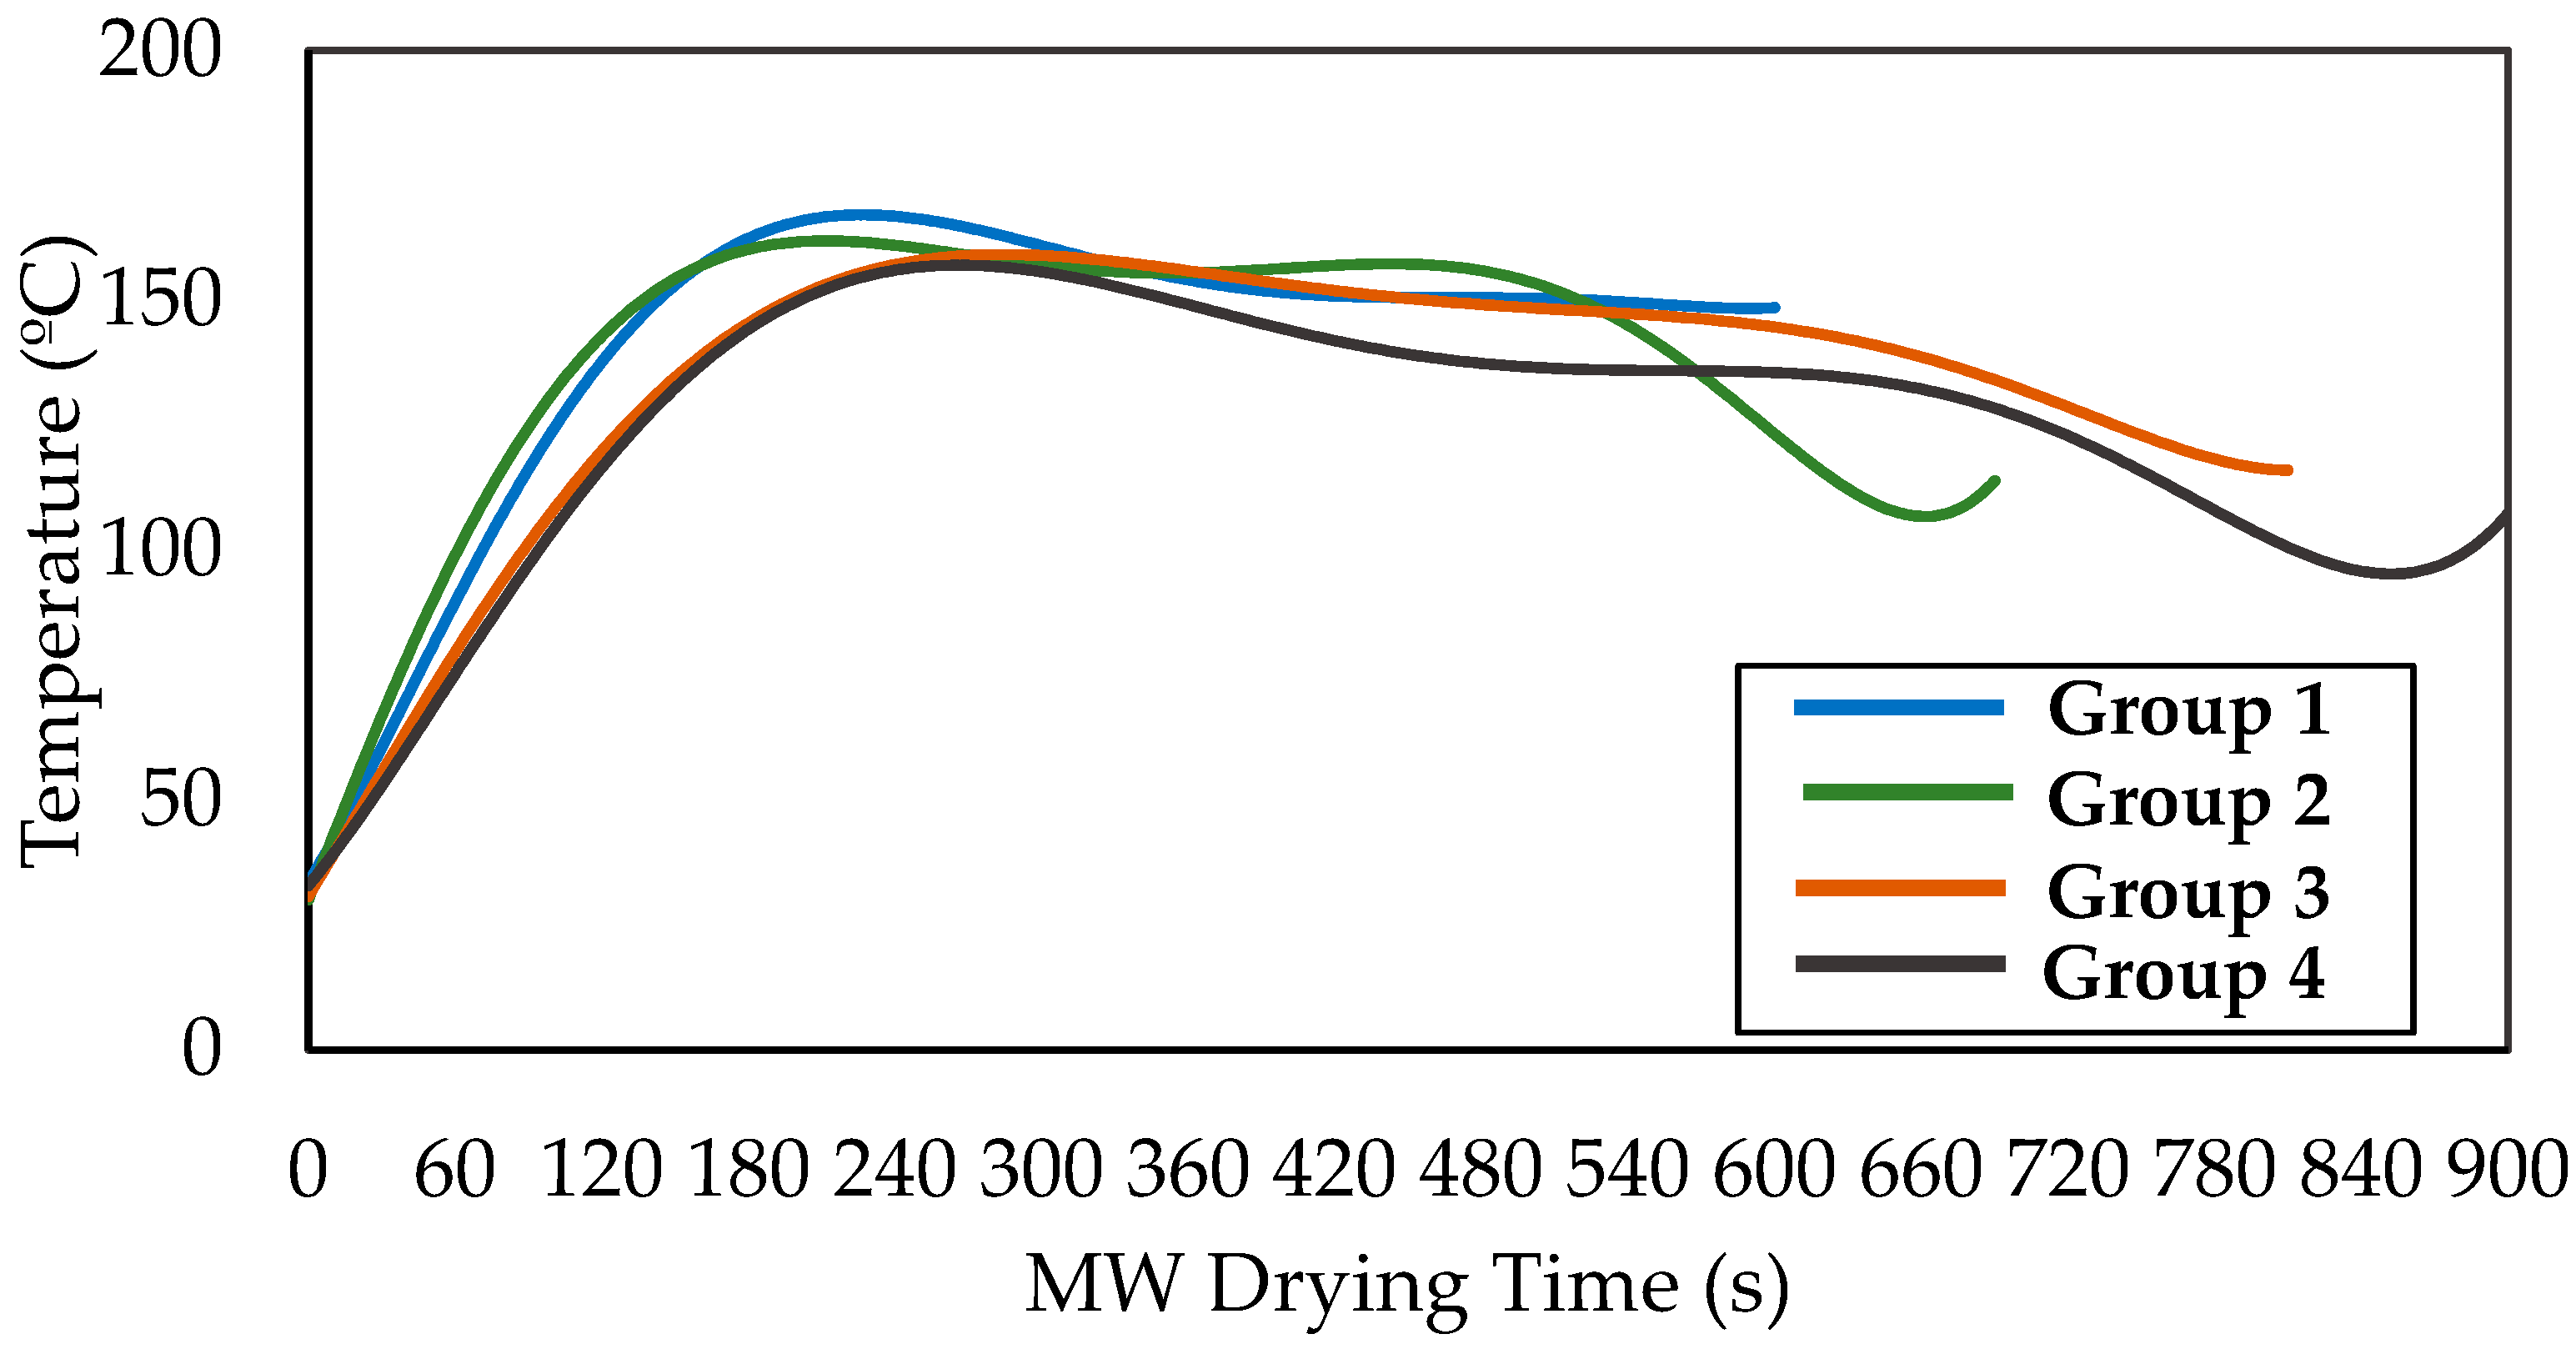
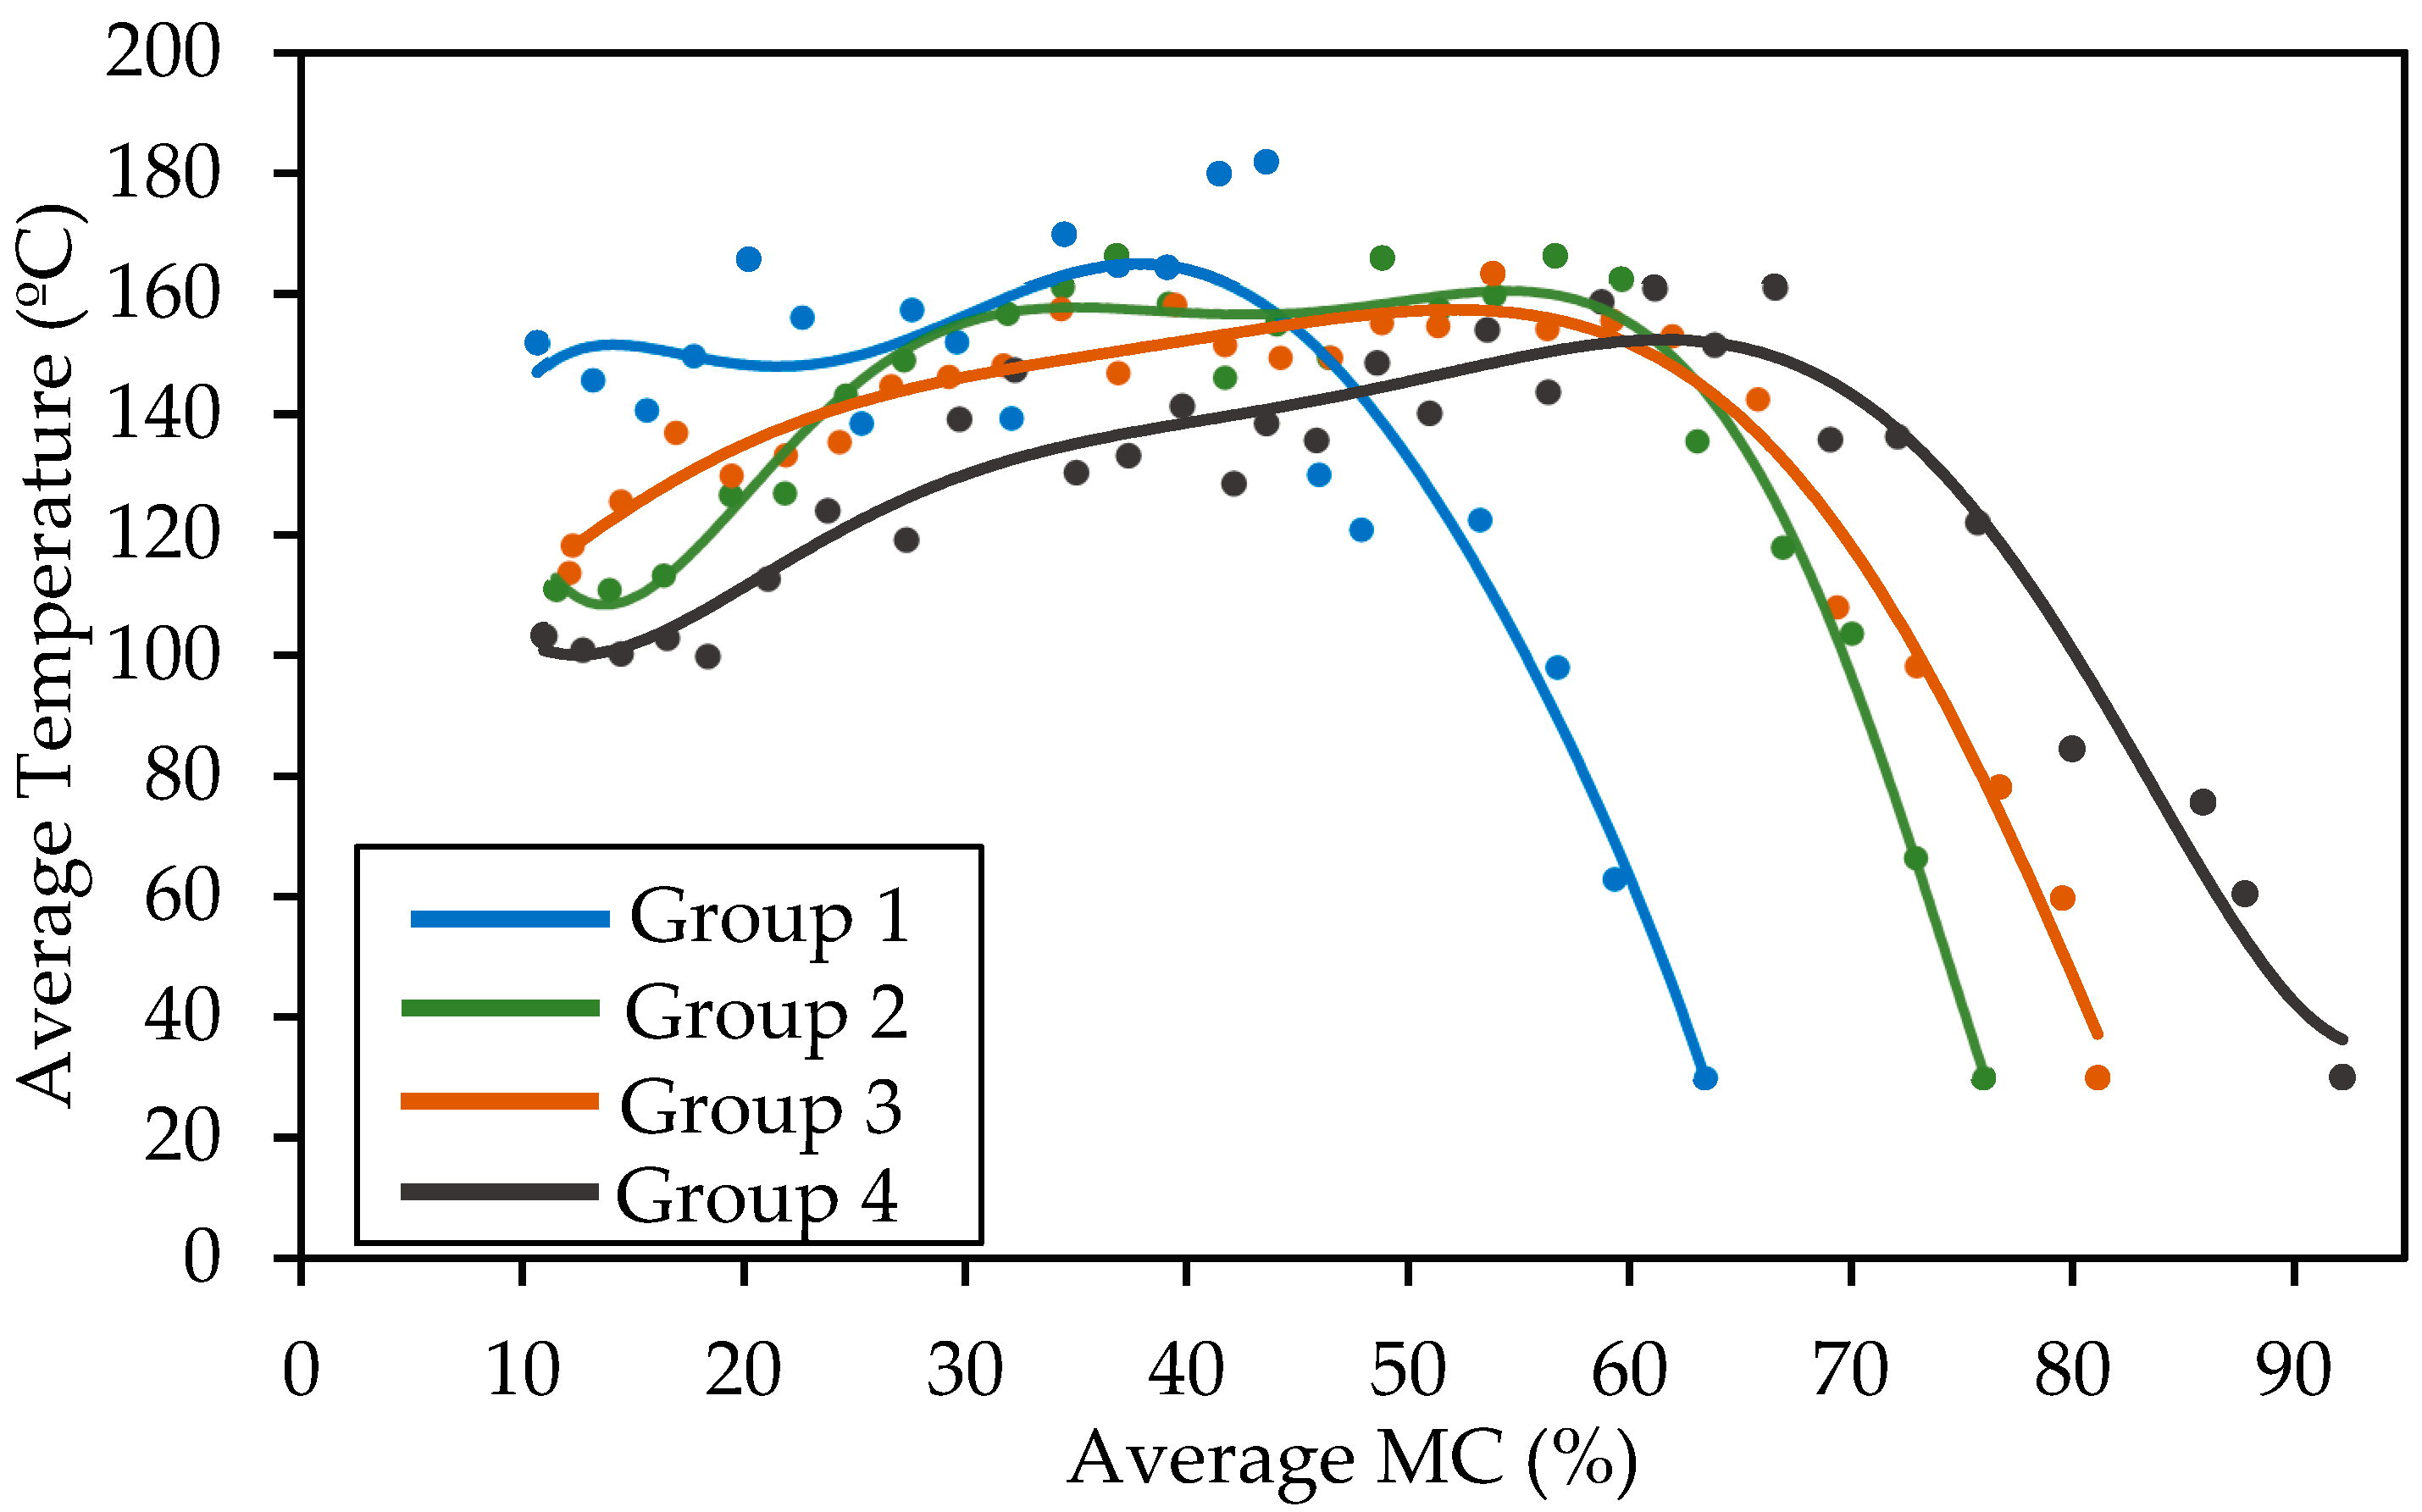
3.2. Temperature Profile during MW Drying
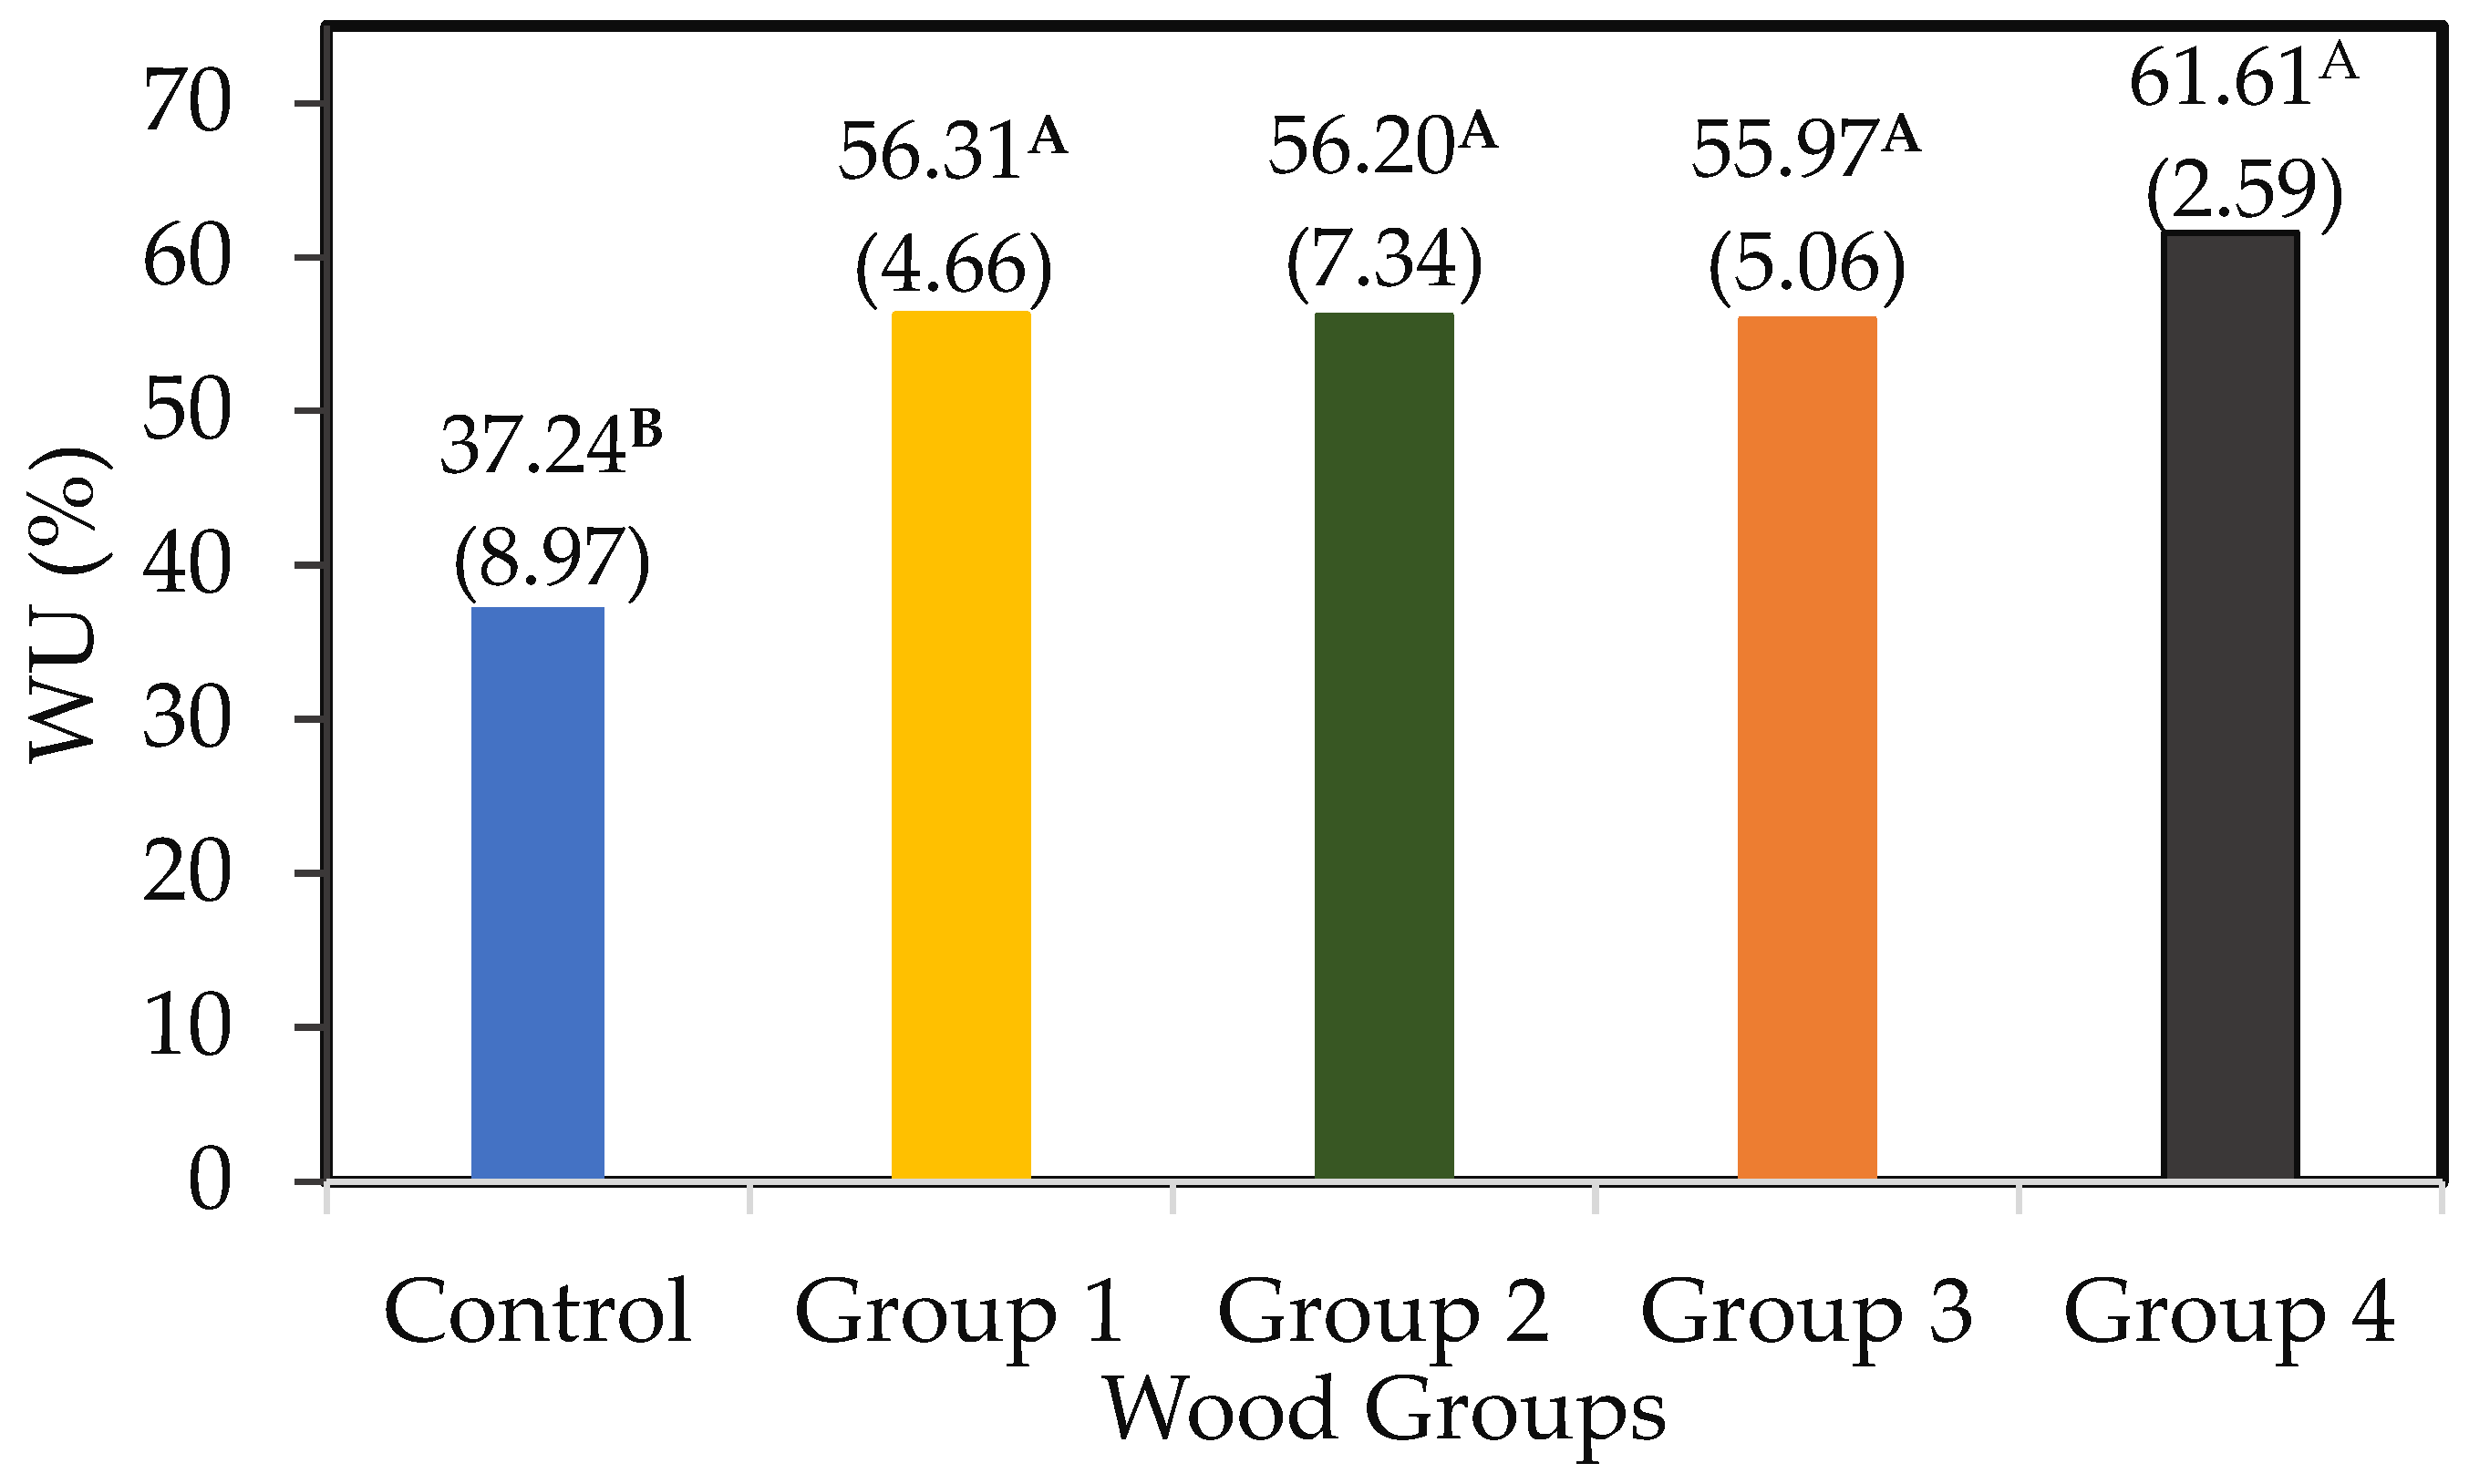
3.3. Evaluation of the Water Impregnability and Compressive Strength
4. Conclusions
- Given the configuration of the MW drying process used in this work, the cooling intervals of 30 s were important to avoid excessive heating, which could result in the burning of some parts of the wood samples.
- Three stages of temperature behavior were noticed during MW drying, and maximum temperatures were observed in the first few minutes of MW drying.
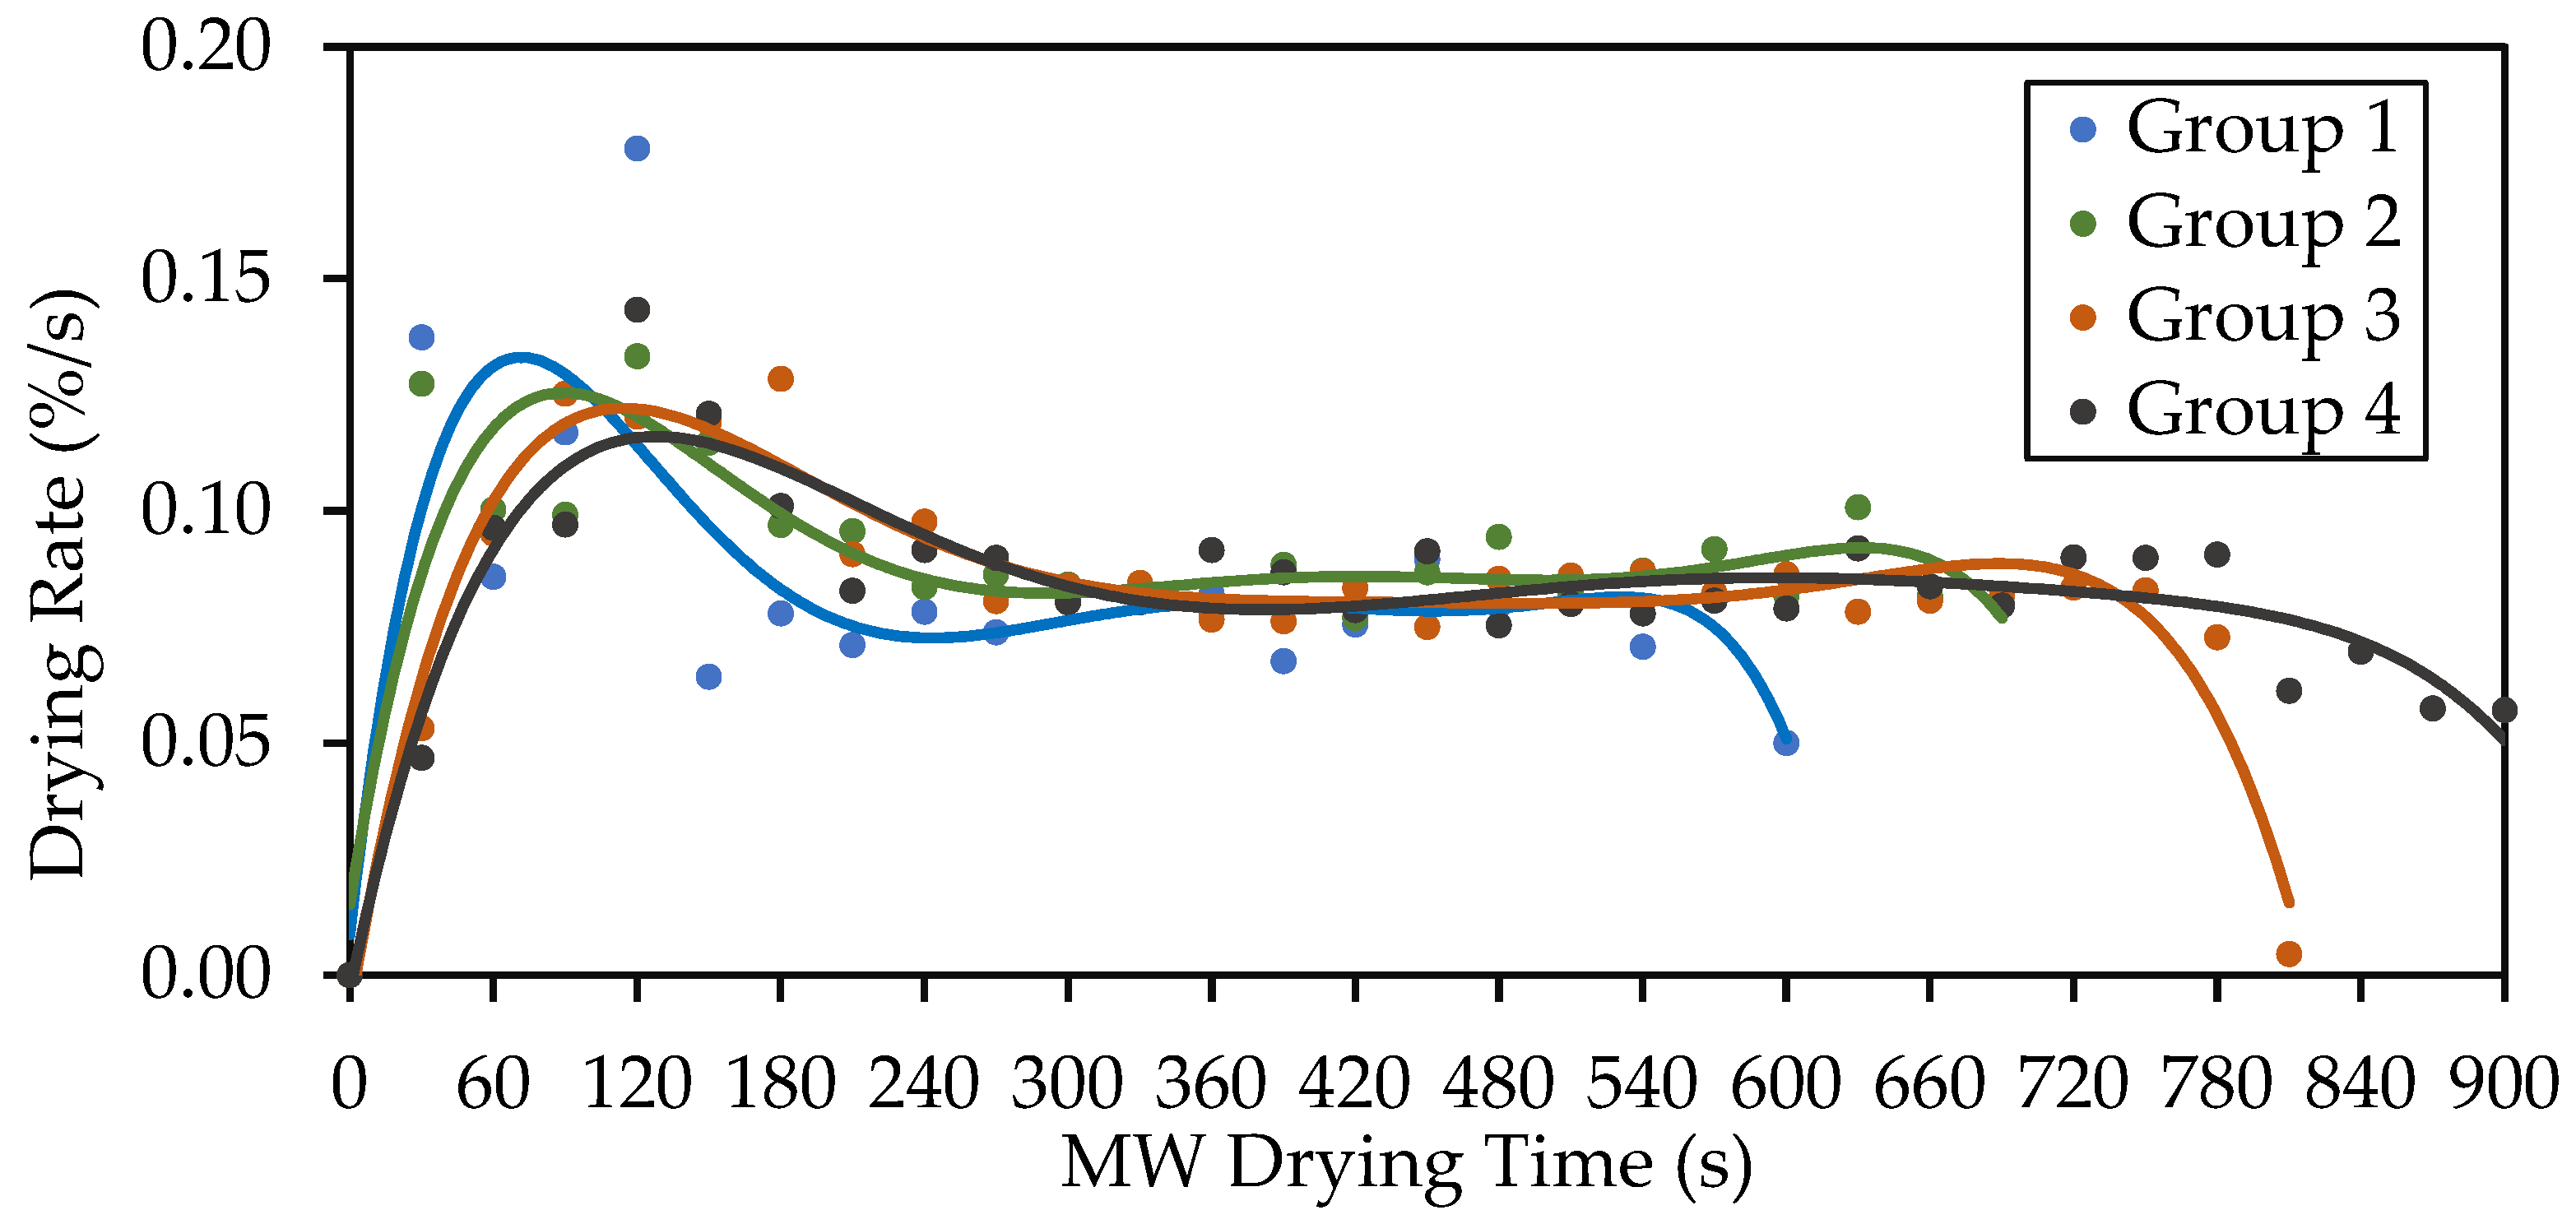
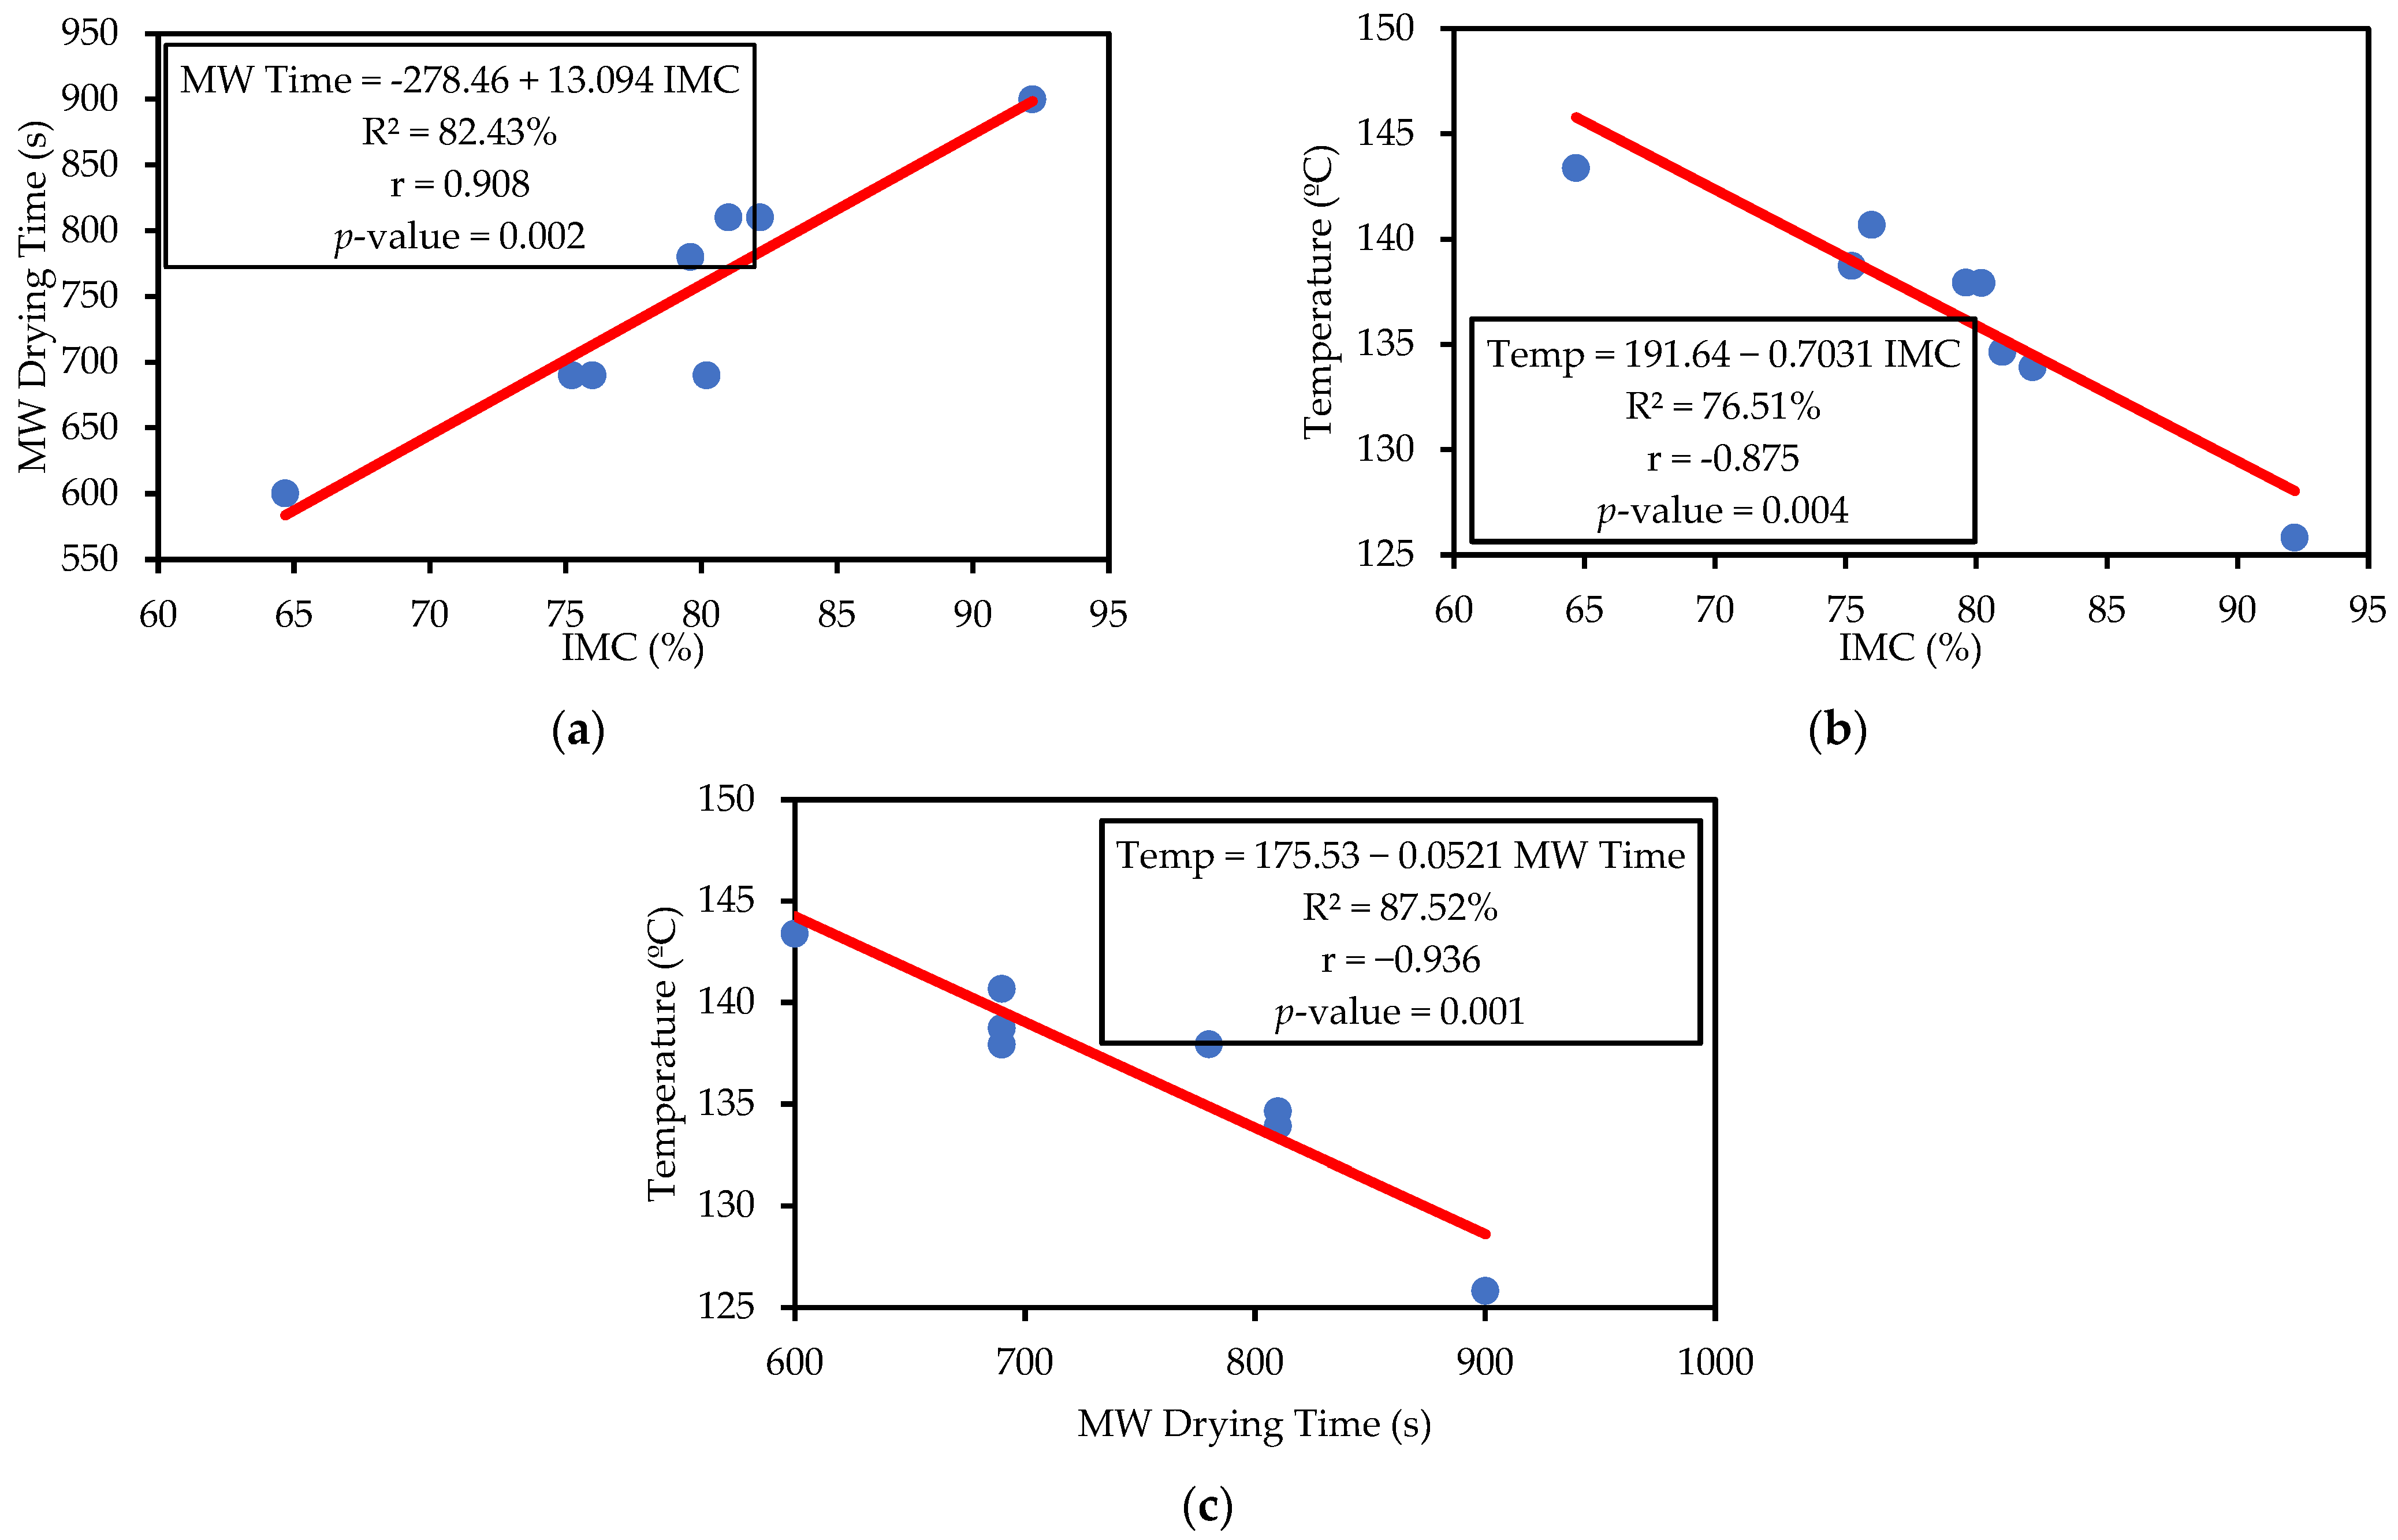
- The drying rate comprises three distinct stages: the initial period of liquid movement, followed by a period of constant drying rate, and finally, a period of falling drying rate. A strong positive Pearson’s correlation coefficient was identified between the IMC and MW drying time, and strong negative correlations were identified between IMC and average temperature and average temperature and MW drying time.
- The parameters used in the MW drying of the Portuguese maritime pine samples associated with the cooling intervals provided moisture and temperature behaviors that were effective in increasing the water impregnability of the samples but without generating statistically significant reductions in compressive strength. Additionally, the IMC did not have a statistically significant impact on the water uptake and compressive strength of MW-dried samples.
- Despite the fact that small clear wood samples of maritime pine were used, the temperature and moisture patterns observed in this study closely matched those of real-scale specimens, which validates the use of small pine samples for testing purposes and demonstrates the positive possibilities of using MW drying in structural-sized wood specimens. Therefore, with adequate MW parameters, it is possible to obtain the benefits of MW without deleterious effects and move from a laboratory to an industrial scale.
Author Contributions
Funding
Data Availability Statement
Acknowledgments
Conflicts of Interest
References
- Torgovnikov, G.; Vinden, P. MW and RF Applications Case Histories. In Proceedings of the Fourth World Congress on Microwave and Radio Frequency Application, Austin, TX, USA, 7–12 November 2004; pp. 77–78. [Google Scholar]
- Mascarenhas, F.J.R.; Dias, A.M.P.G.; Christoforo, A.L. State of the Art of Microwave Treatment of Wood: Literature Review. Forests 2021, 12, 745. [Google Scholar] [CrossRef]
- Torgovnikov, G.; Vinden, P. Microwave Wood Modification Technology and Its Applications. For. Prod. J. 2010, 60, 173–182. [Google Scholar] [CrossRef]
- Engelund, E.T.; Thygesen, L.G.; Svensson, S.; Hill, C.A.S. A Critical Discussion of the Physics of Wood-Water Interactions. Wood Sci. Technol. 2013, 47, 141–161. [Google Scholar] [CrossRef]
- Forest Products Laboratory Wood Handbook: Wood as an Engineering Material; General Technical Report FPL-GTR-282; USDA: Washington, DC, USA, 2021; ISBN 1892529025.
- Metaxas, A.C.; Meredith, R.J. Industrial Microwave Heating, 3rd ed.; Short Run Press Ltd.: Exeter, UK, 2008; Volume 24, ISBN 9780906048894. [Google Scholar]
- Sahin, H.; Ay, N. Dielectric Properties of Hardwood Species at Microwave Frequencies. J. Wood Sci. 2004, 50, 375–380. [Google Scholar] [CrossRef]
- Oloyede, A.; Groombridge, P. The Influence of Microwave Heating on the Mechanical Properties of Wood. J. Mater. Process. Technol. 2000, 100, 67–73. [Google Scholar] [CrossRef]
- Du, G.; Wang, S.; Cai, Z. Microwave Drying of Wood Strands. Dry. Technol. 2005, 23, 2421–2436. [Google Scholar] [CrossRef]
- Terziev, N.; Daniel, G.; Torgovnikov, G.; Vinden, P. Effect of Microwave Treatment on the Wood Structure of Norway Spruce and Radiata Pine. Bioresources 2020, 15, 5616–5626. [Google Scholar] [CrossRef]
- Kol, H.Ş.; Çayır, B. The Effects of Increasing Preservative Uptake by Microwave Pre-Treatment on the Microstructure and Mechanical Properties of Oriental Spruce Wood. Wood Mater. Sci. Eng. 2022, 18, 732–738. [Google Scholar] [CrossRef]
- Kol, H.Ş.; Çayır, B. Increasing the Impregnability of Oriental Spruce Wood via Microwave Pretreatment. Bioresources 2021, 16, 2513–2523. [Google Scholar]
- Torgovnikov, G.; Vinden, P. High-Intensity Microwave Wood Modification for Increasing Permeability. For. Prod. J. 2009, 59, 84–92. [Google Scholar]
- Xiao, H.; Lin, L.; Fu, F. Temperature Characteristics of Wood during Microwave Treatments. J. Res. 2018, 29, 1815–1820. [Google Scholar] [CrossRef]
- Zielonka, P.; Dolowy, K. Microwave Drying of Spruce: Moisture Content, Temperature, and Heat Energy Distribution. For. Prod. J. 1998, 48, 77–80. [Google Scholar]
- Zielonka, P.; Gierlik, E. Temperature Distribution during Conventional and Microwave Wood Heating. Holz Als Roh Und Werkst. 1999, 57, 247–249. [Google Scholar] [CrossRef]
- Sethy, A.K.; Torgovnikov, G.; Vinden, P.; Przewloka, S. Moisture Conditioning of Wood Using a Continuous Microwave Dryer. Dry. Technol. 2016, 34, 318–323. [Google Scholar] [CrossRef]
- Ouertani, S.; Koubaa, A.; Azzouz, S.; Bahar, R.; Hassini, L.; Belghith, A. Microwave Drying Kinetics of Jack Pine Wood: Determination of Phytosanitary Efficacy, Energy Consumption, and Mechanical Properties. Eur. J. Wood Wood Prod. 2018, 76, 1101–1111. [Google Scholar] [CrossRef]
- Huang, R.; Wu, Y.; Zhao, Y.; Lu, J.; Jiang, J.; Chen, Z. Factors Affecting the Temperature Increasing Rate in Wood during Radio-Frequency Heating. Dry. Technol. 2013, 31, 246–252. [Google Scholar] [CrossRef]
- Ouertani, S.; Hassini, L.; Azzouz, S.; Torres, S.S.; Belghith, A.; Koubaa, A. Modeling of Combined Microwave and Convective Drying of Wood: Prediction of Mechanical Behavior via Internal Gas Pressure. Dry. Technol. 2015, 33, 1234–1242. [Google Scholar] [CrossRef]
- Alonso-Esteban, J.I.; Carocho, M.; Barros, D.; Velho, M.V.; Heleno, S.; Barros, L. Chemical Composition and Industrial Applications of Maritime Pine (Pinus pinaster Ait.) Bark and Other Non-Wood Parts. Rev. Environ. Sci. Bio/Technol. 2022, 21, 583–633. [Google Scholar] [CrossRef]
- Meredieu, C.; Brunet, Y.; Danjon, F.; Défossez, P.; Dupont, S.; Kamimura, K.; Gardiner, B. Pinus pinaster in Europe: Distribution, Habitat, Usage and Threat. In European Atlas of Forest Tree Species; San-Miguel-Ayanz, J., de Rigo, D., Caudullo, G., Houston Durrant, T., Mauri, A., Eds.; Publications Office of the European Union: Luxembourg, 2016; pp. 128–129. [Google Scholar]
- Ganguly, S.; Balzano, A.; Petrič, M.; Kržišnik, D.; Tripathi, S. Effects of Different Energy Intensities of Microwave Treatment on Heartwood and Sapwood Microstructures in Norway Spruce. Forests 2021, 12, 598. [Google Scholar] [CrossRef]
- Leggate, W.; Redman, A.; Wood, J.; Bailleres, H.; Lee, D.J. Radial Permeability of the Hybrid Pine (Pinus elliottii × Pinus caribaea) in Australia. Bioresources 2019, 14, 4358–4372. [Google Scholar] [CrossRef]
- CEN EN 350; Durability of Wood and Wood-Based Products—Testing and Classification of the Durability to Biological Agents of Wood and Wood-Based Materials. iTeh Inc.: Brussels, Belgium, 2016.
- Sedighi-Gilani, M.; Vontobel, P.; Lehmann, E.; Carmeliet, J.; Derome, D. Liquid Uptake in Scots Pine Sapwood and Hardwood Visualized and Quantified by Neutron Radiography. Mater. Struct./Mater. Constr. 2014, 47, 1083–1096. [Google Scholar] [CrossRef]
- Hansmann, C.; Gindl, W.; Wimmer, R.; Teischinger, A. Permeability of Wood—A Review. Drev. Vysk./Wood Res. 2002, 47, 1–16. [Google Scholar]
- ISO 13061-1; Physical and Mechanical Properties of Wood—Test Methods for Small Clear Wood Specimens—Part 1: Determination of Moisture Content for Physical and Mechanical Tests. ISO: Geneva, Switzerland, 2014.
- BS 373:1957; Methods of Testing Small Clear Specimens of Timber. BSI: London, UK, 1999.
- Mascarenhas, F.J.R.; Dias, A.M.P.G.; Christoforo, A.L.; dos Santos Simões, R.M.; Cunha, A.E.P. Effect of Microwave Treatment on Drying and Water Impregnability Pinus pinaster and Eucalyptus globulus. Maderas Cienc. Tecnol. 2023, 25, 1–14. [Google Scholar] [CrossRef]
- Al-Khuseibi, M.K.; Sablani, S.S.; Perera, C.O. Comparison of Water Blanching and High Hydrostatic Pressure Effects on Drying Kinetics and Quality of Potato. Dry. Technol. 2005, 23, 2449–2461. [Google Scholar] [CrossRef]
- Niemz, P.; Teischinger, A.; Sandberg, D. (Eds.) Handbook of Wood Science and Technology; Springer: Cham, Switzerland, 2023. [Google Scholar]
- He, Z.; Qian, J.; Qu, L.; Wang, Z.; Yi, S. Simulation of Moisture Transfer during Wood Vacuum Drying. Results Phys. 2019, 12, 1299–1303. [Google Scholar] [CrossRef]
- Benabou, L. Predictions of Compressive Strength and Kink Band Orientation for Wood Species. Mech. Mater. 2010, 42, 335–343. [Google Scholar] [CrossRef]
- Šefc, B.; Trajković, J.; Sinković, T.; Hasan, M.; Ištok, I. Compression Strength of Fir and Beech Wood Modified by Citric Acid. Drv. Ind. 2012, 63, 45–50. [Google Scholar] [CrossRef]
- Aicher, S.; Stapf, G. Compressive Strength Parallel to the Fiber of Spruce with High Moisture Content. Eur. J. Wood Wood Prod. 2016, 74, 527–542. [Google Scholar] [CrossRef]
- Zhao, C.; Liu, D.; Zhang, C.; Li, Y.; Wang, Y. Influence of Specimen Size on the Compressive Strength of Wood. Buildings 2024, 14, 1156. [Google Scholar] [CrossRef]
- ABNT NBR 7190-1; Projeto de Estruturas de Madeira Parte 1: Critérios de Dimensionamento. ABNT: Rio de Janeiro, Brazil, 2022.
- CEN EN 408; Timber Structures—Structural Timber and Glued Laminated Timber—Determination of Some Physical and Mechanical Properties. iTeh: Brussels, Belgium, 2012.
- Hermoso, E.; Vega, A. Effect of Microwave Treatment on the Impregnability and Mechanical Properties of Eucalyptus globulus Wood. Maderas Cienc. Tecnol. 2016, 18, 55–64. [Google Scholar] [CrossRef]
- Software Minitab, version 18; Minitab: State College, PA, USA, 2018.
- Weng, X.; Zhou, Y.; Fu, Z.; Gao, X.; Zhou, F.; Jiang, J. Effects of Microwave Pretreatment on Drying of 50 mm-Thickness Chinese Fir Lumber. J. Wood Sci. 2021, 67, 13. [Google Scholar] [CrossRef]
- Leiker, M.; Adamska, M.A. Energy Efficiency and Drying Rates during Vacuum Microwave Drying of Wood. Holz Als Roh Und Werkst. 2004, 62, 203–208. [Google Scholar] [CrossRef]
- Vinden, P.; Torgovnikov, G.; Hann, J. Microwave Modification of Radiata Pine Railway Sleepers for Preservative Treatment. Eur. J. Wood Wood Prod. 2011, 69, 271–279. [Google Scholar] [CrossRef]
- Dashti, H.; Tarmian, A.; Faezipour, M.; Hedjazi, S.; Shahverdi, M. Mass Transfer Through Microwave-Treated Fir Wood (Abies alba L.): A Gymnosperm Species with Torus Margo Pit Membrane. Dry. Technol. 2013, 31, 359–364. [Google Scholar] [CrossRef]
- Hansson, L.; Antti, L. Modeling Microwave Heating and Moisture Redistribution in Wood. Dry. Technol. 2008, 26, 552–559. [Google Scholar] [CrossRef]
- Vongpradubchai, S.; Rattanadecho, P. The Microwave Processing of Wood Using a Continuous Microwave Belt Drier. Chem. Eng. Process. Process Intensif. 2009, 48, 997–1003. [Google Scholar] [CrossRef]
- Zhang, Y.; Jia, K.; Cai, L.; Shi, S.Q. Acceleration of Moisture Migration in Larch Wood Through Microwave Pre-Treatments. Dry. Technol. 2013, 31, 666–671. [Google Scholar] [CrossRef]
- Petty, J.A.; Preston, R.D. Permeability and Structure of the Wood of Sitka Spruce. Proc. R. Soc. B Biol. Sci. 1970, 175, 149–166. [Google Scholar] [CrossRef]
- Koubaa, A.; Perré, P.; Hutcheon, R.; Lessard, J. Complex Dielectric Properties of the Sapwood of Aspen, White Birch, Yellow Birch, and Sugar Maple. Dry. Technol. 2008, 26, 568–578. [Google Scholar] [CrossRef]
- Antti, A.L.; Perre, P. A Microwave Applicator for on Line Wood Drying: Temperature and Moisture Distribution in Wood. Wood Sci. Technol. 1999, 33, 123–138. [Google Scholar] [CrossRef]
- Henry, F.; Gaudillat, M.; Costa, L.C.; Lakkis, F. Free and/or Bound Water by Dielectric Measurements. Food Chem. 2003, 82, 29–34. [Google Scholar] [CrossRef]
- Laboratório Nacional de Engenharia Civil (LNEC). Ficha M9—Madeira Para Construção: Humidade Da Madeira [Wood for Construction: Wood Moisture]; LNEC: Lisbon, Portugal, 1997. [Google Scholar]
- He, S.; Lin, L.; Fu, F.; Zhou, Y.; Fan, M. Microwave Treatment for Enhancing the Liquid Permeability of Chinese Fir. Bioresources 2014, 9, 1914–1923. [Google Scholar] [CrossRef]
- Wang, Z.; Xu, E.; Fu, F.; Lin, L.; Yi, S. Industrial Crops & Products Characterization of Wood Cell Walls Treated by High-Intensity Microwaves: Effects on Physicochemical Structures and Micromechanical Properties. Ind. Crop. Prod. 2022, 187, 115341. [Google Scholar] [CrossRef]
- Machado, J.S. Effect of Microwave Treatment on Oak Compression Strength. Silva Lusit 2006, 14, 51–58. [Google Scholar]
- Balboni, B.M.; Ozarska, B.; Garcia, J.N.; Torgovnikov, G. Microwave Treatment of Eucalyptus macrorhyncha Timber for Reducing Drying Defects and Its Impact on Physical and Mechanical Wood Properties. Eur. J. Wood Wood Prod. 2018, 76, 861–870. [Google Scholar] [CrossRef]
- Dias, A.M.A.; Santos, P.G.G.; Dias, A.M.P.G.; Silvestre, J.D.; de Brito, J. Life Cycle Assessment of a Preservative Treated Wooden Deck. Wood Mater. Sci. Eng. 2022, 17, 502–512. [Google Scholar] [CrossRef]
- Morgado, T.F.M.; Rodrigues, J.; Machado, J.S.; Dias, A.M.P.G.; Cruz, H. Bending and Compression Strength of Portuguese Maritime Pine Small-Diameter Poles. For. Prod. J. 2009, 59, 23–28. [Google Scholar]
- Morgado, T.F.M.; Dias, A.M.P.G.; Machado, J.S.; Negrão, J.H.; Marques, A.F.S. Grading of Portuguese Maritime Pine Small-Diameter Roundwood. J. Mater. Civ. Eng. 2017, 29, 04016209. [Google Scholar] [CrossRef]


| Group | IMC (%) | Number of Samples |
|---|---|---|
| 1 | 63.39 (2.65) D | 21 |
| 2 | 75.50 (5.20) C | 21 |
| 3 | 81.12 (3.56) B | 21 |
| 4 | 92.19 (2.70) A | 21 |
| Group 1 | Average IMC (%) | Average Final MC (%) | Total MW Drying Time (s) 2 | Average MW Drying Rates (%/s) | Average E (MJ/m3) | WPL (MJ/m3) | RWL |
|---|---|---|---|---|---|---|---|
| 1 | 63.39 (2.97) | 10.66 (0.44) | 600 D | 0.082 (0.033) A | 3429 (74) D | 52.73 (1.14) D | 83.18 (1.80) A |
| 2 | 75.50 (5.20) | 11.48 (0.66) | 690 C | 0.089 (0.023) A | 3943 (276) C | 64.02 (4.48) C | 84.79 (5.94) A |
| 3 | 81.12 (3.56) | 11.46 (0.55) | 810 B | 0.085 (0.021) A | 4629 (258) B | 69.66 (3.88) B | 85.87 (4.79) A |
| 4 | 92.19 (2.70) | 10.96 (0.57) | 900 A | 0.082 (0.027) A | 5143 (159) A | 81.23 (2.51) A | 88.11 (2.72) A |
| Group | Average Temperature (°C) | Time to Achieve 100 °C (s) | Maximum Temperature (°C) | Average Pressure (kPa) | Estimated Maximum Pressure (kPa) |
|---|---|---|---|---|---|
| 1 | 145 | 50 (after 1st cooling interval) | 240 | 331 | 1766 |
| 2 | 140 | 55 (after 1st cooling interval) | 236 | 291 | 1681 |
| 3 | 136 | 80 (after 2nd cooling interval) | 232 | 282 | 1584 |
| 4 | 126 | 105 (after 3rd cooling interval) | 222 | 215 | 1375 |
Disclaimer/Publisher’s Note: The statements, opinions and data contained in all publications are solely those of the individual author(s) and contributor(s) and not of MDPI and/or the editor(s). MDPI and/or the editor(s) disclaim responsibility for any injury to people or property resulting from any ideas, methods, instructions or products referred to in the content. |
© 2024 by the authors. Licensee MDPI, Basel, Switzerland. This article is an open access article distributed under the terms and conditions of the Creative Commons Attribution (CC BY) license (https://creativecommons.org/licenses/by/4.0/).
Share and Cite
Mascarenhas, F.J.R.; Simões, R.M.d.S.; Dias, A.M.P.G.; Christoforo, A.L.; Cunha, A.E.P. Moisture and Temperature Profiles of Heartwood Pinus pinaster Ait. Wood Specimens during Microwave Drying. Forests 2024, 15, 944. https://doi.org/10.3390/f15060944
Mascarenhas FJR, Simões RMdS, Dias AMPG, Christoforo AL, Cunha AEP. Moisture and Temperature Profiles of Heartwood Pinus pinaster Ait. Wood Specimens during Microwave Drying. Forests. 2024; 15(6):944. https://doi.org/10.3390/f15060944
Chicago/Turabian StyleMascarenhas, Fernando Júnior Resende, Rogério Manuel dos Santos Simões, Alfredo Manuel Pereira Geraldes Dias, André Luis Christoforo, and André Eduardo Palos Cunha. 2024. "Moisture and Temperature Profiles of Heartwood Pinus pinaster Ait. Wood Specimens during Microwave Drying" Forests 15, no. 6: 944. https://doi.org/10.3390/f15060944
APA StyleMascarenhas, F. J. R., Simões, R. M. d. S., Dias, A. M. P. G., Christoforo, A. L., & Cunha, A. E. P. (2024). Moisture and Temperature Profiles of Heartwood Pinus pinaster Ait. Wood Specimens during Microwave Drying. Forests, 15(6), 944. https://doi.org/10.3390/f15060944