Article

Phosphorous Fractions in Soils of Natural Shrub-Grass Communities and Leucaena leucocephala Plantations in a Dry-Hot Valley

1
Yunnan Key Laboratory for Plateau Mountain Ecology and Restoration of Degraded Environments & School of Ecology and Environmental Science, Yunnan University, Kunming 650091, China
2
Institute of International Rivers and Eco-Security, Yunnan University, Kunming 650091, China
3
Institute of Highland Forest Science, Chinese Academy of Forestry, Kunming 650224, China
4
Yuanmou Desert Ecosystem Research Station, National Long-Term Scientific Research Base of Comprehensive Control in Yuanmou Dry-Hot Valley, Kunming 650233, China
5
State Key Laboratory of Efficient Production of Forest Resources, Beijing 100091, China
*
Author to whom correspondence should be addressed.
Forests 2024, 15(6), 974; https://doi.org/10.3390/f15060974
Submission received: 18 April 2024 / Revised: 29 May 2024 / Accepted: 29 May 2024 / Published: 1 June 2024
(This article belongs to the Section Forest Soil)

Abstract

:
Afforestation is an effective approach for restoring degraded ecological functions in the dry-hot valleys of southwest China. Afforestation can affect soil carbon and nitrogen storage; however, how it affects soil P fractions, and their driving factors. is poorly understood in this region. To address these questions, we conducted a field study of Leucaena leucocephala plantations at three different stand age sites (3, 10, and 20 years) and an adjacent natural shrub-grass community control site to investigate changes in soil total phosphorus (Pt), Pi (inorganic phosphorus), Po (organic phosphorus), and phosphorus (P) fractions and their driving factors. Soil Pt, Po, labile P, and moderately labile P significantly increased in the Leucaena leucocephala plantation compared with the natural shrub grass site, and the Leucaena leucocephala plantation increased soil Pt content by significantly increasing soil Po. Soil Pt, Po, Pi, labile P, moderately labile P and non-labile P were not significantly different among the different stages of the Leucaena leucocephala plantation, and soil Pt and its fractions were all significantly higher in the middle-age forest stage of the Leucaena leucocephala plantation. These results indicate that Leucaena leucocephala plantations increased the soil P transformation ability, and soil Po played a critical role in sustaining soil P availability. The middle-age forest stage of Leucaena leucocephala plantations had the best conditions for P stocks and P conversion capacity. The abundance of actinomycetes and fungi showed significant positive relationships with soil Pi fractions (NaHCO3-Pi, NaOH-Pi, and NaOHu.s.-Pi); soil Pt and moderately labile P were significantly and directly influenced by fungal abundance. Soil organic carbon (SOC), NH4+-N, and NO3-N showed significant and positive relationships with the soil Pi fractions (NaHCO3-Pi, NaHCO3-Po, and HCl-Po). SOC and NO3-N were the key drivers of soil Pt, labile P, moderately labile P and non-labile fractions. These results indicate that abiotic and biotic factors differently affected the soil P fractions and Pt in Leucaena leucocephala plantations in the dry-hot valley.

1. Introduction

Phosphorus (P) is an important element that limits plant productivity in terrestrial ecosystems and exists in two forms in the soil: inorganic phosphorus (Pi) and organic phosphorus (Po) [1,2]. The P status in the soil is mainly influenced by two pathways: natural weathering of the parent rock and the use of artificial P fertilizers [3]. Phosphorus (Pi) is a P source that can be directly utilized by plants and microorganisms and is crucial in determining the availability of P in the soil [4]. Po mainly originates from animal and plant residues, organic fertilizers, and the conversion of inorganic fertilizers by microorganisms [5]. Typically, Po accounts for 30–65% of the total phosphorus (Pt) in the soil [6], and its degradation is an important pathway for maintaining the biological availability of P in the soil [7]. The form, content, and transformation processes of soil P directly influence its biological availability [8], which is also a crucial basis for determining its role as a limitation on ecosystem productivity. Therefore, studying the distribution of soil P forms is helpful for revealing the biological availability of P and is an important foundation for enhancing primary productivity and ecosystem functioning.
It is well known that P fractionation techniques have developed to reveal the forms of P in the soil, and have been widely applied to elucidate the soil bioavailable P in various ecosystems such as natural forests [9,10], plantations [11], wetlands [12,13], and grasslands [14,15]. The Hedley fractionation method considers both Pi and Po forms during the fractionation process [16], and P fractions are classified into three sequential extraction groups: labile P, moderately labile P, and non-labile P [11,17]. This method is beneficial for a comprehensive understanding of the bioavailability and dynamic changes in soil P and can reflect the potential conversion between inorganic P and organic P in soil. Therefore, soil P fractionation techniques can be used to investigate the distribution patterns of various forms of P, revealing the potential impact of P supply on the bioavailability of soil P.
Nitrogen (N) and P are key soil indicators that control productivity in plantation forests [18,19]; the distribution characteristics of soil organic P and inorganic pools in plantation forests are an important basis for the bioavailability and promotion of plantation productivity and sustainable management. Currently, research on P fractionation mainly focuses on trees with good site conditions (water and nutrients) and important economic and ecological functions [20,21], whereas there are few studies on semi-arid areas. Moreover, the biogeochemical cycles of C, N, and P are interlinked [22,23], and changes in C and N affect P transformation and fractions. In semi-arid and vulnerable habitats, nitrogen-fixing tree species are commonly used for afforestation [24,25]; this can improve soil fertility by rapidly accumulating C and N. However, the effects of nitrogen-fixing plantation growth on P fractions remain unknown. Many current studies mainly focus on the influence of anthropogenic N addition [26,27,28], N deposition [29] and forest conversion [30,31] or afforestation [20,21,32] on soil P fractions and bioavailability. Furthermore, the distribution pattern of the soil P pool is affected by aboveground plants, soil physicochemical properties, microbial biomass, and soil enzyme activity [33,34]. Afforestation can affect soil P fractions directly and indirectly by affecting aboveground and belowground conditions. Previous research indicated that the effects of afforestation on soil P were dependent on the planted woody species and the revegetation age [32,35,36]. Therefore, it is important to further explore soil P fractions and their influencing factors in restored plantations with nitrogen-fixing species in semi-dry areas to develop efficient, reasonable, and sustainable vegetation restoration management strategies.
The Yuanmou dry and hot valley is a typical semi-arid and fragile ecosystem in Southwest China [37]. Because of serious soil degradation and erosion, the exotic nitrogen-fixing tree species Leucaena leucocephala (Lam.) de Wit was introduced to improve the local ecological environment in the 1990s [38]. The species has strong adaptability to hot and dry habitats with its developed, nodular roots and strong tolerance to drought and barren conditions. Research on Leucaena leucocephala plantations in this region has mainly focused on soil quality [39], nutrient availability [40], carbon sequestration [41], and nitrogen accumulation [42], and has found that Leucaena leucocephala plantations increased soil quality and carbon and nitrogen stocks. However, it remains largely uncertain whether the afforestation of Leucaena leucocephala and stand ages affect the soil P conversion of the previous savanna in this region. Moreover, soil P cycling plays an important role in the productivity and functional of plantations. A study of the soil P fractions with afforestation and stand ages will form an important scientific basis for the stability and sustainable management of recovery ecosystems in such fragile areas. Therefore, in the present study, Leucaena leucocephala plantations of different stand ages and natural shrub-grass plots were selected in the dry-hot valley of the Jinsha River. The main objective of this study was to: (1) explore the effect of Leucaena leucocephala afforestation and its stand age on soil P fractions; and (2) analyze the variations in soil P fractions and their driving factors with Leucaena leucocephala afforestation. This study provides a theoretical basis for understanding soil P cycling in dry-hot valleys under the background of vegetation restoration and provides a scientific basis for the functional restoration and regulation of soil ecosystems in dry-hot valleys.

2. Materials and Methods

2.1. Site Description and Soil Sampling

The Yuanmo dry-hot valley (25° 31′~26° 07′ N, 101° 36′~102° 07′ E) is located in the dry-hot sub-zone of the Jinsha River Basin and is a typical representative area of the dry-hot valley of the Jinsha River Basin. The study site is located at the Yuanmou Desert Ecosystem National Positioning Station of the National Forestry and Grassland Administration in Yuanmou County. The climate is typical dry-hot, with an average annual temperature of 20.5–23.2 °C and annual precipitation of 287–916 mm. The main soil type in this region is Ferralic Arenosols [39], and the soil pH is about 6.85–7.25. Typical natural shrub and grass communities are present at the ecological station with no grazing or long-term artificial management. The shrubs are mainly characterized by Terminalia franchetii Gagnep., Phyllanthus emblica Linn., Dodonaea viscosa (L.) Jacq), Osteomeles schwerinae Schneid. and Diospyros dumetorum W. Smith. Grasses are mainly characterized by Heteropogon contortus (Linn.) Beauv., Bothriochloa pertusa (L.) A. Camus, Eulaliopsis binate (Retz.) C. E. Hubb. and Cymbopogon goeringii (Steud.) A. Camus. In around 2000, Leucaena leucocephala (Lam.) de Wit were introduced and planted, and the population distribution area continuously expanded and gradually spread into natural shrub-grass communities through seed propagation and population growth.
The study site was located in natural shrub-grass communities and Leucaena leucocephala plantations in the ecological location of Yuanmou dry-hot valley at elevations of 1550 m a.s.l. L. leucocephala is a widespread invasive alien plant in hot and dry valleys. When L. leucocephala encroaches into the natural shrub-grass communities, it will continue to spread, with its strong seed dispersal ability, and gradually form plantation sequences. Based on the encroachment characteristics, the plantation age can be inferred by local remote-sensing images and information from the state-owned forest farm. Thus, we chose four sites located ca. 200 meters apart, with similar invasion trajectories and stand stage distributions. At each site, there were one uninvaded plot (i.e., shrub-grass community, CK) and nearly three L. leucocephala plots with the following different encroachment ages: young forest stage (HS, 3a); middle-age forest stage (HM, 10a); and mature forest stage (HL, 20a) (Supplementary Figure S1). In total, 16 plots were investigated in this study. The plot size of the L. leucocephala plantation and shrub-grass community (CK) was 20 m × 20 m, and 5 m × 5 m, respectively. We measured the DBH and height of L. leucocephala at each plot and used an allometric equation involving these two parameters to calculate the biomass of L. leucocephala [43].
Three soil cores were randomly collected from each plot at a depth of 10 cm and composited into one sample; thus, 16 composite samples were collected. All the soil samples were immediately placed on ice and transported to the laboratory. Each sample was passed through a 2 mm sieve and further divided into three sets of subsamples. One subsample set was immediately maintained at 4 °C for analysis of enzyme activity and microbial biomass. A second subsample was stored at −20 °C for quantitative analysis of bacteria, fungi, and actinomycetes. The third subsample was air-dried for P fractionation. Soil available P (AP) was determined using a continuous flow analytical system (SEAL Analytical AA3) after extraction with 0.5 M NaHCO3. Soil organic carbon (SOC) and total nitrogen (TN) were obtained from our previous study [44]. The soil water content (SWC), pH, NH4+-N, NO3-N, and AP are shown in Table S1.

2.2. Phosphorus Fractionation

The continuous extraction method proposed by Hedley (1982) and modified by Kovar and Pierzynski (2009) was used to fractionate soil P in this study [16,45]. Briefly, the P fractions were extracted from 0.5 g air-dried soil in a 50 mL centrifuge tube via the following steps: (1) 30 mL deionized water and a 3 × 2 cm anionic resin strip was added to the centrifuge tube, and the phosphorus in the anionic resin strip was extracted with 0.5M HCl after 16 h of shaking at 160 rpm and 25 °C (resin-Pi); (2) after removing the aqueous solution, 30 mL of a series of chemical extractants (0.5 M NaHCO3 at pH 8.5, 0.1 M NaOH) were added and shaken for 16 h to extract NaHCO3-P and NaOH-P step-by-step; (3) after removing the aqueous solution, 20 mL of 0.1M NaOH solution was added and ultrasonic oscillation for 20 min was performed. It was then shaken for 16 h to extract NaOHu.s.-P after adding another 10 mL 0.1 M NaOH solution; (4) after removing the aqueous solution, 1 M HCl was added and shaken for 16 h to extract HCl-P; and (5) residual P was extracted by boiling the soil residue in 4 mL of concentrated H2SO4 and 1mL of HClO4. The concentration of inorganic P (Pi) in each extract was determined after acidification using a Skalar SAN Plus Segmented Flow Analyzer with a Continuous Flow Analytic System (SEAL Analytical AA3, Norderstedt, Germany). Pt was determined after ammonium persulfate digestion, and organic P (Po) was estimated as the difference between Pt and Pi in each extract. Resin-Pi, NaHCO3-Pi, NaHCO3-Po, NaOH-Pi, NaOH-Po, NaOHu.s.-Pi, NaOHu.s.-Po, HCl-Po, and residual-P were determined in this multiple-step sequential extraction scheme of P. Pt content was the sum of all nine fractions. The P fractions were classified into three groups, as follows: labile P (resin-Pi + NaHCO3-Pi + NaHCO3-Po), moderately labile P (NaOH-Pi + NaOH-Po + HCl-Po), and non-labile P (NaOHu.s.-Pi + NaOHu.s.-Po + residual P), according to previous studies [11,17]. HCl-Pi was not detected in this study.

2.3. Acid Phosphatase Activity and Soil Microbial Biomass Phosphorus

The acid phosphatase activities (ACP) were measured following a modification of a previously described method [46]. The substrate for determining the activities of ACP was 200 μM 4-MUB-phosphate. Briefly, 1 g of fresh soil was added to 125 mL of 50 mM acetate buffer (pH = 5.0) and mixed using a magnetic stirrer for 1 min. Then 200 μL homogenized soil slurry was added to a 96-well microplate by an eight-channel pipette. The microplate was incubated in the dark for 4 h at a temperature of 20 °C. Finally, 10 μL NaOH (1 M) was added to quench the reaction of enzymatic hydrolysis of substrates. Sample fluorescence was detected using 365 nm excitation and 460 nm emission filters on a Microplate Reader (BioTek Synergy HTX, Winooski, VT, USA). Soil microbial biomass phosphorus (SMBP) was estimated using a chloroform fumigation–extraction procedure. The available P in the fumigated and unfumigated soils was extracted with 0.5 M NaHCO3 and determined colorimetrically [47].

2.4. DNA Extraction, and Quantitative Polymerase Chain Reaction

Total soil DNA was extracted using the E.Z.N.A.™ Soil DNA Kit (Omega Bio-tek, Inc., Norcross, GA, USA) according to the manufacturer’s instructions and then stored at −80 °C until use. Quantitative polymerase chain reaction (qPCR) was performed using the Roche LightCycler® 96 System (Basel, Switzerland). Bacteria, fungi, and actinomycetes were quantified using the following primers: 341-F/515-R [48], FF390-F/FR1-R [49], Act920F/Act1200R [50]. The qPCR reaction was performed (in triplicate) with a 20 μL volume containing 10 μL 2× SYBR Green reagent (Takara Biotechnology, Dalian, China), 0.4 μM of each primer, and 1 μL of the DNA template. Standard curves were constructed using 10-fold serial dilutions of the plasmids for five gradients harboring the corresponding DNA fragments. All DNA samples were analyzed in triplicate and three no-template controls were used to check for reagent contamination. The R2 value of the standard curve was >0.99. The efficiency of the qPCR ranged from 90% to 95.1%.

2.5. Statistical Analysis

All the data were checked for normality and homogeneity before statistical analyses. One-way analysis of variance (ANOVA) with Tukey’s test was used to analyze differences in aboveground biomass, gene abundance (bacteria, fungi, and actinomycetes), P fractionation, acid phosphatase activity, and soil microbial biomass phosphorus among the natural shrub-grass and different stages of the L. leucocephala plantations. A t-test was used to analyze the differences in gene abundance (bacteria, fungi, and actinomycetes), P fractionation, acid phosphatase activity, and soil microbial biomass phosphorus between natural shrub-grass and L. leucocephala plantation sites. Pearson’s correlation analysis was used to analyze the relationships between P fractions and abiotic and biotic factors. Structural equation modelling (SEM) was used to better understand the factors driving Pt, Po, Pi, labile P, moderately labile P, and non-labile P.

3. Results

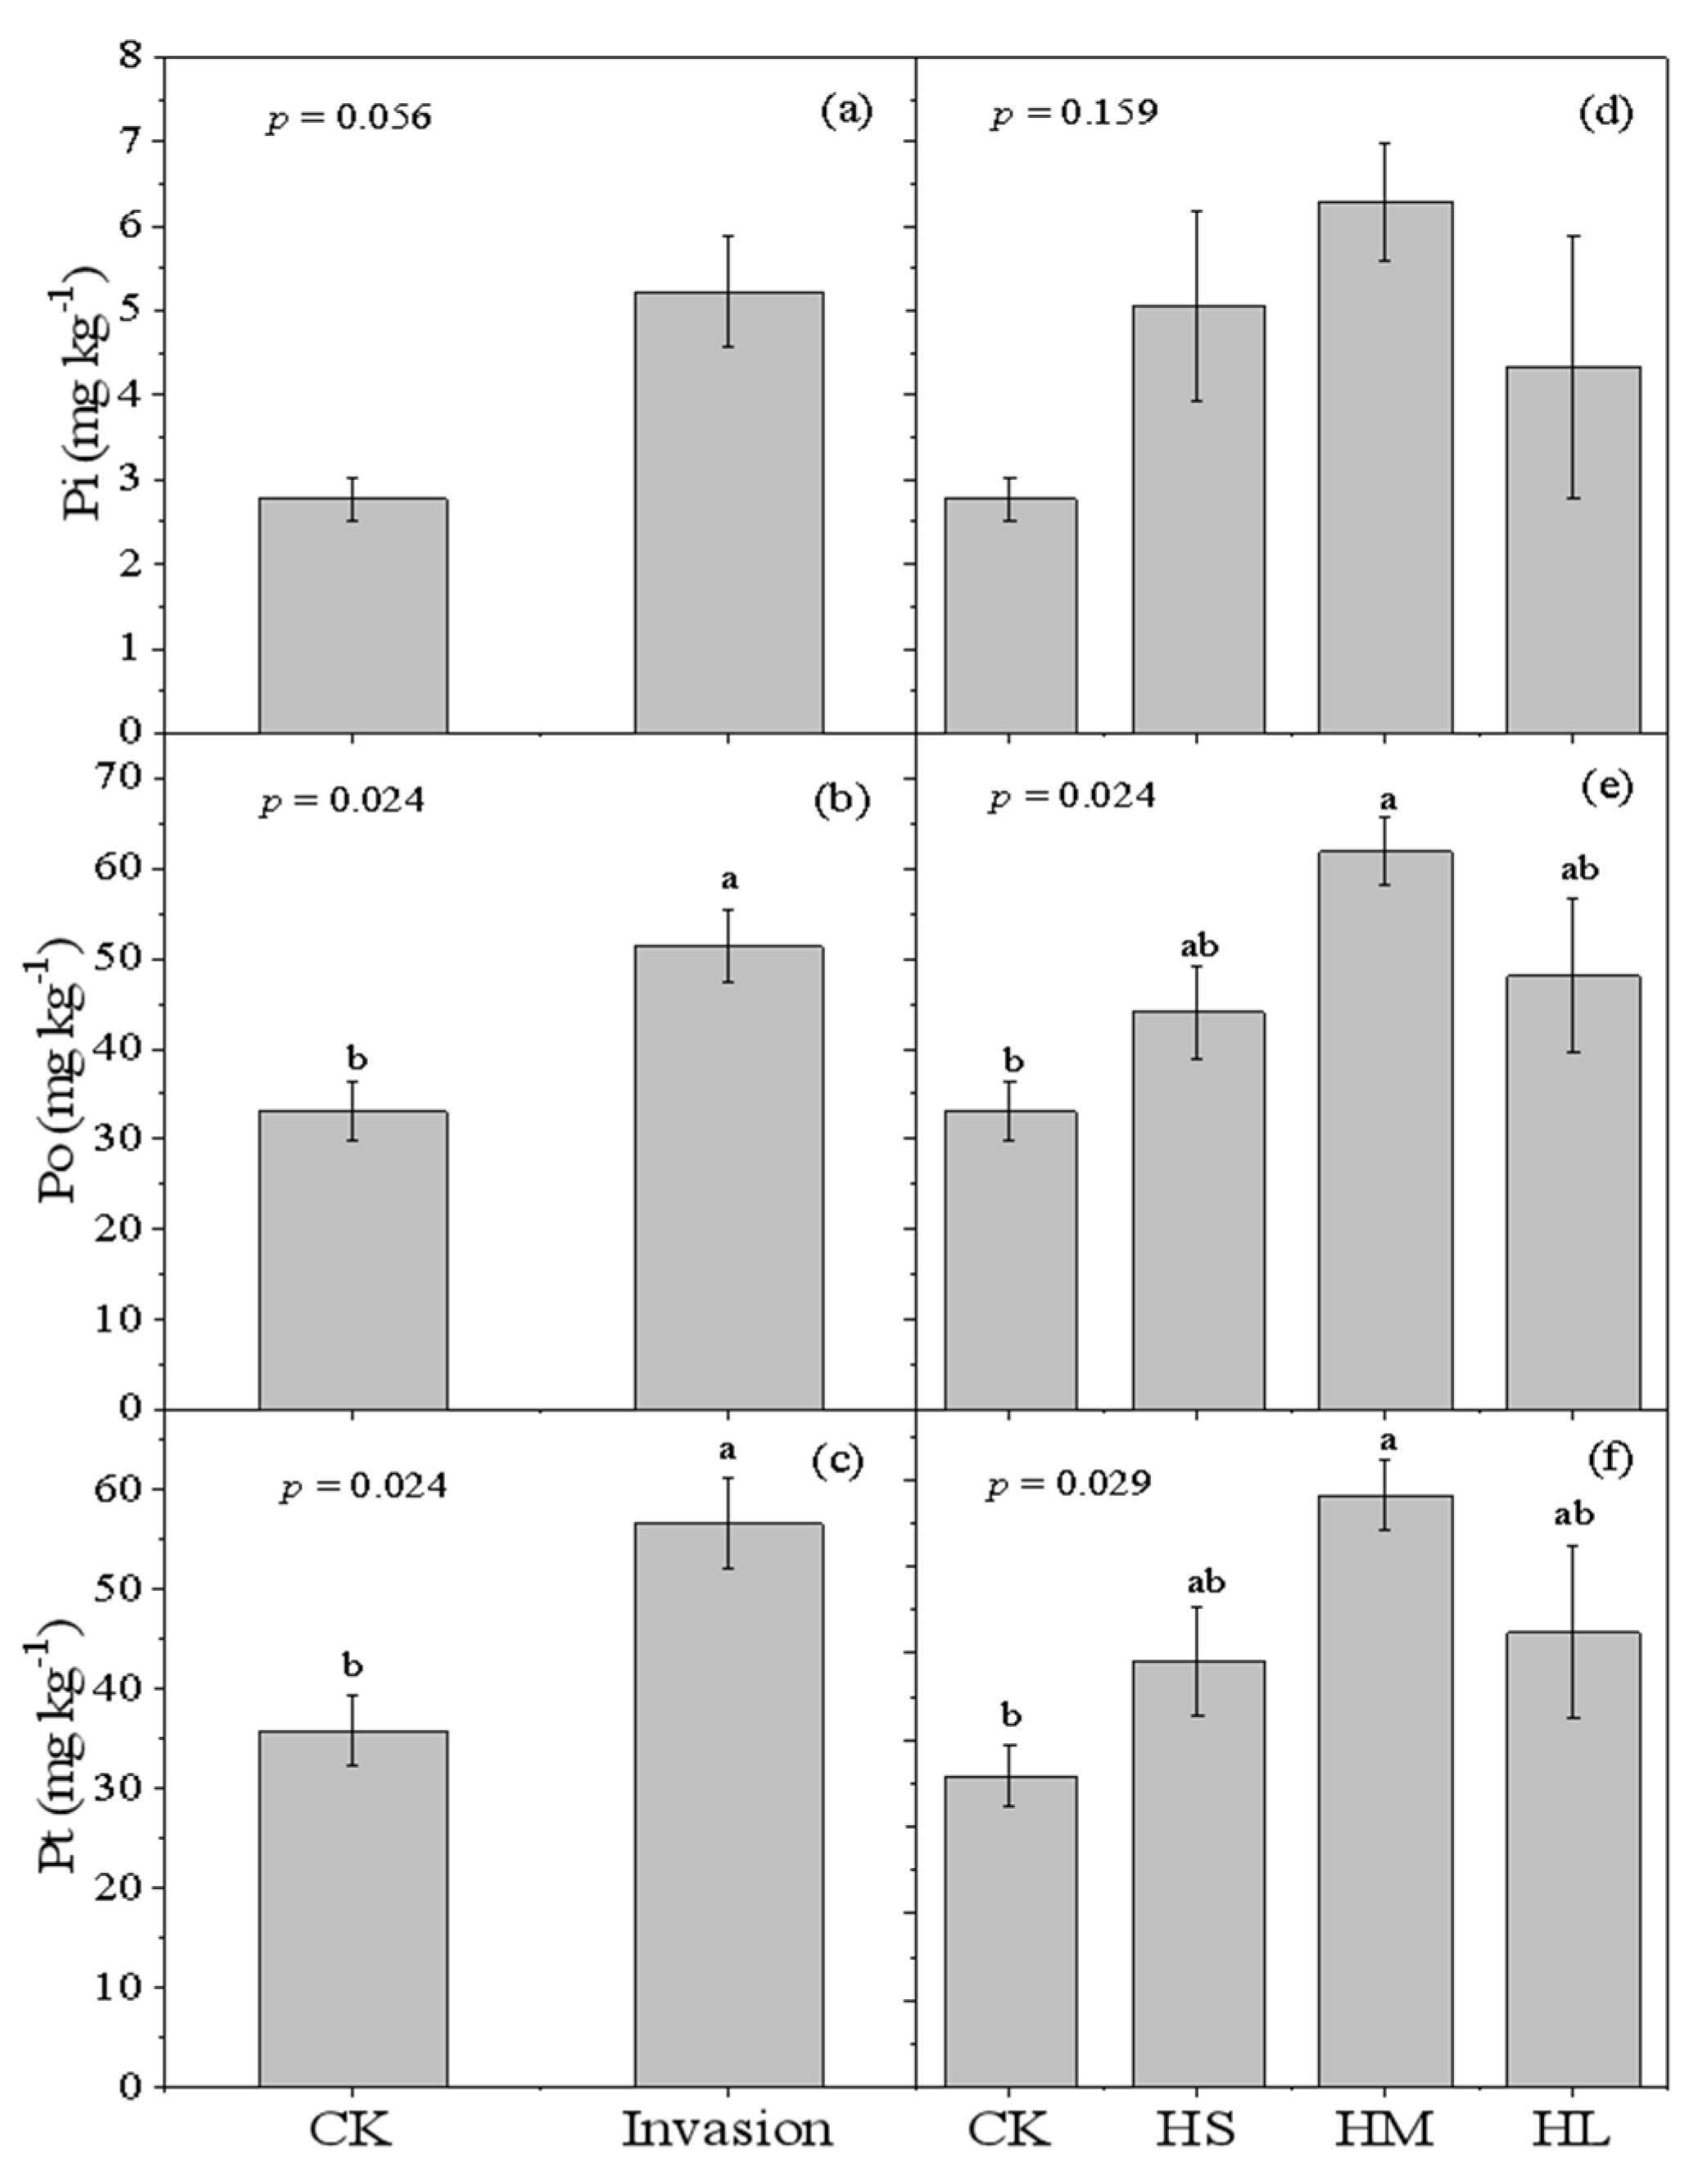
3.1. Soil Pt, Po and Pi Concentrations

Soil Pt (p = 0.024) and Po (p = 0.024) differed significantly between natural shrub-grass and the L. leucocephala plantations, whereas Pi (p = 0.056) did not (Figure 1a–c). The values of Pt and Po in L. leucocephala plantations were significantly higher than those in the natural shrub-grass plots (Figure 1b,c). Po (p = 0.024) and Pt (p = 0.029) differed significantly among the natural shrub-grass plots and at different stages of the L. leucocephala plantations, whereas Pi (p = 0.159) did not (Figure 1d–f). Po and Pt values were significantly higher during the HM stage (Figure 1e,f).

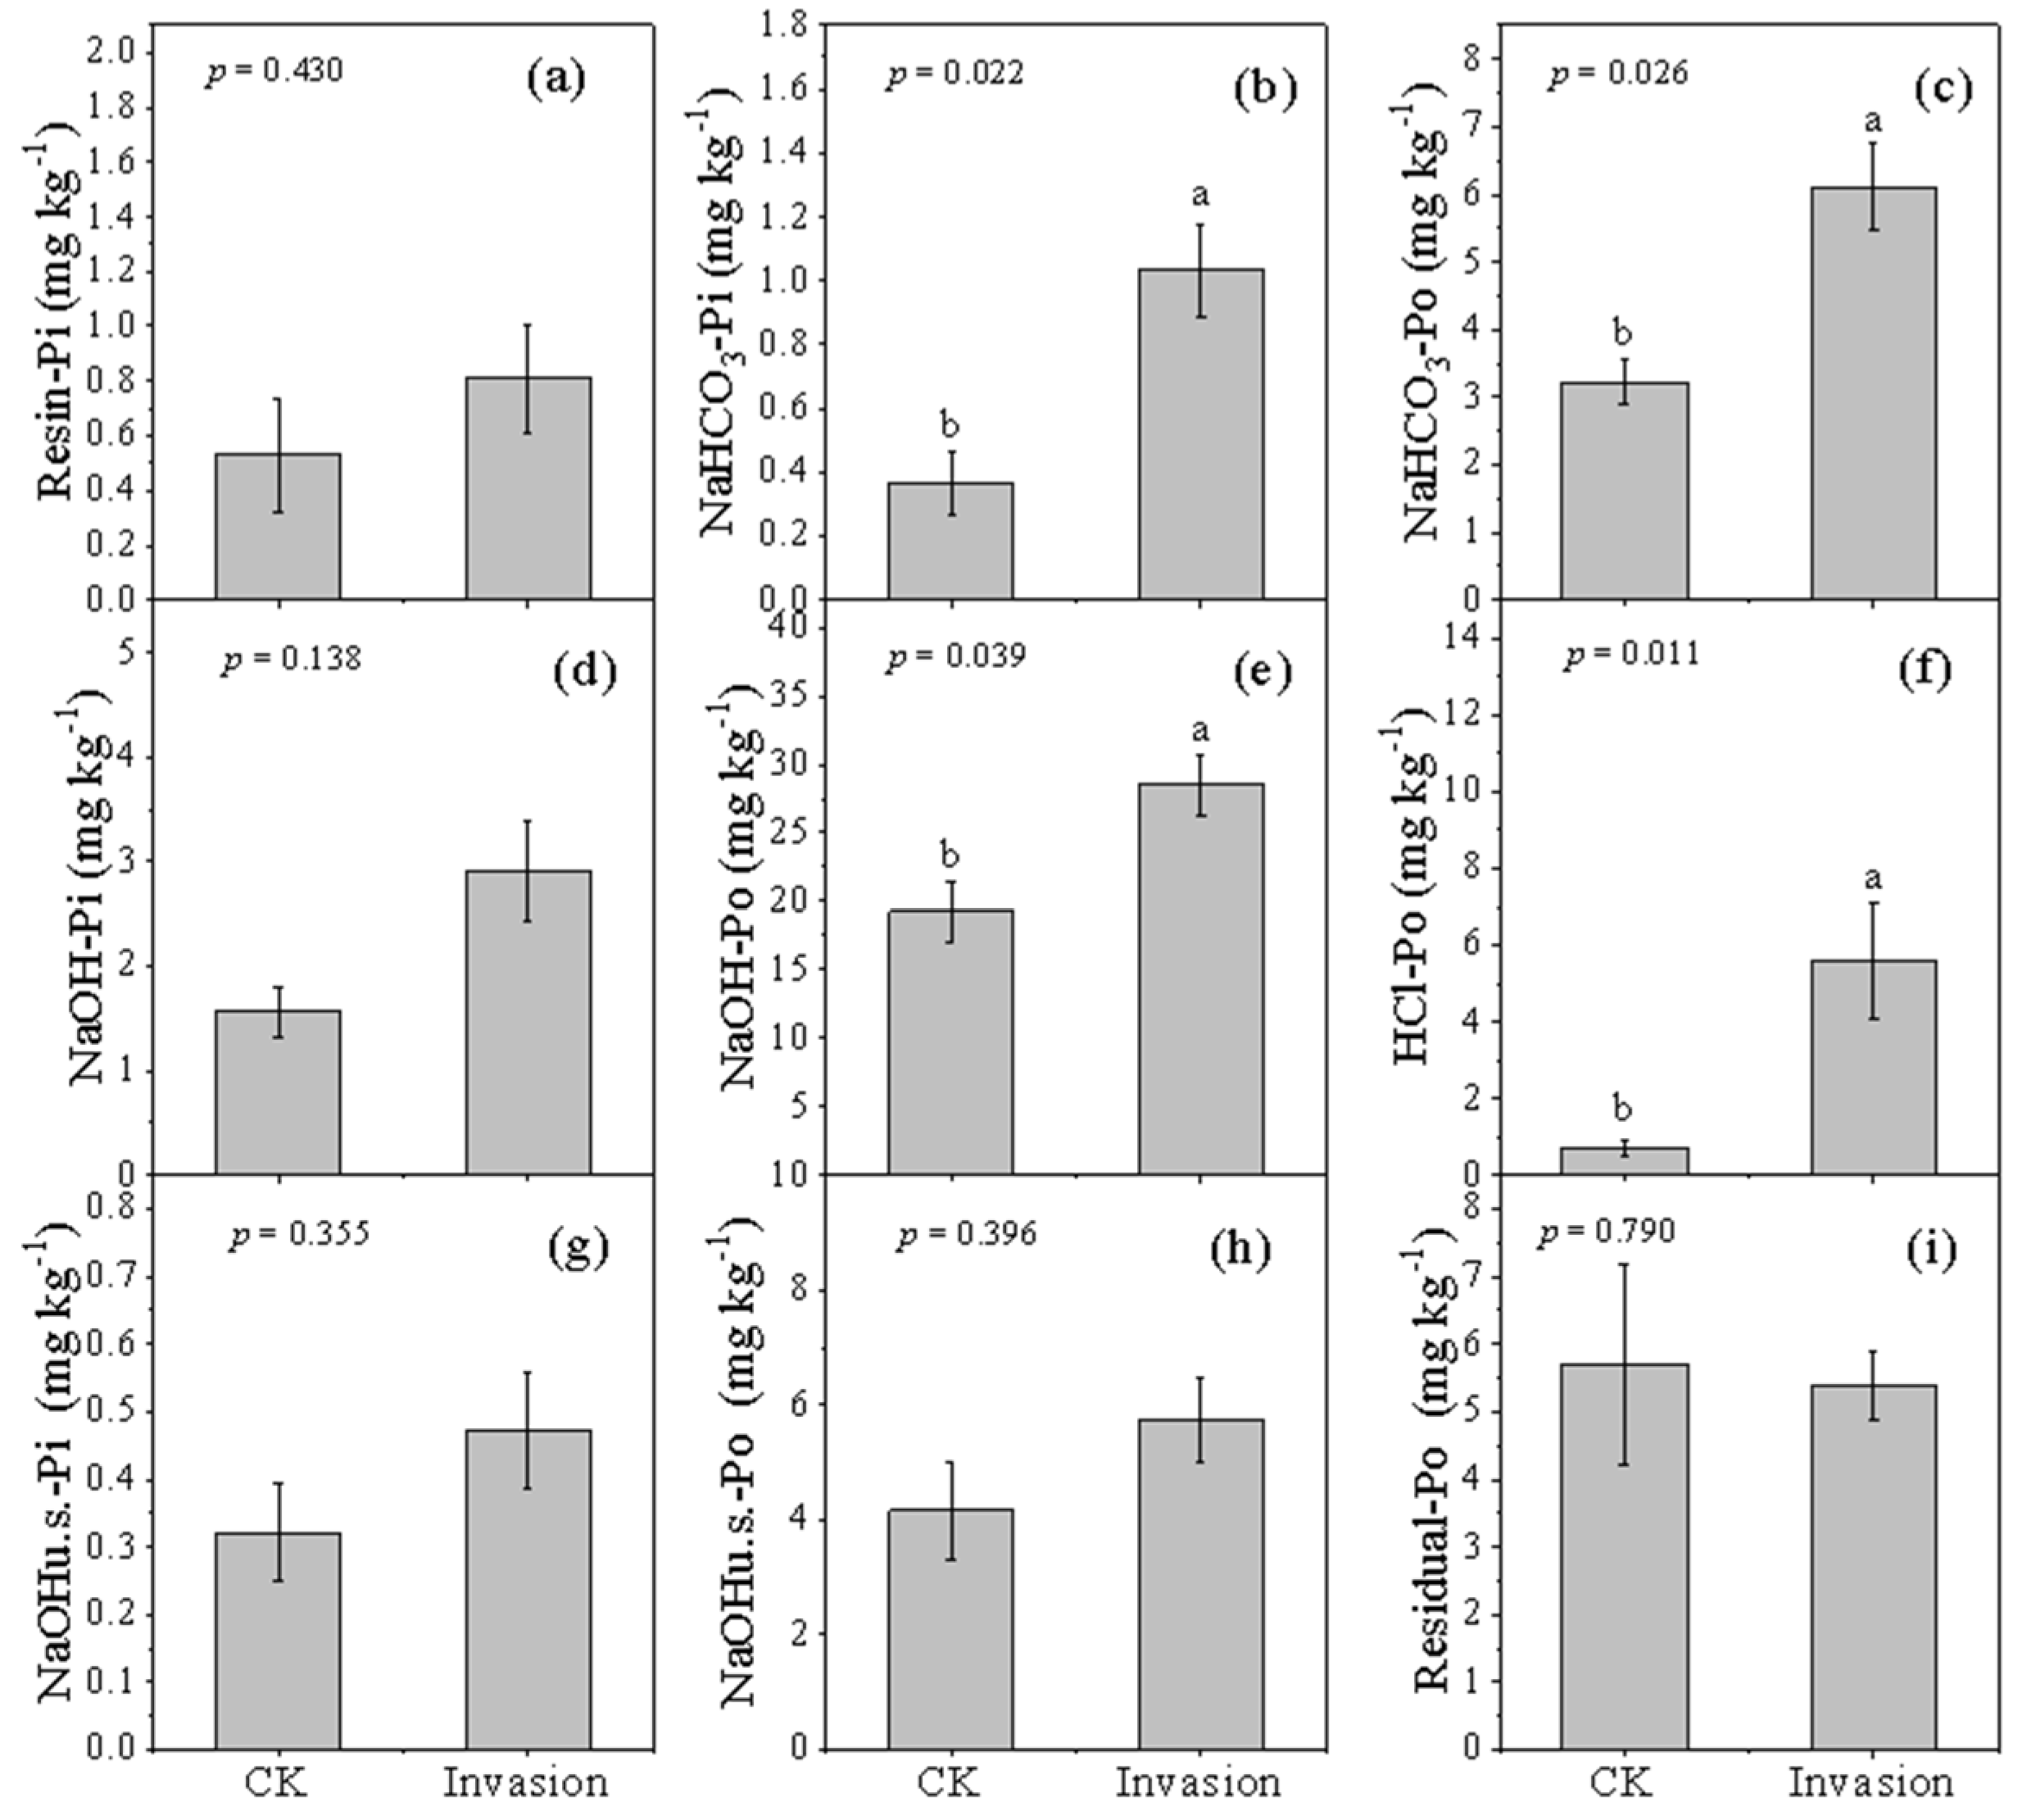
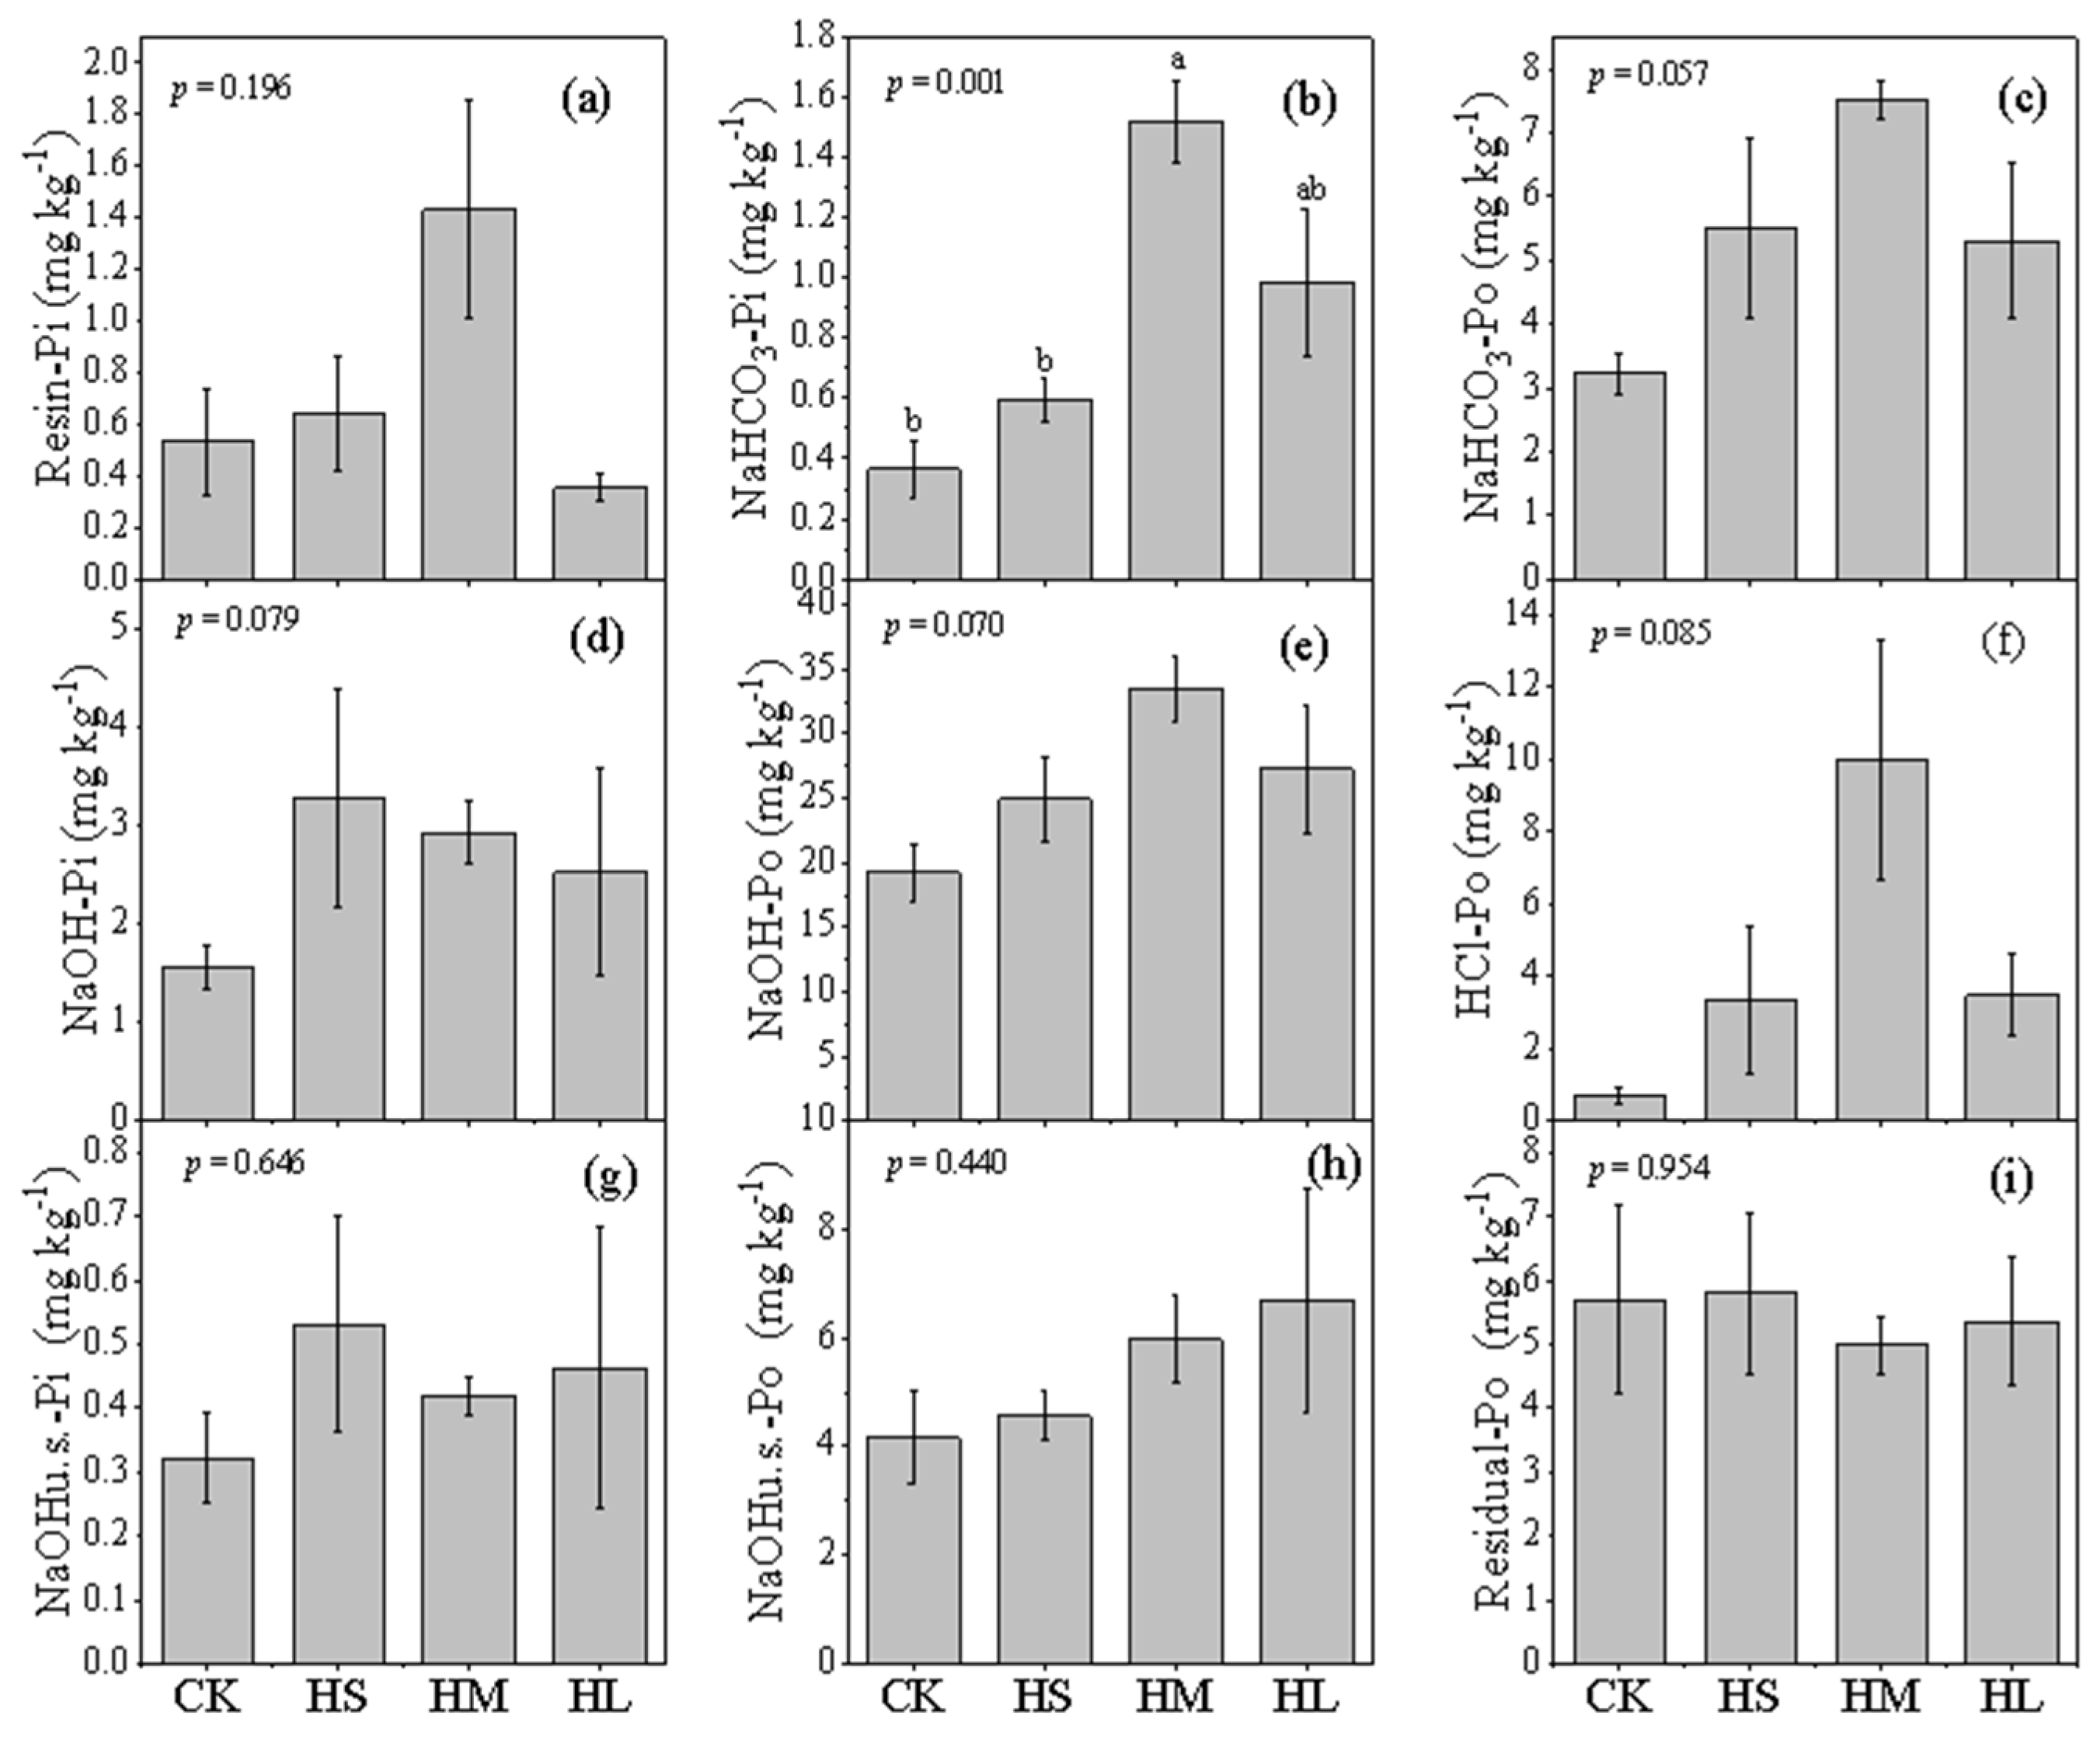
3.2. Soil P Fractions Concentration

Soil Pt consisted of Labile P (11.70–15.46%), Moderately labile P (60.03–67.85%), and Non-labile P (16.69–28.27%) among the natural shrub-grass plots and at different stages of the L. leucocephala plantation (Supplementary Figure S2).
Labile P differed significantly between the natural shrub-grass and the L. leucocephala plantations (p = 0.020), and this value in L. leucocephala plantations was significantly higher than that at natural shrub-grass plots (Figure 2a). Soil NaHCO3-Pi and NaHCO3-Po significantly increased in L. leucocephala plantations (Figure 3b,c). Labile P also differed significantly among the natural shrub-grass plots and at different stages of the L. leucocephala plantation (p = 0.008) and was highest in the HM stage (Figure 2d). Soil NaHCO3-Pi differed significantly among the natural shrub-grass plots and at different stages of the L. leucocephala plantation (p = 0.001) and was highest in the HM stage (Figure 4b).
Moderately labile P differed significantly between the natural shrub-grass and L. leucocephala plantations (p = 0.027), and this value in the L. leucocephala plantations was significantly higher than that in the natural shrub-grass plots (Figure 2b). Soil NaOH-Po (p = 0.039) and HCl-Po (p = 0.011) were significantly increased in the L. leucocephala plantations (Figure 3e,f). Moderately labile P also differed significantly among the natural shrub-grass plots and at different stages of the L. leucocephala plantation (P = 0.026) and was highest in the HM stage (Figure 2e). Non-labile P did not differ significantly between the natural shrub-grass and the L. leucocephala plantations (p = 0.432, Figure 2c), and it also differed insignificantly between the natural shrub-grass plots and at different stages of the L. leucocephala plantation (p = 0.768, Figure 2f).

3.3. Soil ACP Activities, SMBP, and Abundance of Soil Microbe

There were no significant differences in soil ACP activities, SMBP, total bacterial abundance, and fungal abundance between the natural shrub-grass and the L. leucocephala plantations, whereas actinomycete abundance differed significantly (p = 0.033, Figure 5a–e). L. leucocephala plantations significantly increased the actinomycete abundance (Figure 5e). There were no significant differences in soil ACP activity, total bacterial abundance, fungal abundance, or actinomycete abundance among the natural shrub-grass plots and at different stages of the L. leucocephala plantation, whereas SMBP differed significantly (p = 0.018, Figure 5f–j). The SMBP value was the highest in the HL stage (Figure 5g).

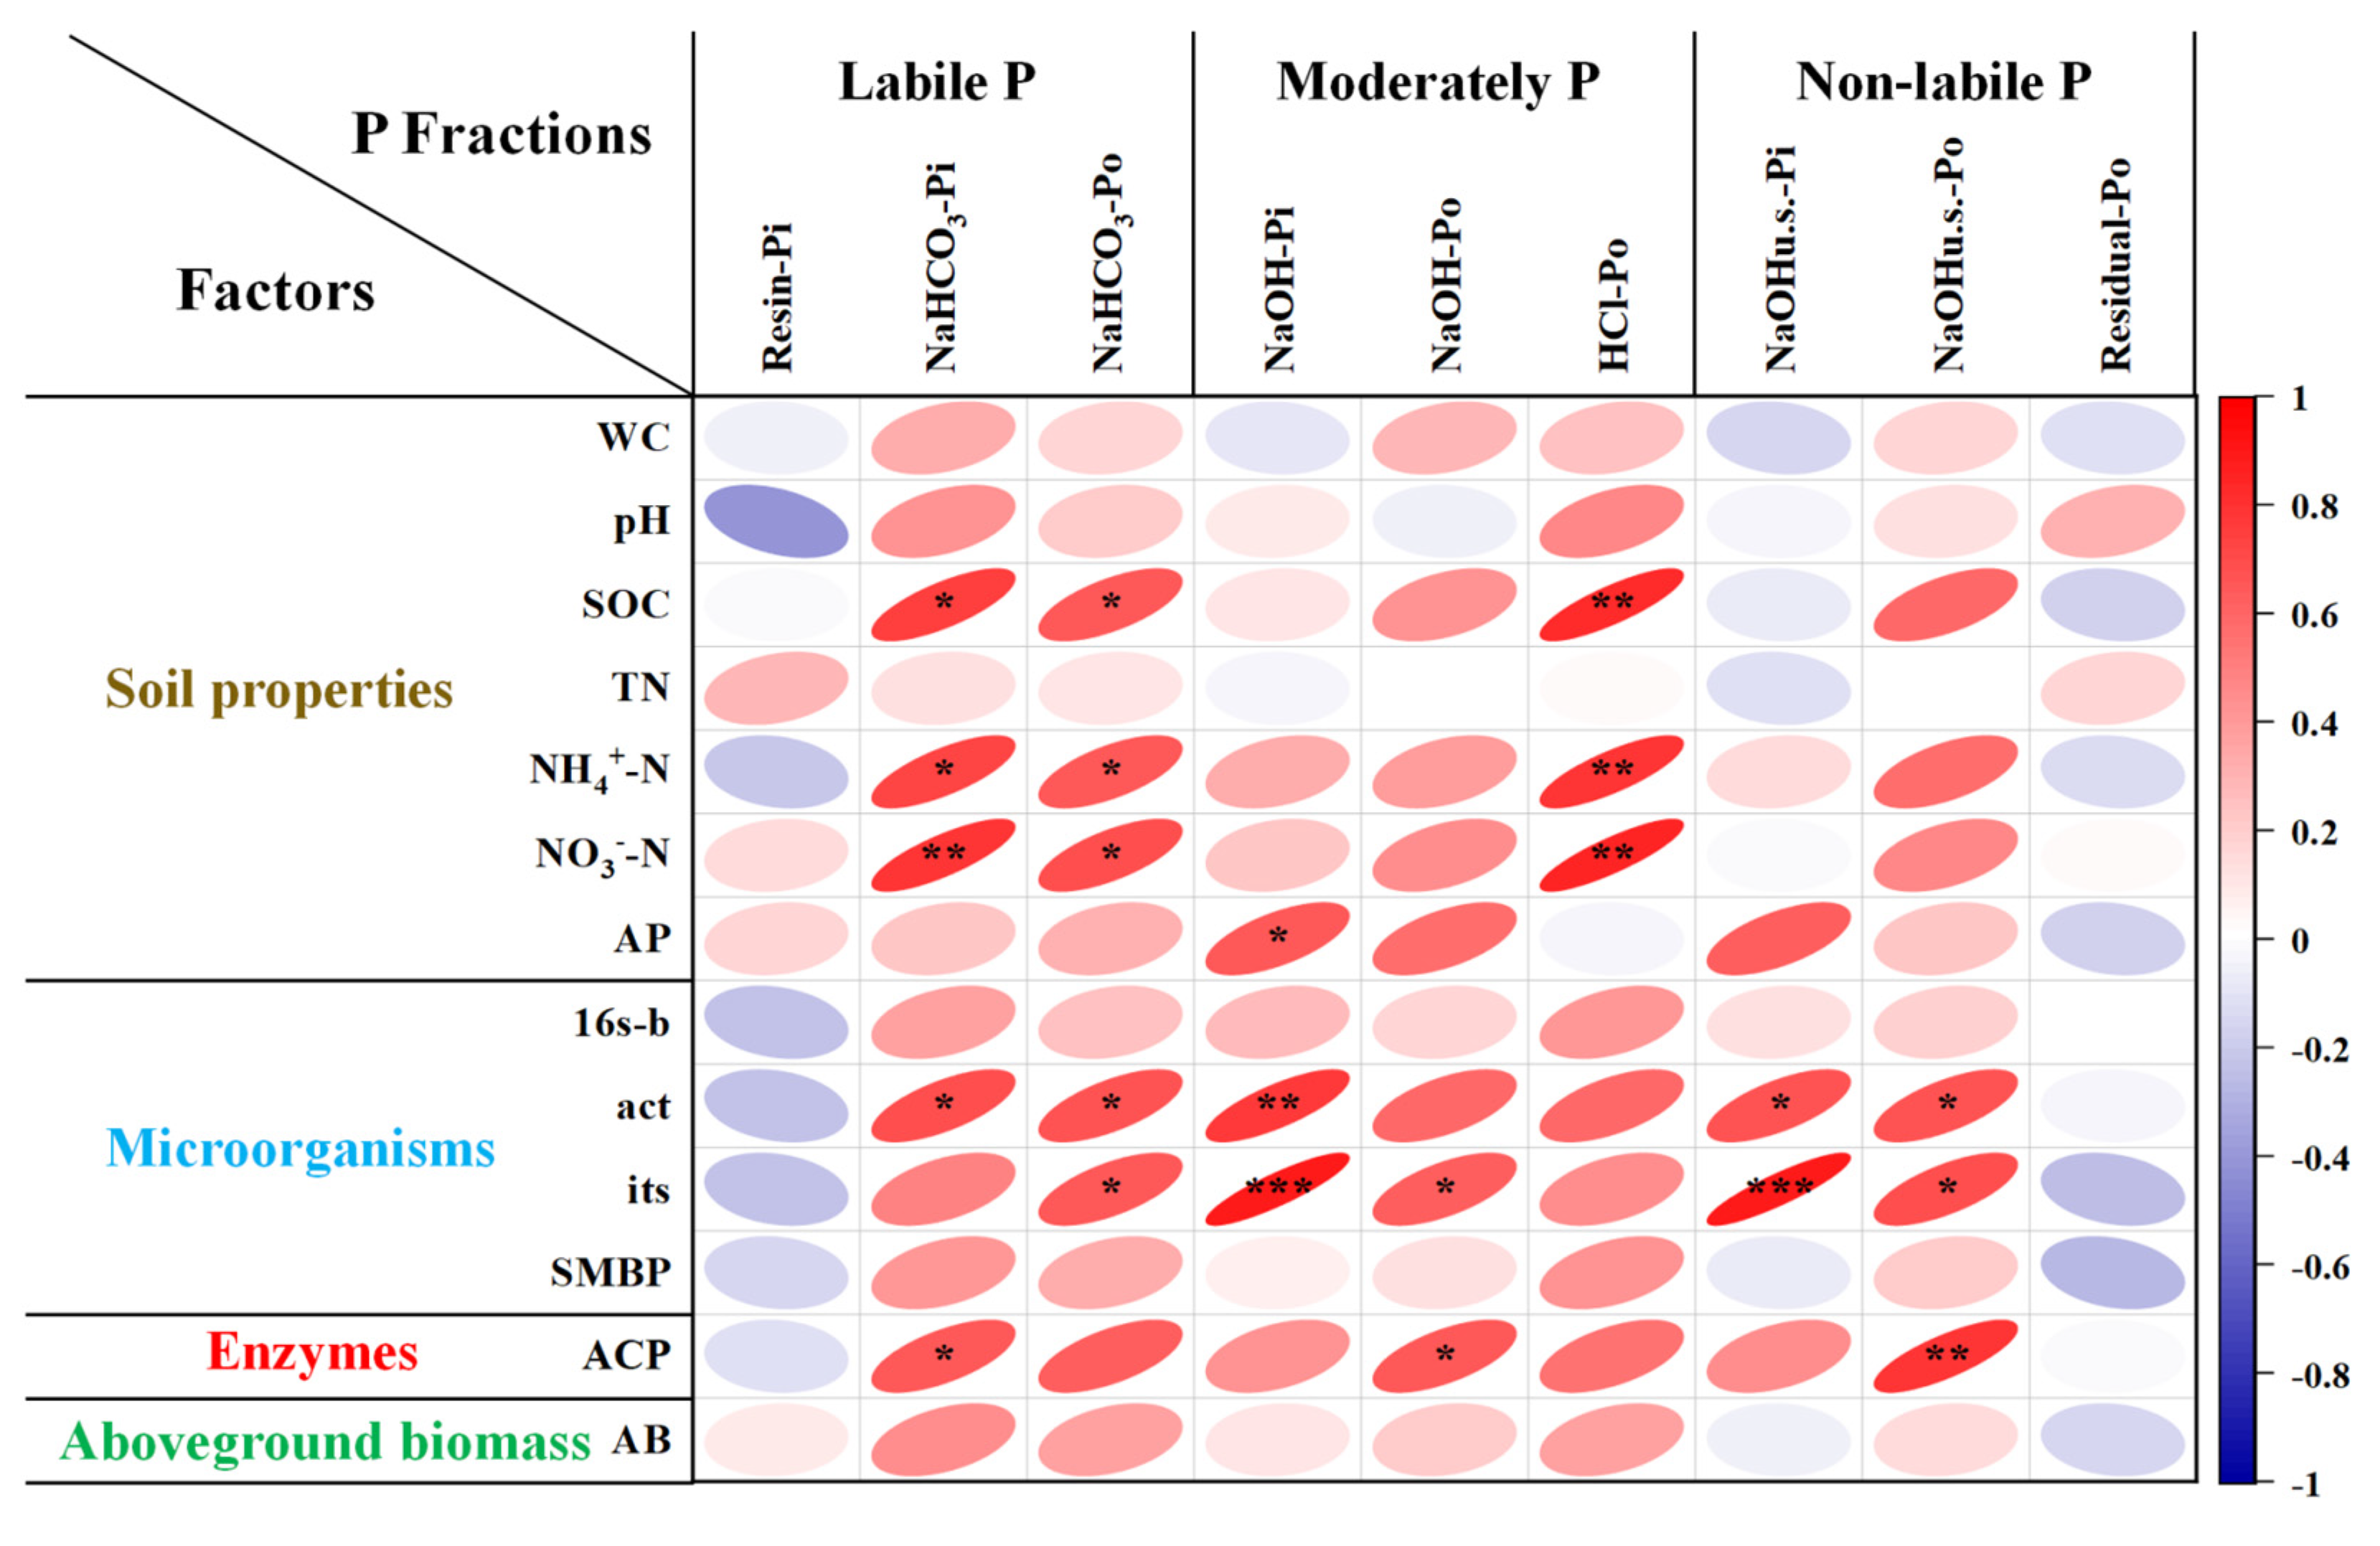
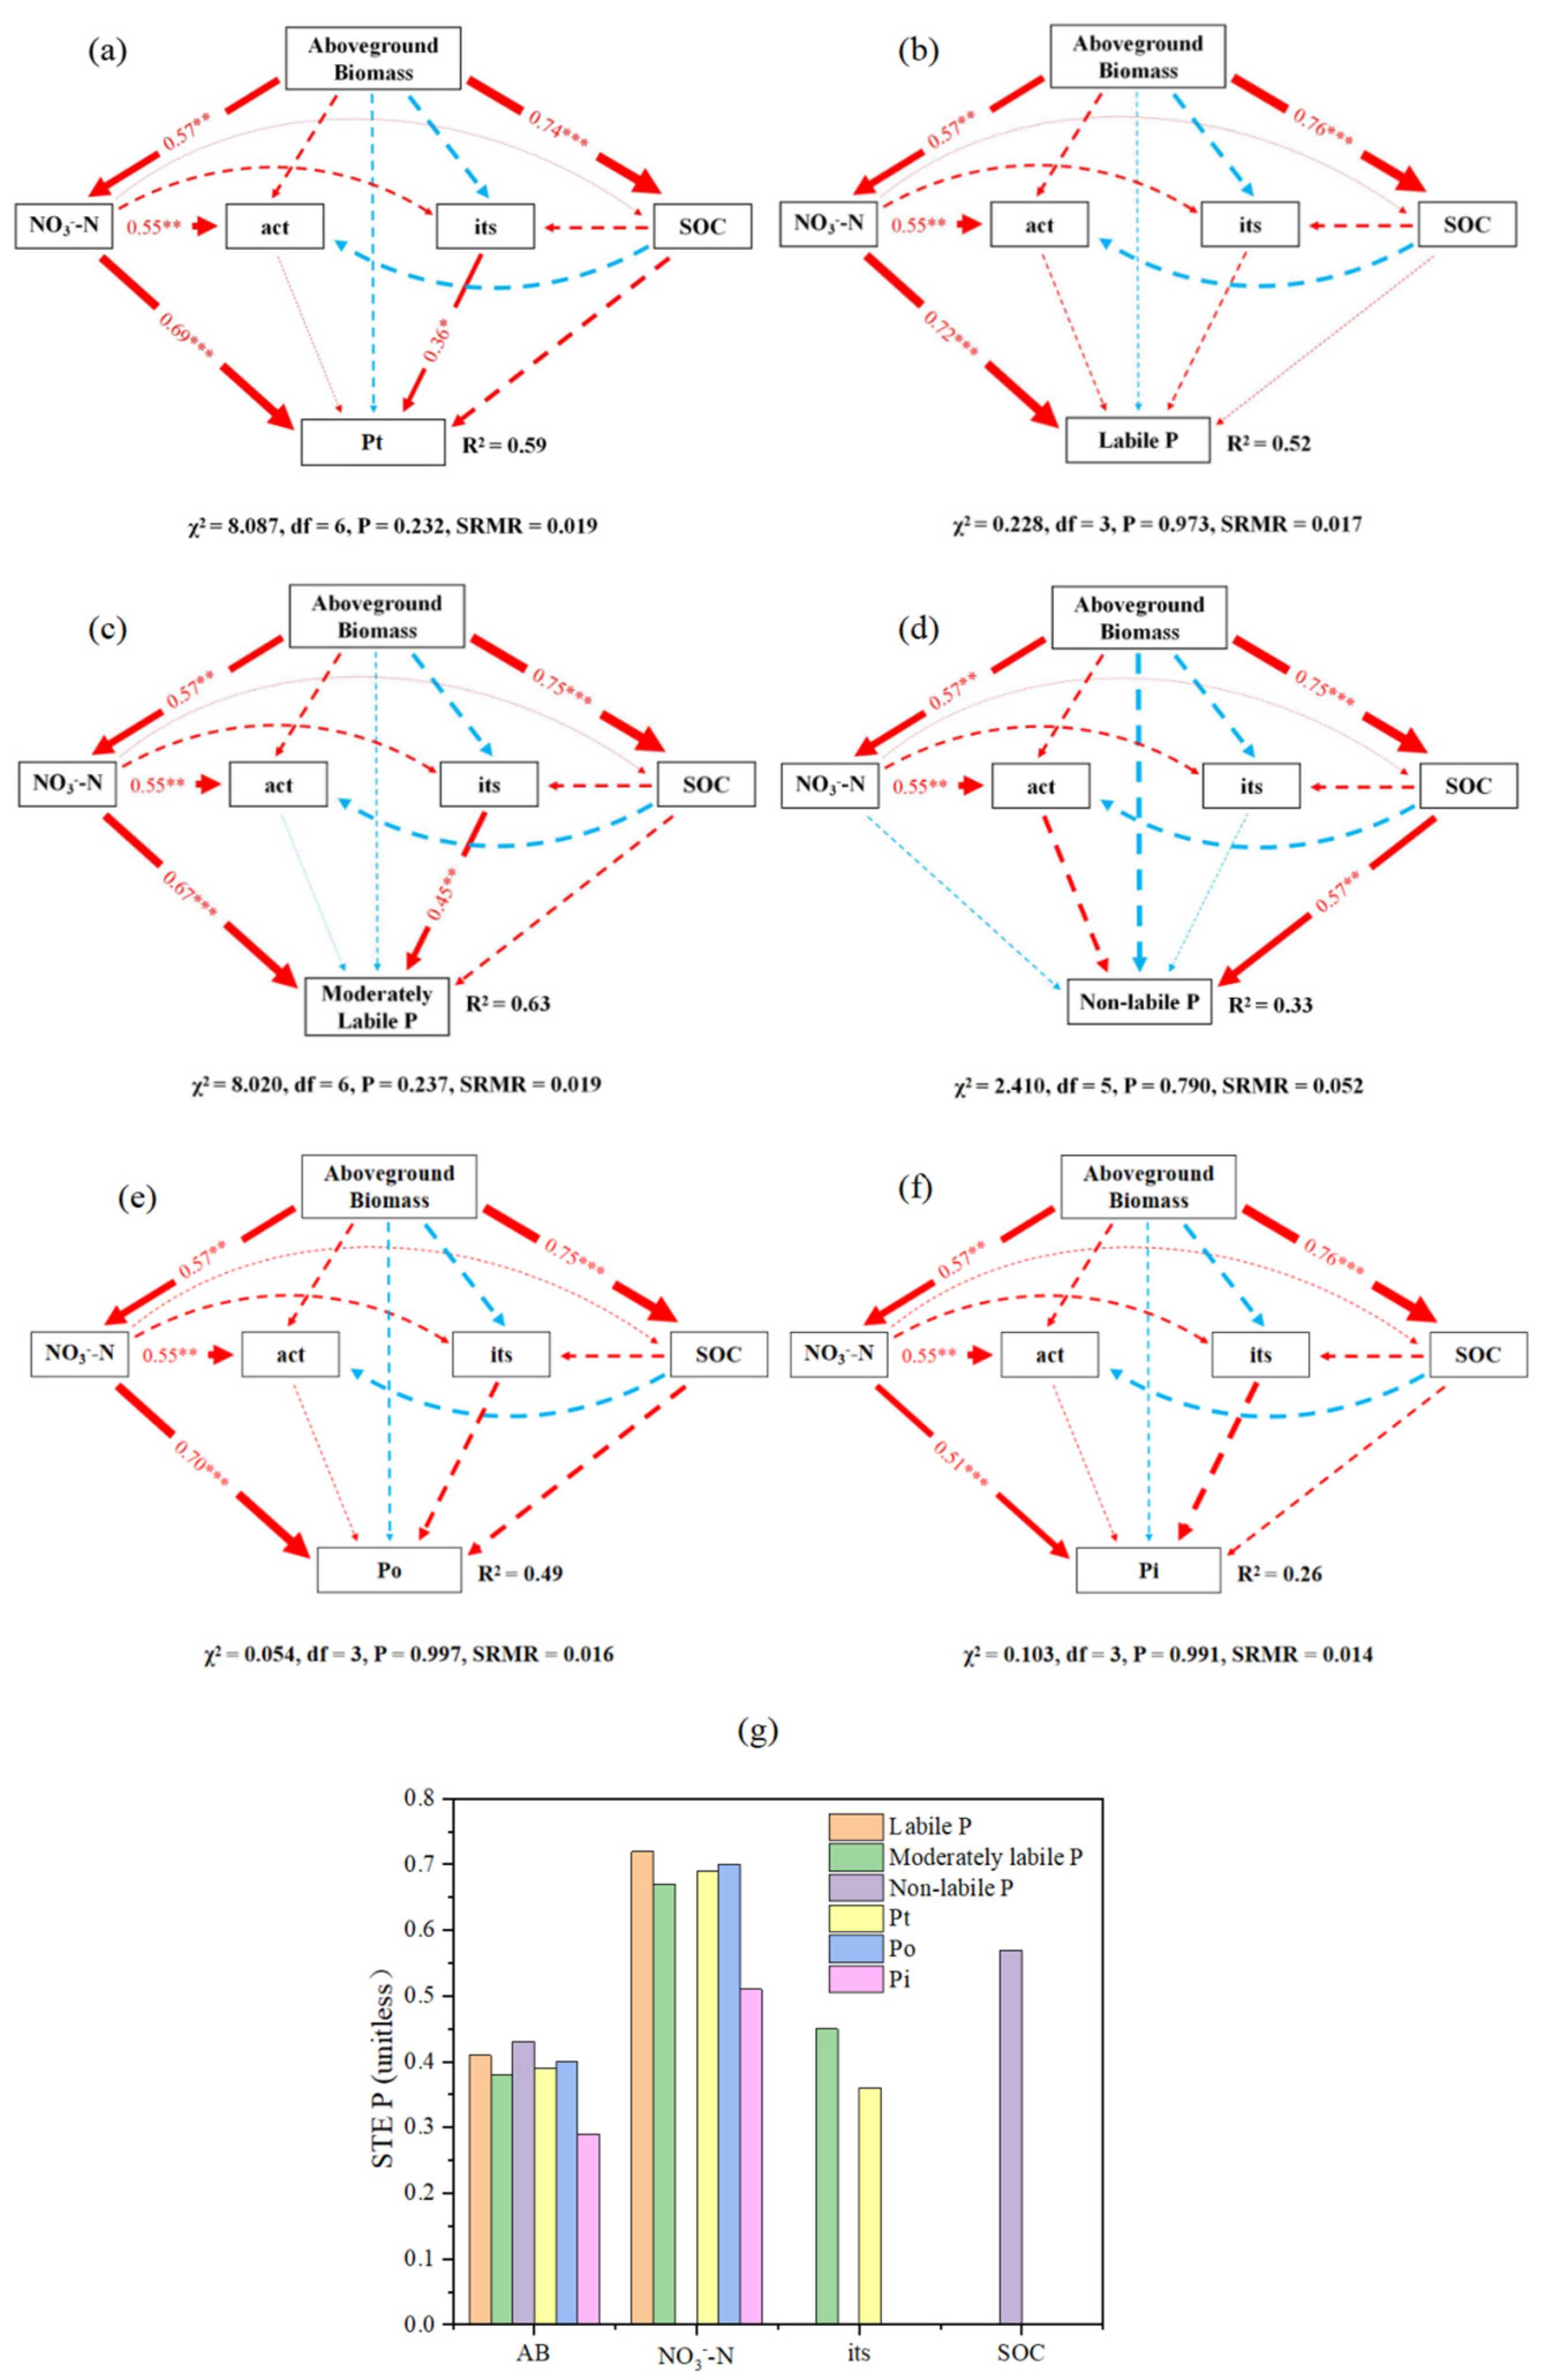
3.4. Correlation between P Fractions and Aboveground Biomass, Soil Biochemical Properties

Pearson analyses related abiotic and biotic factors to soil P fractions, Pt, Po, and Pi are presented in Figure 6. SOC, NH4+-N, NO3-N, actinomycete abundance, fungal abundance, and ALP showed significant positive relationships with P fractions, Pt, Po, and Pi (p < 0.05, Figure 6). Our SEM explained 59% and 63% of the variation in soil Pt and soil moderately labile P, and soil Pt and soil moderately labile P were significantly and directly influenced by NO3-N and fungal abundance (Figure 7a,c). Aboveground biomass has an indirect effect and can affect soil Pt and soil moderately labile P by modifying the properties of NO3-N and fungal abundance. According to the standardized total effects, changes in soil NO3-N and aboveground biomass were the predominant factors that directly and indirectly influenced soil Pt (Figure 7g). Changes in soil NO3-N and fungal abundance were the predominant factors that directly influenced moderately labile P (Figure 7g). Our SEM analysis explained 52%, 49%, and 26% of the soil labile P, Po, and Pi variation, respectively, and soil labile P, Po and Pi were significantly and directly influenced by NO3N (Figure 7b,e,f). Aboveground biomass has an indirect positive effect and can affect soil labile P, Po, and Pi by modifying the properties of soil NO3-N. According to the standardized total effects, changes in soil NO3-N and aboveground biomass were the predominant factors that directly and indirectly influenced soil labile P, Po, and Pi (Figure 7g). In contrast, our SEM explained only 33% of the soil non-labile variation, which was significantly and directly influenced by SOC (Figure 7d). Aboveground biomass has an indirect and positive effect, and it can affect soil non-labile P by modifying the property of SOC. According to the standardized total effects, changes in SOC and aboveground biomass were the predominant factors that directly and indirectly influenced non-labile soil P (Figure 7g).

4. Discussion

4.1. Dynamics of Soil P fractions under Afforestation

Our results provide experimental evidence demonstrating that soil P fractions vary between L. leucocephala plantations and natural shrub grass in the dry-hot valley in Yunnan. Notably, L. leucocephala plantations significantly increased the soil Pt and Po (Figure 1a,b). Extractable Po (the sum of labile Po, moderately labile Po and non-labile Po) accounted for approximately 90% of the total soil extractable P (Supplementary Figure S3). This indicates that the L. leucocephala plantation increased soil Pt content by significantly increasing soil Po, and soil Po was the primary source of available P in the L. leucocephala plantation, which highlights the importance of organic P in soil P dynamics [51]. Our results were consistent with those of other studies showing that vegetation restoration increased P storage capacity [33], and that organic P fractions play a key role in soil P dynamics [10,30]. Moreover, labile Po and moderately labile Po accounted for approximately 75% of soil Po (Supplementary Figure S3), indicating that labile Po and moderately labile Po played critical roles in sustaining soil P availability following the L. leucocephala plantation in the dry-hot valley in Yunnan. Soil Pi increased insignificantly in the L. leucocephala plantation (Figure 1c), indicating that the primary source of P for plant growth had an increasing trend in the L. plantation.
L. leucocephala plantations significantly increased soil labile P and moderately labile P, while non-labile P did not (Figure 2a–c); our results are consistent with those from a previous study [33]. The results indicate the significance of L. leucocephala plantations in modifying soil P cycling. L. leucocephala plantations increased soil P transformation ability, so that the P fractions developed in a direction more beneficial to plant growth and uptake. However, this finding was inconsistent with previous research reporting that afforestation reduced the soil labile P fraction by increasing plant productivity in afforested lands through the uptake of more available nutrients from the soil [21]. In our study, nitrogen-fixing species plantations enhanced labile P, which may have been due to the accumulation of litter and microbial decomposition during plant growth [52], resulting in increased P transfer from deep soil to the surface soil.
Revegetation ages were shown to have a significant effect on soil Pt and its fractions [11,32]; however, in this study we found that soil Pt, Po, Pi, labile P, moderately labile P and non-labile P had no significant effect on the different stages of the L. leucocephala plantation. Soil Pt and its fractions were all significantly higher in the middle-age forest stage of the L. leucocephala plantation (Figure 1 and Figure 2), indicating that the middle-age forest stage of the L. leucocephala plantation had the best conditions for P stock and P conversion capacity.

4.2. Factors Driving Soil P Dynamics

Our results indicate that abiotic and biotic factors differently affected soil P fractions and Pt in L. leucocephala plantations in the dry-hot valley in Yunnan, which is consistent with studies indicating that soil P fractions are influenced by biotic and abiotic factors [30,53,54]. Soil microbes play an integral role in P availability and labile P fraction transformation [54,55]. These microorganisms are known as P-solubilizing actinomyces, bacteria and fungi [56]. In this study, we found that biotic factors, such as actinomycete and fungal abundance, showed significant and positive relationships with soil Pi fractions (NaHCO3-Pi, NaOH-Pi, and NaOHu.s.-Pi) (Figure 6), and soil Pt and moderately labile P were significantly and directly influenced by fungal abundance (Figure 7). Bacterial abundance did not affect soil P fractions or Pt (Figure 6 and Figure 7). These results indicate that P-solubilizing fungi, rather than bacteria, contribute to P bioavailability and transformation. Usually, plant symbiosis with arbuscular mycorrhizal fungi is a vital strategy to adapt to the regional high temperatures and low soil-nutrient availability in the dry-hot valley [57]. This probably induced the stronger link between fungi and soil P transformation. These findings also highlight the important role of fungi on soil P dynamics and their subsequent role in promoting the sustainability of nitrogen-fixing plantations. Aboveground biomass can affect total soil P and P fractions by mainly modifying abiotic factors indirectly (Figure 7). SOC, NH4+-N, and NO3-N showed significant and positive relationships with the soil Pi fractions (NaHCO3-Pi, NaHCO3-Po, and HCl-Po) (Figure 6), and SOC and NO3-N were the key drivers of soil Pt, labile P, moderately labile P, and non-labile fractions (Figure 7). Thus, the increase in SOC and NO3-N with increasing aboveground biomass (L. leucocephala plantation) was attributed to soil Pt accumulation and P fractions. These results indicate that high levels of SOC and NO3-N were beneficial to soil P bioavailability, transformation, and the accumulation of soil Pt, which is further supported by previous studies showing that SOC is an important factor in regulating changes in P fractions [21,30]. Consequently, we can infer that the effect of SOC and N availability is mainly related to the following two aspects. On the one hand, increased N availability can directly promote the N-rich protein (i.e., phosphatases) synthesis, these more synthetic phosphatases are able to maintain the higher plant P demand [58]. On the other hand, our previous study found that encroachment of L. leucocephala elevated the SOC [44]. It was been suggested that the higher SOC alters metal complexation and dissolution reactions and indirectly enhances P sorption [59,60]. Thus, it is reasonable to speculate that microbial demand for C may drive phosphorus mineralization [54,61]. These results presented herein help to improve our mechanistic understanding of soil P availability and the coupling of soil N–P cycling during the development of N2-fixing forest plantations, this in turn provides scientific support for development of sustainable forest plantations in the dry-hot valley.

5. Conclusions

In summary, this study explored the soil P fractions and their driving factors under afforestation in a dry-hot valley in southwest China. Our findings showed that Leucaena leucocephala plantations increased soil P transformation ability, and that soil Po played a critical role in sustaining soil P availability. The stand stages of Leucaena leucocephala plantations had no significant effect on soil Pt, Po, Pi, labile P, moderately labile P and non-labile P. Fungi, SOC and N availability differently affected soil P fractions and Pt in Leucaena leucocephala plantations in the dry-hot valley. Our study provides an understanding of the mechanisms of soil P transformation and dynamics in N2-fixing forest plantations and will contribute to the sustainable management of N2-fixing plantations in dry-hot valleys.

Supplementary Materials

The following supporting information can be downloaded at: https://www.mdpi.com/article/10.3390/f15060974/s1, Table S1: The basic soil physical and chemical properties; Figure S1: Map of study sites, showing the location and appearance of the natural shrub grass and Leucaena leucocephala plantations in a Dry-Hot Valley; Figure S2: One-way analysis of variances of the relative abundance of labile P, moderately labile P and non-labile P concentrations to the sum of soil P fractions at natural shrub grass and Leucaena leucocephala plantations in a Dry-Hot Valley; Figure S3: One-way analysis of variances of the relative abundances of each P fraction to the sum of soil P fractions at natural shrub grass and Leucaena leucocephala plantations in a Dry-Hot Valley.

Author Contributions

W.L., D.F. and B.H. conceived and designed the study; J.J., Y.L., C.L., J.Z. and M.G. collected the data; J.J., Y.L., C.L., J.Z. and M.G. contributed field sampling; W.L., L.Y. and D.F. performed the analysis; J.J., Y.L. and W.L. wrote the paper; W.L. and D.F. revised the paper. All authors have read and agreed to the published version of the manuscript.

Funding

This study was financially supported by the National Natural Science Foundation of China (32101594), Yunnan Fundamental Research Projects (NO. 202301AT070179) and Xingdian Talent Support Program (supporting W. Li, YNQR-QNRC-2018-089).

Data Availability Statement

Data are available on request due to privacy restrictions.

Acknowledgments

We are thankful to the Editor and anonymous reviewers for their constructive and insightful comments which improved the quality of the manuscript a lot.

Conflicts of Interest

The authors declare that they have no known competing financial interests or personal relationships that could have appeared to influence the work reported in this paper.

References

  1. Spohn, M. Phosphorus and carbon in soil particle size fractions: A synthesis. Biogeochemistry 2020, 147, 225–242. [Google Scholar] [CrossRef]
  2. Hou, E.; Luo, Y.; Kuang, Y.; Chen, C.; Wen, D. Global meta-analysis shows pervasive phosphorus limitation of aboveground plant production in natural terrestrial ecosystems. Nat. Commun. 2020, 11, 637. [Google Scholar] [CrossRef] [PubMed]
  3. Lajtha, K.; Schlesinger, W.H. The Biogeochemistry of Phosphorus Cycling and Phosphorus Availability Along a Desert Soil Chronosequence. Ecology 1988, 69, 24–39. [Google Scholar] [CrossRef]
  4. Hou, E.; Luo, Y.; Kuang, Y.; Chen, C.; Lu, X.; Jiang, L.; Luo, X.; Wen, D. Phosphorus Changes and Sorption Characteristics in a Calcareous Soil Under Long-Term Fertilization—ScienceDirect. Pedosphere 2008, 18, 248–256. [Google Scholar]
  5. Condron, L.M.; Newman, S. Revisiting the fundamentals of phosphorus fractionation of sediments and soils. J. Soils Sediments 2011, 11, 830–840. [Google Scholar] [CrossRef]
  6. Harrison, A.F. Soil Organic Phosphorus A Review of World Literature; CAB International: Wallingford, UK, 1987. [Google Scholar]
  7. Benitez-Nelson, C.R.; Buesseler, K.O. Variability of inorganic and organic phosphorus turnover rates in the coastal ocean. Nature 1999, 398, 502–505. [Google Scholar] [CrossRef]
  8. Qing-Hui, H.; Dong-Hong, W.; Mei, M.A.; Chun-Xia, W.; Zi-Jian, W. New Method to Assess Phosphorus Bioavailability in the Sediments and Soils. Environ. Sci. 2005, 26, 206–208. [Google Scholar]
  9. Andrade dos Santos, E.D.; Yue Phin Tng, D.; Guimaraes Apgaua, D.M.; Assuncao, R.R.; Manzi, A.O. Soil phosphorus fractions and their relation to leaf litterfall in a central Amazonian terra firme rainforest. Acta Amaz. 2022, 52, 104–113. [Google Scholar] [CrossRef]
  10. Viana, T.d.O.; Gama-Rodrigues, A.C.; Gama-Rodrigues, E.F.; Aleixo, S.; de Souza Moreira, R.V.; da Silva Sales, M.V.; Bonadie Marques, J.R. Phosphorus transformations in alfisols and ultisols under different land uses in the atlantic forest region of Brazil. Geoderma Reg. 2018, 14, e00184. [Google Scholar] [CrossRef]
  11. Liu, C.; Jin, Y.; Liu, C.; Tang, J.; Wang, Q.; Xu, M. Phosphorous fractions in soils of rubber-based agroforestry systems: Influence of season, management and stand age. Sci. Total Environ. 2018, 616, 1576–1588. [Google Scholar] [CrossRef]
  12. Xu, G.; Shao, H.-B.; Sun, J.-N.; Chang, S.X. Phosphorus fractions and profile distribution in newly formed wetland soils along a salinity gradient in the Yellow River Delta in China. J. Plant Nutr. Soil Sci. 2012, 175, 721–728. [Google Scholar] [CrossRef]
  13. Cui, H.; Ou, Y.; Wang, L.; Wu, H.; Yan, B.; Han, L.; Li, Y. Identification of environmental factors controlling phosphorus fractions and mobility in restored wetlands by multivariate statistics. Environ. Sci. Pollut. Res. 2019, 26, 16014–16025. [Google Scholar] [CrossRef] [PubMed]
  14. Herlihy, M.; McCarthy, J. Association of soil-test phosphorus with phosphorus fractions and adsorption characteristics. Nutr. Cycl. Agroecosystems 2006, 75, 79–90. [Google Scholar] [CrossRef]
  15. Cao, Z.; Kuehn, P.; He, J.-S.; Bauhus, J.; Guan, Z.-H.; Scholten, T. Calibration of Near-Infrared Spectra for Phosphorus Fractions in Grassland Soils on the Tibetan Plateau. Agronomy 2022, 12, 783. [Google Scholar] [CrossRef]
  16. Hedley, M.J.; Stewart, J.W.B.; Chauhan, B.S. Changes in Inorganic and Organic Soil Phosphorus Fractions Induced by Cultivation Practices and by Laboratory Incubations. Soil Sci. Soc. Am. J. 1982, 46, 970–976. [Google Scholar] [CrossRef]
  17. Cherubin, M.R.; Franco, A.L.C.; Cerri, C.E.P.; Karlen, D.L.; Pavinato, P.S.; Rodrigues, M.; Davies, C.A.; Cerri, C.C. Phosphorus pools responses to land-use change for sugarcane expansion in weathered Brazilian soils. Geoderma 2016, 265, 27–38. [Google Scholar] [CrossRef]
  18. Jian, Z.; Ni, Y.; Lei, L.; Xu, J.; Xiao, W.; Zeng, L. Phosphorus is the key soil indicator controlling productivity in planted Masson pine forests across subtropical China. Sci. Total Environ. 2022, 822, 153525. [Google Scholar] [CrossRef] [PubMed]
  19. Vitousek, P.M.; Porder, S.; Houlton, B.Z.; Chadwick, O.A. Terrestrial phosphorus limitation: Mechanisms, implications, and nitrogen-phosphorus interactions. Ecol. Appl. 2010, 20, 5–15. [Google Scholar] [PubMed]
  20. Garay, M.; Amiotti, N.; Zalba, P. Response of phosphorus pools in Mollisols to afforestation with Pinus radiata D. Don in the Argentinean Pampa. For. Ecol. Manag. 2018, 422, 33–40. [Google Scholar] [CrossRef]
  21. Bai, J.; Chen, R.; Men, X.; Cheng, X. Divergent linkages of soil phosphorus fractions to edaphic properties following afforestation in the riparian zone of the upper Yangtze river, China. Chemosphere 2023, 313, 137452. [Google Scholar] [CrossRef]
  22. Finzi, A.C.; Austin, A.T.; Cleland, E.E.; Frey, S.D.; Houlton, B.Z.; Wallenstein, M.D. Responses and feedbacks of coupled biogeochemical cycles to climate change: Examples from terrestrial ecosystems. Front. Ecol. Environ. 2011, 9, 61–67. [Google Scholar] [CrossRef]
  23. Yue, K.; Fornara, D.A.; Yang, W.; Peng, Y.; Li, Z.; Wu, F.; Peng, C. Effects of three global change drivers on terrestrial C:N:P stoichiometry: A global synthesis. Glob. Change Biol. 2017, 23, 2450–2463. [Google Scholar] [CrossRef]
  24. Chaer, G.M.; Resende, A.S.; Carneiro Campello, E.F.; de Faria, S.M.; Boddey, R.M. Nitrogen-fixing legume tree species for the reclamation of severely degraded lands in Brazil. Tree Physiol. 2011, 31, 139–149. [Google Scholar] [CrossRef]
  25. Chen, X.; Yang, J.; Zhu, X.; Liang, X.; Lei, Y.; He, C. N-fixing trees in wetland restoration plantings: Effects on nitrogensupply and soil microbial communities. Environ. Sci. Pollut. Res. 2016, 23, 24749–24757. [Google Scholar] [CrossRef]
  26. Hussain, A.; Chen, L.; Jamil, M.A.; Abid, K.; Khan, K.; Duan, W.; Li, C.; Khan, A. Changes in Soil-Phosphorus Fractions by Nitrogen and Phosphorus Fertilization in Korean Pine Plantation and Its Natural Forest. Forests 2022, 13, 527. [Google Scholar] [CrossRef]
  27. Zarif, N.; Khan, A.; Wang, Q. Linking Soil Acidity to P Fractions and Exchangeable Base Cations under Increased N and P Fertilization of Mono and Mixed Plantations in Northeast China. Forests 2020, 11, 1274. [Google Scholar] [CrossRef]
  28. Kunito, T.; Hiruta, N.; Miyagishi, Y.; Sumi, H.; Moro, H. Changes in phosphorus fractions caused by increased microbial activity in forest soil in a short-term incubation study. Chem. Speciat. Bioavailab. 2018, 30, 9–13. [Google Scholar]
  29. Yang, L.; Yang, Z.; Peng, Y.; Lin, Y.; Xiong, D.; Li, Y.; Yang, Y. Evaluating P availability influenced by warming and N deposition in a subtropical forest soil: A bioassay mesocosm experiment. Plant Soil 2019, 444, 87–99. [Google Scholar] [CrossRef]
  30. Yang, L.; Yang, Z.; Zhong, X.; Xu, C.; Lin, Y.; Fan, Y.; Wang, M.; Chen, G.; Yang, Y. Decreases in soil P availability are associated with soil organic P declines following forest conversion in subtropical China. Catena 2021, 205, 105459. [Google Scholar] [CrossRef]
  31. Cai, X.; Lin, Z.; Penttinen, P.; Li, Y.; Li, Y.; Luo, Y.; Yue, T.; Jiang, P.; Fu, W. Effects of conversion from a natural evergreen broadleaf forest to a Moso bamboo plantation on the soil nutrient pools, microbial biomass and enzyme activities in a subtropical area. For. Ecol. Manag. 2018, 422, 161–171. [Google Scholar] [CrossRef]
  32. Wang, Z.-R.; Niu, D.-C.; Hu, Y.-G.; Wang, Y.-S.; Huang, L.; Liu, Y.-B. Changes in soil phosphorus fractions associated with altered vegetation and edaphic conditions across a chronosequence of revegetated dunes in a desert area. Geoderma 2022, 424, 115995. [Google Scholar] [CrossRef]
  33. Yan, Z.; Wu, L.; Lv, T.; Tong, C.; Gao, Z.; Liu, Y.; Xing, B.; Chao, C.; Li, Y.; Wang, L.; et al. Response of spatio-temporal changes in sediment phosphorus fractions to vegetation restoration in the degraded river-lake ecotone. Environ. Pollut. 2022, 308, 119650. [Google Scholar] [CrossRef] [PubMed]
  34. Luo, L.; Ye, H.Y.; Zhang, D.H.; Gu, J.D.; Deng, O.P. The dynamics of phosphorus fractions and the factors driving phosphorus cycle in Zoige Plateau peatland soil. Chemosphere 2021, 278, 130501. [Google Scholar] [CrossRef] [PubMed]
  35. Chen, X.D.; Condron, L.M.; Dunfield, K.E.; Wakelin, S.A.; Chen, L.J. Impact of grassland afforestation with contrasting tree species on soil phosphorus fractions and alkaline phosphatase gene communities. Soil Biol. Biochem. 2021, 159, 108274. [Google Scholar] [CrossRef]
  36. Horodecki, P.; Jagodzinski, A.M. Tree species effects on litter decomposition in pure stands on afforested post-mining sites. For. Ecol. Manag. 2017, 406, 1–11. [Google Scholar] [CrossRef]
  37. Zhang, J. Human influence on land desertification in yuanmou dry-hot valley. J. Mt. Res. 1997, 1, 53–56. [Google Scholar]
  38. Ma, J.; Li, K. Effects of Plantation on Soil Nutrient and Evaluation in Yuanmou Dry-hot Valley. For. Res. 2006, 19, 467–471. [Google Scholar]
  39. Peng, S.; Chen, A.; Fang, H.; Wu, J.; Liu, G. Effects of vegetation restoration types on soil quality in Yuanmou dry-hot valley, China. Soil Sci. Plant Nutr. 2013, 59, 347–360. [Google Scholar] [CrossRef]
  40. Lin, Y.; Chen, A.; Yan, S.; Rafay, L.; Du, K.; Wang, D.; Ge, Y.; Li, J. Available soil nutrients and water content affect leaf nutrient concentrations and stoichiometry at different ages of Leucaena leucocephala forests in dry-hot valley. J. Soils Sediments 2019, 19, 511–521. [Google Scholar] [CrossRef]
  41. Gong, Z.; Tang, Y.; Xu, W.; Mou, Z. Rapid Sequestration of Ecosystem Carbon in 30-year Reforestation with Mixed Species in Dry Hot Valley of the Jinsha River. Int. J. Environ. Res. Public Health 2019, 16, 1937. [Google Scholar] [CrossRef]
  42. Gong, Z.; Li, Y.; Liu, L.; Deng, S. Great Facilitation of Thirty Years of Reforestation with Mixed Species to Ecosystem Nitrogen Accumulation in Dry-Hot Valley in the Jinsha River. Int. J. Environ. Res. Public Health 2022, 19, 12660. [Google Scholar] [CrossRef]
  43. Liu, F.Y.; Gao, C.J.; Chen, M.; Li, K. Above- and below-ground biomass relationships of Leucaena leucocephala (Lam.) de Wit in different plant stands. PLoS ONE 2018, 13, e0207059. [Google Scholar] [CrossRef]
  44. Lou, M.; Mao, J.; Shi, R.; Li, W.; Hu, B.; Feng, D. Characteristics of organic carbon and nitrogen in the particulate state of soils of new silver acacia plantation forests in dry and hot river valleys. For. Sci. Res. 2022, 35, 40–47. [Google Scholar]
  45. Kovar, J.L.; Pierzynski, G.M. Methods of Phosphorus Analysis for Soils, Sediments, Residuals, and Waters second edition. In Methods of Phosphorus Analysis for Soils; North Carolina State University: Raleigh, NC, USA, 2009. [Google Scholar]
  46. Saiya-Cork, K.R.; Sinsabaugh, R.L.; Zak, D.R. The effects of long term nitrogen deposition on extracellular enzyme activity in an Acer saccharum forest soil. Soil Biol. Biochem. 2002, 34, 1309–1315. [Google Scholar] [CrossRef]
  47. Chen, G.C.; He, Z.L. Determination of soil microbial biomass phosphorus in acid red soils from southern China. Biol. Fertil. Soils 2004, 39, 446–451. [Google Scholar] [CrossRef]
  48. Lee, S.-H.; Kim, S.-Y.; Ding, W.; Kang, H. Impact of elevated CO2 and N addition on bacteria, fungi, and archaea in a marsh ecosystem with various types of plants. Appl. Microbiol. Biotechnol. 2015, 99, 5295–5305. [Google Scholar] [CrossRef]
  49. Vainio, E.J.; Hantula, J. Direct analysis of wood-inhabiting fungi using denaturing gradient gel electrophoresis of amplified ribosomal DNA. Mycol. Res. 2000, 104, 927–936. [Google Scholar] [CrossRef]
  50. De Gregoris, T.B.; Aldred, N.; Clare, A.S.; Burgess, J.G. Improvement of phylum- and class-specific primers for real-time PCR quantification of bacterial taxa. J. Microbiol. Methods 2011, 86, 351–356. [Google Scholar] [CrossRef]
  51. George, T.S.; Giles, C.D.; Menezes-Blackburn, D.; Condron, L.M.; Gama-Rodrigues, A.C.; Jaisi, D.; Lang, F.; Neal, A.L.; Stutter, M.I.; Almeida, D.S.; et al. Organic phosphorus in the terrestrial environment: A perspective on the state of the art and future priorities. Plant Soil 2018, 427, 191–208. [Google Scholar] [CrossRef]
  52. Schreeg, L.A.; Mack, M.C.; Turner, B.L. Leaf litter inputs decrease phosphate sorption in a strongly weathered tropical soil over two time scales. Biogeochemistry 2013, 113, 507–524. [Google Scholar] [CrossRef]
  53. Harrison, A.F. Labile organic phosphorus mineralization in relationship to soil properties. Soil Biol. Biochem. 1982, 14, 343–351. [Google Scholar] [CrossRef]
  54. Zhang, Z.; Luo, R.; Liu, Q.; Qiang, W.; Liang, J.; Hou, E.; Zhao, C.; Pang, X. Linking soil phosphorus fractions to abiotic factors and the microbial community during subalpine secondary succession: Implications for soil phosphorus availability. Catena 2023, 233, 107501. [Google Scholar] [CrossRef]
  55. Richardson, A.E.; Simpson, R.J. Soil Microorganisms Mediating Phosphorus Availability. Plant Physiol. 2011, 156, 989–996. [Google Scholar] [CrossRef] [PubMed]
  56. Tian, J.; Ge, F.; Zhang, D.Y.; Deng, S.Q.; Liu, X.W. Roles of Phosphate Solubilizing Microorganisms from Managing Soil Phosphorus Deficiency to Mediating Biogeochemical P Cycle. Biology 2021, 10, 158. [Google Scholar] [CrossRef] [PubMed]
  57. Li, T.; Li, J.P.; Zhao, Z.W. Arbuscular mycorrhizas in a valley-type savanna in southwest China. Mycorrhiza 2004, 14, 323–327. [Google Scholar]
  58. Zheng, L.L.; Zhao, Q.; Lin, G.G.; Hong, X.; Zeng, D.H. Nitrogen addition impacts on soil phosphorus transformations depending upon its influences on soil organic carbon and microbial biomass in temperate larch forests across northern China. Catena 2023, 230, 107252. [Google Scholar] [CrossRef]
  59. Bünemann, E.K.; Oberson, A.; Liebisch, F.; Keller, F.; Annaheim, K.E.; Huguenin-Elie, O.; Frossard, E. Rapid microbial phosphorus immobilization dominates gross phosphorus fluxes in a grassland soil with low inorganic phosphorus availability. Soil Biol. Biochem. 2012, 51, 84–95. [Google Scholar] [CrossRef]
  60. Ying-Ping, W.; Huang, Y.; Augusto, L.; Goll, D.S.; Helfenstein, J.; Hou, E. Toward a Global Model for Soil Inorganic Phosphorus Dynamics: Dependence of Exchange Kinetics and Soil Bioavailability on Soil Physicochemical Properties. Glob. Biogeochem. Cycles 2022, 36, e2021GB007061. [Google Scholar]
  61. Spohn, M. Increasing the organic carbon stocks in mineral soils sequesters large amounts of phosphorus. Glob. Change Biol. 2020, 26, 4169–4177. [Google Scholar] [CrossRef]
Figure 1. t-test and one-way analysis of variances of soil Pi (a,d), Po (b,e) and Pt (c,f) concentrations at natural shrub-grass plots and at different stages of the Leucaena leucocephala plantations in a dry-hot valley. The n = 4 for CK, HS, HM and HL treatments, and n = 12 in invasion treatment. Different lowercase letters indicate significant difference at p < 0.05.
Forests 15 00974 g001
Figure 2. t-test and one-way analysis of variances of labile P (a,d), moderately labile P (b,e) and non-labile P concentrations (c,f) in natural shrub-grass plots and at different stages of Leucaena leucocephala plantations in a dry-hot valley. The n = 4 for CK, HS, HM and HL treatments, and n = 12 in invasion treatment. Different lowercase letters indicate significant difference at p < 0.05.
Forests 15 00974 g002
Figure 3. t-test and one-way analysis of variances of soil various P fractions (ai) between natural shrub-grass and Leucaena leucocephala plantations in a dry-hot valley. The n = 4 for CK, HS, HM and HL treatments, and n = 12 in invasion treatment. Different lowercase letters indicate significant difference at p < 0.05.
Forests 15 00974 g003
Figure 4. t-test and one-way analysis of variances of soil various P fractions (ai) among different stages of Leucaena leucocephala plantations in a dry-hot valley. The n = 4 for CK, HS, HM and HL treatments, and n = 12 in invasion treatment. Different lowercase letters indicate significant difference at p < 0.05.
Forests 15 00974 g004
Figure 5. t-test and one-way analysis of variances of soil acid phosphatase activities (a,f), SMBP (b,g), and abundances of three microbes (ce,hj) between natural shrub-grass and Leucaena leucocephala plantations in a dry-hot valley. The n = 4 for CK, HS, HM and HL treatments, and n =12 in invasion treatment. 16S-b = bacteria, its = fungi, act = actinomycetes. Different lowercase letters indicate significant difference at p < 0.05.
Forests 15 00974 g005
Figure 6. Pearson’s correlation coefficients of soil P fractions and soil properties, microbe, ACP activities and aboveground biomass in a dry-hot valley. * indicates p < 0.05, ** indicates p < 0.01, *** indicates p < 0.001.
Forests 15 00974 g006
Figure 7. Structural equation modelling (SEM) for soil Pt (a), Po (e), Pi (f) and P fractions (bd) in a dry-hot valley. The red and blue arrows represent positive and negative pathways, respectively. The widths of the arrows are proportional to the strength of the relationship, with the numbers near the arrows indicating the standard path coefficients. Solid and dashed lines indicate significant (p < 0.05) and insignificant (p > 0.05) effects. * indicates p < 0.05, ** indicated p < 0.01, *** indicates p < 0.001. The goodness-of-fit statistics for each model are shown below. The standardized total effects bar graph (direct and indirect effects) are derived from the SEM depicted above (g).
Forests 15 00974 g007
Disclaimer/Publisher’s Note: The statements, opinions and data contained in all publications are solely those of the individual author(s) and contributor(s) and not of MDPI and/or the editor(s). MDPI and/or the editor(s) disclaim responsibility for any injury to people or property resulting from any ideas, methods, instructions or products referred to in the content.

