Article

Radial Growth of Dahurian Larch (Larix gmelinii) Responses to Climate and Competition

1
College of Forestry, Northeast Forestry University, Harbin 150040, China
2
Key Laboratory of Sustainable Forestry Ecosystem Management-Ministry of Education, Harbin 150040, China
*
Author to whom correspondence should be addressed.
Forests 2024, 15(7), 1084; https://doi.org/10.3390/f15071084
Submission received: 31 May 2024 / Revised: 20 June 2024 / Accepted: 20 June 2024 / Published: 22 June 2024
(This article belongs to the Section Forest Ecophysiology and Biology)

Abstract

:
The phenomenon of divergent responses in tree ring radial growth to climate change has been observed in the mid- and high-latitude regions of the Northern Hemisphere amidst global warming. However, the stability of the responses of the primary conifer species to climate factors in the mountainous regions of northeastern China remains unclear. Additionally, it is uncertain whether the radial growth in this area consistently responds to different competition indices. In our study, we developed tree ring width chronologies for Dahurian larch (Larix gmelinii) and analysed the radial growth responses to the regional climate from 1980 to 2012. This analysis was conducted by correlating meteorological data from different physiological stages of trees. We also evaluated the reliability of competition indices in predicting tree growth by constructing multiple linear regression models. Furthermore, we explored the relationship between the Basal Area Increment (BAI) of each tree and the competition indices in the sample plot over the previous five years. Our results showed that the temperature during the Non-Structural Carbohydrate (NSC) accumulation period and the NSC consumption period was significantly negatively correlated with the Ring Width Index (RWI) of Dahurian larch. Conversely, the RWI was significantly positively correlated with precipitation during these periods. The Standardised Precipitation Evapotranspiration Index (SPEI) at any period had a significantly positive correlation with the RWI. These findings suggest that future radial growth is likely to continue to be constrained by rising temperatures and water scarcity. Our findings also demonstrated that radial growth was less negatively impacted by competition from nearby trees and more influenced by the initial size of the tree. Compared to models that included other indices, models that included the BAL index as a single explanatory variable demonstrated superior statistical effectiveness. Our research suggests that before evaluating the competitive effects of the neighbourhood on radial growth, it is necessary to consider the stand diversity of tree species and the parameters related to spatial structure when selecting an appropriate competition index.

1. Introduction

As greenhouse gas emissions continue to increase and global temperatures rise rapidly, climate change has become one of the world’s most concerning scientific hotspots [1]. Forest ecosystems, as the largest terrestrial ecosystems on earth, are an important part of the material cycle and energy flow of the earth system and play an important role in maintaining global ecological balance [2]. Radial growth of the tree, on the other hand, is an important parameter for evaluating the carbon sink function of forest ecosystems [3].
Radial growth is sensitive to climate change, and abiotic factors such as temperature and precipitation have important impacts on tree growth and community succession [4]. It has been shown that Dahurian larch (Larix gmelinii) in the Greater Khingan Mountains of China had a significant positive correlation with mean temperature and mean maximum temperature in the winter of the current year [5]. Some researchers also found that low temperature was the main limiting factor for the radial growth of Dahurian larch in the high-altitude areas of the Greater Khingan Mountains, while precipitation became the limiting factor in the middle- and low-altitude areas [6]. Abiotic factors are not the only factors affecting tree growth. Biotic factors, such as competition, also have impacts on radial growth [7].
Studies have shown that about 40% of the variation in radial growth is due to climate change, while the rest is mainly caused by intraspecific and interspecific competition [8]. The essence of forest competition is the competition for resources with neighbouring trees in the same environment as the tree is growing [9]. Competition often leads to variations in tree growth and development, and in some special cases, competition has more significant impacts on radial growth than climate [10]. It has also been shown that the proportion of trees with a declining radial growth trend is positively correlated with stand density. Low-density stands weaken the effect of water, while high-density stands increase the sensitivity of radial growth to climatic factors [11].
Non-Structural Carbohydrate (NSC) is an important component of tree metabolism [12]. The dynamics of NSC content in temperate trees have been revealed: trees stop growing at the end of autumn and start to accumulate NSC to survive the winter and prepare for growth in the next year [13]. Trees consume NSC through respiration in the winter. When the temperature rises in spring, the trees continue to consume the NSC accumulated in the previous year for growth, and the appropriate temperature in this period will increase the photosynthetic rate and promote radial growth [14]. If the winter temperature of the current year is significantly higher than the normal year’s winter average temperature in the region, trees may consume too much NSC, which may affect their growth when temperatures rise [15,16]. In the meantime, when the temperature is appropriate for radial growth, good moisture conditions would be more favourable for trees to photosynthesise, allowing them to accumulate more NSC and also promoting xylem cell expansion [17]. Although numerous studies have investigated the radial growth responses of trees to climate, competition, and NSC content, most have primarily revealed the relationship between radial growth and monthly climatic factors, neglecting to integrate these factors with the tree’s physiological stages. Furthermore, limited research has been conducted on this topic in the eastern mountainous region of northeastern China.
The limitations of the previous studies led to the testing of the following two hypotheses.
Hypothesis I: Radial growth of Dahurian larch is negatively correlated with temperature during the NSC consumption period (non-growing season) and positively correlated with the radial growth period (growing season). Radial growth is positively correlated with precipitation and the Standardised Precipitation Evapotranspiration Index (SPEI) during the NSC accumulation period and the radial growth period.
Hypothesis II: The Basal Area Increment (BAI) of Dahurian larch is negatively correlated with the competition indices, and there are differences in the statistical performance of the growth models constructed from the three different types of competition indices.
The Dahurian larch (L. gmelinii) is the primary tree species in Northeast China’s eastern mountainous regions and the establishment species of the region’s cold–temperate coniferous forests, which is essential for the conservation of water and soil, atmospheric carbon sequestration, and the stability of the region’s ecological structure [18]. In this study, we quantified the dynamic pattern of radial growth of Dahurian larch by trunk analysis, and we explored the radial growth and its influencing factors by combining meteorological data and sample plot checking and measuring data. This is of great theoretical significance and practical value for revealing the sensitivity and adaptability of the forests in this region to climate change, predicting the future trend of the forests in this region, and formulating reasonable forest management measures.

2. Materials and Methods

2.1. Study Area Description

The study area is situated at the Forest Ecology Positioning Research Station in the Maoershan region (45°24′ N, 127°40′ E), Heilongjiang Province, China (Figure 1). The western slopes of the Zhangguangcai Range encompass the ecological station, with the majority of the topography composed of low hills. The average elevation is 350 metres, and the typical slope ranges from 10 to 15 degrees. The bedrock is primarily granite, and the soil is predominantly dark brown forest soil. The region experiences a continental monsoon climate, characterised by a warm, humid summer, a dry, cold winter, and a windy monsoon spring. Approximately 80% of the annual precipitation, which ranges from 600 to 800 mm, occurs in July and August. The annual evaporation is 865 mm. The coldest and warmest months are January and July, respectively, with average temperatures of −19.1 °C and 22.3 °C. Early frosts typically occur in early September, while late frosts generally occur in mid-May. The frost-free period lasts between 120 and 140 days, typically beginning in mid-May. The vegetation in the Maoershan region is part of the Changbai Mountain flora. The original zonal vegetation has evolved into natural secondary forests and planted forests due to numerous anthropogenic disturbances, making it part of the secondary forest area of natural forests in Northeast China. The main tree species include Manchurian Walnut (Juglans mandshurica), aspen (Populus davidiana), Dahurian larch (Larix gmelinii), Maple (Acer mono), and Amur Linden (Tilia amurensis), representing the typical forest vegetation types in the eastern mountains of northeastern China [19].

2.2. Field Sampling and Measurements

In August 2012, a destructive sampling plot of 15 m × 20 m was established in a 50-year-old Dahurian larch plantation. All trees within the plot were identified and utilised for the computation of competition indices. For each tree within the plot, parameters such as diameter at breast height (DBH) and crown spread (CS) were measured. Cross-sections of the tree, referred to as discs, were collected at the DBH (1.3 m), marked according to the cardinal directions (east, south, west, and north), and transported to the laboratory. After sanding the upper surfaces, the discs were scanned in four directions to obtain high-definition images of the tree rings using an Epson Expression 1800 scanner (Epson America Inc., Long Beach, CA, USA). The ring widths were measured using the WinDENDRO 2003 annual ring analysis software (GEGENT instrument. Inc., Quebec, QC, Canada) with a resolution of 0.001 mm. The average value of the ring widths in the four directions of the discs was then calculated to determine the standard ring width of the tree.

2.3. Data Processing and Analysis

2.3.1. Chronology Establishment and Determination of Statistical Parameters

Raw ring width data from 29 Dahurian larch trees were utilised to ascertain the specific year of each ring through skeleton mapping dating and preliminary visual dating. The ring width series underwent detrending using the ‘Mean’ method from the ‘dplR’ package in R [20]. Subsequently, the standard chronology (STD) of Dahurian larch was established by averaging the chronologies of each individual tree using the ‘dplR’ package.
Statistical parameters such as Mean Sensitivity (MS), Standard Deviation (SD), First-Order Serial Autocorrelation (AC1), Signal-to-Noise Ratio (SNR), and Expressed Population Signal (EPS) were computed to evaluate the quality of the chronology. The variability in the Ring Width Index (RWI) between consecutive years is characterised by MS, while the interannual variation in each series is estimated by SD. AC1 identifies the influence of the previous year’s growth on the current year’s growth.
The extent of shared climatic information across tree rings is represented by SNR and EPS. If the EPS exceeds 0.85, the chronology is deemed suitable for dendroclimatological studies [21].

2.3.2. Competition Indices

Three competition indices were used to quantify individual tree competition in the sample plots and to analyse the effect of neighbourhood competition on radial growth.
The Hegyi index [22] and the BAL index [23] indicate the distance-relevant index and the distance-irrelevant index, respectively, which can be calculated by using the following formulas:
H e g y i = j = 1 n D j D i 1 d i j
where dij is the horizontal distance (m) between the reference tree and the surrounding trees, Di is the DBH (cm) of the neighbouring trees, and Dj is the DBH (cm) of the neighbouring trees.
B A L i j = j = 1 n B A j
where BAj is the basal area (m2) of trees which are larger than the reference tree per ha in the plot.
The third competition index is the structure-based competition index (SCI) [24], which can be calculated by Equation (3).
S C I i = C i U i λ w i λ m i
where Ui is the dominance, which ranges within the interval of [0, 1] [25]. Ci represents the crowding index, ranging within the interval of [0, 1] [26]. λwi represents the weighting factors for the spatial distribution of neighbouring trees, which range within the interval of [0.25, 1]. Mi is the mingling index, ranging within the interval of [0, 1] [27]. λmi is the weighting factor for describing the identity of stand species and can be determined according to the value of Mi using the linear interpolation method. λmi ranges within the interval of [0, 1] [24]. The subscript i represents the ith reference tree, and the SCI index ranges within the interval of [0, 1], where 0 and 1 reflect the lowest and greatest levels of competition intensity, respectively.
Upon measuring all competition indices, the intensity of competition was categorised into three levels (lowest, middle, and highest), each associated with a specific range of competition index values. For instance, the BAL index was divided into three intervals: 0–27, 27–45, and >45. This categorisation was implemented to illustrate the impact of competition on radial growth.

2.3.3. Data Analysis

In order to verify Hypothesis II, multiple regression models were utilised to analyse the incremental basal area (BAI, m2; ln transformed) over a five-year period (2006–2011) as a function of the tree basal area (BA, m2; ln transformed) and three competition indicators (CIs).
B A I = π R n 2 R n 1 2
where n is the year that the tree ring forms, and R is a specific yearly ring that corresponds to the radial radius.
l n B A I = a + b 1 l n B A + b 2 C I
where a, b1 and b2 are regression coefficients.
Since the initial tree size impact plays a significant role in determining diameter growth, it was also incorporated into the growth model [28]. The performance and reliability of each model were evaluated using R2 and the Akaike information criterion (AIC).
To reveal the radial growth responses of temperature and precipitation, this study used long-term positional observation data from the National Field Scientific Observatory of Forest Ecosystems in the Maoershan region of Heilongjiang Province [29]. Monthly mean temperature (T), monthly maximum mean temperature (Tmax), monthly minimum mean temperature (Tmin), and monthly total precipitation (P) were selected from 1980 to 2012. The monthly Standardised Precipitation Evapotranspiration Index (SPEI) was calculated using the “SPEI” package in R, combined with the research on temperate forest growing seasons and the dynamic changes in NSC content in trees [30,31,32]. We divided the period from August of the previous year to July of the current year into three physiological phases: the NSC accumulation period (August of the previous year to October of the previous year), the NSC consumption period (November of the previous year to March of the current year), and the radial growth period (April of the current year to July of the current year), calculated the mean values of temperature, mean values of SPEI, and total precipitation in each period, and analysed the correlation between the meteorological factors in each period and the Ring Width Index of each year.
Pearson correlation analysis between the RWI of Dahurian larch and climate factors was performed with R software version 4.3.3 [33]. The significance of the difference in slopes was tested by Standardised Major Axis Estimation (SMA), which was also performed using the ‘smatr’ package [34] in R. If there was a significant difference in the slopes, it indicated that the sensitivity of radial growth to climatic factors varied over different periods. The Kolmogorov–Smirnov test was used to ensure that each variable had a normal distribution prior to investigation. The Mann–Whitney test on the DBH and competition index distributions was also conducted by R.
The ‘stats’ package in R was used to fit the growth model, with the least squares method employed for the estimation of model parameters. We quantified the relative importance of various explanatory variables in the growth model by separating the variance (R2). This analysis was conducted using the ‘relaimpo’ package in R [35].

3. Results

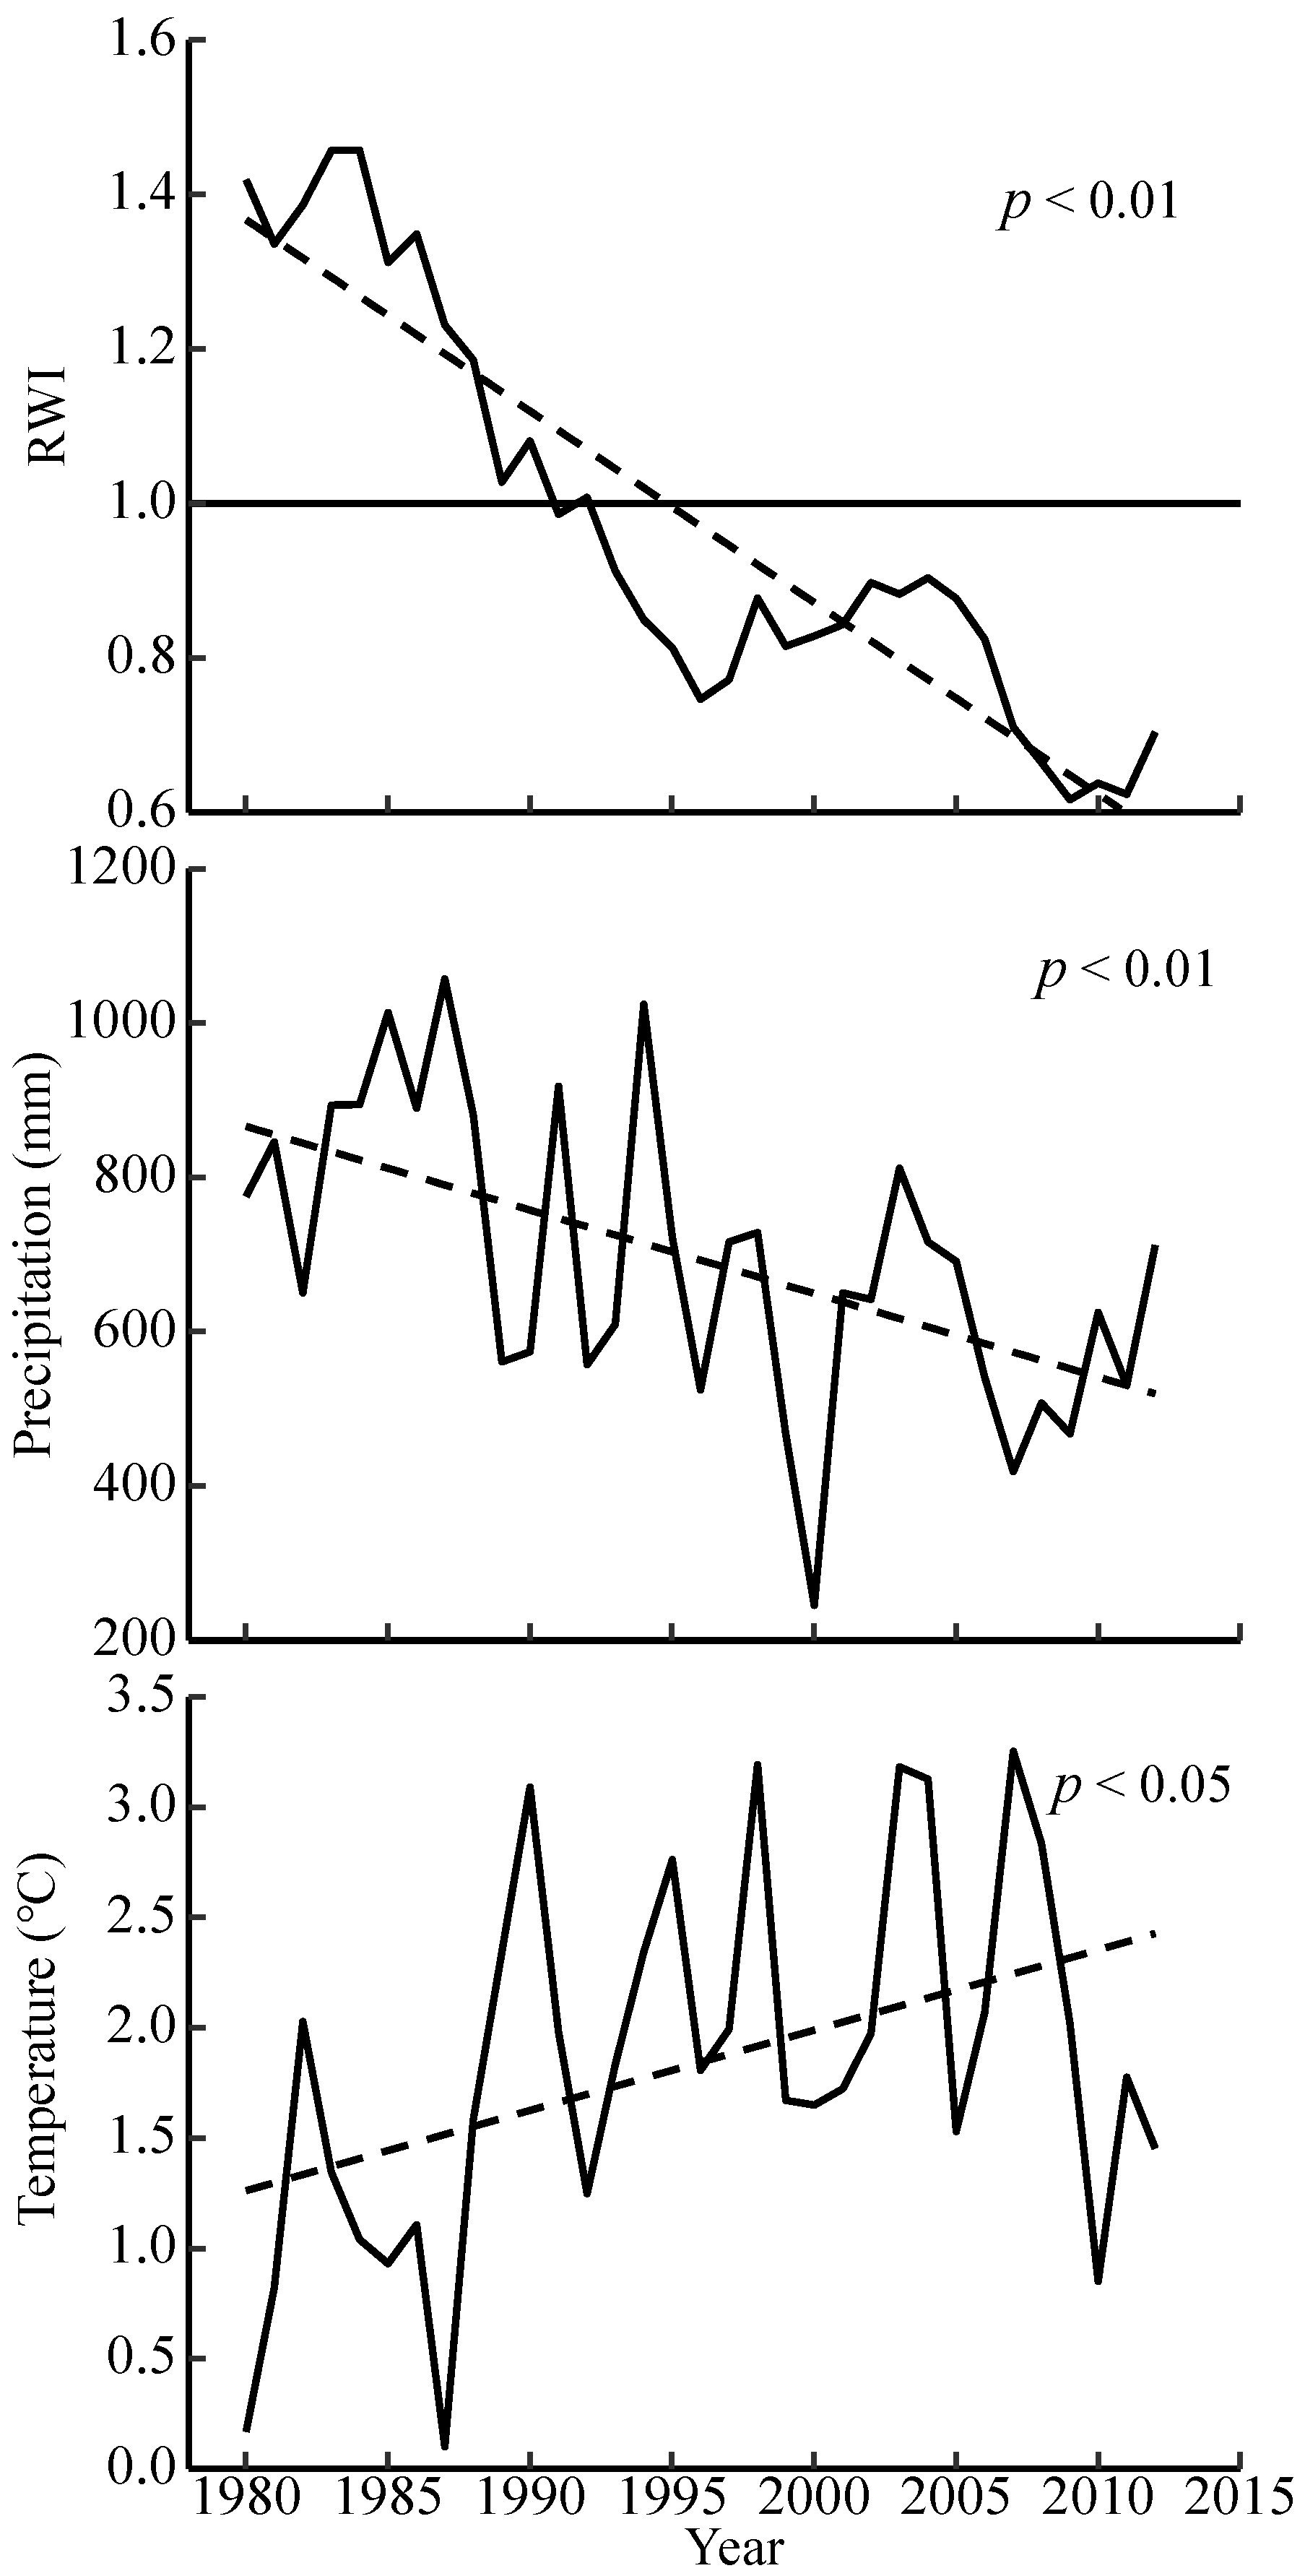
3.1. Interannual Trends in Climate and Chronology Statistics

The results showed that the AC1 of the chronology (time period: 1980–2012) was 0.5 and the MS was 0.23. The SNR of the chronology was 37.37, the SD of the chronology was 0.48, and the Variance in First eigenvector (VF) was 44.6%. The EPS of the chronology is 0.97, which is higher than 0.85. These chronology characteristics indicated that the STD of the Dahurian larch was of high quality and could be used for correlation analyses with climate factors.
Figure 2 shows that from 1980 to 2012, the total annual precipitation in the Maoershan region fluctuated greatly, with a range between 400 mm and 1200 mm, and presented a highly significant decreasing trend (p < 0.01). A similar trend is exhibited by the RWI, which showed a significant (p < 0.01) decrease from a value of 1.42 in 1980 to 0.70 in 2012. The mean annual temperatures in the region fluctuated between 2 °C and 3.5 °C, with a significant (p < 0.05) increasing trend.

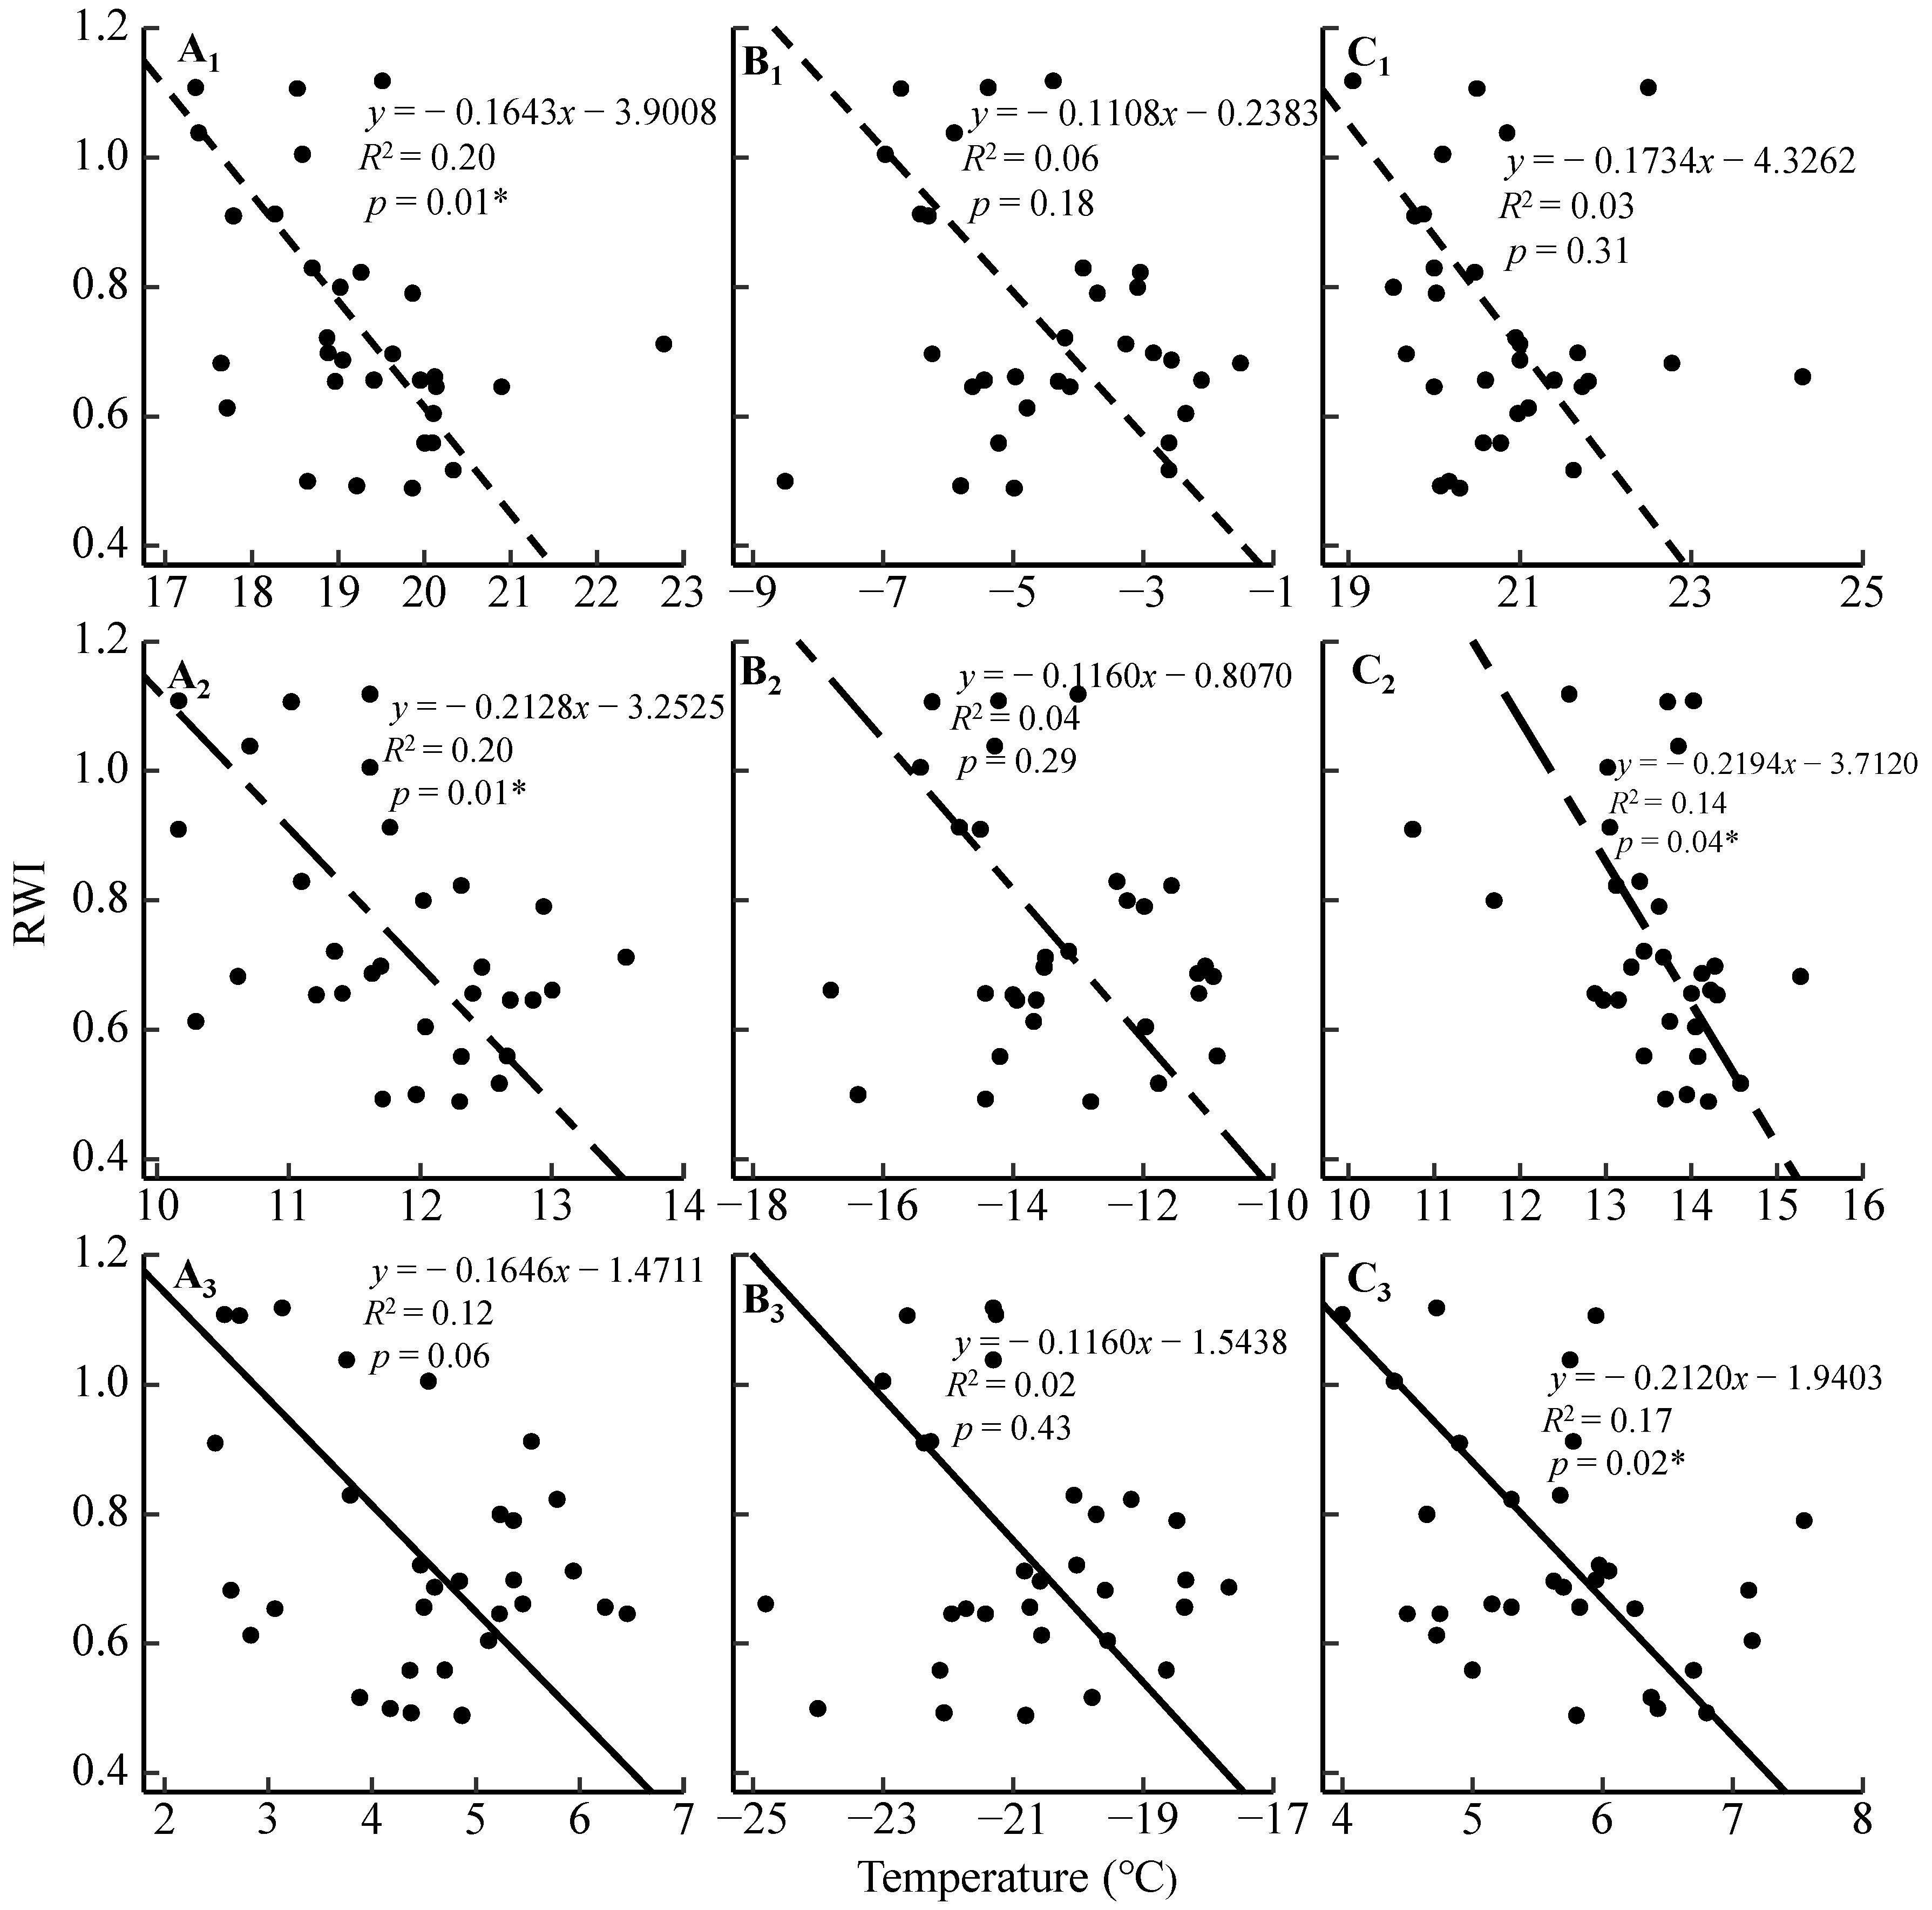
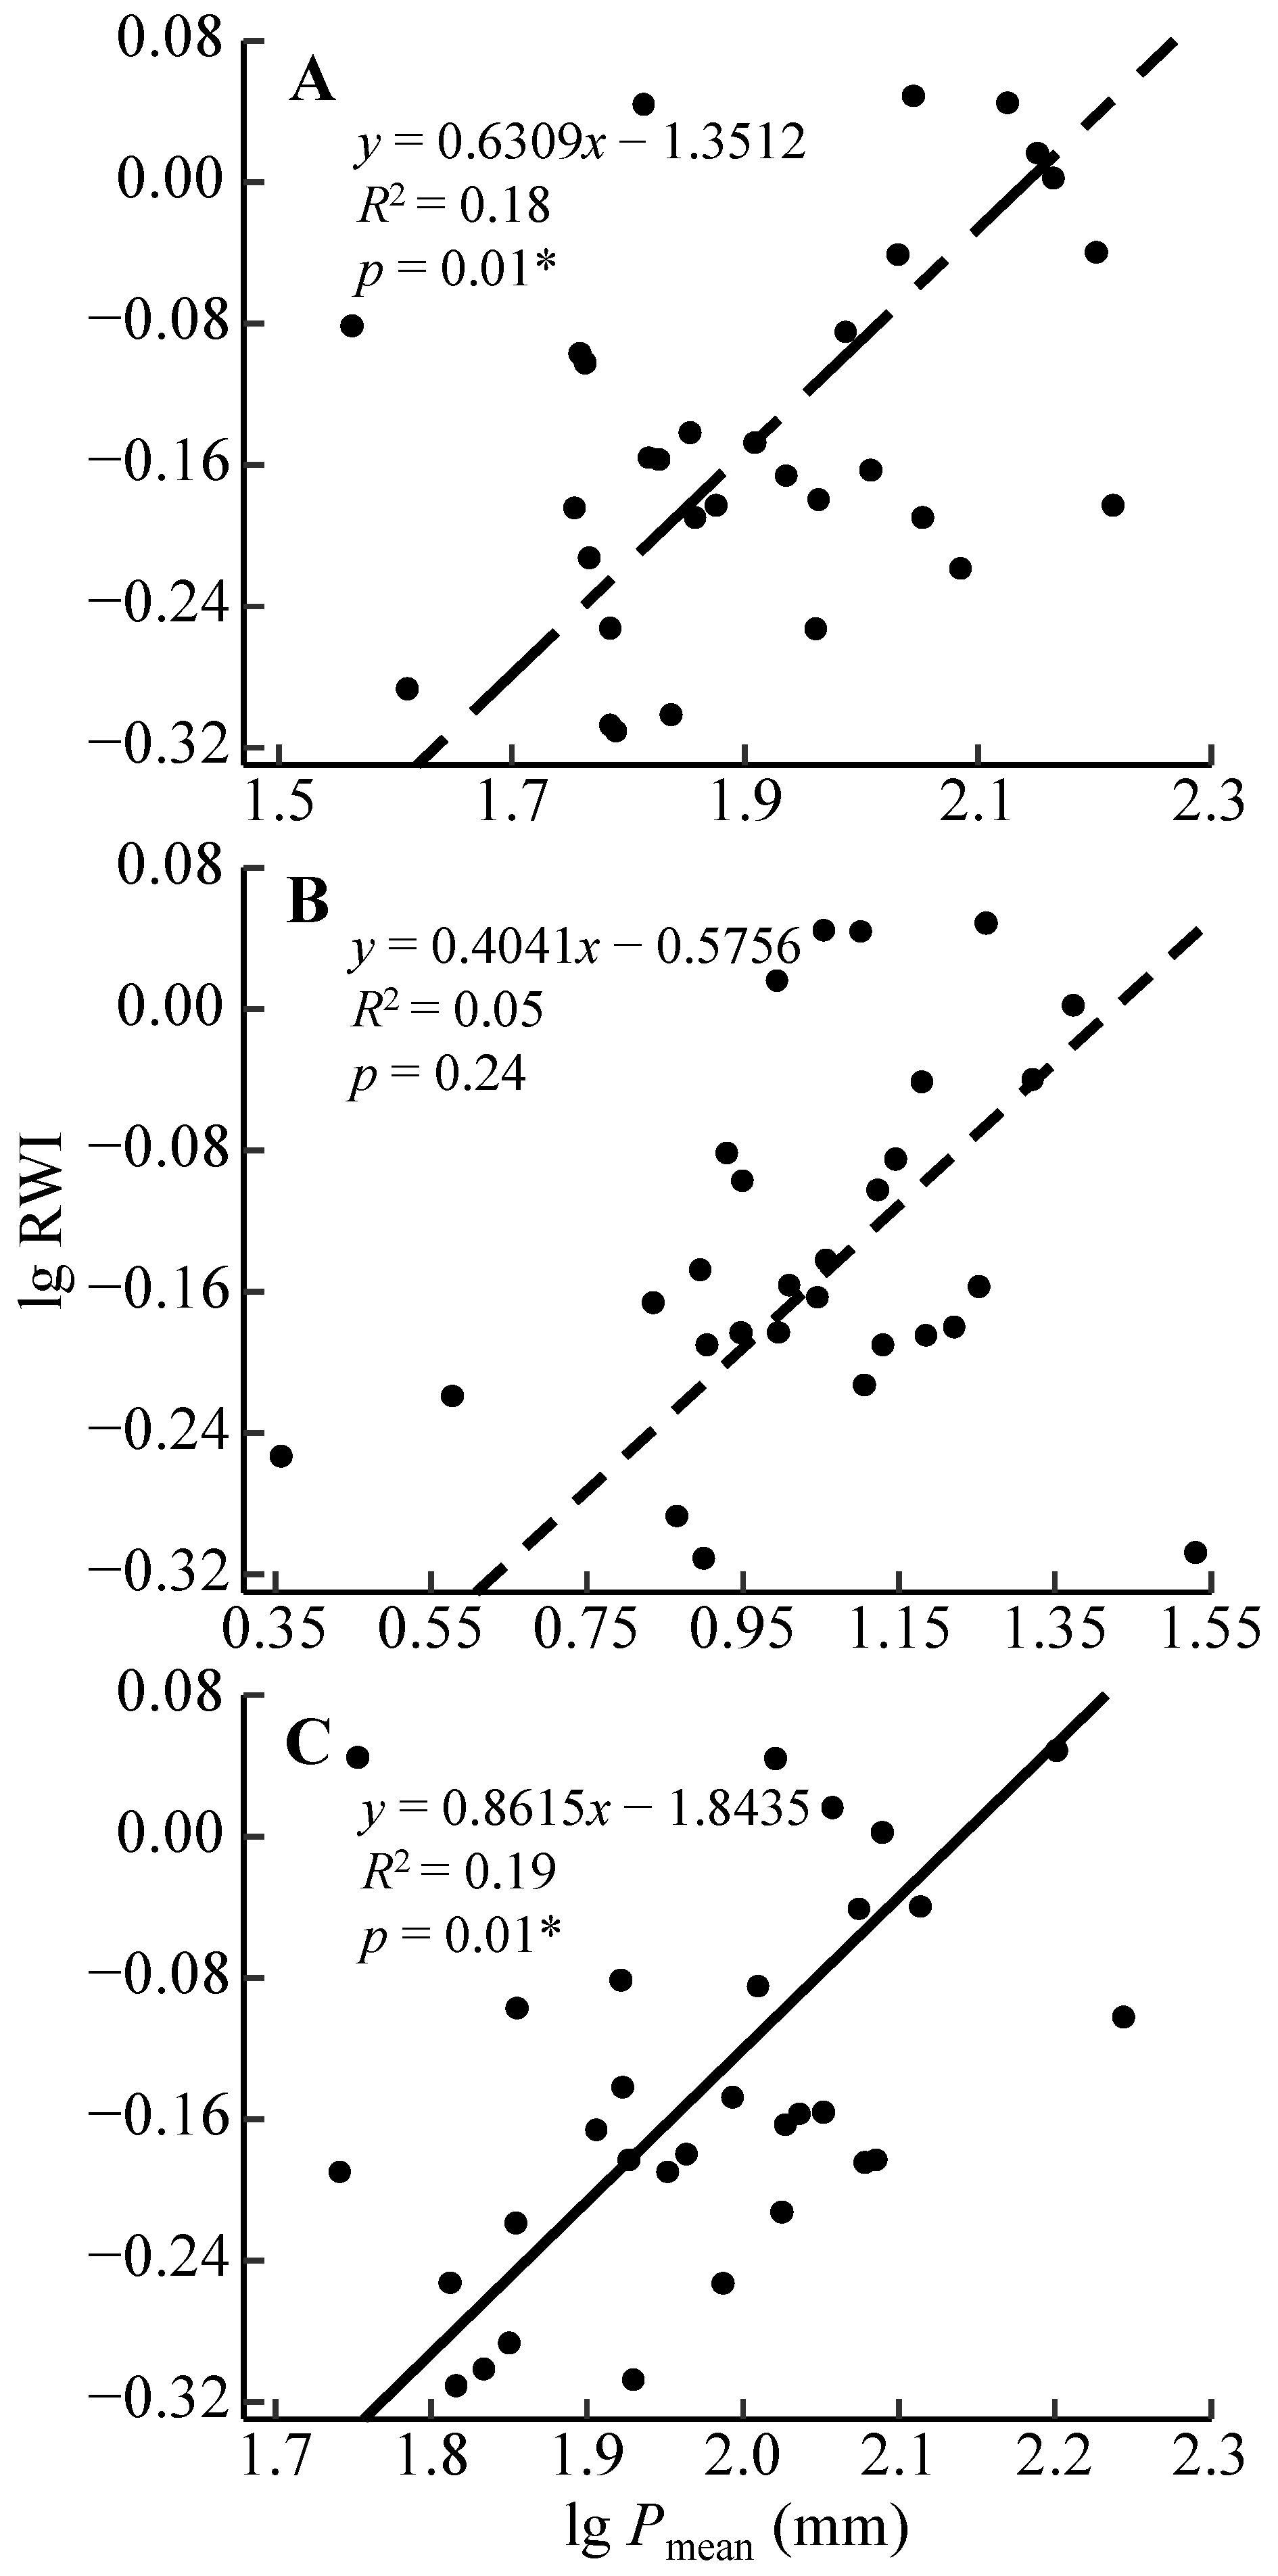
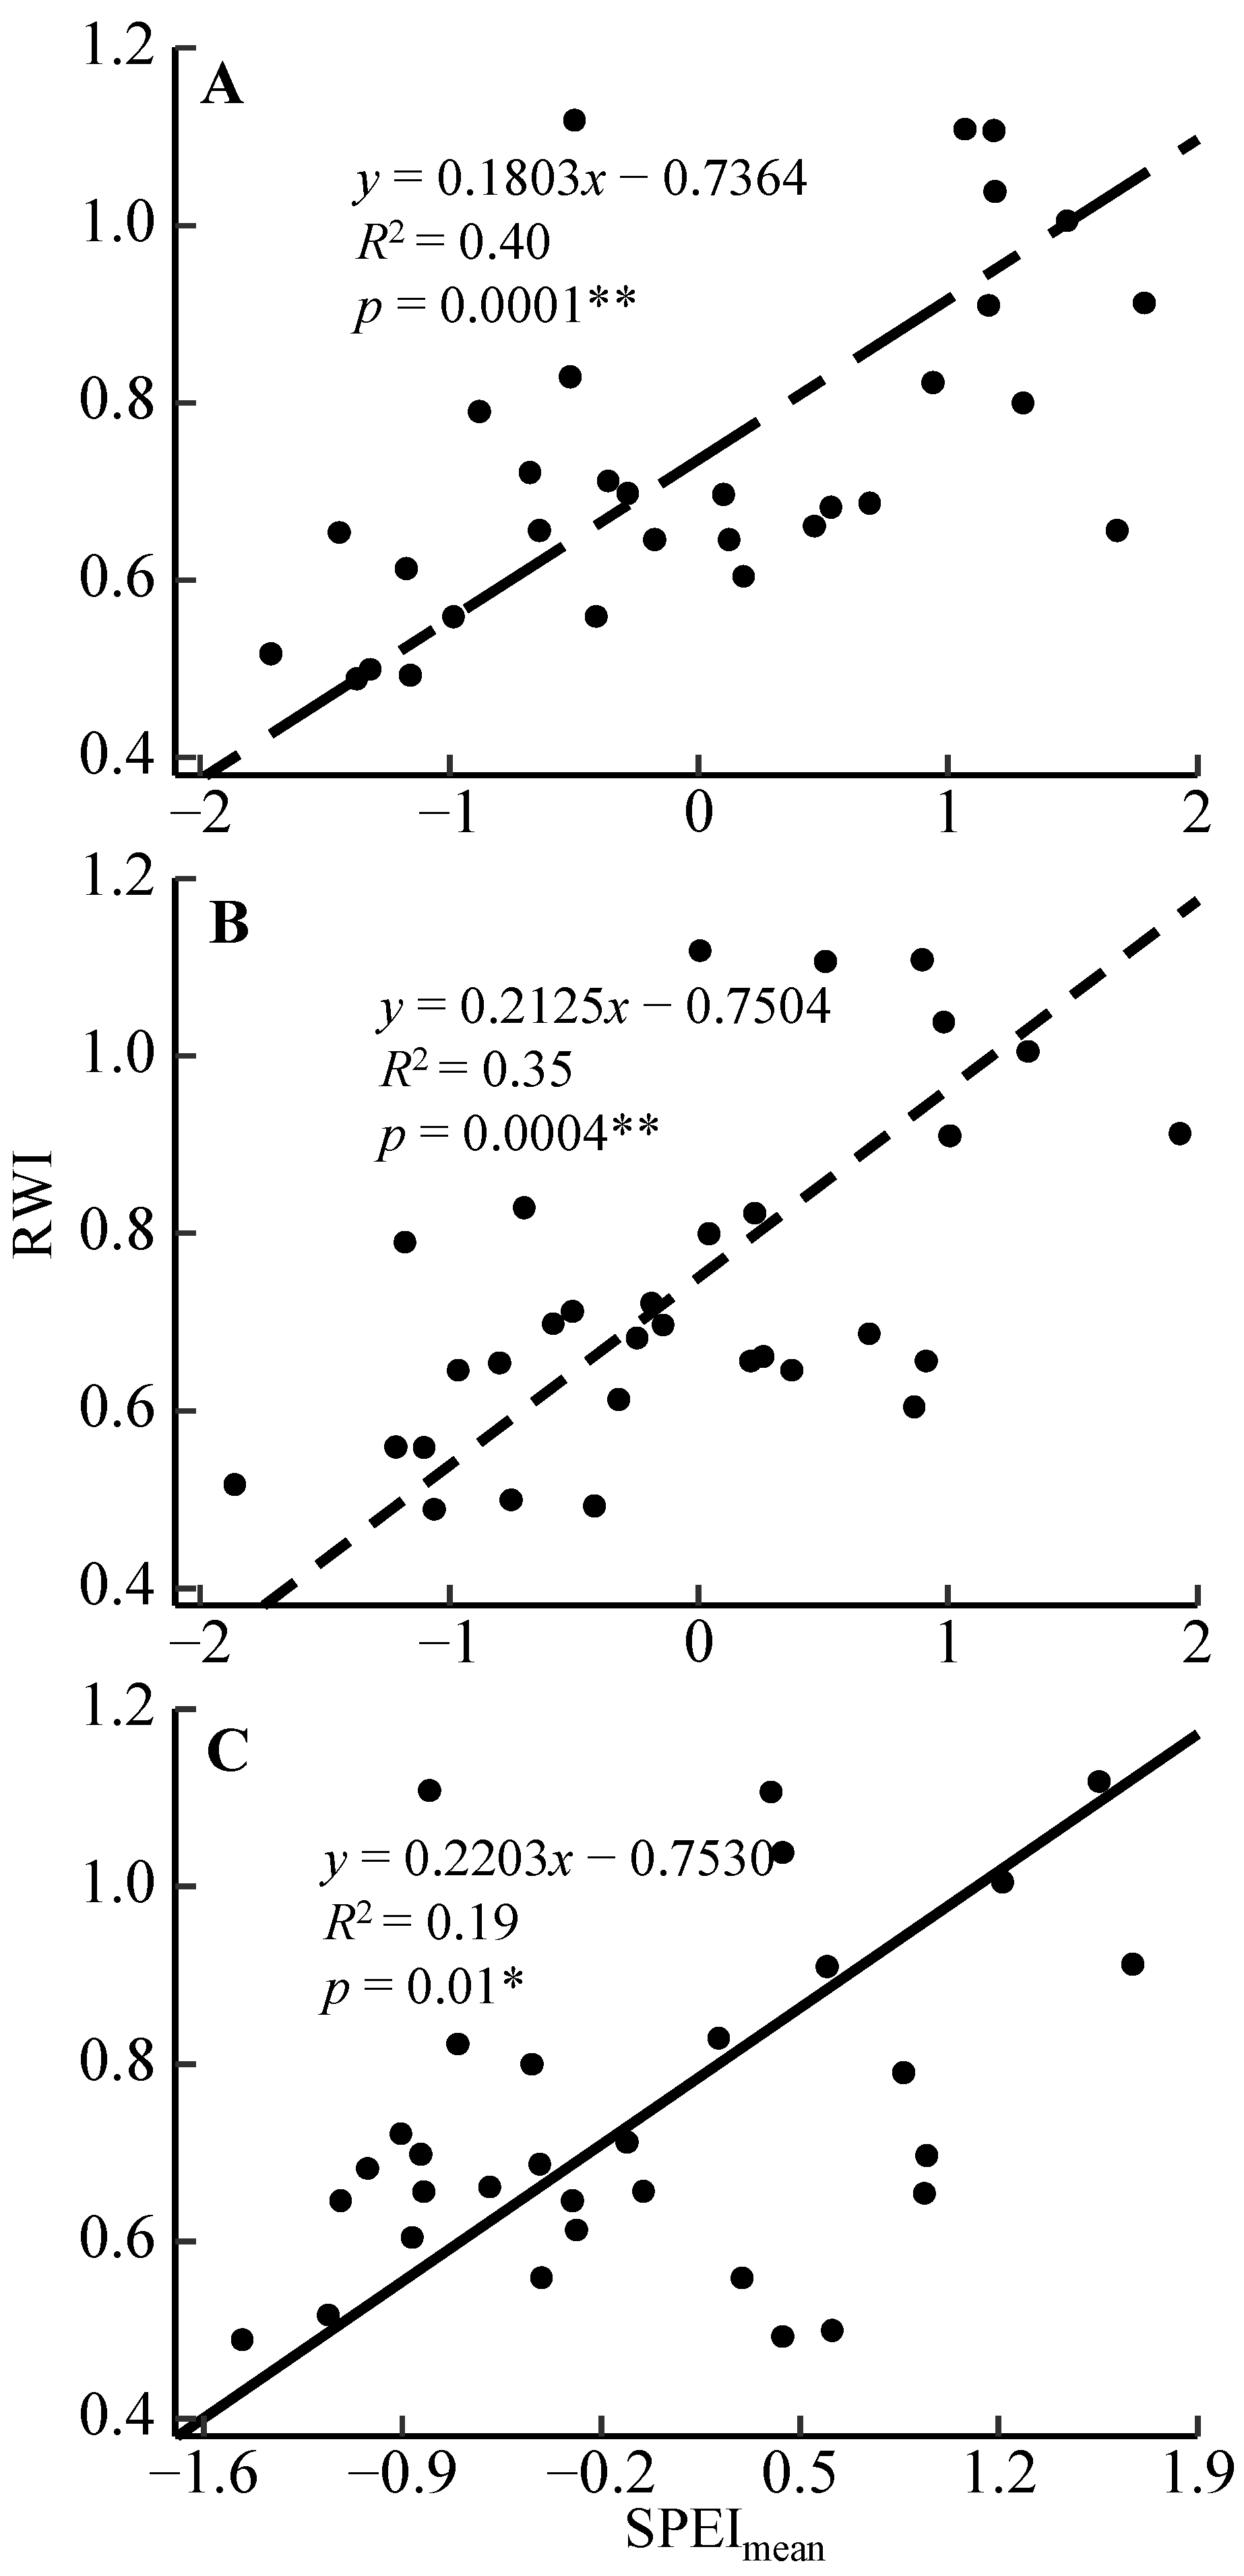
3.2. Radial Growth–Climate Associations

Figure 3, Figure 4 and Figure 5 illustrate the correlations between the RWI and various climate factors across three distinct periods. Generally, the RWI exhibited a negative correlation with temperature, but a positive correlation with both precipitation and the SPEI. These correlations were particularly pronounced during the NSC accumulation period (from August to October of the previous year) and the radial growth period (from April to July of the current year) (p < 0.05).
Regarding precipitation, the SMA test revealed significant differences between the slopes of the regression lines, which had significant correlations with RWI (p < 0.05, Figure 4A,C).

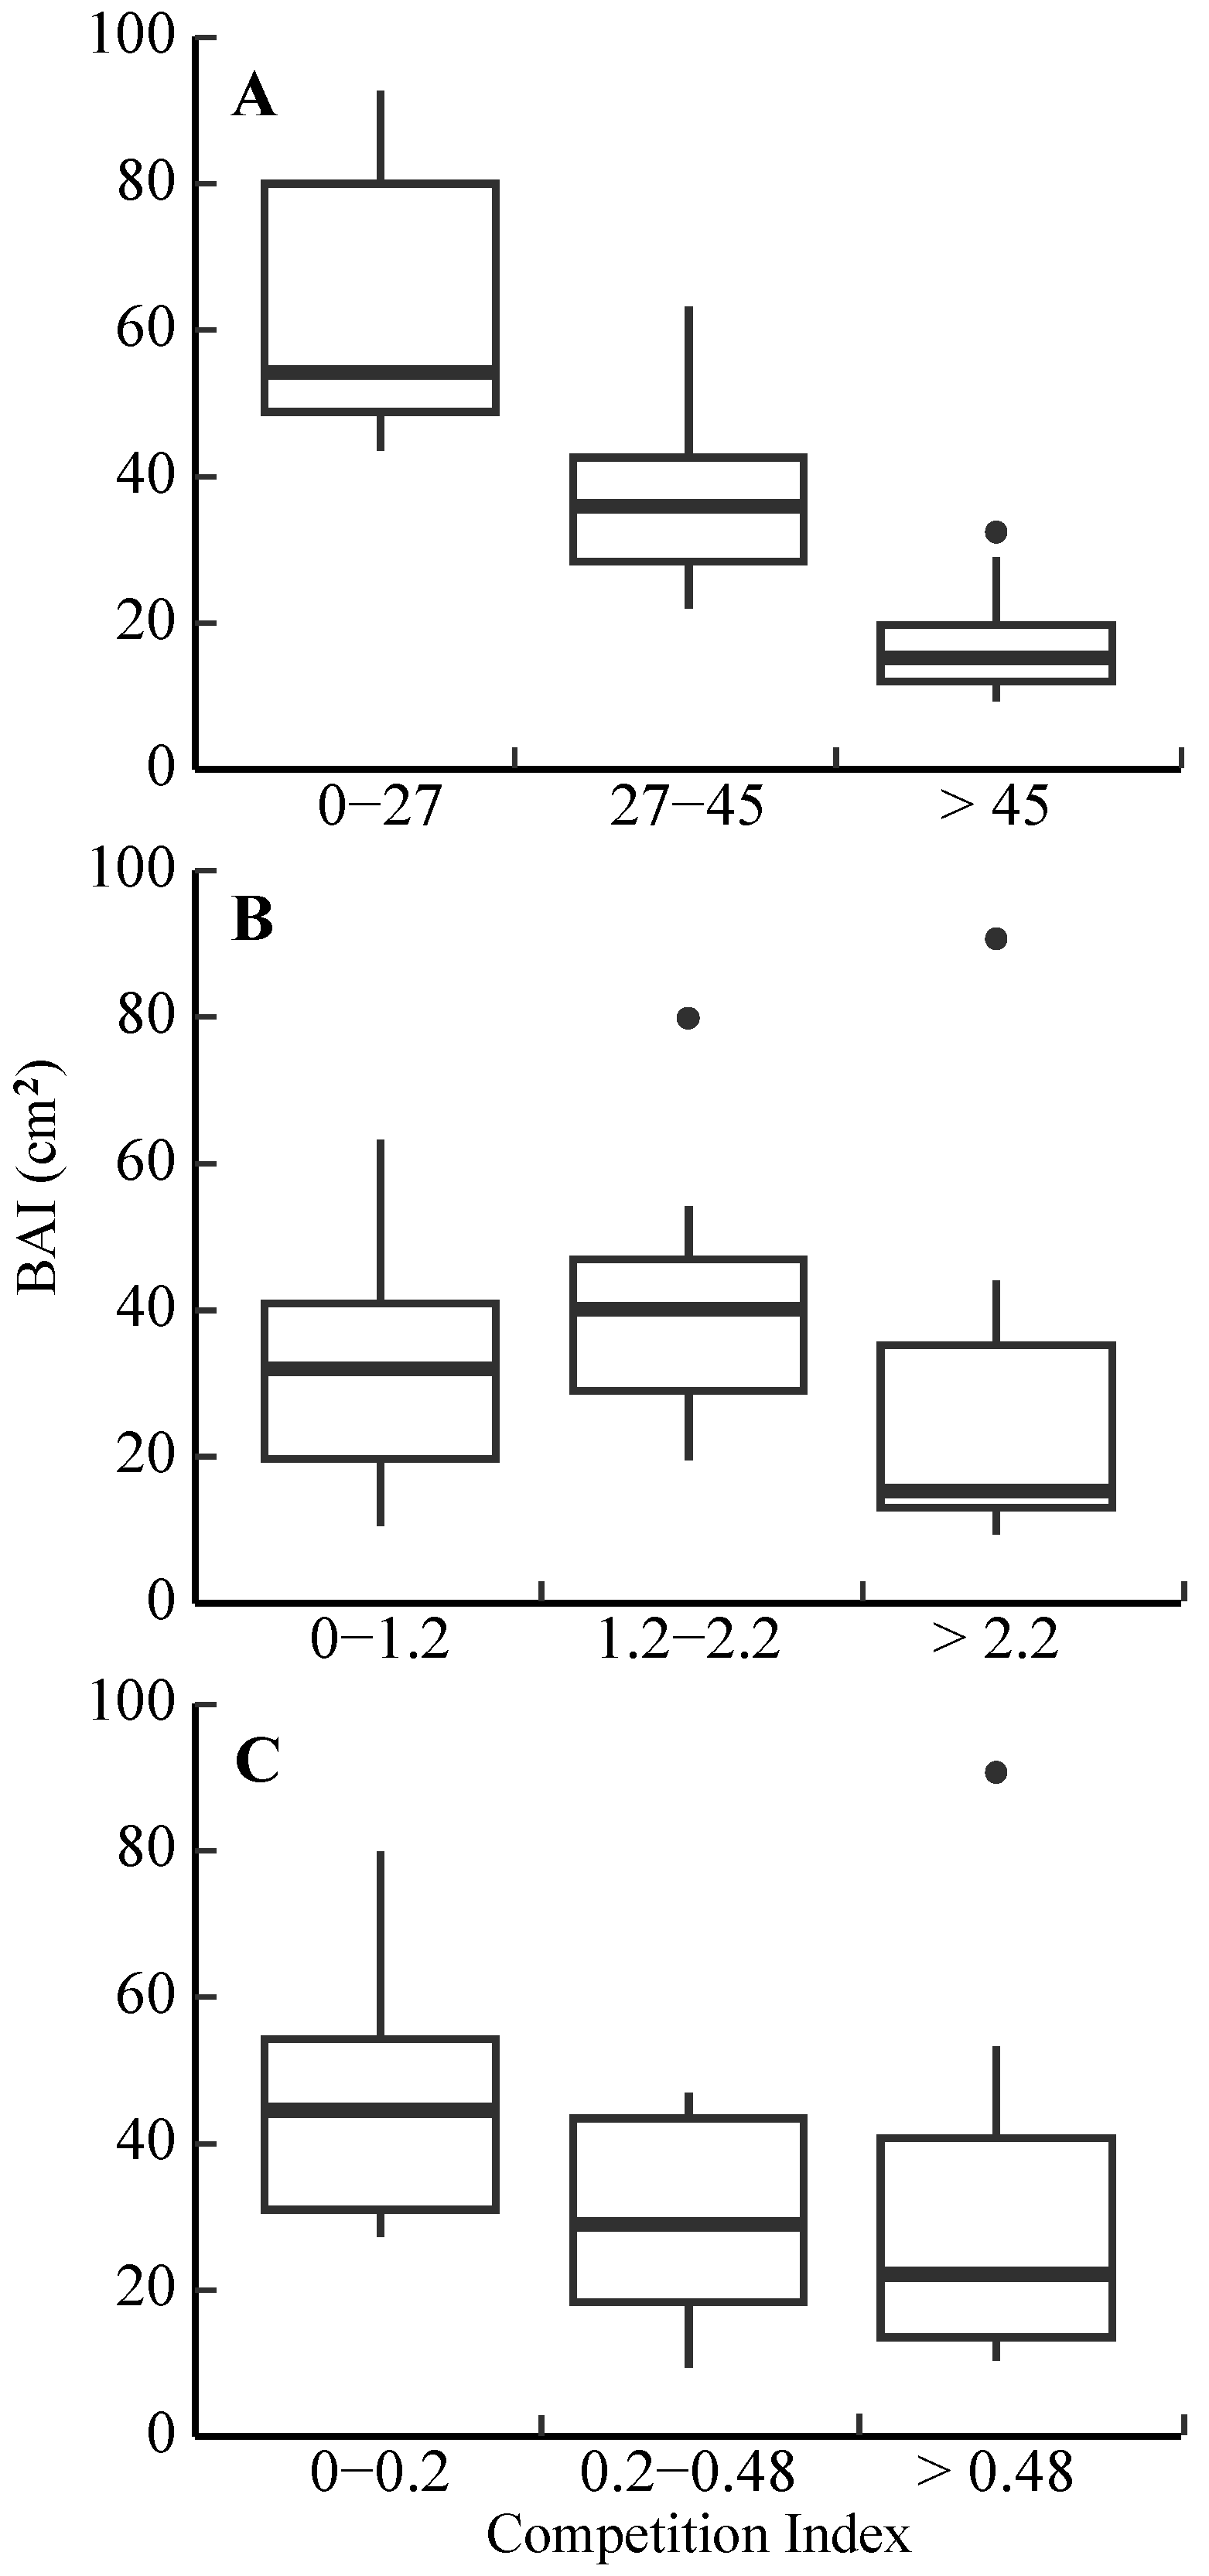
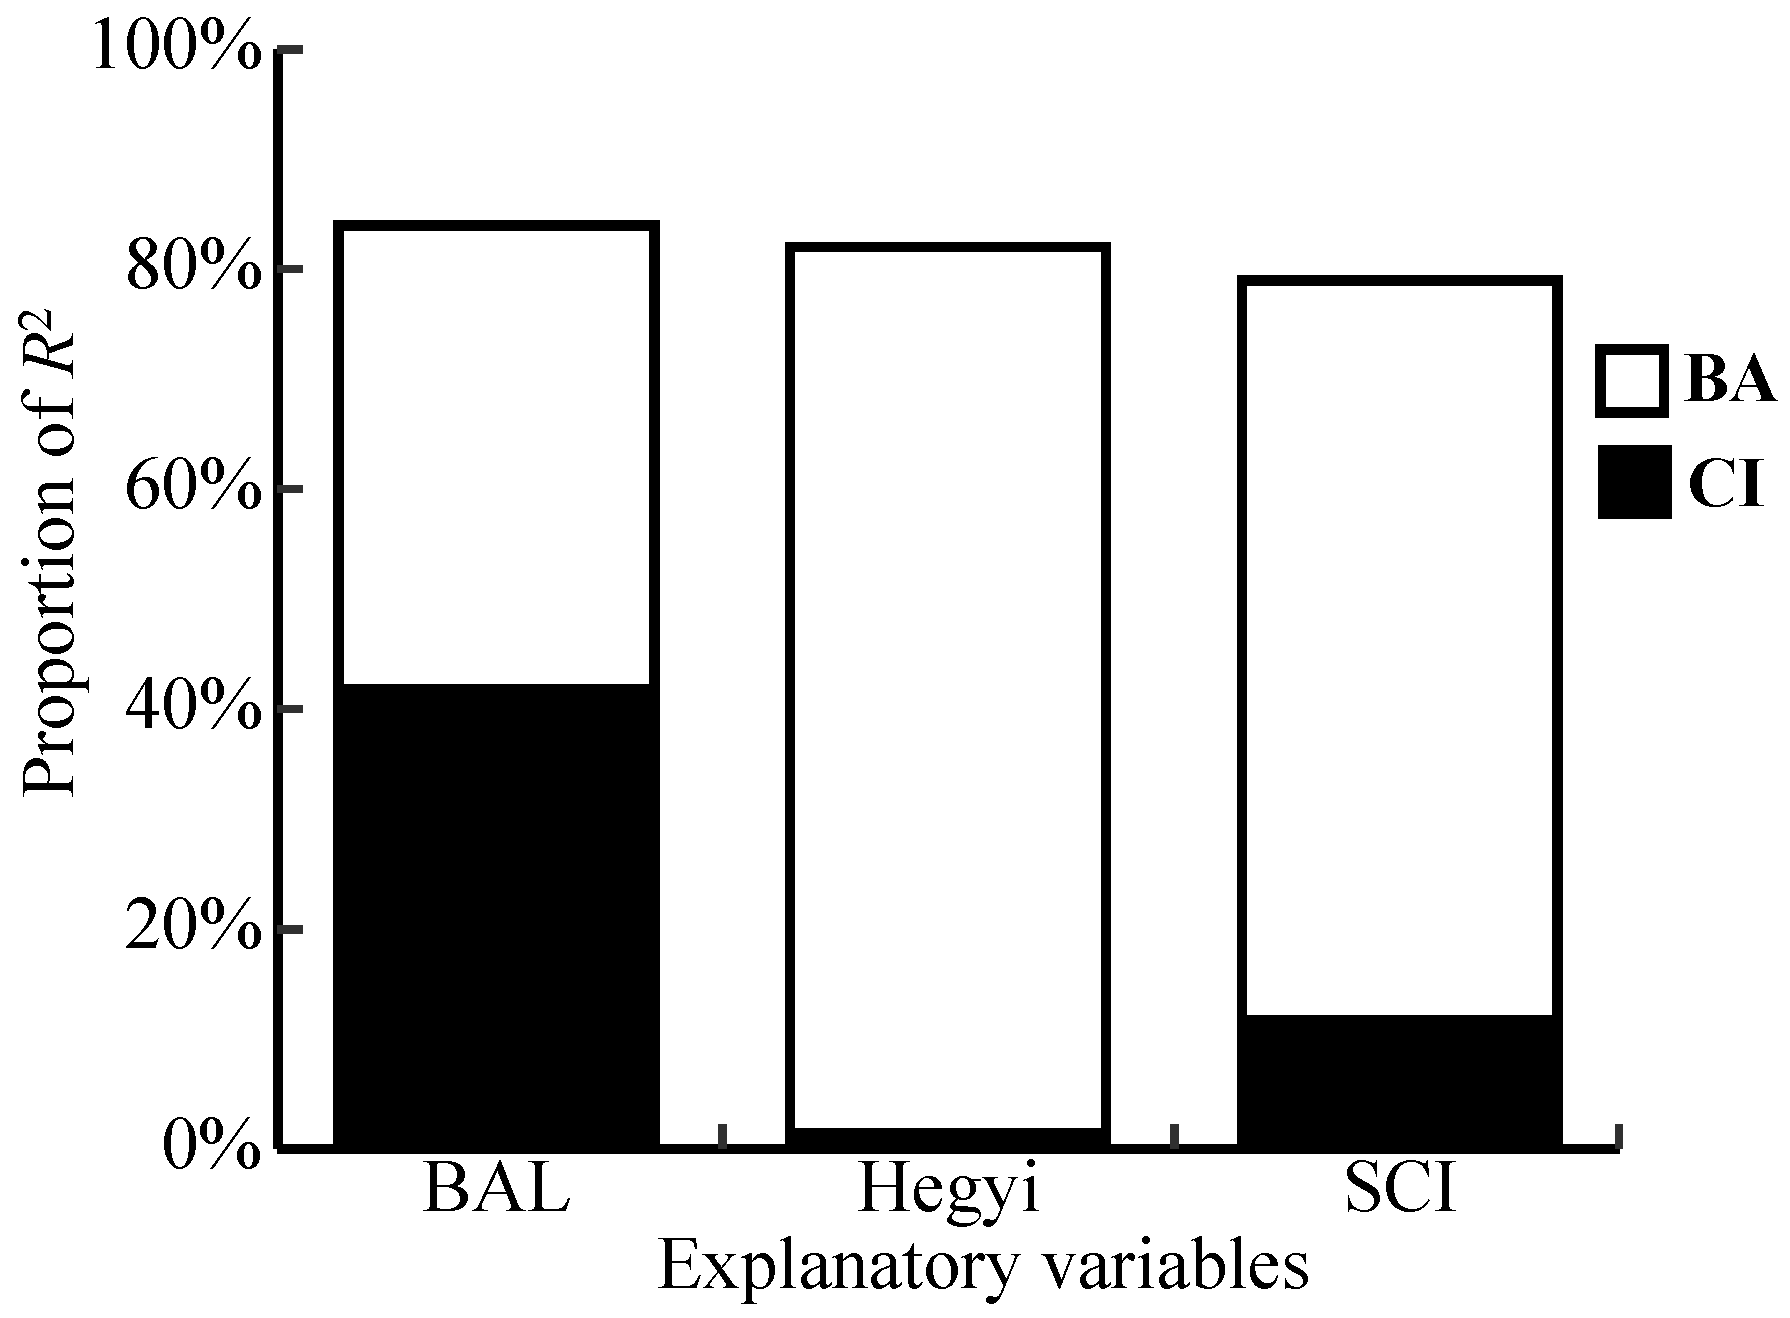
3.3. Competitive Effect on Radial Growth

Over 5 years (2006–2011), the median BAI of Dahurian larch with the BAL index of 0–27, 27–45, and >45 was 53.25 cm2, 40.97 cm2 and 51.60 cm2, respectively, and the mean BAI was 71.17 cm2, 36.67 cm2 and 17.41 cm2, respectively (Figure 6A). Furthermore, BAI was highly significantly negatively correlated with the BAL index (r = −0.92, p < 0.01). The median BAI of Dahurian larch with Hegyi index of 0–1.2, 1.2–2.2, and >2.2 were 19.06 cm2, 30.96 cm2 and 10.39 cm2, respectively, and the mean BAI were 38.57 cm2, 40.93 cm2 and 33.20 cm2, respectively (Figure 6B). BAI was negatively correlated with the Hegyi index (r = −0.019, p = 0.91). The median BAI of Dahurian larch with an SCI index of 0–0.2, 0.2–0.48, and >0.48 was 40.08 cm2, 26.42 cm2 and 35.73 cm2, respectively, and the mean BAI was 46.89 cm2, 37.24 cm2 and 31.40 cm2, respectively (Figure 6C). BAI had a significant negative correlation with the SCI index (r = −0.37, p = 0.046). Overall, trees showed a greater average growth rate in situations with lower competition intensity than in those with higher competition intensity, suggesting that neighbourhood competition had a significant negative impact on BAI.
The BAI exhibited a significantly positive correlation with the initial BA (p < 0.05). However, the ln BAI in the model did not show a significant correlation with any competition index (p > 0.05). The model that incorporated either the Hegyi or SCI as a variable demonstrated slightly inferior statistical performance compared to the model (R2 = 0.820, p < 0.001, AIC = 18.88, Table 1) that considered only tree size (initial BA). The AIC may decrease if competitive effects are incorporated into the model.
According to the results of the multiple linear regression, tree size explained 42.54%–81.37% of the variance in BAI, whereas competition accounted for 0.06%–41.47% (Figure 7). The model (R2 = 0.832, p < 0.001, AIC = 16.85, Table 1), which includes the BAL index, demonstrated the best statistical performance (with the lowest AIC and the highest adjusted R2) when predicting BAI using tree size and competition indices at our site.

4. Discussion

4.1. Radial Growth Responses to the Regional Temperature

The RWI of Dahurian larch exhibited a consistent pattern in response to temperature variations across different periods: a significant negative correlation was observed between RWI and temperature during the NSC accumulation period (from August to October of the previous year) and the radial growth period (from April to July of the current year) (Figure 3). These findings are contrary to Hypothesis I.
Radial growth is influenced not only by the temperature and water conditions of the current year but also by the climatic conditions of the preceding year, a phenomenon known as the ‘time lag effect’ in plant physiology [36]. The RWI of Dahurian larch demonstrated a significant negative correlation with both the average temperature (T) and maximum temperature (Tmax) during the NSC accumulation period. This aligns with the results of a study on the relationship between RWI and climatic factors of local conifers conducted in southern Tibet, China [37].
Although Dahurian larch concludes its growing season during the NSC accumulation period, it continues to photosynthesise to accumulate NSC in the trunk and root for winter survival. An increase in temperature during this period can lead to a water deficit due to enhanced transpiration, thereby affecting photosynthesis efficiency and resulting in the formation of a narrower tree ring in the subsequent year [38,39].
The RWI exhibited a significant negative correlation with both the average temperature (T) and minimum temperature (Tmin) during the radial growth period. Despite contradicting Hypothesis I, previous studies have indicated a negative correlation between the spring and summer temperatures of the current year and RWI. This is because higher temperatures during the growing season enhance tree transpiration, leading to water deficits that inhibit radial growth [40]. Conversely, it has been demonstrated that warmer spring and summer temperatures can promote radial growth by increasing the activity of photosynthesis-related enzymes, thereby enhancing the photosynthetic rate [14]. Some studies have also suggested that the impact of temperature and precipitation on radial growth during the radial growth period is combined. For instance, below-average precipitation coupled with above-average temperature in late spring results in decreased radial growth [41]. The discrepancies between our study’s results and those of previous studies could be attributed to the different locations of the selected sample plots. It could also be due to the influence of the surrounding forest community structure, soil conditions, and site conditions on radial growth. Therefore, for further improvement in this study, more comprehensive and representative sampling sites are necessary.

4.2. Radial Growth Responses to the Moisture Condition

Linear regression analysis of the RWI with the Pmean and the SPEImean during different periods revealed a significant positive correlation between the RWI of Dahurian larch and moisture during the NSC accumulation period and the radial growth period (Figure 4 and Figure 5). A highly significant positive correlation was observed between RWI and SPEImean during the NSC accumulation period and NSC consumption period (from November of the previous year to March of the current year). A significant positive correlation was also found between RWI and SPEImean during the radial growth period (Figure 5). These results confirm Hypothesis I.
SPEI is considered a superior drought indicator as it accounts for the effects of other climatic factors such as temperature and wind [42]. Higher SPEI values denote a wetter state than the average period [43]. A positive correlation was observed between RWI and both Pmean and SPEImean during the NSC accumulation period. This can be attributed to the fact that lower evapotranspiration, resulting from increased precipitation or cooler temperatures, can lead to wetter climatic conditions in the area. These conditions are favourable for trees, enabling them to accumulate more NSC for radial growth in the subsequent year [17,44].
RWI was positively correlated with SPEImean during the NSC consumption period. This was because the form of precipitation in the Maoershan region in winter was dominated by snowfall, and when the temperature was above freezing point in spring, the melted snow provided sufficient water for the early physiological activities of the trees [45].
During the radial growth period, RWI exhibited a positive correlation with both Pmean and SPEImean. This period, from April to July of the current year, represents the primary radial growth phase for Dahurian larch, during which the tree requires substantial water for various critical physiological activities [46]. Therefore, ample precipitation and humid climatic conditions can promote cell expansion and photosynthesis, thereby accelerating radial growth [17]. Although RWI responded positively to Pmean during both the radial growth period and the NSC accumulation period, significant statistical differences were observed between the slopes of the regression lines. The slope of the regression line for the radial growth period was steeper than that for the NSC accumulation period (Figure 4). This suggests that radial growth is more sensitive to the Pmean of the radial growth period than that of the NSC accumulation period, possibly due to the trees’ high water demand during the growing season [47].
In summary, the RWI of Dahurian larch exhibited a significant positive response to SPEImean across all three periods, indicating that SPEI is a key climatic factor influencing radial growth. Pmean was positively correlated with radial growth, while RWI responded negatively to temperature. With global warming [1], the mean annual temperature in the Maoershan region has significantly increased from 1980 to 2012, and the annual precipitation has significantly decreased (Figure 2). Given these results, it is plausible that future temperature increases and water deficits in the eastern mountainous regions of northeastern China will constrain the radial growth of Dahurian larch.

4.3. Radial Growth Responses to Competition

The analysis of the relationship between the BAI from 2006 to 2011 and three competition indices revealed a negative impact of neighbourhood competition on the radial growth of Dahurian larch. Growth Model 3 emerged as the optimal model for explaining BAI variability (Table 1 and Figure 7), thereby confirming Hypothesis II.
The observed negative correlation between BAI and competition indices, along with a lower growth rate under heightened competition, can be attributed to the influence of competition on radial growth. This influence is mediated through the availability of resources such as light and water that a tree can utilise within a given area [11,48]. The lack of correlation between the Hegyi index and the BAI (r = −0.019, p > 0.05, Figure 6B) could be due to the relative position of the trees in the plot and the directionality of competitive pressure. Trees near the plot’s edge may not account for competition outside the plot [49]. Furthermore, competition from different directions can lead to varying competitive pressures, which is not taken into account by the Hegyi index. The SCI incorporated the mingling index, which exhibits the directionality of competitive pressure [27], showing a stronger significant correlation than the Hegyi index(r = −0.37, p < 0.05, Figure 6C).
Model 3 was the optimal model for explaining the variability in BAI, with a better statistical performance than the similar bivariate models 1 and 2 and the univariate model 4 used as the control, which was consistent with the results of Durango’s study on the relationship between radial growth and competition indices of local whitebark pine (Pinus alba) [50], but not with the results of a study on the relationship between radial growth and different competition indices of local trees in Gansu and Jilin, China [24].
The discrepancy with the results of the aforementioned studies can be attributed to two main factors. Firstly, the Hegyi and SCI competition indices incorporate parameters related to the stand’s spatial structure, such as the distance between individual trees, mingling index, uniform angle index, dominance index, and crowding index. These parameters may be more effective in describing the competition situation in a structurally diversified stand with a rich species composition [51,52]. However, only three tree species were present in the selected sample plots for this study, indicating a relatively simple species composition at our experimental site. Therefore, the BAL index could be more suitable for describing individual tree competition in stands with low species richness [53].
Secondly, the BAL index has been widely used in related studies for competition evaluation due to its simplicity in calculation and interpretation. It provides individual indices for each tree based on their basal area [54]. The basal area is a critical parameter for population density, indicating the degree to which a specific area is occupied by trees. It is an independent variable that inherently reflects the competitive status of each tree, eliminating the need to integrate additional variables [55].
Tree size is universally acknowledged as a pivotal determinant influencing both tree growth and survival [56,57]. In alignment with this consensus, our study further corroborates that tree size emerges as the most potent predictor of tree growth. Across all linear models that were fitted, tree size accounted for the majority of the total variance in the Basal Area Increment (BAI) at our experimental site (Table 1). The rate of tree growth exhibited a positive correlation with the initial size of the tree, suggesting that larger trees have the potential to yield more wood compared to their smaller counterparts. This observation aligns with the findings of previous studies [58,59]. The accelerated growth rate observed in larger trees could potentially be attributed to their enhanced ability to harness resources, including light, water, and nutrients [60,61]. Furthermore, we observed that, despite accounting for the cumulative impact of initial tree size and neighbourhood competition, a portion of the growth variance remained unaccounted for. This may be attributed to other significant factors, such as soil conditions and subterranean processes, which were not included in our considerations.

5. Conclusions

Our research demonstrated that the radial growth of Dahurian larch was influenced by temperature, hydration status, tree size, and the intensity of local competition. The RWI of Dahurian larch exhibited a consistent response pattern to temperature and hydration conditions in each period: a significant negative correlation with temperature during the NSC accumulation period and the radial growth period, and a significant positive correlation with precipitation during the same periods. A significant positive correlation was also observed between the RWI and SPEI across the three periods. These results suggest that future increases in temperature and water deficits will likely continue to constrain the radial growth of Dahurian larch in this region. The competition indices we selected showed a negative correlation with the five-year BAI, indicating that competition negatively impacts radial growth. The radial growth of Dahurian larch was primarily influenced by the initial tree size and less so by competition. Together, these factors accounted for 77.6%–83.2% of the total variation in BAI. When compared to the Hegyi index and the SCI index, the BAL index was more effective in predicting tree growth. Furthermore, our findings suggest that it is necessary to consider the diversity of tree species in the stand and the parameters related to the stand’s spatial structure before assessing the effects of local competition on radial growth, in order to select an appropriate competition index.

Author Contributions

Conceptualisation, Z.L. and Q.Z.; methodology, Z.L. and Q.Z.; software, Z.L.; validation, Z.L., Y.W. and K.Z.; formal analysis, Z.L.; investigation, Z.L., K.Z. and Y.W.; resources, Q.Z.; data curation, Z.L. and Q.Z.; writing—original draft preparation, Z.L.; writing—review and editing, Q.Z.; visualisation, Z.L.; supervision, Q.Z.; project administration, Q.Z.; funding acquisition, Q.Z. All authors have read and agreed to the published version of the manuscript.

Funding

This research was funded by the National College Student Innovation and Entrepreneurship Training Program (No. 202310225199), and the National Key Technology Research and Development Program of the Ministry of Science and Technology of China (No. 2011BAD37B01).

Institutional Review Board Statement

Not applicable.

Informed Consent Statement

Not applicable.

Data Availability Statement

The data are not publicly available due to restrictions, such as containing information that could compromise the privacy of research participants.

Acknowledgments

We are grateful for the assistance of Heilongjiang Maoershan Forest Ecosystem National Field Scientific Observation and Research Station for providing field experiment foundation and data support.

Conflicts of Interest

The authors declare no conflicts of interest.

References

  1. IPCC. Climate Change 2021: The Physical Science Basis; Cambridge University Press: Cambridge, UK, 2021. [Google Scholar]
  2. Olsson, P.-O.; Jonsson, A.M.; Eklundh, L. A new invasive insect in Sweden Physokermes inopinatus: Tracing forest damage with satellite based remote sensing. For. Ecol. Manag. 2012, 285, 29–37. [Google Scholar] [CrossRef]
  3. Johnson, C.; Chhin, S.; Zhang, J. Effects of climate on competitive dynamics in mixed conifer forests of the Sierra Nevada. For. Ecol. Manag. 2017, 394, 1–12. [Google Scholar] [CrossRef]
  4. Bonan, G.B. Forests and climate change: Forcings, feedbacks, and the climate benefits of forests. Science 2008, 320, 1444–1449. [Google Scholar] [CrossRef] [PubMed]
  5. Han, X.; Liang, H.; Jiang, S.; Zhu, H.; Zhou, P.; Huang, J. Effects of competition and climate on tree radial growth of Pinus sibirica in Altai Mountains, Xinjiang, China. J. Plant Ecol. 2020, 44, 1195–1202. (In Chinese) [Google Scholar]
  6. Han, Y.; Gai, X.; Qiu, S.; Zhang, Y.; Wang, S.; Zhou, L.; Yu, D. Spatial and temporal variations of the responses of radial growth of Larix gmelinii to climate in the Daxing’anling Mountains of Northeast China. J. Appl. Ecol. 2021, 32, 3397–3404. (In Chinese) [Google Scholar]
  7. Britton, T.G.; Richards, S.A.; Hovenden, M.J. Quantifying neighbour effects on tree growth: Are common ‘competition’indices biased? J. Ecol. 2023, 111, 1270–1280. [Google Scholar] [CrossRef]
  8. Jiang, X.; Huang, J.-G.; Stadt, K.J.; Comeau, P.G.; Chen, H.Y.H. Spatial climate-dependent growth response of boreal mixedwood forest in western Canada. Glob. Planet. Change 2016, 139, 141–150. [Google Scholar] [CrossRef]
  9. Fichtner, A.; Forrester, D.I.; Haerdtle, W.; Sturm, K.; von Oheimb, G. Facilitative-Competitive Interactions in an Old-Growth Forest: The Importance of Large-Diameter Trees as Benefactors and Stimulators for Forest Community Assembly. PLoS ONE 2015, 10, 335–352. [Google Scholar] [CrossRef]
  10. Jiao, L.; Wang, L.; Li, L.; Chen, X.; Yan, X. Divergent responses of radial growth of Larix sibirica to climate change in Altay Mountains of Xinjiang, China. J. Plant Ecol. 2019, 43, 320–330. (In Chinese) [Google Scholar] [CrossRef]
  11. Han, X.; Gao, L.; Qing, L.; Pang, R.; Liu, Q.; Zhu, Y.; Tian, Y.; Zhang, J. Effect of stand density on radial growth-climate relationship of Larix gmelinii. J. Nanjing For. Univ. Nat. Sci. Ed. 2023, 48, 1–13. (In Chinese) [Google Scholar]
  12. Kozlowski, T. Carbohydrate sources and sinks in woody plants. Bot. Rev. 1992, 58, 107–222. [Google Scholar] [CrossRef]
  13. Chapin III, F.S.; Schulze, E.-D.; Mooney, H.A. The ecology and economics of storage in plants. Annu. Rev. Ecol. Syst. 1990, 21, 423–447. [Google Scholar] [CrossRef]
  14. Yasmeen, S.; Wang, X.; Zhao, H.; Zhu, L.; Yuan, D.; Li, Z.; Zhang, Y.; Ahmad, S.; Han, S. Contrasting climate-growth relationship between Larix gmelinii and Pinus sylvestris var. mongolica along a latitudinal gradient in Daxing’an Mountains, China. Dendrochronologia 2019, 58, 645–657. [Google Scholar] [CrossRef]
  15. Sperling, O.; Earles, J.M.; Secchi, F.; Godfrey, J.; Zwieniecki, M.A. Frost induces respiration and accelerates carbon depletion in trees. PLoS ONE 2015, 10, e0144124. [Google Scholar] [CrossRef] [PubMed]
  16. Charrier, G.; Lacointe, A.; Améglio, T. Dynamic modeling of carbon metabolism during the dormant period accurately predicts the changes in frost hardiness in walnut trees Juglans regia L. Front. Plant Sci. 2018, 9, 1746–1759. [Google Scholar] [CrossRef]
  17. Mei, L.; Xiong, Y.; Gu, J.; Wang, Z.; Guo, D. Whole-tree dynamics of non-structural carbohydrate and nitrogen pools across different seasons and in response to girdling in two temperate trees. Oecologia 2015, 177, 333–344. [Google Scholar] [CrossRef]
  18. Li, W.; Jiang, Y.; Dong, M.; Du, E.; Wu, F.; Zhao, S.; Xu, H. Species-specific growth-climate responses of Dahurian larch (Larix gmelinii) and Mongolian pine (Pinus sylvestris var. mongolica) in the Greater Khingan Range, northeast China. Dendrochronologia 2021, 65, 125803. [Google Scholar] [CrossRef]
  19. Wang, C.K. Biomass allometric equations for 10 co-occurring tree species in Chinese temperate forests. For. Ecol. Manag. 2006, 222, 9–16. [Google Scholar] [CrossRef]
  20. Bunn, A.G. A dendrochronology program library in R (dplR). Dendrochronologia 2008, 26, 115–124. [Google Scholar] [CrossRef]
  21. Wigley, T.M.; Briffa, K.R.; Jones, P.D. On the average value of correlated time series, with applications in dendroclimatology and hydrometeorology. J. Appl. Meteorol. Climatol. 1984, 23, 201–213. [Google Scholar] [CrossRef]
  22. Hegyi, F. A simulation model for managing jack-pine standssimulation. RoyalColl. For. Res. Notes 1974, 30, 74–90. [Google Scholar]
  23. Wykoff, W. User’s Guide to the Stand Prognosis Model; US Department of Agriculture, Forest Service, Intermountain Forest and Range Experiment Station: Ogden, UT, USA, 1982. [Google Scholar]
  24. Hui, G.; Wang, Y.; Zhang, G.; Zhao, Z.; Bai, C.; Liu, W. A novel approach for assessing the neighborhood competition in two different aged forests. For. Ecol. Manag. 2018, 422, 49–58. [Google Scholar] [CrossRef]
  25. Hui, G.; Albert, M.; Gadow, K. The diameter dominance as a parameter for simulating forest structure. Forstwiss. Cent. 1998, 117, 258–266. [Google Scholar] [CrossRef]
  26. Hu, Y.; Hui, G. How to describe the crowding degree of trees based on the relationship of neighboring trees. J. Beijing Forest. Univ. 2015, 37, 1–8. (In Chinese) [Google Scholar] [CrossRef]
  27. Gadow, K.; Huy, G.; Albert, M. The uniform angle index—A structural parameter for describing tree distribution in forest stands. Cent. Ges. Forstwes. 1998, 115, 1–10. [Google Scholar]
  28. MacFarlane, D.W.; Kobe, R.K. Selecting models for capturing tree-size effects on growth-resource relationships. Can. J. For. Res. 2006, 36, 1695–1704. [Google Scholar] [CrossRef]
  29. Zhang, Q.; Wang, C. China Ecosystem Positioning Observation and Research Data Set: 1979–2017. In Forest Ecosystem Volume Heilongjiang Maoershan Station; China Agriculture Press: Beijing, China, 2022. [Google Scholar]
  30. ShangGuan, H.; Liu, H.; Hu, G.; Guo, W. Seasonal Patterns and Their Determinants of Non-structural Carbohydrates in Different Tree Species at Xeric Timberline. Acta Sci. Nat. Univ. Pekin. 2019, 55, 553–560. (In Chinese) [Google Scholar] [CrossRef]
  31. Dow, C.; Kim, A.Y.; D’Orangeville, L.; Gonzalez-Akre, E.B.; Helcoski, R.; Herrmann, V.; Harley, G.L.; Maxwell, J.T.; McGregor, I.R.; McShea, W.J.; et al. Warm springs alter timing but not total growth of temperate deciduous trees. Nature 2022, 608, 552–557. [Google Scholar] [CrossRef]
  32. Richardson, A.D.; Carbone, M.S.; Keenan, T.F.; Czimczik, C.I.; Hollinger, D.Y.; Murakami, P.; Schaberg, P.G.; Xu, X.M. Seasonal dynamics and age of stemwood nonstructural carbohydrates in temperate forest trees. New Phytol. 2013, 197, 850–861. [Google Scholar] [CrossRef]
  33. Team, R.c. R: A Language and Environment for Statistical Computing; R Foundation for Statistical Computing: Vienna, Austria, 2023. [Google Scholar]
  34. Warton, D.I.; Duursma, R.A.; Falster, D.S.; Taskinen, S. smatr 3—An R package for estimation and inference about allometric lines. Methods Ecol. Evol. 2012, 3, 257–259. [Google Scholar] [CrossRef]
  35. Grömping, U. Relative importance for linear regression in R: The package relaimpo. J. Stat. Softw. 2007, 17, 1–27. [Google Scholar] [CrossRef]
  36. Yu, D.; Wang, S.; Tang, L.; Dai, L.; Wang, Q.; Wang, S. Relationship between tree-ring chronology of Larix olgensis in Changbai Mountains and the climae change. J. Appl. Ecol. 2005, 16, 14–20. (In Chinese) [Google Scholar]
  37. Brauning, A. Dendroclimatological potential of drought-sensitive tree stands in southern Tibet for the reconstruction of monsoonal activity. LAWA J. 1999, 20, 325–338. [Google Scholar] [CrossRef]
  38. Chang, Y.; Chen, Z.; Zhang, X.; Bai, X.; Zhao, X.; Li, J.; Lu, X. Responses of radial growth to temperature in Larix gmelinii of the Da Hinggan Ling under climate warming. J. Plant Ecol. 2017, 41, 279–289. (In Chinese) [Google Scholar]
  39. Jiang, Y.; Zhang, J.; Han, S.; Chen, Z.; Setala, H.; Yu, J.; Zheng, X.; Guo, Y.; Gu, Y. Radial Growth Response of Larix gmelinii to Climate along a Latitudinal Gradient in the Greater Khingan Mountains, Northeastern China. Forests 2016, 7, 295. [Google Scholar] [CrossRef]
  40. D’Arrigo, R.; Wilson, R.; Liepert, B.; Cherubini, P. On the ‘Divergence Problem’ in Northern Forests: A review of the tree-ring evidence and possible causes. Glob. Planet. Chang. 2008, 60, 289–305. [Google Scholar] [CrossRef]
  41. Żywiec, M.; Muter, E.; Zielonka, T.; Delibes, M.; Calvo, G.; Fedriani, J.M. Long-term effect of temperature and precipitation on radial growth in a threatened thermo-Mediterranean tree population. Trees 2017, 31, 491–501. [Google Scholar] [CrossRef]
  42. Galván, J.D.; Büntgen, U.; Ginzler, C.; Grudd, H.; Gutiérrez, E.; Labuhn, I.; Camarero, J.J. Drought-induced weakening of growth–temperature associations in high-elevation Iberian pines. Glob. Planet. Chang. 2015, 124, 95–106. [Google Scholar] [CrossRef]
  43. Vicente-Serrano, S.M.; Beguería, S.; López-Moreno, J.I. A Multiscalar Drought Index Sensitive to Global Warming: The Standardized Precipitation Evapotranspiration Index. J. Clim. 2010, 23, 1696–1718. [Google Scholar] [CrossRef]
  44. Tixier, A.; Gambetta, G.A.; Godfrey, J.; Orozco, J.; Zwieniecki, M.A. Non-structural Carbohydrates in Dormant Woody Perennials; The Tale of Winter Survival and Spring Arrival. Front. For. Glob. Chang. 2019, 2, 1–8. [Google Scholar] [CrossRef]
  45. Zhang, X.; Manzanedo, R.D.; D’Orangeville, L.; Rademacher, T.T.; Li, J.; Bai, X.; Hou, M.; Chen, Z.; Zou, F.; Song, F.; et al. Snowmelt and early to mid-growing season water availability augment tree growth during rapid warming in southern Asian boreal forests. Glob. Chang. Biol. 2019, 25, 3462–3471. [Google Scholar] [CrossRef] [PubMed]
  46. Zhang, X.W.; Liu, X.H.; Zhang, Q.L.; Zeng, X.M.; Xu, G.B.; Wu, G.J.; Wang, W.Z. Species-specific tree growth and intrinsic water-use efficiency of Dahurian larch (Larbc gmelinii) and Mongolian pine (Pinus sylvestris var. mongolica) growing in a boreal permafrost region of the Greater Hinggan Mountains, Northeastern China. Agric. For. Meteorol. 2018, 248, 145–155. [Google Scholar] [CrossRef]
  47. Yocom, L.; Ogle, K.; Peltier, D.; Szejner, P.; Liu, Y.; Monson, R.K. Tree growth sensitivity to climate varies across a seasonal precipitation gradient. Oecologia 2022, 198, 933–946. [Google Scholar] [CrossRef] [PubMed]
  48. Contreras, M.A.; Affleck, D.; Chung, W. Evaluating tree competition indices as predictors of basal area increment in western Montana forests. For. Ecol. Manag. 2011, 262, 1939–1949. [Google Scholar] [CrossRef]
  49. Sun, Z.; Wang, Y.; Pan, L.; Sun, Y. Hegyi competition index decomposition to improve estimation accuracy of Larix olgensis crown radius. Ecol. Indic. 2022, 143, 109322. [Google Scholar] [CrossRef]
  50. Rivas, J.J.C.; González, J.G.A.; Aguirre, O.; Hernández, F. The effect of competition on individual tree basal area growth in mature stands of Pinus cooperi Blanco in Durango (Mexico). Eur. J. For. Res. 2005, 124, 133–142. [Google Scholar] [CrossRef]
  51. Canham, C.D.; Papaik, M.J.; Uriarte, M.; McWilliams, W.H.; Jenkins, J.C.; Twery, M.J. Neighborhood analyses of canopy tree competition along environmental gradients in new England forests. Ecol. Appl. 2006, 16, 540–554. [Google Scholar] [CrossRef] [PubMed]
  52. Coates, K.D.; Canham, C.D.; LePage, P.T. Above- versus below-ground competitive effects and responses of a guild of temperate tree species. J. Ecol. 2009, 97, 118–130. [Google Scholar] [CrossRef]
  53. Das, A. The effect of size and competition on tree growth rate in old-growth coniferous forests. Can. J. For. Res. 2012, 42, 1983–1995. [Google Scholar] [CrossRef]
  54. Yang, Y.; Huang, S.; Meng, S.X.; Trincado, G.; VanderSchaaf, C.L. A multilevel individual tree basal area increment model for aspen in boreal mixedwood stands. Can. J. For. Res. 2009, 39, 2203–2214. [Google Scholar] [CrossRef]
  55. Martins, F.B.; Soares, C.P.B.; Leite, H.G.; de Souza, A.L.; Castro, R.V.O. Competition indexes for individual eucalyptus trees. Pesquisa Agropecuária Brasileira 2011, 46, 1089–1098. [Google Scholar] [CrossRef]
  56. King, D.A.; Davies, S.J.; Noor, N.S.M. Growth and mortality are related to adult tree size in a Malaysian mixed dipterocarp forest. For. Ecol. Manag. 2006, 223, 152–158. [Google Scholar] [CrossRef]
  57. Coomes, D.A.; Allen, R.B. Effects of size, competition and altitude on tree growth. J. Ecol. 2007, 95, 1084–1097. [Google Scholar] [CrossRef]
  58. Matsushita, M.; Takata, K.; Hitsuma, G.; Yagihashi, T.; Noguchi, M.; Shibata, M.; Masaki, T. A novel growth model evaluating age–size effect on long-term trends in tree growth. Funct. Ecol. 2015, 29, 1250–1259. [Google Scholar] [CrossRef]
  59. Zhang, Z.; Papaik, M.J.; Wang, X.; Hao, Z.; Ye, J.; Lin, F.; Yuan, Z. The effect of tree size, neighborhood competition and environment on tree growth in an old-growth temperate forest. J. Plant Ecol. 2017, 10, 970–980. [Google Scholar] [CrossRef]
  60. McDonald, E.; Kruger, E.; Riemenschneider, D.; Isebrands, J. Competitive status influences tree-growth responses to elevated CO2 and O3 in aggrading aspen stands. Funct. Ecol. 2002, 16, 792–801. [Google Scholar] [CrossRef]
  61. Wyckoff, P.H.; Clark, J.S. Tree growth prediction using size and exposed crown area. Can. J. For. Res. 2005, 35, 13–20. [Google Scholar] [CrossRef]
Figure 1. Location of the study area in Heilongjiang Province in China.
Forests 15 01084 g001
Figure 2. Trends of Ring Width Index (RWI), mean annual temperature, and annual total precipitation from 1980 to 2012.
Forests 15 01084 g002
Figure 3. Linear regression analysis of RWI and three temperature types across different periods. Periods (AC) correspond to the NSC accumulation, the NSC consumption, and the radial growth, respectively. Indices 1, 2, and 3 represent the mean values of Maximum Monthly Temperature (Tmax), Mean Monthly Temperature (T), and Minimum Monthly Temperature (Tmin) for the respective periods. Statistical significance is indicated as follows: * for p < 0.05.
Forests 15 01084 g003
Figure 4. The linear regression between RWI and the mean value of monthly total precipitation (Pmean) across different periods. Because of the different dimensions between Pmean and RWI, the two variables are log-transformed. Periods (AC) correspond to the NSC accumulation, the NSC consumption, and the radial growth, respectively. Statistical significance is indicated as follows: * for p < 0.05.
Forests 15 01084 g004
Figure 5. The linear regression between RWI and mean value of the monthly Standardised Precipitation Evapotranspiration Index (SPEImean) across different periods. Periods (AC) correspond to the NSC accumulation, the NSC consumption, and the radial growth, respectively. Statistical significance is indicated as follows: * for p < 0.05, ** for p < 0.01.
Forests 15 01084 g005
Figure 6. Relationship between different competition indices and Basal Area Increment (BAI) from 2006 to 2011. (A–C) refers to the BAL index, Hegyi index and SCI index, respectively. The solid dots are outliers.
Forests 15 01084 g006
Figure 7. Proportion of explanatory variables in R2 in different growth models.
Forests 15 01084 g007
Table 1. The results of different multiple linear regression models.
ModelExplanation VariablesAdjust R2F-Valuep-ValueAIC
1Intercept77.6%49.6<0.00119.77
BA<0.001
SCI0.998
2Intercept81.9%79.7<0.00118.94
BA<0.001
Hegyi0.659
3Intercept83.2%105.1<0.00116.85
BA<0.001
BAL0.0543
4Intercept82.0%192.5<0.00118.88
BA<0.001
The growth model: l n B A I = a + b 1 l n B A + b 2 C I , and competition index (CI) in models 1–3 indicate the SCI index, the Hegyi index, and the BAL index, respectively. For comparison, the model that just takes into account the tree’s beginning size (the initial BA) was also employed. The adjusted R2 and F values apply to the entire model. Akaike information criterion is referred to as AIC. The lowest AIC value indicates the optimum model, which is also highlighted in bold.
Disclaimer/Publisher’s Note: The statements, opinions and data contained in all publications are solely those of the individual author(s) and contributor(s) and not of MDPI and/or the editor(s). MDPI and/or the editor(s) disclaim responsibility for any injury to people or property resulting from any ideas, methods, instructions or products referred to in the content.

