Abstract
Interest in improving plant nitrogen use efficiency (NUE) in conjunction with reduced usage of nitrogen (N) fertilizers in forestry management is growing. Although biochar amendment is widely applied to increase soil nutrient availability and NUE, the mechanism underlying their positive effects remains little understood. We treated the economically important eucalypt species with biochar (BC), N-enriched fertilizer with 15N isotope labeling (NF), and biochar plus 15N-labeled fertilizer (NFB). Moreover, we determined plant N absorption and soil N availability, soil bacterial community composition and its putative keystone taxa, and plant NUE and competition index under different treatments. Our results indicated that NF and NFB significantly increased plant atom % 15N in both eucalypt stem, root, and foliar, as well as the competition index of eucalypt to forbs for acquiring N. NF and BC increased the network complexity of keystone taxa by shifting putative keystone taxa, including phylum Proteobacteria, Chloroflexi, Actinobacteria, Acidobacteria, and Firmicutes. Piecewise structural equation modeling indicated that variations in plant performance were best directly and positively predicted by soil Proteobacteria. This study highlights the importance of interactive effects between biochar and N fertilizer on plant performance mediated by soil microbial community. The change in soil putative keystone taxa has the potential to be a suitable predictor for plant performance in terms of biochar. Our findings may provide important implications for improving fertilization and afforestation management.
1. Introduction
Nitrogen (N) is a vital element in plant growth and ecosystem functioning [1]. Nitrogen fertilizer is substantially applied to the agricultural or agroforestry system to yield higher production. The artificial N input can account for 55% to 60% of N content in fast-growing and non-legume plant species [2,3,4]. The N use efficiency (NUE) of inorganic N fertilizer ranges from approximately 25% in C3 plants to 40% in C4 plants as a result of N use preference for different plant species [5]. A growing body of evidence suggests that NH4+ is the preferred N form by most trees than NO3− [6]. Moreover, the increases in N availability have the potential to influence other soil nutrients, such as soil organic carbon (SOC), which may, in turn, influence plant NUE. Thus, how to improve plant NUE is a key issue in afforestation management.
Recent studies have indicated that the application of biochar could directly increase soil carbon (C) sequestration, soil water content, and nutrient retention while influencing plant NUE and competition for N acquisition between target crops and undesirable plants when used as a soil amendment [7,8,9]. The study conducted in highly weathered soils suggested that the application of biochar could increase plant inorganic N uptakes and soil microbial N utilization [10]. Several studies have reported a significant increase in plant NUE from inorganic fertilizers following biochar amendments [11]. For example, biochar and chemical fertilizer application increased radish (Raphanus sativus var. Long Scarlet) yield from 42% to 96% in the six weeks of the study relative to the use of chemical fertilizer only [12]. Further, increased plant NUE by biochar has the potential to enhance the competitive advantage of target plants over other neighbors in mixed plantations [13]. Biochar also has the potential to change the composition of the microbial community in soils and further influence plant growth through soil nutrient supply regulation. These indirect influences on plant and soil N cycling, in turn, may influence the soil micro-environment and plant performance [14,15,16]. Biochar tends to increase soil microbial activity [17] and community and functional diversity [18,19]. In addition, biochar provides a novel niche for soil microbes with increased soil aeration, soil organic C, and soil water content [20]. The application of biochar can improve soil ecological stability by reducing soil N leaching [21] and could further improve plant nutrient uptakes [7,11,22]. The magnitude of the positive effects of biochar on soil microbial diversity also depends on the plant and soil interaction [7,23,24]. However, the mechanism of how biochar influences plant growth and soil nutrient availability mediated by soil microbes remains little studied.
Eucalypts are economically important trees around the world; eucalypt plantations cover approximately 4.6 million ha and contribute more than USD 14.2 billion annually to the economy of China [25]. However, the establishment of eucalypt plantations has become a controversial issue due to their adverse ecological effects on soil fertility and understory biodiversity. The extensive planting of eucalypt plantations results in the great demand for exogenous inorganic N [26,27], as well as the decreased diversity of herbaceous [28] and soil microbes [29]. Also, studies on the competitiveness of N acquiring between eucalypt and understory would improve the understanding of interspecific competition in terms of nutrient acquisition [30]. Although plant and soil N cycling are partly influenced by eucalypt’s strong competition for nutrients and water with other undesirable species, it has been recognized that the growth and nutrient accumulation of a eucalypt plantation is also influenced by the physicochemical properties of soil [27], soil microbial diversity [26], and N competition between target crops and undesirable plants [31]. Therefore, in this study, we sought to determine (1) the N status of eucalypt foliar, stem, root, and soils, (2) soil microbial composition and diversity, and (3) the relationship between the plant N acquisition and the soil microbial community. We hypothesized that the application of biochar and N fertilizer would increase bacterial keystone taxa and plant NUE, thereby increasing plant performance, and that the effects would differ in direct and indirect pathways.
2. Materials and Methods
2.1. Study Site
The eucalypt plantation (Eucalyptus urophylla × E. grandis; clone DH32–29) was established in January 2019 at the Guangxi University Tree Nursery in Nanning, China (22°51′49″ N, 108°29′45″ E). The mean annual temperature of the research site ranged from 28.2 °C in July to 12.8 °C in January. The average annual precipitation was approximately 1304.2 mm, with a mean humidity of 79% from 2010 to 2020. The Eutric Fluvisol soil type (pH = 8.34 ± 0.15) had a soil organic matter content determined by loss on ignition of 1.6 ± 0.4% (n = 4). The herbaceous layer is dominated by native Chinese medical herbs, including Bidens pilosa L. (beggar ticks) and Oxalis corniculata L. (creeping oxalis).
2.2. Experimental Design
A two-factor experimental design was used in this study. The eucalyptus plantation was treated with biochar (BC) and 15N-labeled fertilizer (NF). Thus, treatments and the control were evaluated as follows: (1) no biochar and no fertilizer (referred to as the control), (2) biochar (20.0 t hm−2, BC), (3) 15N-labeled fertilizer (8.0 g plant−1, NF), and (4) 20.0 t hm−2 biochar plus 8.0 g plant−15N-labeled fertilizer (NFB). The amounts of biochar and fertilizer application in the present study were 20 t hm−2 and 8 g plant−1, respectively, which were carried out based on the methods described in our previous study [32] and other studies [31]. The pyrolysis biochar was produced by wheat (Triticum aestivum L.) straw in a continuous carbonizer at 550 °C for 3 h, and its basic properties are shown in Table S1. The 15N-labeled fertilizer was obtained from the Shanghai Stable Isotope Engineering Research Center, Shanghai, China. The fertilizer was 15N-enriched urea (CO(15NH2)2) dilution, with the atom % 15N of approximately 10%.
The experimental plots were plowed with a cultivator in January 2019 and then divided into two experimental units, with a 2 m buffer strip between units.
In January 2019, we randomly established two experimental blocks (11 m × 16 m) in the eucalypt plantation. Each block was divided into four (2 m × 16 m) plots with 1 m buffer strips. Then, each plot was divided into six replicate subplots (2 m × 2 m). One eucalypt seedling was planted into each subplot. The average height and basal diameter of the seedlings were 33.21 ± 4.12 cm and 3.77 ± 0.83 mm (n = 16), respectively.
2.3. Field Sampling and Measurements
2.3.1. Plant and Soil Sampling
To determine plant N nutrient concentrations and plant biomass, eucalypt foliar, stem, and root samples, as well as understory forb samples (forb stem root, foliar as a whole), were collected in January 2020. As the forb is small in size (height up to 20 cm), it is difficult to separate and measure its root, stem, and leaves individually. Each sample was collected from an alternate plot within each block, and the same plots were used for the eight sample collections (n = 8). Eucalypt foliage exposed to full sun, stem, and root samples were collected after the eight eucalypt individuals (n = 8) were logged, as well as the understory forb samples from adjacent areas. To determine plant 15N isotope abundance, plant samples were oven-dried at 105 °C for 6 h to a constant mass before sieving with a 0.15 mm.
To measure soil physicochemical properties and soil 15N isotope abundance, we collected the upper 0–20 cm of topsoil samples from the rhizosphere of the selected eucalypt plants and stored them at 4 °C in January 2020. The soil samples were then air-dried and stored at 25 °C before sieving with 2 mm and 0.15 mm sieves, respectively.
2.3.2. Plant and Soil Sample Measurements
Plant (including eucalypt foliar, root, and stem, as well as forbs) and soil total nitrogen (TN) were determined via a flow injection auto-analyzer (Technicon, AA3, Hamburg, Germany). Soil NO3− and NH4+ were determined on a continuous flow analyzer (AA3, SEAL, Hamburg, Germany). Stable isotope analysis was performed on each type of eucalypt tissue (foliage, stem, and root), forbs, and soil at the Stable Isotope Laboratory of the College of Forestry at Guangxi University in January 2020. Samples of 0.002 g plant and 0.02 g soil were loaded in tin containers and crimped for combustion for δ15N analyses in an isotope ratio mass spectrometer (SN09072D, Homotopic, Thermo Fisher Scientific, Dreieich, Germany).
For the soil bacterial community investigation, we performed high-throughput amplicon sequencing on the bacterial 16S rDNA region. We extracted and quantified DNA from 0.5 g of fresh soil with the EZNA® Soil DNA kit (OmegaBio-Tek, Norcross, GA, USA) and a micro-spectrophotometer (Thermo Scientific, Wilmington, DE, USA) and then detected the integrity of DNA using 1% agarose gel electrophoresis. The V3-V4 hypervariable regions of the soil bacterial 16S rRNA were amplified with universal primers 338F and 806 R based on the purified DNA in a thermocycler PCR system. We then precisely quantified (±0.1 ng µL−1) the purified PCR products with a PicoGreen® dsDNA Quantification Kit (Molecular Probes, Eugene, OR, USA) in a QuantiFluor™-ST blue fluorescence quantitative system (Promega, Madison, WI, USA) for the further Illumina high-throughput sequencing. The purified amplicons were pooled in equimolar and paired-end sequenced (2 × 300) on a MiSeq platform (Illumina, San Diego, CA, USA), including the fixation of one-end DNA fragments on the chips, PCR synthesis of target DNA fragments, PCR amplification, DNA amplicons linearization, DNA polymerase, dNTP cycling, laser scanning on reaction plate, polymerization of the second nucleotide, statistical analysis of the fluorescence signal results, and acquisition of the template DNA sequences. Then, the measured pair-end reads were spliced and filtered based on the overlapping relationship and sequence quality; the operational taxonomic unit (OTU) cluster analysis and species taxonomy analysis were performed after samples had been distinguished. In addition, statistical analysis of the community structure at different taxonomy levels was processed based on taxonomic information.
2.4. Statistical Analysis
The effects of biochar and fertilizer on pH, SWC, NH4+, NO3−, TN in soils, and atom % 15N, plant TN, plant NUE, and competition index in plants measured in January 2020 were evaluated using one-way analysis of variance (ANOVA). We determined stable ratios as parts per thousands (‰) based on Formula (S1). The plant NUE was calculated based on Formula (S2), and the competition for acquiring the N ratio between eucalypts and forbs was calculated following Formula (S3). Additionally, the effects on the root, stem, and foliage of eucalypts, as well as the dry biomass, 15N isotope abundance, and 15N acquiring ratio between eucalypts and forbs, were evaluated. These measurements were taken in January 2020 and were analyzed using a one-way analysis of variance. The assumptions of normality of residuals and homogeneity of variances were assessed between all treatments, and data transformations were applied when appropriate to meet basic assumptions. We conducted log transformation on the data of dry plant biomass, TN, and 15N from fertilizer before using a one-way analysis of variance. We used Piecewise structural equation modeling (Piecewise SEM) with the R packages lavaanand vegan to investigate the effects of plant and soil N, as well as soil microbial diversity, on the response of plant foliar N accumulation to biochar and 15N-labeled fertilizer [33]. Results were considered statistically significant at p < 0.05 unless otherwise stated.
3. Results
3.1. Soil Nutrients
The effects of biochar and 15N-labeled fertilizer on soil water content (SWC), soil pH, TN, NO3−, and NH4+ were all significant at α = 0.05 (Table 1). The effects of all treatments on SWC were significant (p < 0.05). The NFB treatment resulted in a significant (p < 0.05) increase in soil pH relative to the control, while no differences were observed among other treatment comparisons. Compared with the control, the biochar treatment exerted significant (p < 0.05) positive effects on soil NH4+, either applied alone (BC) or together with fertilizer (NFB), while the fertilizer-alone (NF) treatment exerted no significant effect. The results indicated that BC and NF significantly (p < 0.05) decreased soil pH and NH4+ concentration relative to NFB. NF, BC, and NFB significantly (p < 0.05) decreased soil TN by 25.49%, 11.76%, and 34.31%, respectively. Moreover, either sole application of biochar or fertilizer significantly (p < 0.05) increased soil TN relative to NFB. The effects of BC, NF, and NFB on soil NO3− were significant, yielding decreases of 74.62%, 60.77%, and 78.46%, respectively, compared to the control.

Table 1.
Means (±standard errors, n = 8) for soil pH, gravimetric soil water content (SWC), ammonium nitrogen (NH4+), nitrate nitrogen (NO3−), and total nitrogen (TN) of soils. Treatment types include the control (CK, no biochar and no 15N-labeled fertilizer), BC (20 t hm−2 biochar), NF (8 g plant−1 15N-labeled fertilizer), and NFB (20.0 t hm−2 biochar plus 8.0 g plant−15N-labeled fertilizer). Different letters within rows indicate statistically significant differences (p < 0.05) across all treatments and the control.
3.2. Soil Microbial Community
The effects of biochar and fertilizer on soil microbial richness and diversity based on OTUs are shown in Table 2. The Shannon index documented a significant (p < 0.05) increase in the number of OTUs in all treatments relative to the control, while there were no differences among any treatment comparisons. The Simpson index showed a significant (p < 0.05) decrease in the number of OTUs in all treatments when compared with the control. All treatments significantly (p < 0.05) and positively influenced the ACE and Chao indices relative to the control. However, the NF treatment produced significantly higher ACE and Chao indices than either the BC or NFB treatments.
Table 2.
Means (±standard errors, n = 8) for soil bacterial Shannon, Simpson, Ace, Chao indices. Treatment types include the control (CK, no biochar and no 15N-labeled fertilizer), BC (20 t hm−2 biochar), NF (8 g plant−1 15N-labeled fertilizer), and NFB (20.0 t hm−2 biochar plus 8.0 g plant−15N-labeled fertilizer). Differences in lowercase letters within rows indicate statistically significant differences among all treatments and the control at α = 0.05 level.
The relative abundances and community composition of the bacterial phyla in biochar and fertilizer-treated soils documented via cluster analysis are shown in Figure 1 and Figure S1. All treatments significantly influenced the relative abundance of the dominant bacterial phyla in Cluster 1 relative to the control. BC, NF, and NFB treatments significantly (p < 0.05) increased the relative abundance of Proteobacteria by 27.27%, 40.91%, and 100%, respectively, relative to the control. In addition, the effect of NFB on the relative abundance of Proteobacteria was significantly higher than either the BC or NF treatment. A significant (p < 0.05) decrease was evident for the relative abundance of Chloroflexi in the NF and NFB treatments by 25.93% and 37.04%, whereas no significant difference was observed in BC when compared with the control. Also, the sole application of either biochar or fertilizer alone increased the relative abundance of Chloroflexi significantly (p < 0.05) higher than the co-application of these two (NFB). BC, NF, and NFB treatments significantly decreased the relative abundance of Acidobacteria by 27.27%, 22.73%, and 63.64%, respectively, relative to the control. The effect of NFB on the relative abundance of Acidobacteria was also significantly lower than in the BC and NF treatments. NF and NFB both significantly (p < 0.05) decreased the relative abundance of Actinobacteria by 18.18%, whereas no significant difference was observed in BC when compared with the control. The BC treatment increased the relative abundance of Actinobacteria more significantly than the NFB treatment. All treatments resulted in significant increases in the relative abundance of Bacteroidetes relative to the control, as revealed by a pairwise test. The relative abundance of Gemmatimonadetes increased significantly by 65.52%, 82.76%, and 113.79% in the BC, NF, and NFB treatments relative to the control. In addition, the effect of NFB on the relative abundance of Gemmatimonadetes was significantly higher than in the BC treatment.
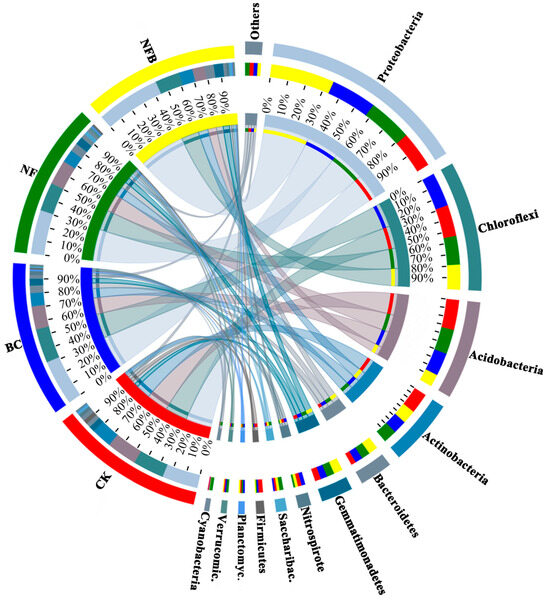
Figure 1.
Relative abundance and community composition of dominant bacterial phyla in soils for each treatment and the control. Treatment types include the control (CK, no biochar and no 15N-labeled fertilizer), BC (20 t hm−2 biochar), NF (8 g plant−1 15N-labeled fertilizer), and NFB (20.0 t hm−2 biochar plus 8.0 g plant−15N-labeled fertilizer). Saccharibac.: Saccharibacteria; Planctomyc.: Planctomycetes; Verrucomic.: Verrucomicrobia.
3.3. Plant Performance
The effects of the NF and NFB treatments were significant (p < 0.001) on atom % 15N of plant foliage, stem, and root of eucalypt, and on forbs when compared with the control, whereas no significant differences were evident between BC and the control (Figure 2a). For plant foliage, the effects of NFB on atom % 15N were significantly higher than that of either the BC or NF treatment. A similar pattern occurred for atom % 15N of plant root and forbs, which increased only in the NFB treatment relative to BC and NF. For plant stem, the effect of NF on atom % 15N was significantly (p < 0.001) higher than that of the BC and NFB treatments.
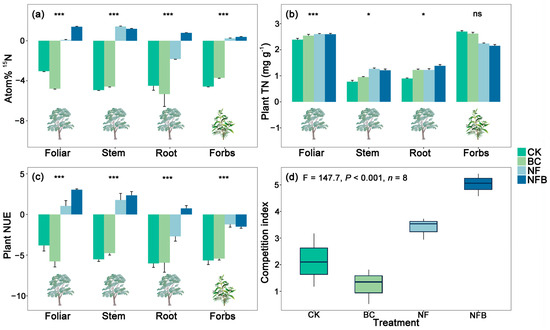
Figure 2.
Mean (± standard error) atom % 15N (a), plant total nitrogen (TN) concentration (b), plant nitrogen use efficiency (NUE) (c) in different eucalypt plant organs and forbs, competition index for acquiring N (d) under the control and treatments (n = 8). The measurements of root, stem, and foliar are only specific to eucalypts, whereas the measurement for forbs is performed considering the whole plant. Lowercase letters within a panel indicate statistically significant differences among treatments and the control at α = 0.05. * and *** indicate statistically significant differences between treatments and the control at p < 0.05 and p < 0.001 respectively, and “ns” indicates “not significant”.
The effects of biochar and fertilizer applications were significant (p < 0.001) for all plant TN measurements (Figure 2b). The effects of all treatments were significant at p < 0.001 on plant foliar TN when compared with the control. A similar pattern occurred for plant root and stem TN, which increased in all treatments relative to the control. The NF and NFB resulted in significantly higher TN (p < 0.001) than the BC treatment by 37.21% and 30.23%. In addition, NFB increased root TN more significantly (p < 0.001) than either the BC (by 14.79%) or NF (by 14.54%) treatment. However, a contrasting pattern occurred for forb TN, which decreased in all treatments compared with the control. Also, the effects of NFB and NF on forb TN were significantly (p < 0.001) lower than that in the BC treatment.
No clear effects of BC amendment on plant NUE of eucalypt foliage, root, and stem, as well as forbs, were observed relative to the control (Figure 2c). The NF and NFB treatments significantly (p < 0.001) increased plant NUE compared to the control in eucalypt foliage and stem, as well as on forbs. A significant (p < 0.001) increase in the NFB treatment (2.17 mg plant−1) in plant root was evident when compared with BC, NF, and the control (0.0026 mg plant−1, 0.0037 mg plant−1, and 0.075 mg plant−1, respectively).
NF and NFB significantly (p < 0.001) increased the competition ratios of eucalypt to forbs for acquiring N relative to the control, whereas no significance was observed in BC (Figure 2d). In addition, the effects of NFB on the competition ratios were significantly (p < 0.001) 4.11 times higher than that of NF.
3.4. Bacterial Co-Occurrence Network and Putative Keystone Taxa
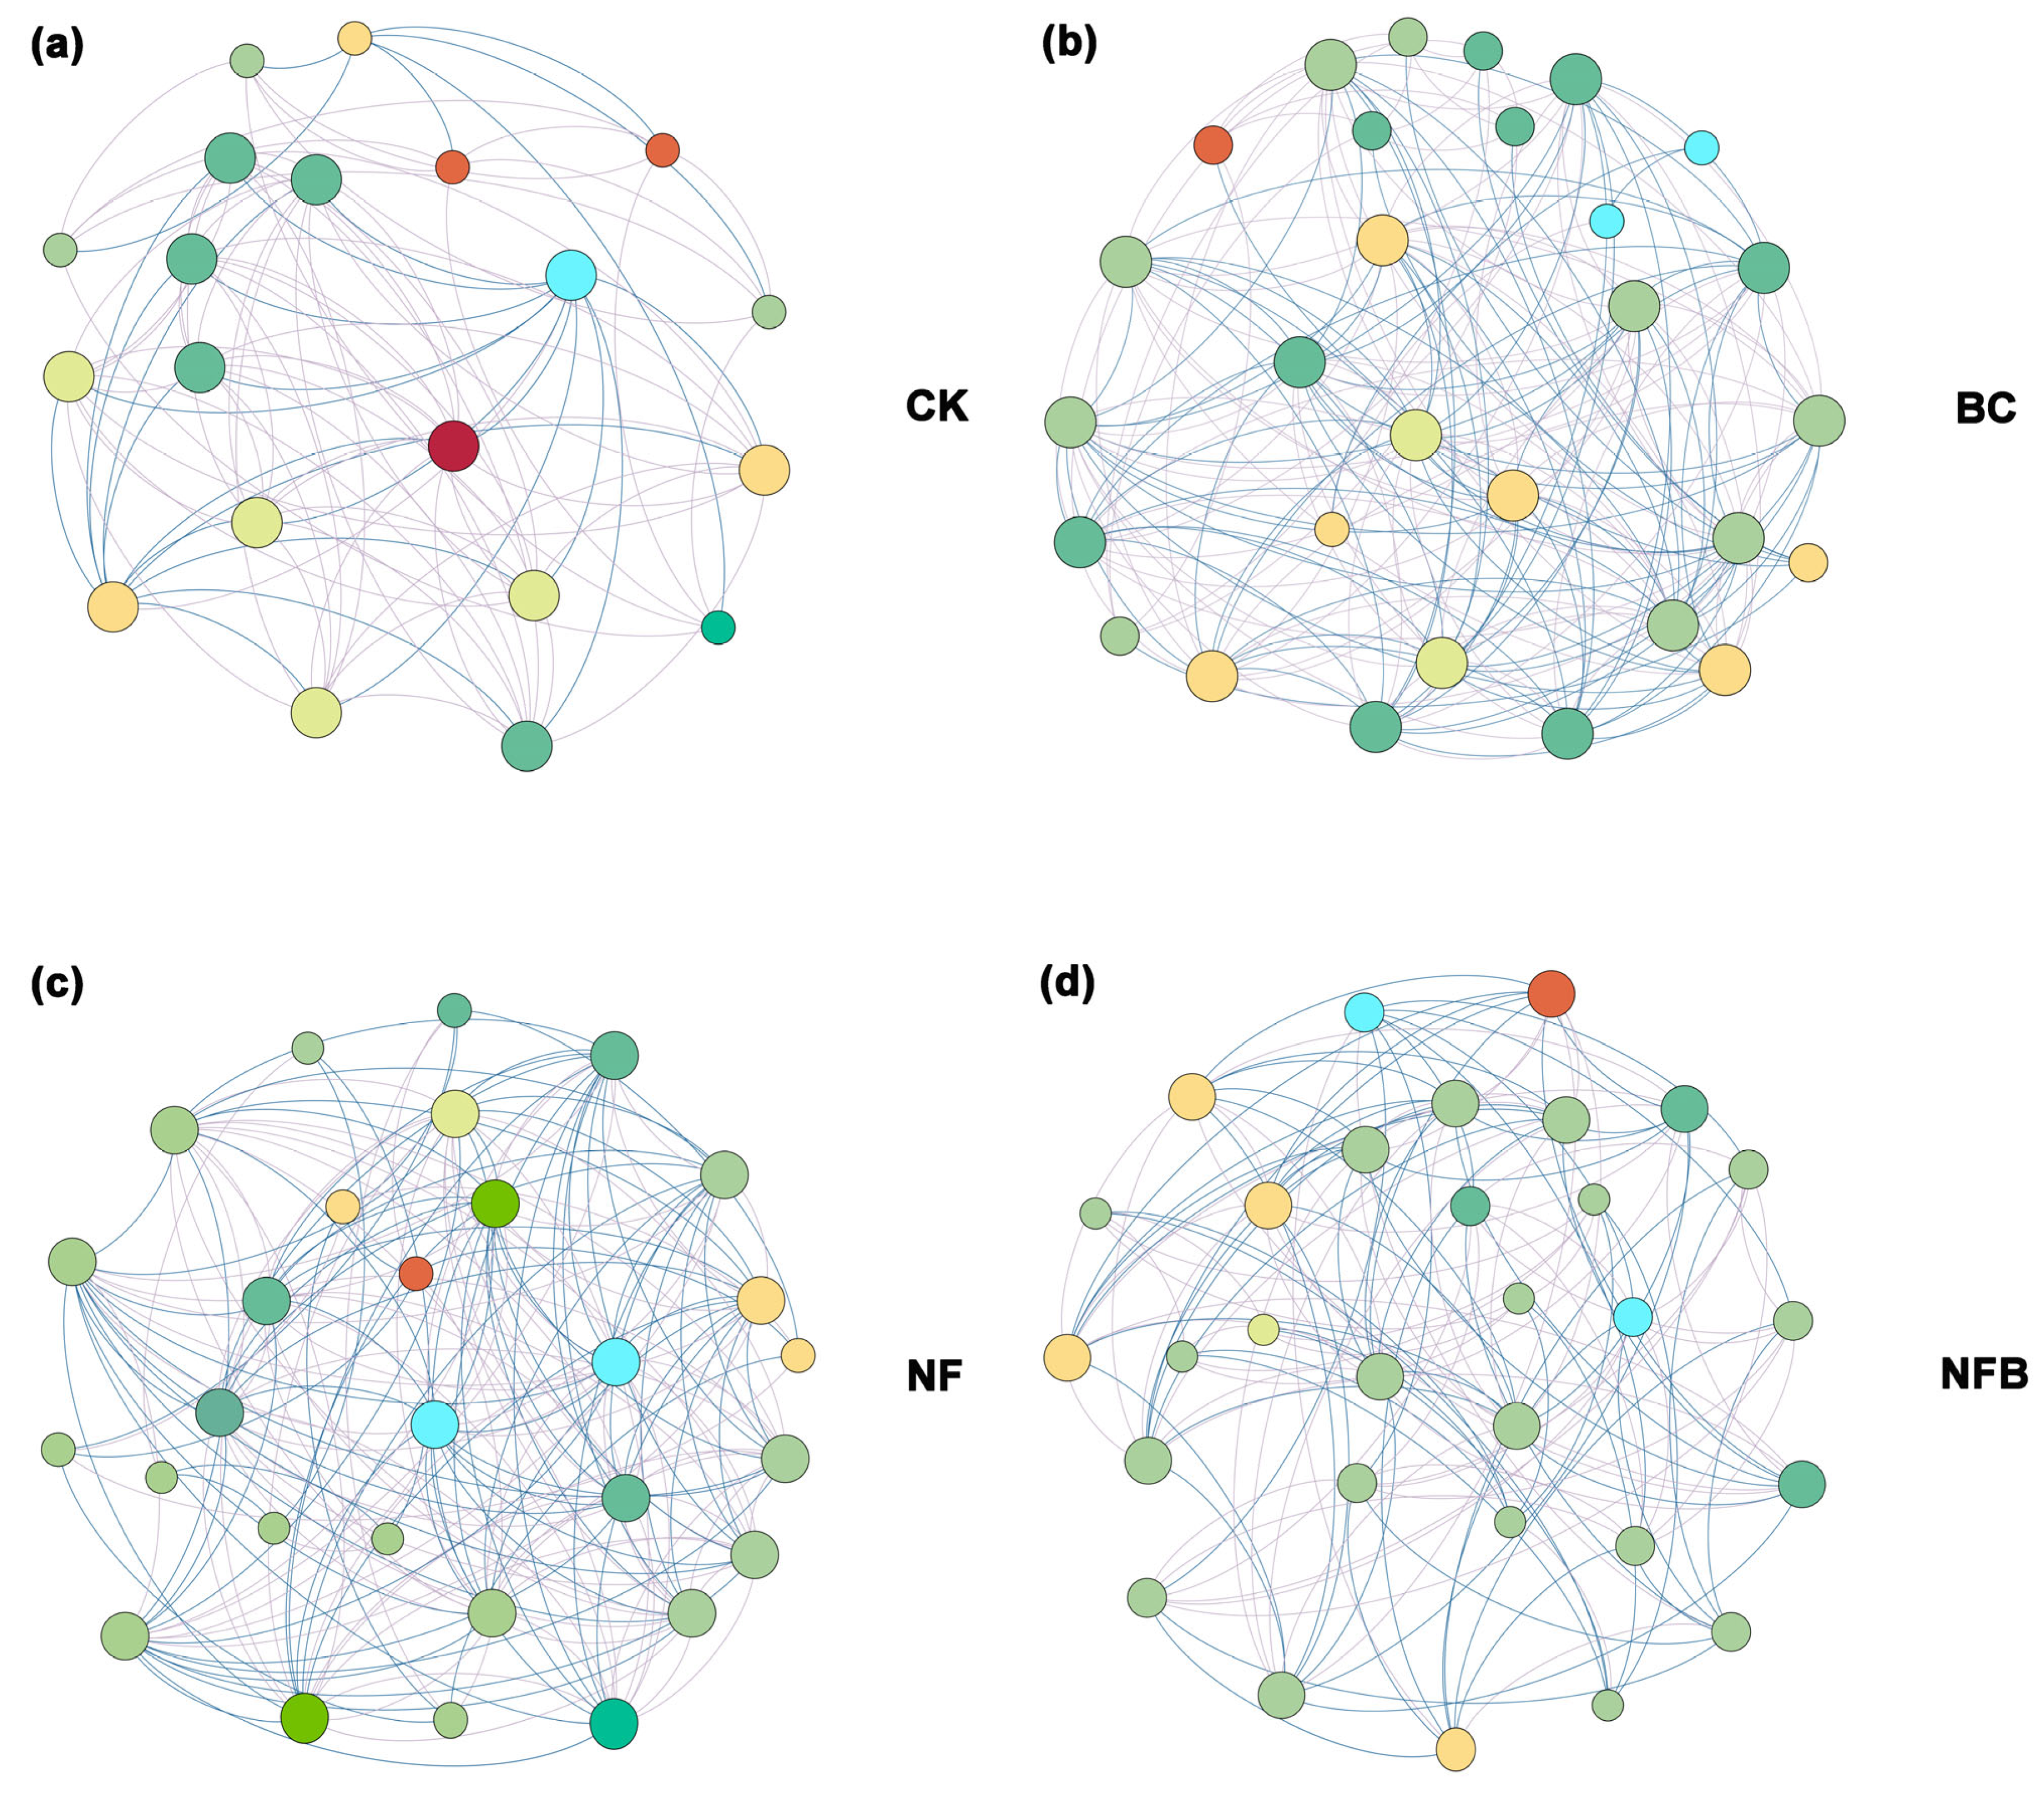
Co-occurrence networks were constructed to identify the co-occurrence patterns and putative keystone taxa of the soil bacterial community in the treatments and the control (Figure 3). The number of nodes, total edges, negative edges, and centralization betweenness in all treatments was apparently higher than those in the untreated network (Table S1). Also, the number of degrees, closeness, and betweenness of centrality in the biochar/fertilizer amended network were higher than those in the untreated network (Figure S1). Nine OTUs were assigned to phylum Proteobacteria, seven OTUs were assigned to Chloroflexi, four OTUs were assigned to Actinobacteria, three OTUs were assigned to Acidobacteria, and one OTU was assigned to Firmicutes, indicating that these bacterial phyla can be defined as putative keystone taxa in treatments and the control networks.
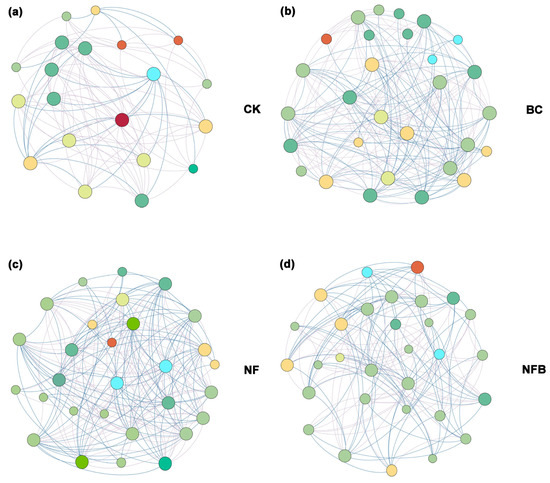
Figure 3.
Co-occurrence networks of microbe (CK: (a); BC: (b); NF: (c); NFC: (d)). The size of the connection points is proportional to the number of links. The line represents significant correlations with the absolute value of Spearman (r > 0.5, p < 0.05).
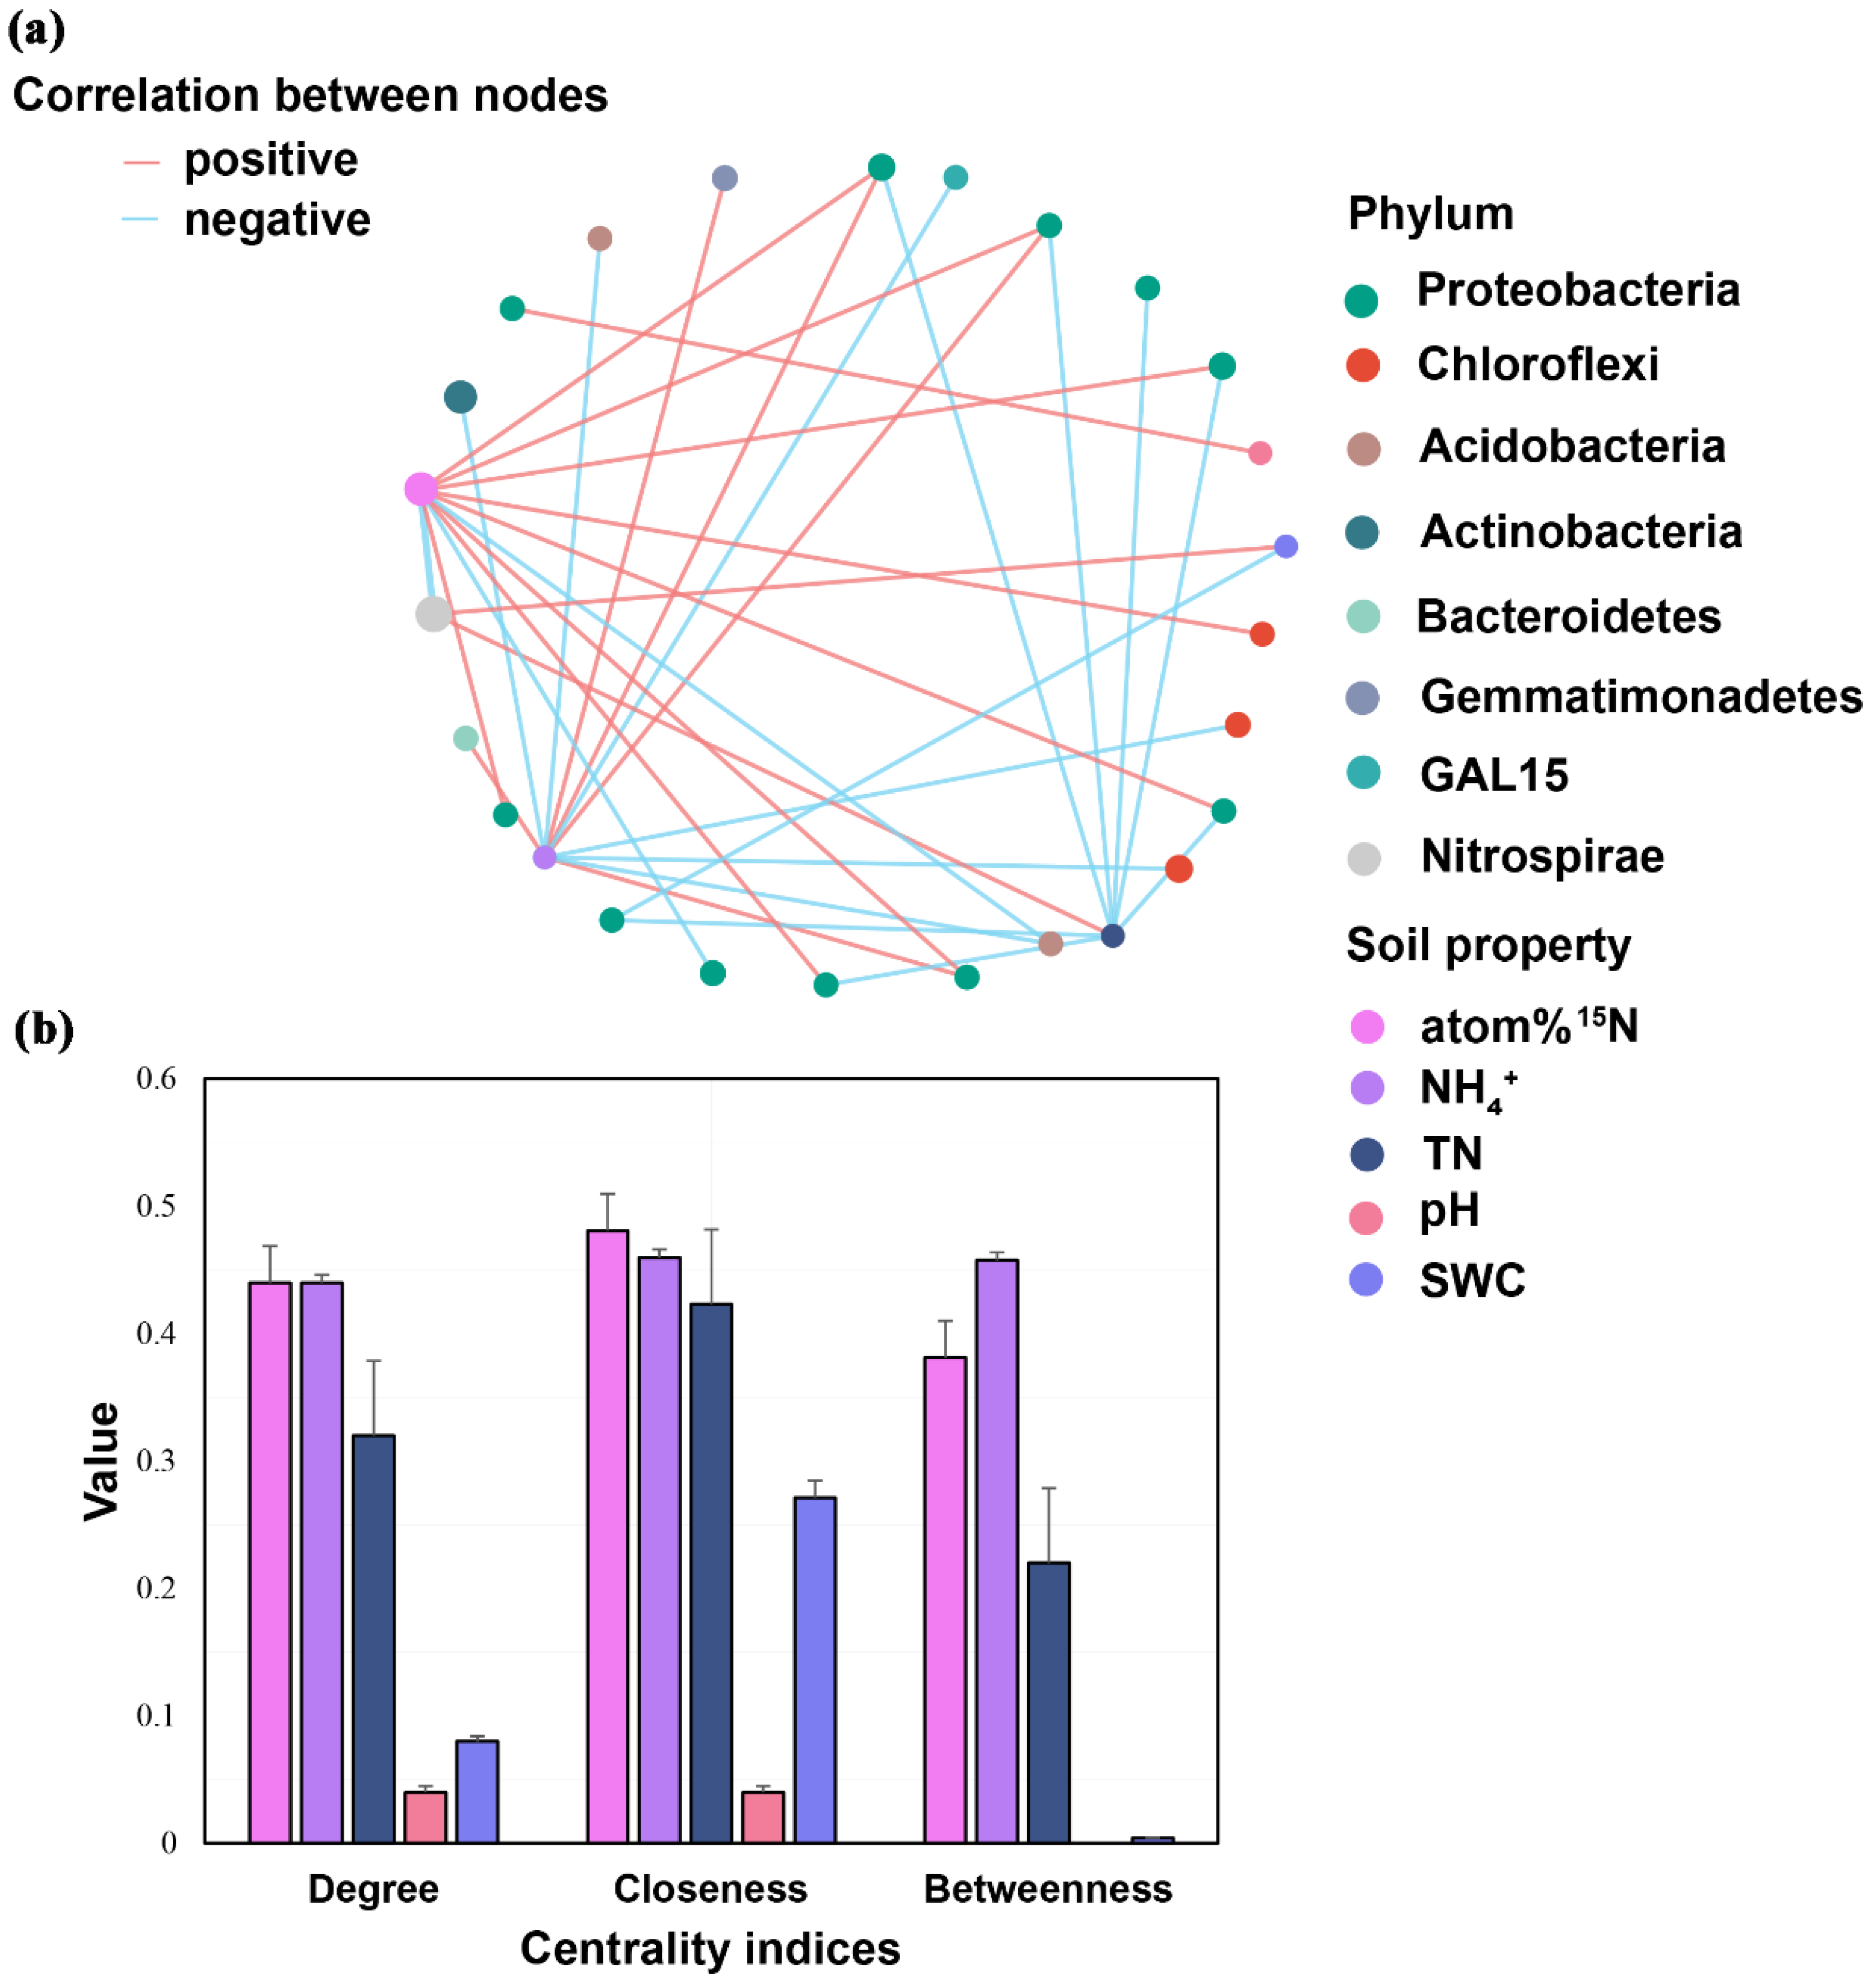
The correlations between the relative abundance of putative keystone taxa and soil properties were conducted (Figure 4a), and 16 positive and 17 negative correlations were observed. Interestingly, four keystone taxa assigned to Proteobacteria (1 and 3, respectively) under all treatments and the control were significantly and positively correlated with soil pH and NH4+, whereas eight keystone taxa assigned to Proteobacteria (1 and 7, respectively) negatively correlated with SWC and soil TN. Moreover, one keystone taxa assigned to Chloroflexi were significantly and positively correlated with soil 15N atom %, whereas two keystone taxa assigned to Chloroflexi negatively correlated with soil NH4+. One keystone taxa assigned to Gemmatimonadetes and Bacteroidetes, respectively, were significantly and positively correlated with soil NH4+, whereas two keystone taxa assigned to Acidobacteria and one keystone taxa assigned to Actinobacteria showed a negative correlation with soil NH4+. The Centrality Coefficient indices indicated that the correlations between soil atom 15N, soil NH4+, and putative keystone taxa in the network were higher than those in soil TN, pH, and SWC (Figure 4b).
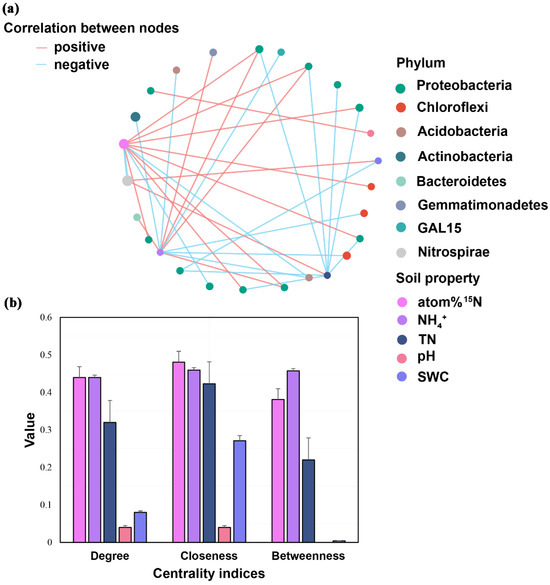
Figure 4.
Correlations between putative keystone species and soil properties (a) and the degree, closeness, and betweenness of centrality of each soil property shown in the table (b). The red and blue lines stand for significant positive and negative correlations, respectively. The thickness of each line is proportional to the Spearman’s correlation coefficients.
3.5. Multivariate Relationships between Inner Plant and Soil
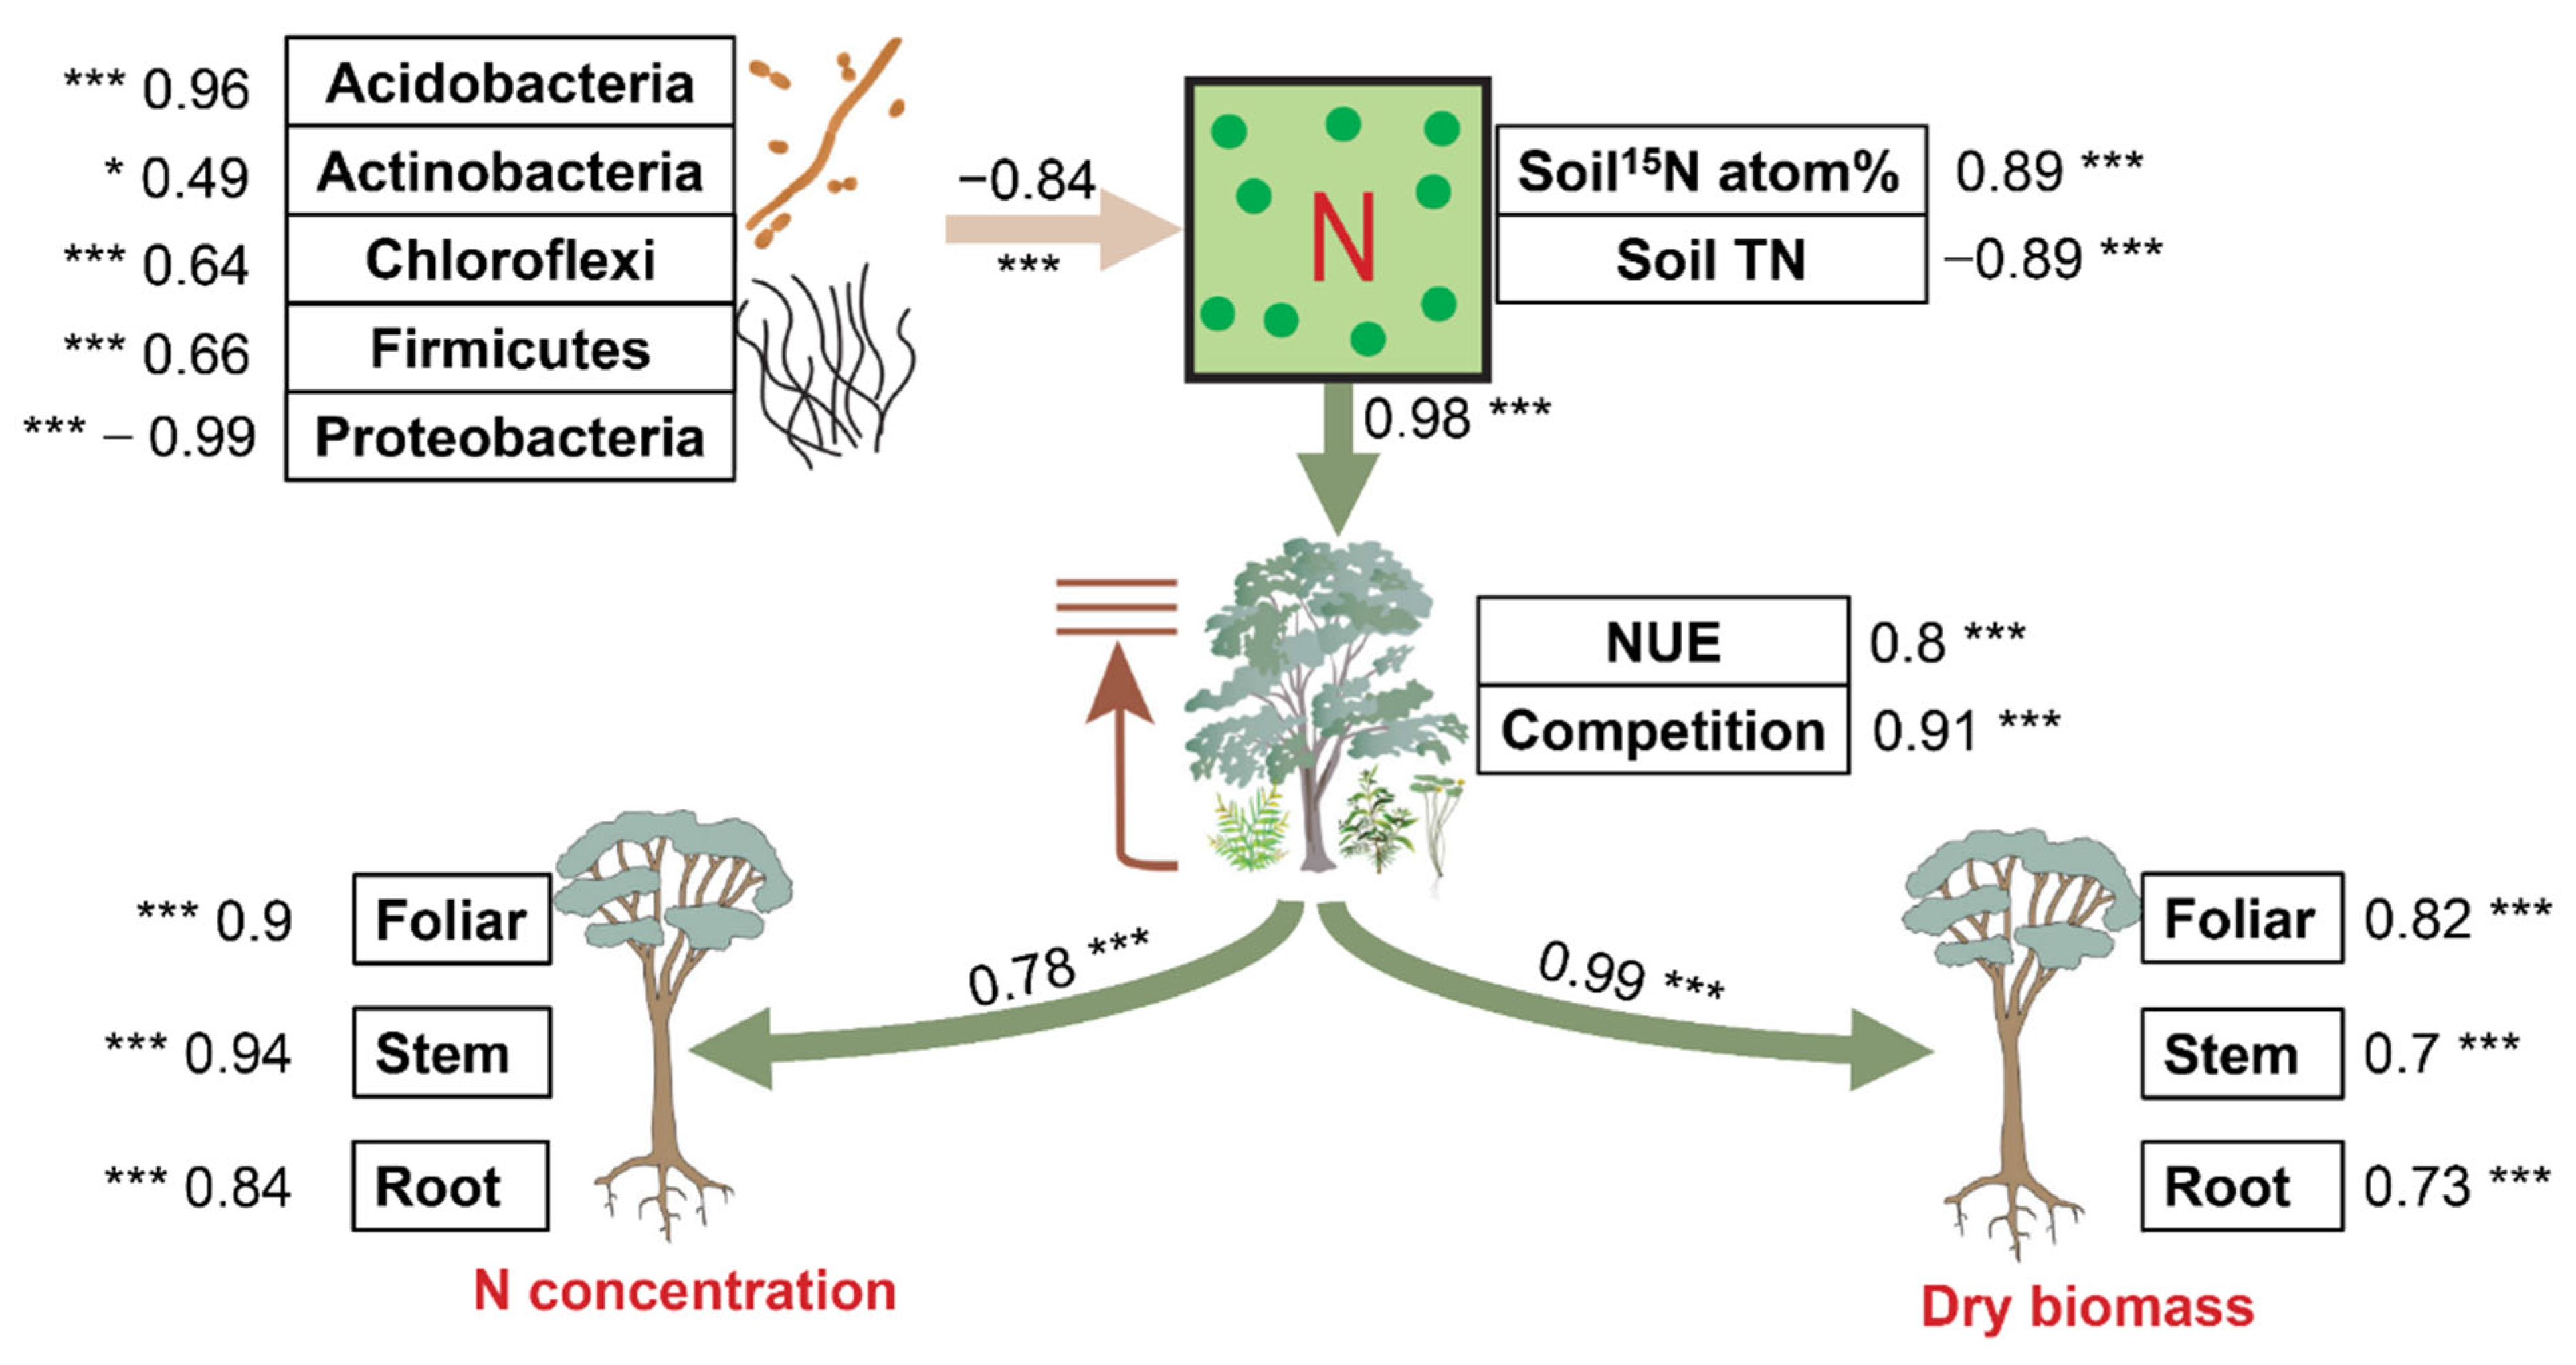
Structural equation modeling was performed to uncover the direct pathways by how soil factors impacted the variations in the effects of biochar and fertilizer on plant N and biomass (Figure 5). Soil bacterial keystone taxa, soil N accumulation, and plant N use collectively explained a large proportion of the variation in the effects of biochar and fertilizer on plant N and biomass (64% and 81%, respectively). Soil bacterial keystone taxa, including phylum Acidobacteria (std. coefficient = 0.96, p < 0.001), Actinobacteria (std. coefficient = 0.49, p < 0.05), Chloroflexi (std. coefficient = 0.64, p < 0.001), Firmicutes (std. coefficient = 0.66, p < 0.001), and Proteobacteria (std. coefficient = −0.96, p < 0.001), consistently exerted great significance and negative (std. coefficient = −0.84, p < 0.001) in regulating the responses of soil N to biochar and fertilizer treatments directly by shifting soil 15N atom % (std. coefficient = 0.89, p < 0.001), and soil TN (std. coefficient = −0.89, p < 0.001). Further, soil N accumulation exerted great significant effects (std. coefficient = 0.98, p < 0.001) on the response of plant NUE (std. coefficient = 0.8, p < 0.001) and the competition index (std. coefficient = 0.8, p < 0.001), with soil NH4+ and soil NO3− being insignificant. Plant NUE and competition index drove significant (std. coefficient = 0.78, p < 0.001) effects on the N content of eucalypt foliar (std. coefficient = 0.9, p < 0.001), stem (std. coefficient = 0.94, p < 0.001), and root (std. coefficient = 0.84, p < 0.001). This pattern (std. coefficient = 0.99, p < 0.001) also occurred in dry biomass of eucalypt foliar (std. coefficient = 0.82, p < 0.001), stem (std. coefficient = 0.7, p < 0.001), and root (std. coefficient = 0.73, p < 0.001).

Figure 5.
Pathways of soil and plant factors affecting the influence of the microbial keystone species in soils on plant N accumulation and dry biomass. Piecewise structural equation modeling accounted for the effects of bacterial composition, soil N supply, and plant N use on the responses of plant performance to biochar and fertilizer. Numbers adjacent to arrows are path coefficients that are the directly standardized effect size of the relationship. The thickness of each arrow represents the strength of the relationship. Yellow and green lines stand for significant negative and positive correlations. Relationships between residual variables of measured predictors are not shown. Significance levels of each predictor are indicated as * (p < 0.05), *** (p < 0.001). TN: total nitrogen; NUE: nitrogen use efficiency.
In general, Proteobacteria in soil bacterial keystone taxa significantly and positively derived direct and significant impacts by altering soil N accumulation and plant N use and competition on the plant N accumulation and growth.
4. Discussion
4.1. Plant and Soil Properties
This study investigated the effects of biochar and N fertilizer on plant and soil N availability, as well as soil bacterial keystone taxa important for plant performance of eucalypt. The decrease in SWC across all treatments in the present study contradicts other studies [34,35], resulting from the access to many small particles of biochar to soil colloids may block the connection path of soil interstices and reduce the soil porosity of coarse sands [36]. Moreover, N fertilizer application is known to increase foliar stomatal conductance and plant water use for photosynthesis, which, in turn, may influence soil water content [37]. The lack of a statistically significant effect of biochar alone on soil pH conflicts with the widespread assumption that biochar increases soil alkalinity [38]. Our results may be influenced both by the original soil alkalinity (pH = 8.34) and the characteristics of biochar [16,39]. Soil TN decreased with all treatments relative to the control; this may have occurred because biochar and fertilizer application may promote the absorption and use of soil N by plants (i.e., greater eucalypt plant foliage, stem, and root N in all treatments versus the control). Extractable soil NH4+ increased with biochar amendments shows the positive effects of biochar application on soil inorganic N retention [40] as a result of reduced loss of inorganic N in soils. Moreover, the significant negative effects of biochar and fertilizer on soil NO3− suggest that nitrate nitrogen has become the limiting factor for eucalypt nutrient supply one year after planting, although NH4+ is the preferred N form for eucalypt growth. This pattern is also supported by the contrary variation tendency between soil NH4+ and NO3− in our study.
The significant 15N enrichment increases in either the NF or NFB treatment agree with other studies, showing the effects of N fertilizer on increased plant N uptake [41]. Increased atom % 15N in plant foliage and roots may also reflect the influence of increased plant NUE (Figure 2c). The significant differences in the accumulation of N content in plant tissues were not only influenced by the application of biochar and N fertilizer but also by the growth stage of eucalypt. For example, it is important for plant foliage and roots to accumulate a significant amount of nutrients (especially N) for morphological development rather than the stem during the early stages of eucalypt growth [42]. Also, increased plant foliage, root, and stem TN may benefit from the sufficient soil N supply and the improved soil environment [43]. This finding aligns with the report that biochar and inorganic fertilizers increase plant N uptake, vigor, and production [44,45]. The decrease in forb TN suggested that N uptake for forbs may be suppressed by the significantly increased N competition between eucalypts and forbs. Remarkably, the lack of statistically significant effects of biochar on eucalypt NUE may be a result of the increases in soil nutrient retention following biochar amendment [46,47,48]. In contrast, the notable rise in foliar and stem NUE rather than root NUE observed in the fertilizer treatments agrees with other studies [31,49]; those studies indicated that aboveground N is more easily influenced by fertilizer than underground N. Moreover, the significant increases in the competition index in fertilizer treatments suggest that N fertilizer could contribute to nutrient absorption in eucalypts. However, the increased competition index may be due to the increased N-acquiring capacity of eucalypt, but the suppression of eucalypt to the growth of understory forbs through allelopathy may also occur [30]. Additional studies in future years will help elucidate the specific influence of fertilizer on the plant competition index.
4.2. Soil Microbial Diversity Indices and Composition
Soil compositional and structural diversity showed significantly contrasting responses between treatments and the control. The Shannon, ACE, and Chao indices of soil microbes responded positively to biochar and fertilizer treatments, while the Simpson index had a negative response. Increased soil microbial evenness and richness may result from potential soil NH4+ accumulation, which was archived in the BC and NFB treatments. This finding agrees with the report that biochar applications increase soil bacterial richness via inorganic nutrient input [24,50].
The greater positive associations between Proteobacteria and samples in biochar only and fertilizer only within the network suggest that biochar and fertilizer may increase the growth of phylum Proteobacteria through soil environmental regulation. As the most diverse and rapidly metabolized bacterial phyla and plant growth-promoting bacteria, Proteobacteria are closely related to the soil N supply and pyrogenic C metabolism [23,51]. The lack of greater positive associations between Chloroflexi and NFB may be a result of the sufficient nutrient supply by both biochar and fertilizer, which may lead to the suppression in the growth and reproduction of Chloroflexi bacteria [52]. Desiccation tolerance may have contributed to high dispersal rates in phylum Gemmatimonadetes [53], which is in line with the decreased SWC in all treatments in our study. In general, how biochar and fertilizer affect microbial diversity indices and composition likely depends strongly on the soil nutrient status, as the influence of soil nutrients on microbial growth is well known [54].
4.3. Influence of Biochar and Fertilizer on Relationships between Soil Putative Keystone Taxa and Soil Property
Our results showed that changes in the soil physicochemical properties (especially for soil atom % 15N and NH4+) were important for influencing putative keystone taxa in soil. The significant influence of soil atom % 15N on dominant soil bacteria in our study suggests that the application of fertilizer has the potential to regulate soil bacterial composition on the phylum level by changing the N content in soils. The positive correlations between Proteobacteria taxa and soil NH4+ suggest that soil NH4+ is the preferred inorganic N form for these selected bacterial phyla [55,56,57]. The negative correlations between Proteobacteria taxa and soil TN agree with other reports [2,58]. For example, the negative correlation between the relative abundance of Proteobacteria and soil TN indicates that biochar has the potential to improve soil nutrient availability through regulating phyla γ-Proteobacteria [58]. However, the negatively significant correlations between Actinobacteria, Acidobacteria, and soil NH4+ found in the present study disagree with other studies [59,60,61]. It is known that the metabolites of Actinobacteria have a significant effect on soil quality improvement, and Actinobacteria could be used as an indicator of soil quality potential [2]. Also, soil phylum Acidobacteria could contribute to improving soil fertility, especially for soil N [62,63,64]. This discrepancy may be explained by the longer-term influence of biochar on soil N availability. Repeated and long-term measurements will help elucidate these patterns.
Although biochar is known for its strong ability to increase soil inorganic N, it is essential to note that soil microbes have a selective preference for soil N form [44]. Our results show that NH4+ significantly influences soil putative keystone taxa, indicating that soil NH4+ drives the overall effects on soil bacterial community.
4.4. Pathways of How Microbes Influence Plant Performance
Variations in soil 15N atom % were negatively and directly influenced by the majority of soil putative keystone taxa in our study. It suggests that the growth and reproduction of soil bacterial taxa utilize soil available N and leads to a competition between soil microbes and plant N use and competition [52]. This pattern was certified by the indirect and negative correlation between soil putative keystone taxa and plant N use and competition (Figure 5). Moreover, the positive and direct correlations between soil 15N atom % and plant NUE competition index indicate that N fertilizer application could contribute greatly to the eucalypt N accumulation. The positive and direct correlations between plant NUE, competition index, plant N concentration, and dry biomass indicate that the growth and nutrient accumulation of eucalypt is more influenced by plant NUE and N competition between target crops and undesirable plants [31] than physicochemical properties of soil [27] and soil microbial diversity [26].
5. Conclusions
The present study sought to pursue a comprehensive assessment of the effects of biochar and N fertilizer on soil microbial diversity, plant N use and competition, and plant and soil N, thereby illustrating the variable outcomes that could result in plant performance. It was found that the effects of biochar on plant response variables were minimal, whereas plant and soil response variables were maximized by the application of biochar plus fertilizer. The decrease in the Simpson index between the control and treatments suggests that biochar and N fertilizer may decrease soil microbial dominance via sufficient inorganic N supply, even when there are no significant increases in soil NO3−. This type of effect would ultimately have a positive effect on the broader environment by maintaining a low Simpson index and sustaining ecological balance via moderate N fertilizer input. Results indicate that plant performance was best directly predicted by the soil Proteobacteria in soil keystone taxa, providing useful information on plant N and growth regulation.
Supplementary Materials
The following supporting information can be downloaded at: https://www.mdpi.com/article/10.3390/f15071091/s1, Table S1: Basic properties of biochar in our research. (Fixed C: fixed carbon; Olsen-P: Olsen available phosphorus; Avail K: available potassium); Table S2: Topological properties of bacterial networks under biochar and fertilizer applications; Table S3: Means (±standard errors, N = 8) for root, stem, foliar, and forb biomass measured in January, 2020. Treatment types include the control (CK, no biochar and no 15N-labeled fertilizer), BC (20 t hm−2 biochar), NF (8 g plant−1 15N-labeled fertilizer), and NFB (20.0 t hm−2 biochar plus 8.0 g plant−1 15N-labeled fertilizer). Differences in lowercase letters within columns indicate statistically significant differences among biochar treatments at α = 0.05 level; Figure S1: Location map of our research site in Nanning, Guangxi, China; Figure S2: The bacterial co-occurrence networks in soils for each treatment and the control (a), as well as the degree, closeness, and betweenness of Centrality, are shown (b). The top 32 species nodes and 4 sample nodes are selected for this network. The nodes are colored by different soil samples and the keystone taxa are represented in circles, modules with less than 4 members were excluded.
Author Contributions
Conceptualization, H.R.; methodology, H.R.; software, H.R.; validation, B.H., Z.W. and H.R.; formal analysis, H.R.; investigation, H.R.; resources, C.L.; data curation, H.R.; writing—original draft preparation, H.R.; writing—review and editing, H.R., Z.W. and F.Q.; visualization, C.L. and X.S.; supervision, H.R.; project administration, H.R.; funding acquisition, H.R. and F.Q. All authors have read and agreed to the published version of the manuscript.
Funding
This research was conducted with financial support from the National Natural Science Foundation of China (32201326), the National Natural Science Foundation of China (32101510), and the Basic and Applied Basic Research Foundation of Guangdong Province (2022A1515010413). The APC was funded by the National Natural Science Foundation of China (32201326).
Data Availability Statement
The data presented in this study are available on request from the corresponding author. The data are not publicly available due to privacy.
Acknowledgments
We thank Xuemeng Zhou for her guidance on 15N isotope measurement. We thank Kai Kang and Zhiwei Peng for their assistance with soil and plant sample collections. Furthermore, we are grateful to Kunfang Cao and Jessica R. Miesel for their guidance and mentoring of H.R.
Conflicts of Interest
The authors declare that they have no known competing financial interests or personal relationships that could have appeared to influence the work reported in this paper.
References
- Nielsen, P.L.; Andresen, L.C.; Michelsen, A.; Schmidt, I.K.; Kongstad, J. Seasonal Variations and Effects of Nutrient Applications on N and P and Microbial Biomass under Two Temperate Heathland Plants. Appl. Soil Ecol. 2009, 42, 279–287. [Google Scholar] [CrossRef]
- Liu, G.; Bai, Z.; Shah, F.; Cui, G.; Xiao, Z.; Gong, H.; Li, D.; Lin, Y.; Li, B.; Ji, G.; et al. Compositional and Structural Changes in Soil Microbial Communities in Response to Straw Mulching and Plant Revegetation in an Abandoned Artificial Pasture in Northeast China. Glob. Ecol. Conserv. 2021, 31, e01871. [Google Scholar] [CrossRef]
- Feng, M.; Adams, J.M.; Fan, K.; Shi, Y.; Sun, R.; Wang, D.; Guo, X.; Chu, H. Long-Term Fertilization Influences Community Assembly Processes of Soil Diazotrophs. Soil Biol. Biochem. 2018, 126, 151–158. [Google Scholar] [CrossRef]
- Zhang, X.; Dong, W.; Dai, X.; Schaeffer, S.; Yang, F.; Radosevich, M.; Xu, L.; Liu, X.; Sun, X. Responses of Absolute and Specific Soil Enzyme Activities to Long Term Additions of Organic and Mineral Fertilizer. Sci. Total Environ. 2015, 536, 59–67. [Google Scholar] [CrossRef]
- Peter, M. Ectomycorrhizal Fungi—Fairy Rings and the Wood-Wide Web. New Phytol. 2006, 171, 685–687. [Google Scholar] [CrossRef]
- Dodor, D.E.; Tabatabai, M.A. Arylamidase Activity as an Index of Nitrogen Mineralization in Soils. Commun. Soil Sci. Plant Anal. 2007, 38, 2197–2207. [Google Scholar] [CrossRef]
- Kolton, M.; Graber, E.R.; Tsehansky, L.; Elad, Y.; Cytryn, E. Biochar-Stimulated Plant Performance Is Strongly Linked to Microbial Diversity and Metabolic Potential in the Rhizosphere. New Phytol. 2017, 213, 1393–1404. [Google Scholar] [CrossRef]
- Oguntunde, P.G.; Fosu, M.; Ajayi, A.E.; Van De Giesen, N. De Effects of Charcoal Production on Maize Yield, Chemical Properties and Texture of Soil. Biol. Fertil. Soils 2004, 39, 295–299. [Google Scholar] [CrossRef]
- Chan, K.Y.; Van Zwieten, L.; Meszaros, I.; Downie, A.; Joseph, S. Agronomic Values of Greenwaste Biochar as a Soil Amendment. Aust. J. Soil Res. 2007, 45, 629–634. [Google Scholar] [CrossRef]
- Glaser, B.; Haumaier, L.; Guggenberger, G.; Zech, W. The “Terra Preta” Phenomenon: A Model for Sustainable Agriculture in the Humid Tropics. Naturwissenschaften 2001, 88, 37–41. [Google Scholar] [CrossRef]
- Pereira, E.I.P.; Suddick, E.C.; Mansour, I.; Mukome, F.N.D.; Parikh, S.J.; Scow, K.; Six, J. Biochar Alters Nitrogen Transformations but Has Minimal Effects on Nitrous Oxide Emissions in an Organically Managed Lettuce Mesocosm. Biol. Fertil. Soils 2015, 51, 573–582. [Google Scholar] [CrossRef]
- Chan, K.Y.; Van Zwieten, L.; Meszaros, I.; Downie, A.; Joseph, S. Using Poultry Litter Biochars as Soil Amendments. Aust. J. Soil Res. 2008, 46, 437–444. [Google Scholar] [CrossRef]
- Mia, S.; Dijkstra, F.A.; Singh, B. Enhanced Biological Nitrogen Fixation and Competitive Advantage of Legumes in Mixed Pastures Diminish with Biochar Aging. Plant Soil 2018, 424, 639–651. [Google Scholar] [CrossRef]
- Lehmann, J.; Rillig, M.C.; Thies, J.; Masiello, C.A.; Hockaday, W.C.; Crowley, D. Biochar Effects on Soil Biota—A Review. Soil Biol. Biochem. 2011, 43, 1812–1836. [Google Scholar] [CrossRef]
- Seneviratne, M.; Weerasundara, L.; Ok, Y.S.; Rinklebe, J.J.; Vithanage, M. Phytotoxicity Attenuation in Vigna Radiata under Heavy Metal Stress at the Presence of Biochar and N Fixing Bacteria. J. Environ. Manag. 2016, 186, 293–300. [Google Scholar] [CrossRef] [PubMed]
- Ennis, C.J.; Evans, A.G.; Islam, M.; Ralebitso-Senior, T.K.; Senior, E. Biochar: Carbon Sequestration, Land Remediation, and Impacts on Soil Microbiology. Crit. Rev. Environ. Sci. Technol. 2012, 42, 2311–2364. [Google Scholar] [CrossRef]
- Rutigliano, F.A.; Romano, M.; Marzaioli, R.; Baglivo, I.; Baronti, S.; Miglietta, F.; Castaldi, S. Effect of Biochar Addition on Soil Microbial Community in a Wheat Crop. Eur. J. Soil Biol. 2014, 60, 9–15. [Google Scholar] [CrossRef]
- Halmi, M.F.A.; Simarani, K. Effect of Two Contrasting Biochars on Soil Microbiota in the Humid Tropics of Peninsular Malaysia. Geoderma 2021, 395, 115088. [Google Scholar] [CrossRef]
- Hu, L.; Cao, L.; Zhang, R. Bacterial and Fungal Taxon Changes in Soil Microbial Community Composition Induced by Short-Term Biochar Amendment in Red Oxidized Loam Soil. World J. Microbiol. Biotechnol. 2014, 30, 1085–1092. [Google Scholar] [CrossRef]
- Warnock, D.D.; Lehmann, J.; Kuyper, T.W.; Rillig, M.C. Mycorrhizal Responses to Biochar in Soil—Concepts and Mechanisms. Plant Soil 2007, 300, 9–20. [Google Scholar] [CrossRef]
- Gai, X.; Liu, H.; Zhai, L.; Wang, H. Effects of Corn-Stalk Biochar on Inorganic Nitrogen Leaching from Soil. J. Agro-Environ. Sci. 2015, 34, 310–318. [Google Scholar] [CrossRef]
- Yue, F.X.; Li, J.W.; Wang, Y.F.; Shi, Z.Y.; Liu, L. Mechanism of the Improvement Effect by Biochar and AM Fungi on the Availability of Soil Nutrients in Coal Mining Area. J. Plant Nutr. Fertil. 2019, 25, 1325–1334. [Google Scholar] [CrossRef]
- Khodadad, C.L.M.M.; Zimmerman, A.R.; Green, S.J.; Uthandi, S.; Foster, J.S. Taxa-Specific Changes in Soil Microbial Community Composition Induced by Pyrogenic Carbon Amendments. Soil Biol. Biochem. 2011, 43, 385–392. [Google Scholar] [CrossRef]
- Zhou, X.; Chen, Z.; Li, Z.; Wu, H. Impacts of Aeration and Biochar Addition on Extracellular Polymeric Substances and Microbial Communities in Constructed Wetlands for Low C/N Wastewater Treatment: Implications for Clogging. Chem. Eng. J. 2020, 396, 125349. [Google Scholar] [CrossRef]
- Zhao, B.C.; Xu, J.D.; Chen, B.Y.; Cao, X.F.; Yuan, T.Q.; Wang, S.F.; Charlton, A.; Sun, R.C. Selective Precipitation and Characterization of Lignin–Carbohydrate Complexes (LCCs) from Eucalyptus. Planta 2018, 247, 1077–1087. [Google Scholar] [CrossRef] [PubMed]
- Li, C.; Shi, L.L.; Ostermann, A.; Xu, J.; Li, Y.; Mortimer, P.E. Indigenous Trees Restore Soil Microbial Biomass at Faster Rates than Exotic Species. Plant Soil 2015, 396, 151–161. [Google Scholar] [CrossRef]
- Castro-Díez, P.; Alonso, Á.; Saldaña-López, A.; Granda, E. Effects of Widespread Non-Native Trees on Regulating Ecosystem Services. Sci. Total Environ. 2021, 778, 146141. [Google Scholar] [CrossRef]
- Harmand, J.M.; Njiti, C.F.; Bernhard-Reversat, F.; Puig, H. Aboveground and Belowground Biomass, Productivity and Nutrient Accumulation in Tree Improved Fallows in the Dry Tropics of Cameroon. For. Ecol. Manag. 2004, 188, 249–265. [Google Scholar] [CrossRef]
- Lynch, H.B.; Epps, K.Y.; Fukami, T.; Vitousek, P.M. Introduced Canopy Tree Species Effect on the Soil Microbial Community in a Montane Tropical Forest. Pac. Sci. 2012, 66, 141–150. [Google Scholar] [CrossRef]
- Song, Q.; Qin, F.; He, H.; Wang, H.; Yu, S. Allelopathic Potential of Rain Leachates from Eucalyptus urophylla on Four Tree Species. Agrofor. Syst. 2019, 93, 1307–1318. [Google Scholar] [CrossRef]
- Yao, X.; Li, Y.; Liao, L.; Sun, G.; Wang, H.; Ye, S. Enhancement of Nutrient Absorption and Interspecific Nitrogen Transfer in a Eucalyptus urophylla × eucalyptus grandis and Dalbergia odorifera Mixed Plantation. For. Ecol. Manag. 2019, 449, 117465. [Google Scholar] [CrossRef]
- Ren, H.; Huang, B.; Fernández-garcía, V.; Miesel, J.; Yan, L. Biochar and Rhizobacteria Amendments Improve Several Soil Properties. Microorganisms 2020, 8, 502. [Google Scholar] [CrossRef] [PubMed]
- Rosseel, Y. Lavaan: An R package for structural equation modeling and more. J. Stat. Software 2012, 48, 1–36. [Google Scholar] [CrossRef]
- Agegnehu, G.; Bass, A.M.; Nelson, P.N.; Muirhead, B.; Wright, G.; Bird, M.I. Biochar and Biochar-Compost as Soil Amendments: Effects on Peanut Yield, Soil Properties and Greenhouse Gas Emissions in Tropical North Queensland, Australia. Agric. Ecosyst. Environ. 2015, 213, 72–85. [Google Scholar] [CrossRef]
- Masulili, A.; Utomo, W.H.; MS, S. Rice Husk Biochar for Rice Based Cropping System in Acid Soil 1. The Characteristics of Rice Husk Biochar and Its Influence on the Properties of Acid Sulfate Soils and Rice Growth in West Kalimantan, Indonesia. J. Agric. Sci. 2014, 2, 39–47. [Google Scholar] [CrossRef]
- Jeffery, S.; Verheijen, F.G.A.; van der Velde, M.; Bastos, A.C. A Quantitative Review of the Effects of Biochar Application to Soils on Crop Productivity Using Meta-Analysis. Agric. Ecosyst. Environ. 2011, 144, 175–187. [Google Scholar] [CrossRef]
- Agegnehu, G.; Bass, A.M.; Nelson, P.N.; Bird, M.I. Benefits of Biochar, Compost and Biochar-Compost for Soil Quality, Maize Yield and Greenhouse Gas Emissions in a Tropical Agricultural Soil. Sci. Total Environ. 2016, 543, 295–306. [Google Scholar] [CrossRef]
- Crombie, K.; Mašek, O.; Cross, A.; Sohi, S. Biochar—Synergies and Trade-Offs between Soil Enhancing Properties and C Sequestration Potential. GCB Bioenergy 2015, 7, 1161–1175. [Google Scholar] [CrossRef]
- Hossain, M.Z.; Bahar, M.M.; Sarkar, B.; Donne, S.W.; Ok, Y.S.; Palansooriya, K.N.; Kirkham, M.B.; Chowdhury, S.; Bolan, N. Biochar and Its Importance on Nutrient Dynamics in Soil and Plant; Springer: Singapore, 2020; Volume 2, ISBN 0123456789. [Google Scholar]
- Ren, H.; Warnock, D.D.; Tiemann, L.K.; Quigley, K.; Miesel, J.R. Evaluating Foliar Characteristics as Early Indicators of Plant Response to Biochar Amendments. For. Ecol. Manag. 2021, 489, 119047. [Google Scholar] [CrossRef]
- Chu, G.X.; Shen, Q.R.; Cao, J.L. Nitrogen Fixation and N Transfer from Peanut to Rice Cultivated in Aerobic Soil in an Intercropping System and Its Effect on Soil N Fertility. Plant Soil 2004, 263, 17–27. [Google Scholar] [CrossRef]
- Heidari, A.; Watkins, D.; Mayer, A.; Propato, T.; Verón, S.; de Abelleyra, D. Spatially Variable Hydrologic Impact and Biomass Production Tradeoffs Associated with Eucalyptus (E. grandis) Cultivation for Biofuel Production in Entre Rios, Argentina. GCB Bioenergy 2021, 13, 823–837. [Google Scholar] [CrossRef]
- Wang, W.; Wu, Z.; He, Y.; Huang, Y.; Li, X.; Ye, B.C. Plant Growth Promotion and Alleviation of Salinity Stress in Capsicum annuum L. by Bacillus Isolated from Saline Soil in Xinjiang. Ecotoxicol. Environ. Saf. 2018, 164, 520–529. [Google Scholar] [CrossRef] [PubMed]
- Butphu, S.; Rasche, F.; Cadisch, G.; Kaewpradit, W. Eucalyptus Biochar Application Enhances Ca Uptake of Upland Rice, Soil Available P, Exchangeable K, Yield, and N Use Efficiency of Sugarcane in a Crop Rotation System. J. Plant Nutr. Soil Sci. 2020, 183, 58–68. [Google Scholar] [CrossRef]
- Venancio, W.S.; Gomes, J.M.; Nakatani, A.S.; Hungria, M.; Araujo, R.S. Lettuce Production under Reduced Levels of N-Fertilizer in the Presence of Plant Growth-Promoting Bacillus Spp. Bacteria. J. Pure Appl. Microbiol. 2019, 13, 1941–1952. [Google Scholar] [CrossRef]
- Nguyen, T.T.N.; Xu, C.Y.; Tahmasbian, I.; Che, R.; Xu, Z.; Zhou, X.; Wallace, H.M.; Bai, S.H. Effects of Biochar on Soil Available Inorganic Nitrogen: A Review and Meta-Analysis. Geoderma 2017, 288, 79–96. [Google Scholar] [CrossRef]
- Sun, Z.; Sänger, A.; Rebensburg, P.; Lentzsch, P.; Wirth, S.; Kaupenjohann, M.; Meyer-Aurich, A. Contrasting Effects of Biochar on N2O Emission and N Uptake at Different N Fertilizer Levels on a Temperate Sandy Loam. Sci. Total Environ. 2017, 578, 557–565. [Google Scholar] [CrossRef] [PubMed]
- Saarnio, S.; Heimonen, K.; Kettunen, R. Biochar Addition Indirectly Affects N2O Emissions via Soil Moisture and Plant N Uptake. Soil Biol. Biochem. 2013, 58, 99–106. [Google Scholar] [CrossRef]
- Lin, Y.; Ye, G.; Liu, D.; Ledgard, S.; Luo, J.; Fan, J.; Yuan, J.; Chen, Z.; Ding, W. Long-Term Application of Lime or Pig Manure Rather than Plant Residues Suppressed Diazotroph Abundance and Diversity and Altered Community Structure in an Acidic Ultisol. Soil Biol. Biochem. 2018, 123, 218–228. [Google Scholar] [CrossRef]
- Gałazka, A.; Jończyk, K.; Gawryjołek, K.; Ciepiel, J. The Impact of Biochar Doses on Soil Quality and Microbial Functional Diversity. BioResources 2019, 14, 7852–7868. [Google Scholar] [CrossRef]
- Deslippe, J.R.; Hartmann, M.; Simard, S.W.; Mohn, W.W. Long-Term Warming Alters the Composition of Arctic Soil Microbial Communities. FEMS Microbiol. Ecol. 2012, 82, 303–315. [Google Scholar] [CrossRef]
- Pathan, S.I.; Větrovský, T.; Giagnoni, L.; Datta, R.; Baldrian, P.; Nannipieri, P.; Renella, G. Microbial Expression Profiles in the Rhizosphere of Two Maize Lines Differing in N Use Efficiency. Plant Soil 2018, 433, 401–413. [Google Scholar] [CrossRef]
- DeBruyn, J.M.; Nixon, L.T.; Fawaz, M.N.; Johnson, A.M.; Radosevich, M. Global Biogeography and Quantitative Seasonal Dynamics of Gemmatimonadetes in Soil. Appl. Environ. Microbiol. 2011, 77, 6295–6300. [Google Scholar] [CrossRef] [PubMed]
- Huang, Y.; Yang, X.; Zhang, D.; Zhang, J. The Effects of Gap Size and Litter Species on Colonization of Soil Fauna during Litter Decomposition in Pinus massoniana Plantations. Appl. Soil Ecol. 2020, 155, 103611. [Google Scholar] [CrossRef]
- Guo, W.; Andersen, M.N.; Qi, X.-B.; Li, P.; Li, Z.-Y.; Fan, X.-Y.; Zhou, Y. Effects of Reclaimed Water Irrigation and Nitrogen Fertilization on the Chemical Properties and Microbial Community of Soil. J. Integr. Agric. 2017, 16, 679–690. [Google Scholar] [CrossRef]
- Bonato, P.; Alves, L.R.; Osaki, J.H.; Rigo, L.U.; Pedrosa, F.O.; Souza, E.M.; Zhang, N.; Schumacher, J.; Buck, M.; Wassem, R.; et al. The NtrY–NtrX Two-Component System Is Involved in Controlling Nitrate Assimilation in Herbaspirillum seropedicae Strain SmR1. FEBS J. 2016, 283, 3919–3930. [Google Scholar] [CrossRef] [PubMed]
- He, W.; Liu, S.; Jiang, Z.; Zheng, J.; Li, X.; Zhang, D. The Diversity and Nitrogen Metabolism of Culturable Nitrate-Utilizing Bacteria Within the Oxygen Minimum Zone of the Changjiang (Yangtze River) Estuary. Front. Mar. Sci. 2021, 8, 720413. [Google Scholar] [CrossRef]
- Jiao, L.; Wu, J.; He, X.; Wen, X.; Li, Y.; Hong, Y. Significant Microbial Nitrogen Loss from Denitrification and Anammox in the Land-Sea Interface of Low Permeable Sediments. Int. Biodeterior. Biodegrad. 2018, 135, 80–89. [Google Scholar] [CrossRef]
- Chen, W.; Gao, Y.; Yang, J.; Fan, F.; Zhang, W.; Li, J.; Zhou, C.; Shi, G.; Tong, F.; Fan, G. Taxonomical and Functional Bacterial Community Selection in the Rhizosphere of the Rice Genotypes with Different Nitrogen Use Efficiencies. Plant Soil 2022, 470, 111–125. [Google Scholar] [CrossRef]
- Liu, C.; Dong, Y.; Hou, L.; Deng, N.; Jiao, R. Acidobacteria Community Responses to Nitrogen Dose and Form in Chinese Fir Plantations in Southern China. Curr. Microbiol. 2017, 74, 396–403. [Google Scholar] [CrossRef] [PubMed]
- Gtari, M.; Ghodhbane-Gtari, F.; Nouioui, I.; Beauchemin, N.; Tisa, L.S. Phylogenetic Perspectives of Nitrogen-Fixing Actinobacteria. Arch. Microbiol. 2012, 194, 3–11. [Google Scholar] [CrossRef]
- Fierer, N.; Leff, J.W.; Adams, B.J.; Nielsen, U.N.; Bates, S.T.; Lauber, C.L.; Owens, S.; Gilbert, J.A.; Wall, D.H.; Caporaso, J.G. Cross-Biome Metagenomic Analyses of Soil Microbial Communities and Their Functional Attributes. Proc. Natl. Acad. Sci. USA 2012, 109, 21390–21395. [Google Scholar] [CrossRef] [PubMed]
- Nemergut, D.R.; Cleveland, C.C.; Wieder, W.R.; Washenberger, C.L.; Townsend, A.R. Plot-Scale Manipulations of Organic Matter Inputs to Soils Correlate with Shifts in Microbial Community Composition in a Lowland Tropical Rain Forest. Soil Biol. Biochem. 2010, 42, 2153–2160. [Google Scholar] [CrossRef]
- Dean, S.L.; Farrer, E.C.; Porras-Alfaro, A.; Suding, K.N.; Sinsabaugh, R.L. Assembly of Root-Associated Bacteria Communities: Interactions between Abiotic and Biotic Factors. Environ. Microbiol. Rep. 2015, 7, 102–110. [Google Scholar] [CrossRef] [PubMed]


Disclaimer/Publisher’s Note: The statements, opinions and data contained in all publications are solely those of the individual author(s) and contributor(s) and not of MDPI and/or the editor(s). MDPI and/or the editor(s) disclaim responsibility for any injury to people or property resulting from any ideas, methods, instructions or products referred to in the content. |
© 2024 by the authors. Licensee MDPI, Basel, Switzerland. This article is an open access article distributed under the terms and conditions of the Creative Commons Attribution (CC BY) license (https://creativecommons.org/licenses/by/4.0/).