Article

Spatial–Temporal Dynamics of a Germinable Seed Bank of a Semi-Arid Vegetation in the Brazilian Northeast

by
Danielle Melo dos Santos
1,
Kleber Andrade da Silva
2,*,
Simone Rabelo da Cunha
2,
Bruno Ayron de Souza Aguiar
1,
Priscila Silva dos Santos
1,
Vanessa Kelly Rodrigues de Araujo
1,
Josiene Maria Falcão Fraga dos Santos
3 and
Elcida de Lima Araújo
1,2
1
Área Botânica, Departamento de Biologia, Universidade Federal Rural de Pernambuco, Dois Irmãos, Recife 52171-900, Brazil
2
Centro Acadêmico de Vitória, Universidade Federal de Pernambuco, Rua do Alto do Reservatório s/n, Bela Vista CEP, Vitória de Santo Antão 55608-680, Brazil
3
Departamento de Biologia, Universidade Estadual de Alagoas, Palmeira do Índios 57076-100, Brazil
*
Author to whom correspondence should be addressed.
Forests 2024, 15(7), 1108; https://doi.org/10.3390/f15071108
Submission received: 23 May 2024 / Revised: 19 June 2024 / Accepted: 25 June 2024 / Published: 27 June 2024
(This article belongs to the Special Issue Topicalities in Forest Ecology of Seeds, 2nd Edition)

Abstract

:
Soil seed bank contributes to the maintenance and renewal of the plant community. Species richness and density of the soil seed bank are affected by the temporal and spatial variations occurring in dry environments. Thus, this study aimed to characterize the effect of time (climatic season and annual precipitation) and space (soil depth and microhabitat type) on floristic composition, species richness, and seed density in the soil bank from a Brazilian dry forest over seven consecutive years. During the study period, 0–5 cm soil samples were collected in three types of microhabitats (Flat, Rocky, and Riverside) from the litter and soil, totaling 2940 samples. The seed bank was quantified using the seedling emergence method; each collected sample was monitored for six months. All data on species richness and seedling emergence were analyzed using the GLM and Anosim test for floristic composition. Results show that the floristic composition, species richness, and seed density differ between climatic seasons, between years of study, between soil depths, and between the three types of microhabitats found in the studied area. However, the explanatory power of each variable was low, demonstrating that other variables such as temperature, wind action, and predation may also be influencing seed storage in the soil bank. In summary, this study demonstrated that the richness, species composition, and emergence of seedlings recorded in soil seed banks are influenced by the spatiotemporal variation found in dry environments. Thus, all the tested variables partially explained the behavior observed in the seed bank.

1. Introduction

The seed banks of dry environments contribute to the maintenance and renewal of the native plant populations [1,2]. It assures the survival of certain species that may not be established in the vegetation through the storage of seeds [3]. Species richness and seed density found in the soil bank vary according to the time and spatial differences found in this vegetation [4,5,6,7].
Annual and seasonal variations that occur in rainfall over time may cause changes in the dynamics of the dry forest seed bank. The most affected attributes of the plant community are species richness and seed density, which in some areas are higher in wetter years [8,9] while in other areas are higher during dry periods [10]. In addition, precipitation from previous years may also have a greater power to explain the attributes of the seed bank than the rains in the current year [6]. Therefore, the attributes of the present seed bank may be a reflection of the influence of past precipitation on the dynamics of the plant community.
During the rainy season, there is greater availability of water that allows greater reproduction of the plants and fruiting time occurring in synchrony with the rainy season. Consequently, greater seed dispersion in the soil occurs during this period, forming a richer and denser seed bank. In addition, the seeds of some species that are dispersed during the dry season may remain dormant on the soil bank and germinate only during the rainy season [7,8,9,10,11].
Research has also reported that in some sites, seed density and species richness may be higher during dry periods [12,13]. This fact is associated with the persistence of the soil seed bank [4] and, consequently, with the accumulation of seed production in the previous year [10], as well as the dispersion of quiescent seeds of species that bear fruit only in the dry season [14].
In space, variations in species richness and seed density can occur in two ways: (1) differences in vertical space [5,6,15] and differences in horizontal space (microhabitats) [16,17,18,19]. In the vertical space, seed bank richness and density present in the soil from dry forests are higher than in the litter layer. This occurs because the litter layers in the dry forests tend to be thin and the seeds are more easily predated [3,5,15].
In the horizontal space, dry forests are characterized by a large diversity of microhabitats that, consequently, cause changes in the seed bank dynamics, such as microhabitats formed by patches of shrubby-tree vegetation and adjacent open areas [16,17,20,21], and those formed by the altitude gradient [11,18,19]. In general, these studies reported that spots of shrub-tree vegetation harbor a greater wealth and density in the soil seed bank because these microhabitats have microclimatic conditions (such as humidity and temperature) that favor the formation of a richer and denser seed bank. However, an opposite behavior can also be observed for dry forests, as reported by Yu et al. [15] and Mayor et al. [22]. The authors verified the formation of seed banks with higher richness and density in open areas than in vegetation patches.
In the Northeast of Brazil, the predominant type of dry forest is called Caatinga, in which occurs low annual total rainfall, irregular distribution of rainfall [23], and variations in microhabitats for plant establishment [5,6,23]; similar characteristics to all dry regions in the world. This study addresses how the seed bank varies according to these two scales (spatio–temporal). We investigated the seed bank over seven years, and so it is an example of Caatinga seed bank dynamics in the long run. In Caatinga vegetation, seed bank species richness was higher in a riverside microhabitat (more favorable conditions such as longer shade time, which leads to longer soil moisture), while the density was higher in the rocky microhabitat (less favorable conditions such as long time of light incidence, which leads to rapid desiccation of the soil) [5], showing that the influence of microclimatic conditions will not always affect the number of species and seeds in the same way.
Thus, assuming that variations in seed bank attributes from dry tropical forests are governed by space-time heterogeneity, this manuscript aims to answer the following questions: (1) Are seasonal and inter-annual precipitation causing modifications in richness, species composition, and soil seed numbers? (2) Are the variations in vertical (litter and soil) and horizontal (flat, rocky, and riverside microhabitats) spaces modifying the floristic composition, species richness, and seed density? (3) Is it possible, over seven consecutive years, to predict how the formation of the soil seed bank occurs in dry environments? Answering these questions, we believe that: (1) Variations in precipitation between climatic seasons and consecutive years cause changes in composition that determine the number of seeds and species in the seed bank; (2) After seven years of research, it is possible to predict that past precipitation has a greater impact than present precipitation on seed bank richness and density; (3) variations in vertical (litter and soil) and horizontal (microhabitats) spaces influence the floristic composition and number of species and seeds in soil.

2. Materials and Methods
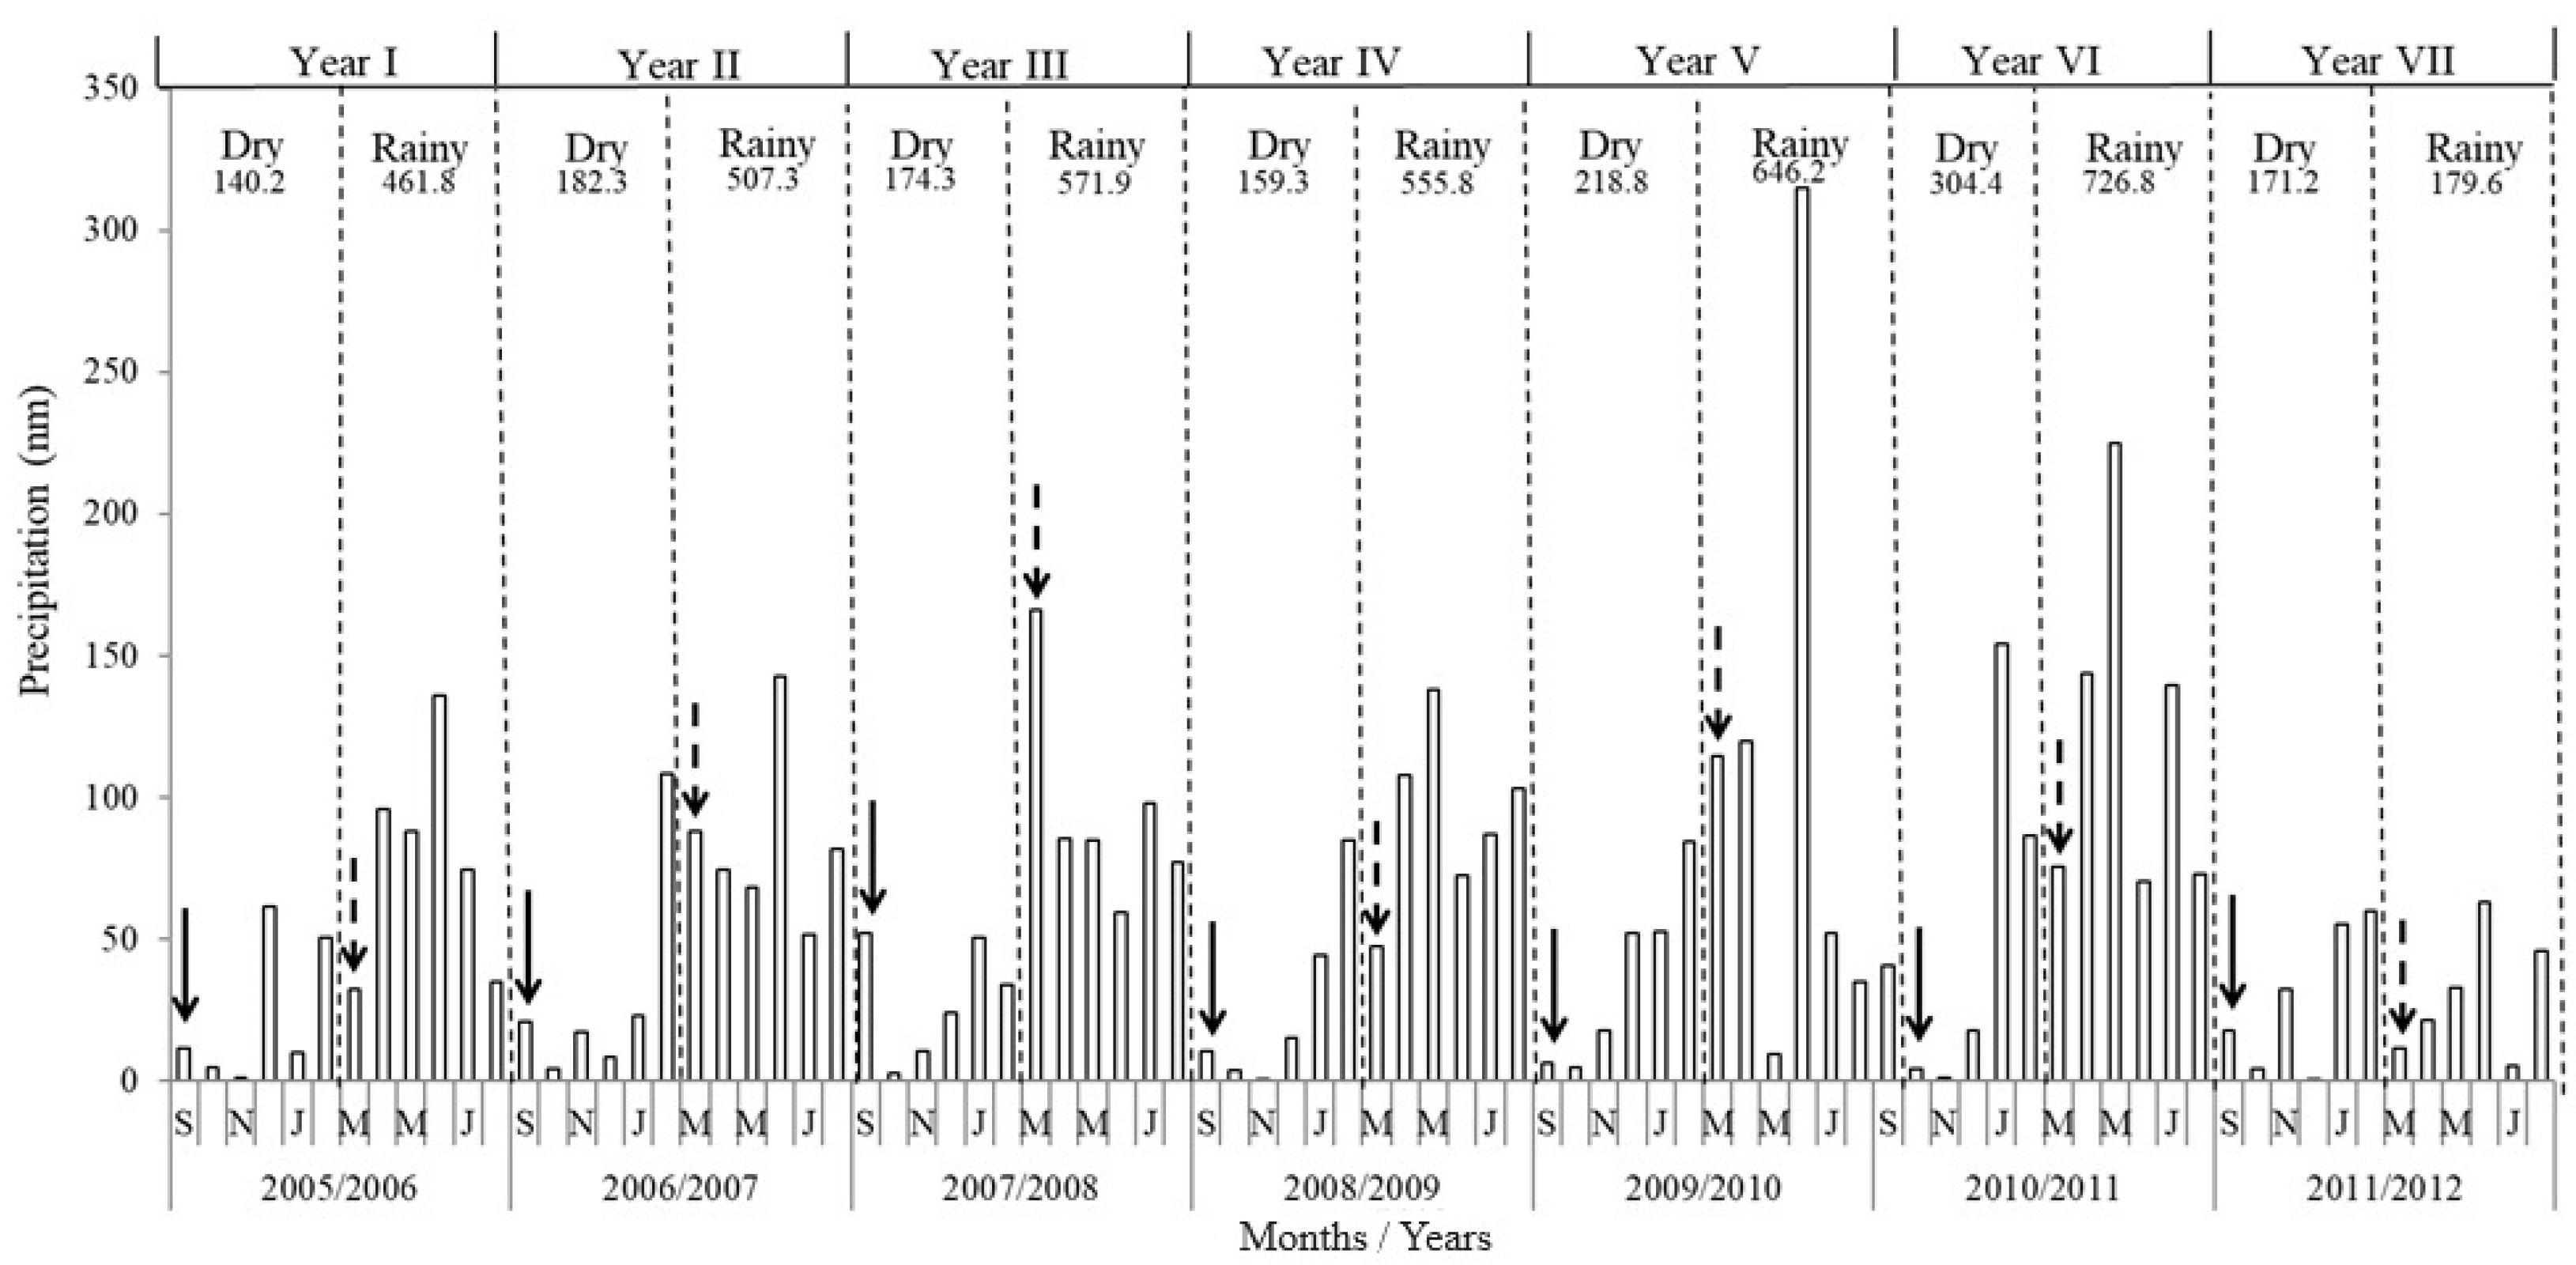
2.1. Study Area

The study was carried out in an area of dry tropical forest called Caatinga, with shrub-arboreal physiognomy [5,6,23]. This vegetation is of high economic importance to the region’s communities [24]. However, the vegetation in the study area is preserved because it is located in a research station belonging to the Instituto de Pesquisa Agropecuária—IPA (8°14′18″ S, 35°55′20″ W, 535 m asl), in Caruaru municipality, Pernambuco state, Brazil.
The local climate is dry and semi-arid [25], with an annual average rainfall of 680 mm and absolute minimum and maximum temperatures of 11 °C and 38 °C, respectively. The compensated average temperature is 22.7 °C. Total precipitation ranged from 350.8 mm to 1031.2 mm during the seven-year study period (2006–2012) (Figure 1). Precipitation data were provided by the IPA weather station. The rainy season usually occurs between March and August, while the other months are marked by drought [23]. Woody vegetation loses its leaves during the dry season and there is greater visibility of herbaceous plants during the rainy season.
The IPA area is drained by the Olaria stream, a tributary from the Ipojuca River [5,26] and, according to Alcoforado Filho et al. [27], the soil of the native vegetation is Podzolic Yellow Eutrophic. Vegetation in the studied area is predominantly woody plants from the families Cactaceae, Caesalpiniaceae, Euphorbiaceae, and Mimosaceae [23,27]. In the herbaceous component, the predominant plants are from the families Asteraceae, Convolvulaceae, Euphorbiaceae, Fabaceae, Malvaceae, and Poaceae [23,26].
Leastways three types of microhabitats (heterogeneity in small-scale settlement conditions) [28] are easily visualized in the study area; they were described by Santos et al. [5] as ciliary (riparian), flat, and rocky. Ciliary corresponds to the land band with a moderate hill on the banks of the Olaria stream, not considering part of the river bed where water flows when precipitation is greater. In ciliary, the woody vegetation is on average 7 m in height and forms a more closed canopy, leading to more shading of the understory, which stays wetter compared to other locations. The flat microhabitats are parts without higher elevations that are up to 150 m from the stream bed banks. Woody plants from this microhabitat are on average 5 m in height, but, in comparison to the ciliary microhabitat, they form a more open canopy, leading to less shading on the understory, which, in this vegetation, favors faster soil desiccation during the dry season compared to other microhabitats. The Rocky microhabitats are parts with rocky outcrops (areas from 2 to 5 m2, and from 0.1 to 1 m high) that occur as scattered spots in the flat microhabitat. Some are well-shaded by woody plant crowns, while others are more exposed to sunlight. Although it is not common to have distinct soils forming on the rocky outcrop surfaces, they have deep depressions and sometimes thick cracks, where some soil and litter accumulate, allowing soil collection in this microhabitat. There is a thin layer of lichens and bryophytes on the surface of rocks (which maintains slight moisture on the rocks), as well as some herbaceous therophytes.

2.2. Seed Bank Samplings

In the fragment of native vegetation studied, there is a 1 ha area where long-term studies have been carried out on local vegetation [5,24,26]. In this section, 1 × 1 m plots were installed randomly to investigate above-ground vegetation [5,26], 35 in each microhabitat (flat, rocky, and ciliary), totaling 105 plots. Soil from each plot was sampled from each microhabitat at the end of the rainy (March) and dry (September) seasons, over seven consecutive years (2006–2012) (Figure 2). The soil was sampled at a 5 cm depth using a 20 × 20 cm collector made from a galvanized sheet separating the litter layer, giving a total of 2940 samples (70 soil samples per year in each microhabitat × seven years × two depths), following the methodology adopted in most studies on soil seed banks [11,19,29].
Soil samples were stored in duly identified plastic bags (plot; depth; microhabitat), and then the samples were placed inside a greenhouse, on a styrofoam tray (20 × 38 × 3 cm) and irrigated daily, without adding nutritive and/or hormonal solutions, for six months. The trays were placed in two rows and, between them, were placed the control trays containing soil sterilized in an autoclave for 30 min at 150 °C in order to detect possible contaminations caused by seeds dispersed by the wind, totaling another 51 control trays per season.
The number of seeds in the soil bank was determined using the seedling emergence method (investigates viable and non-dormant seeds) and expressed in square meters. We followed the same method adopted by other studies [5,6,11,29].
Daily emergent seedlings from each soil sample were counted and labeled with germination date, plot number, and microhabitat type where the sample was collected. Seedlings about 5 cm in height were transplanted into polyethylene bags, irrigated, and monitored for six months, aiming their development till the obtention of reproductive material, if possible, from herbs to ensure the correct taxonomic identification of the species. In order to identify seedlings that did not flower, seeds of the species from the study area were collected, germinated, and photographed, allowing the comparison of unidentified seedlings with photos from the image bank of the Laboratory of Vegetable Ecology of Ecosystems Natural (LEVEN).
Additionally, identification was also performed through specific literature [30] and comparisons with exsiccates deposited in the herbaria Prof. Vasconcelos Sobrinho (PEUFR) and Dárdano de Andrade Lima (IPA), according to the classification system APG IV [31]. The species were classified as annual and perennial. Annuals are herbaceous therophytes plants that complete their life cycles in a few months (semelparous plants). Perennials are biannual herbaceous plants and long-lived woody plants. Unidentified seedlings were indicated as morphospecies.

2.3. Seed Bank Analyses
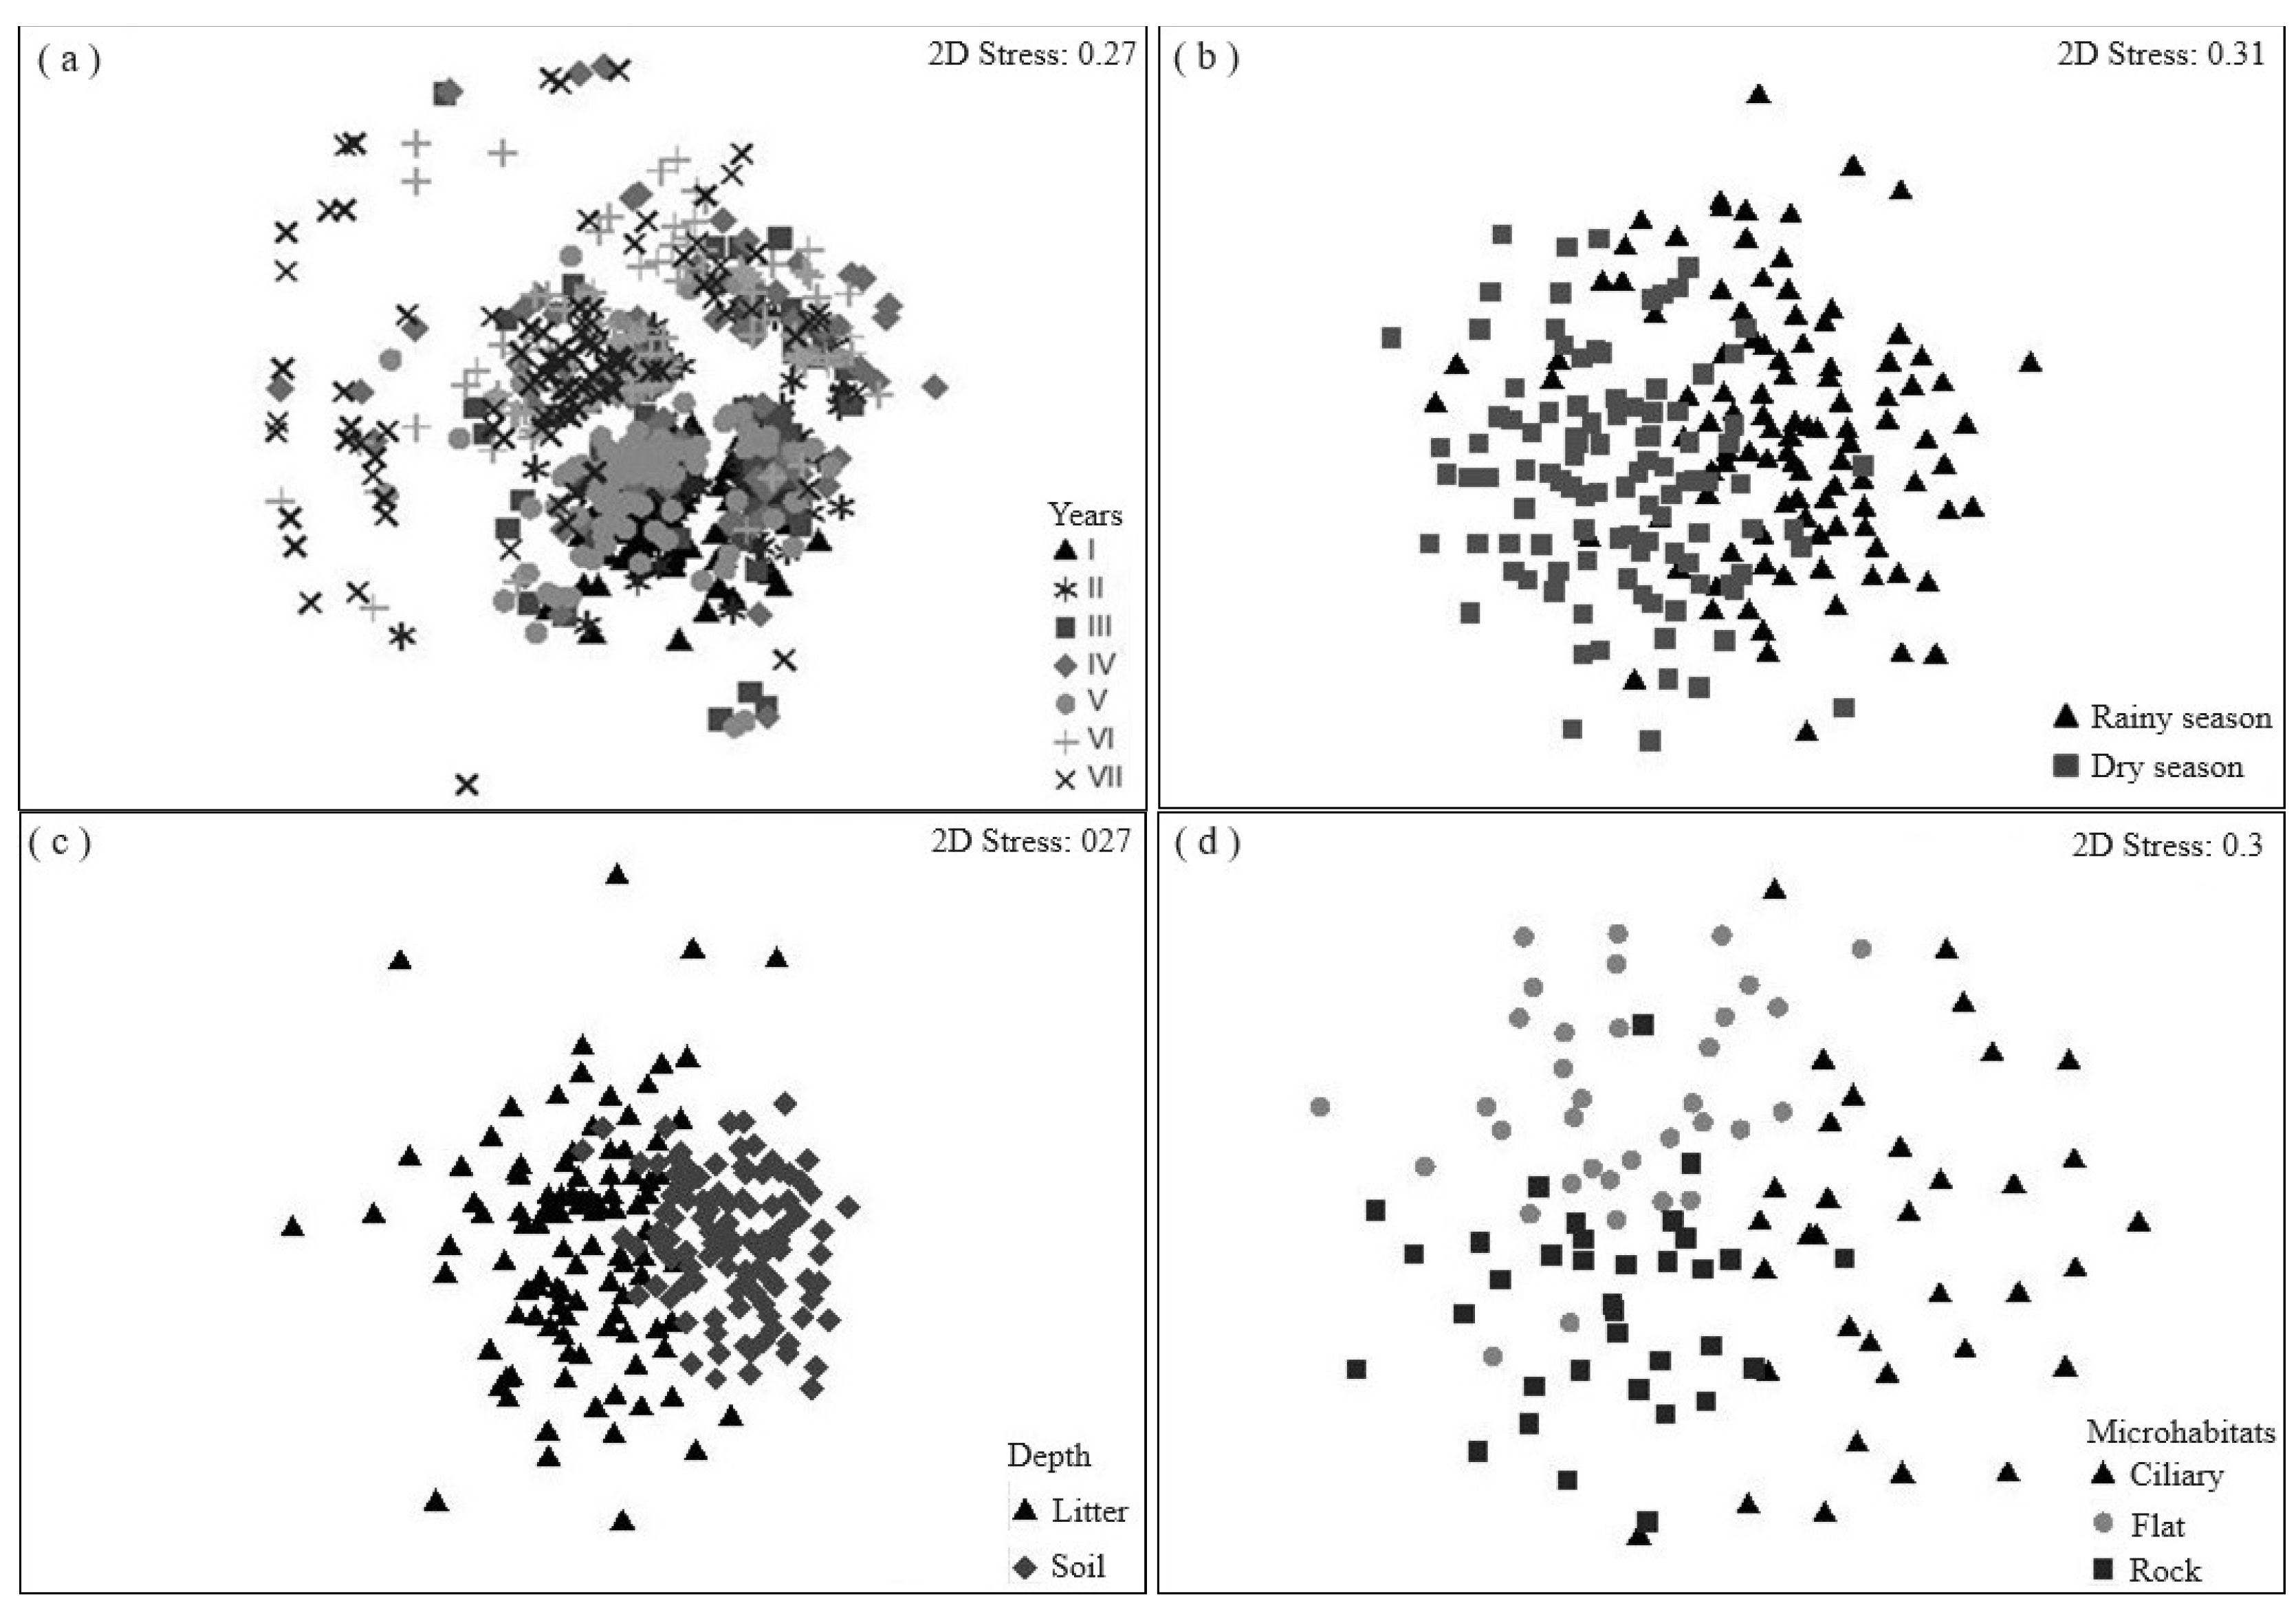
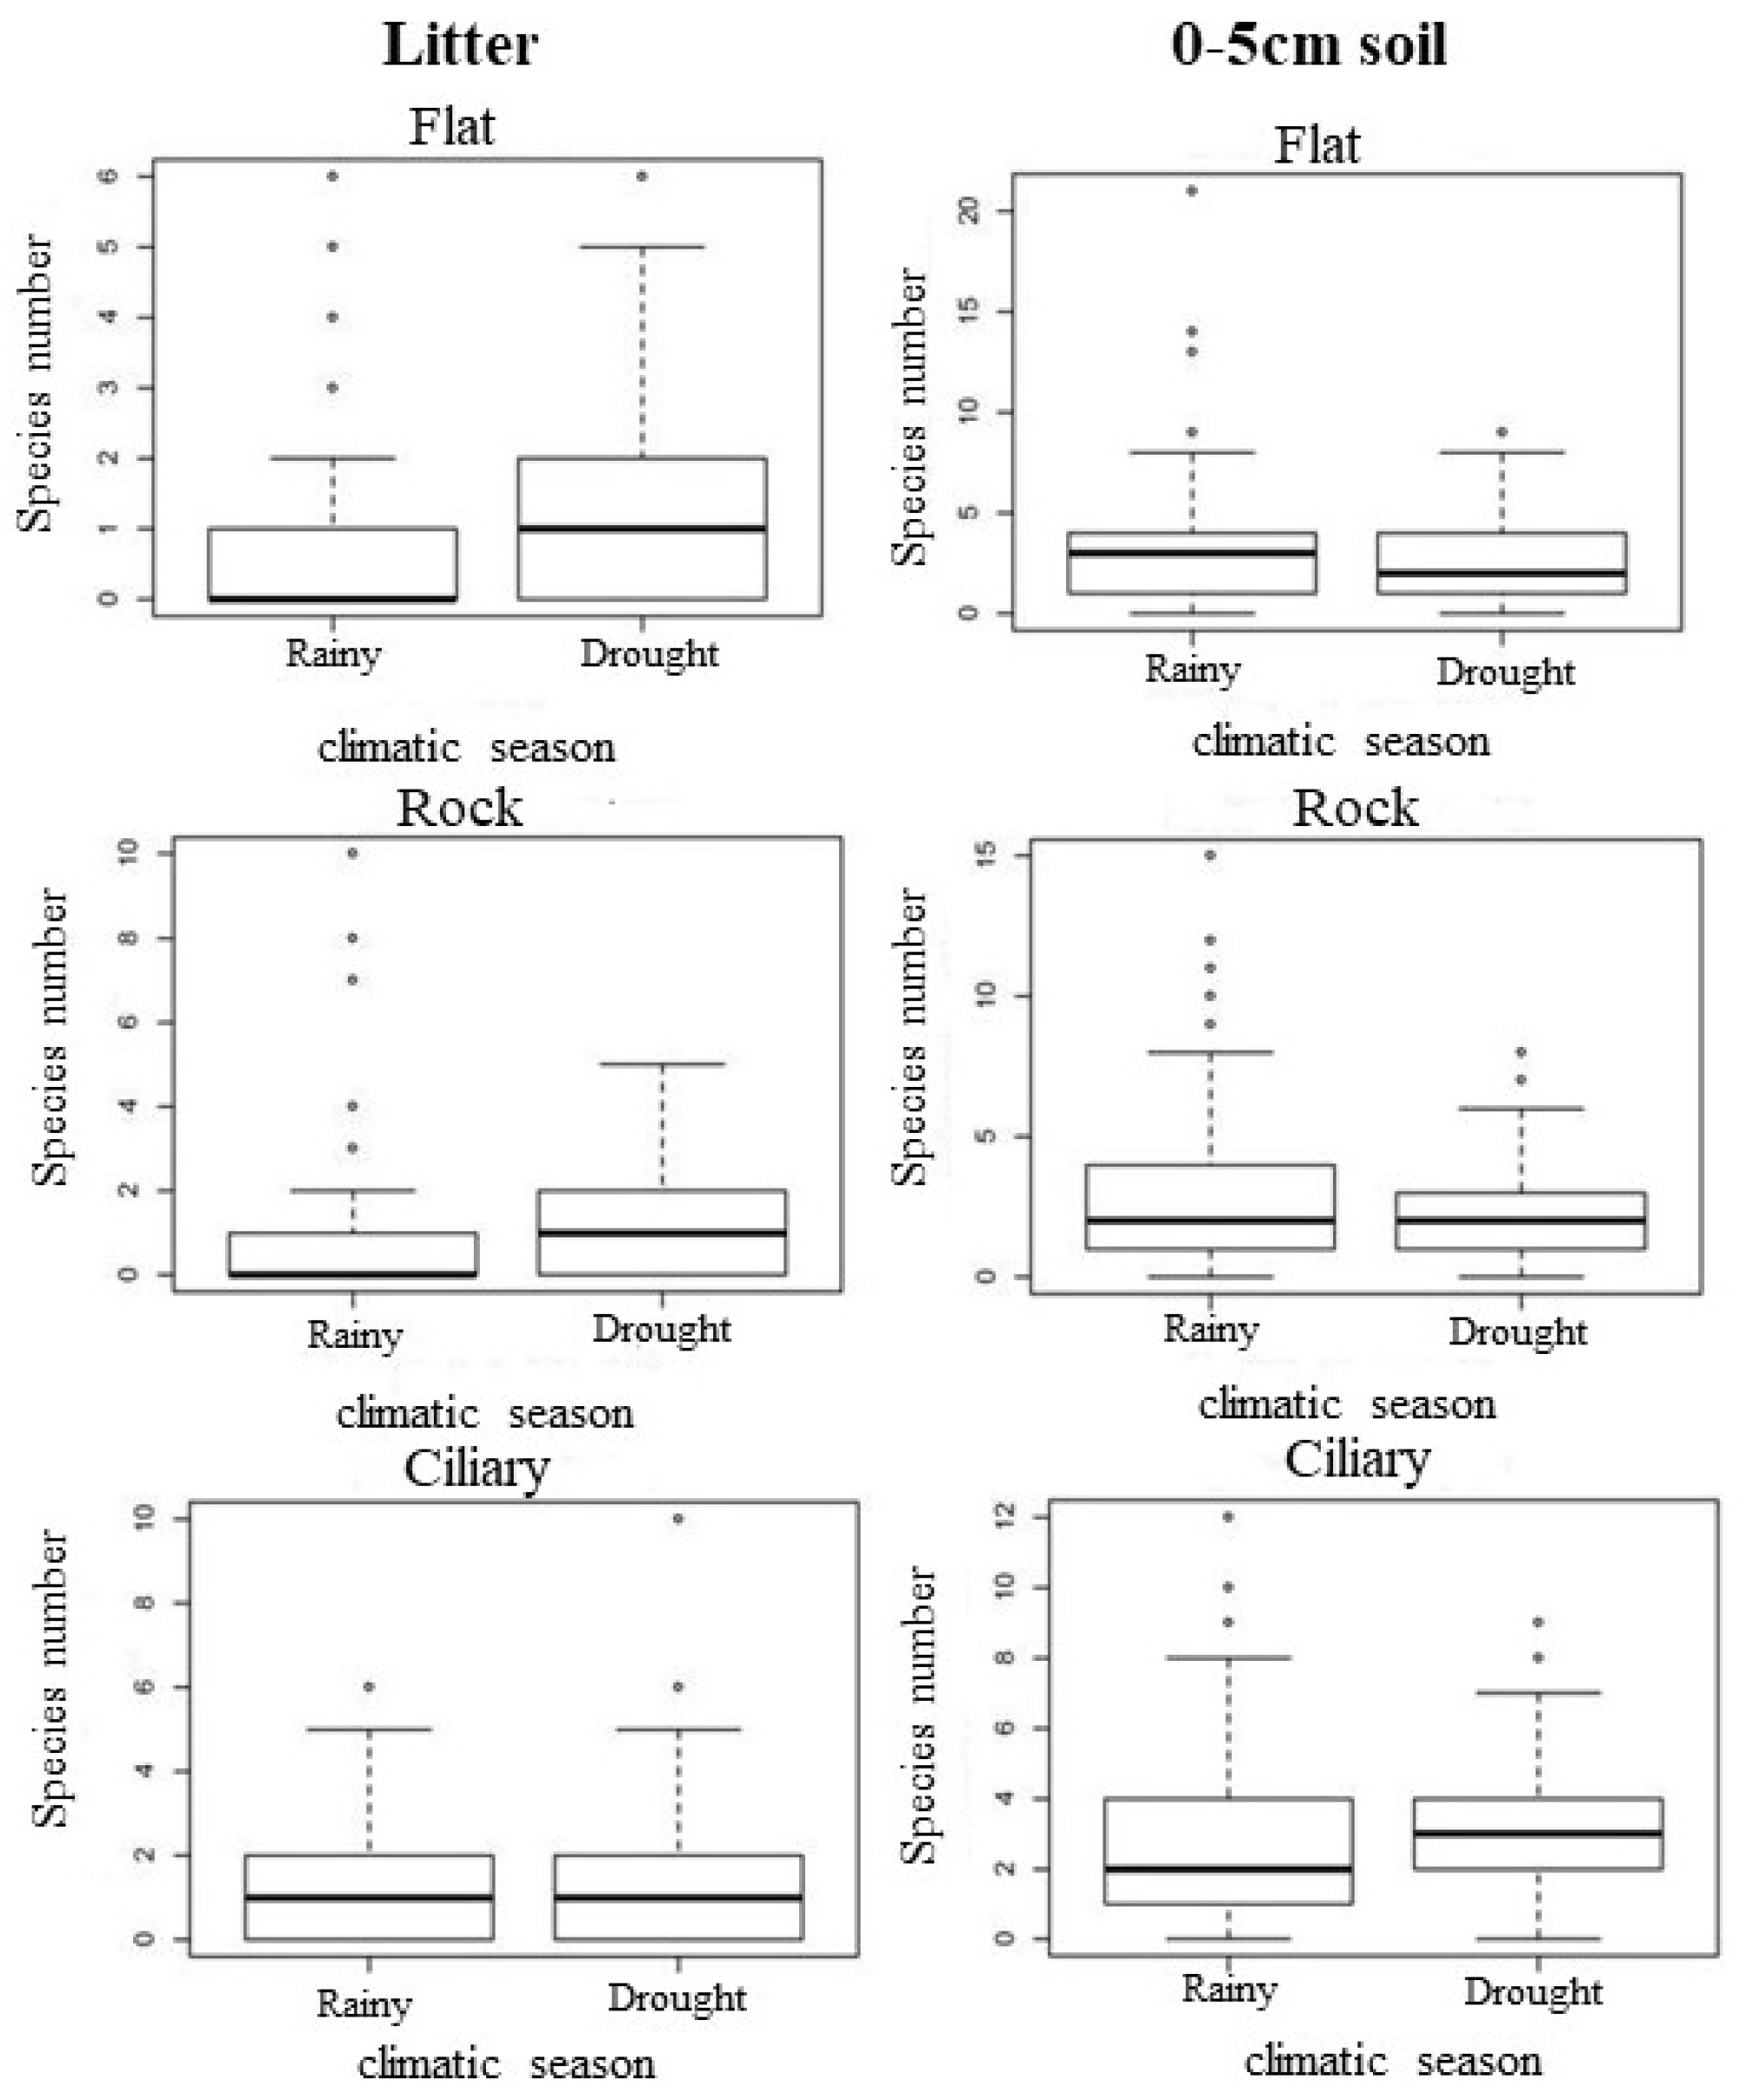
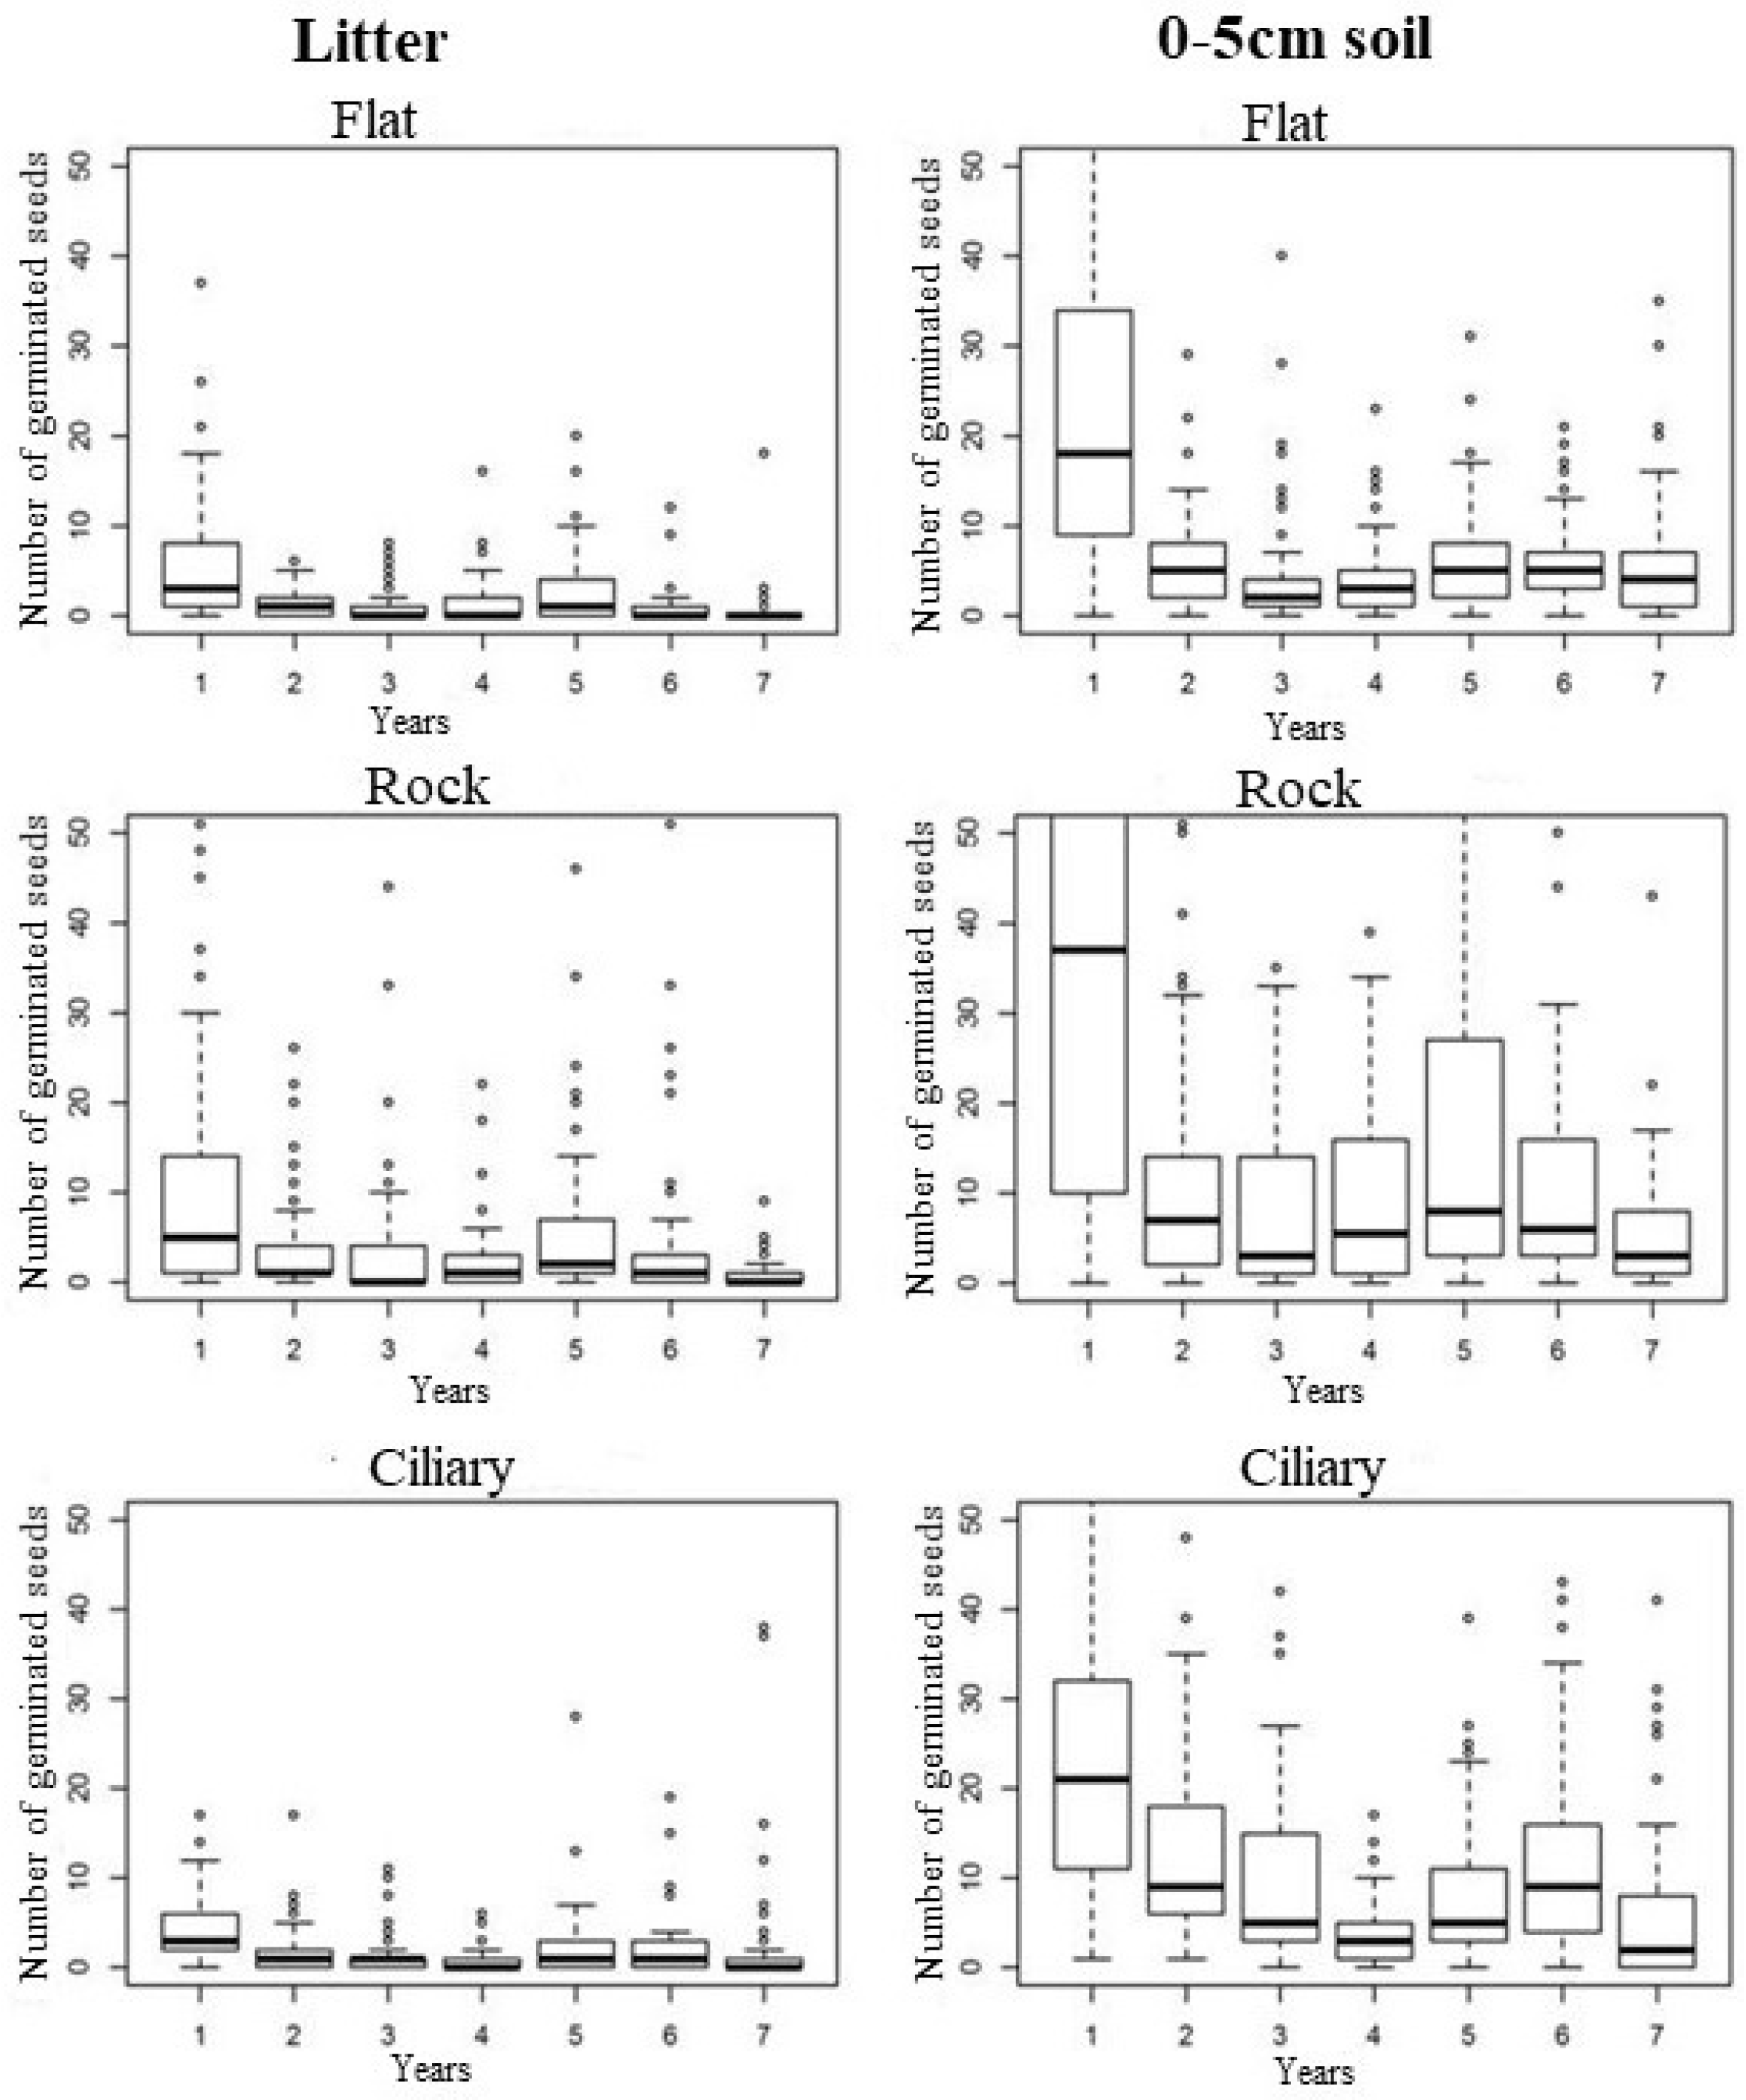
The floristic composition of the forest was compared between the litter and soil, climatic seasons, microhabitats, and years through the Multidimensional Non-Metric Scaling Analysis (NMDS), using the Bray–Curtis dissimilarity matrix, and based on the relative density of species from 105 sample units in the study area. Similarity Analysis (ANOSIM) was used to verify the significance of the cluster formed in the NMDS. We used the Primer software, version 6.1.6, for NMDS and ANOSIM analyses [31].
Generalized linear models (GLMs) [32] were used to evaluate the effects of (1) the seasonal and annual variations in present and past precipitations, (2) soil depth, and (3) the microhabitat type on species number and seedling emergence. Normal, lognormal, or Poisson probability distributions were used according to specific cases. For the normal or lognormal distributions, the identity binding function was used, whereas the log binding function was used for the Poisson distributions. First-order interactions between the explanatory variables were also considered. Akaike Information Criteria (AIC) [33] were used for selected parsimonious models. Proportional reduction of the obtained deviations was used to assess the importance of the explanatory variable to explain the response variable [32]. All statistical analyses were performed using the free R software (R Development Core Team 2011).

3. Results

3.1. Species Richness and Floristic Composition

During the seven years of this study, a total of 138 species emerged from soil seed bank samples, from which 23 were identified at the family level, 17 at the genus level, 82 at the species level, and 16 remained as morphospecies. Considering the taxa identified at the species level, 40% are annual species and 60% are perennial species (Table S1). Of the 138 species, 101 emerged during the dry season while 102 emerged during the rainy season. Analyzing the vertical spatial variation, it was possible to observe that 89 species occurred in the litter and 128 occurred in the 0–5 cm soil. In the horizontal space, 100 species occurred in the flat microhabitat, 88 in the rocky microhabitat, and 110 in the ciliary microhabitat (Table S1). It was possible to determine that the ciliary microhabitat soil holds the largest species number found in the seed bank.
Thirty-five species occurred exclusively during the dry season and 29 occurred exclusively during the rainy season. In the vertical space, 9 and 44 species occurred exclusively in the litter and the soil (0–5 cm), respectively. In the horizontal space, 17 species occurred exclusively in the flat microhabitat, four in the rocky, and 22 in the ciliary (Table S1).
The families with the highest species richness were Euphorbiaceae (11), Poaceae (10), Fabaceae (9), Asteraceae (9), and Malvaceae (8) (Table S1). During the seven years, we verified that a group of 10 species had a continuous occurrence in time (climatic seasons) and space (depth of the ground and type of microhabitat): Begonia reniformis Vell. (Begoniaceae), Callisia repens (Jacq.) L. (Commelinacae), Cyperus uncinulatus Schrad. ex Nees (Cyperaceae), Delilia biflora (L.) Kuntze (Asteraceae), Dioscorea coronata Hauman (Dioscoreacae), Gomphrena vaga Mart. (Amaranthaceae), Panicum trichoides Sw. (Poaceae), Panicum venezuelae Hack. (Poaceae), Pilea hyalina Fenzl (Urticaceae), and Talinum triangulare (Jacq.) Willd (Portulacaceae) (Table S1). It is interesting to note that these species have a herbaceous habit.
The ANOSIM analysis showed significant spatio-temporal variation in floristic composition. We observed the existence of annual variations (global R = 0.209 and p < 0.01; Figure 3a) and seasonal variations (global R = 0.242 and p < 0.01; Figure 3b) in the species set. The species set recorded in the seventh year of this study was smaller compared to those recorded in the first six years. In the vertical space, the floristic composition of the litter was different from that found in the 0–5 cm soil (global R = 0.35 and p < 0.01; Figure 3c). In the horizontal space, there was also variation in floristic composition among the three microhabitats (global R = 0.311 and p < 0.01; Figure 3d).
GLM analysis showed that microhabitat type and soil depth, besides seasonal and annual variations in present and past rainfall and considering most of their interactions, partly explained the change in species number (Table 1). The GLM analysis also showed that soil depth explained 19.6% of species richness, followed by precipitation in the previous year and current year, with 4.2% each, and microhabitat with only 0.2% (Table 1).
It is worth noting that, for both richness and seedling emergence, all interactions among the analyzed variables in this study had significant effects, but for some interactions this significance was very low, reaching less than 1% (Table 1).
Considering the seven years, species richness was higher in the first year, in the two depths, and in the three microhabitats. In general, species richness was similar between climatic seasons (Figure 4).
Considering the spatial variations in the litter, richness was greater in the flat and rocky microhabitats during the dry season. In the soil, richness was higher in the flat microhabitat during the rainy season, and in the ciliary microhabitat during the dry season (Figure 5).

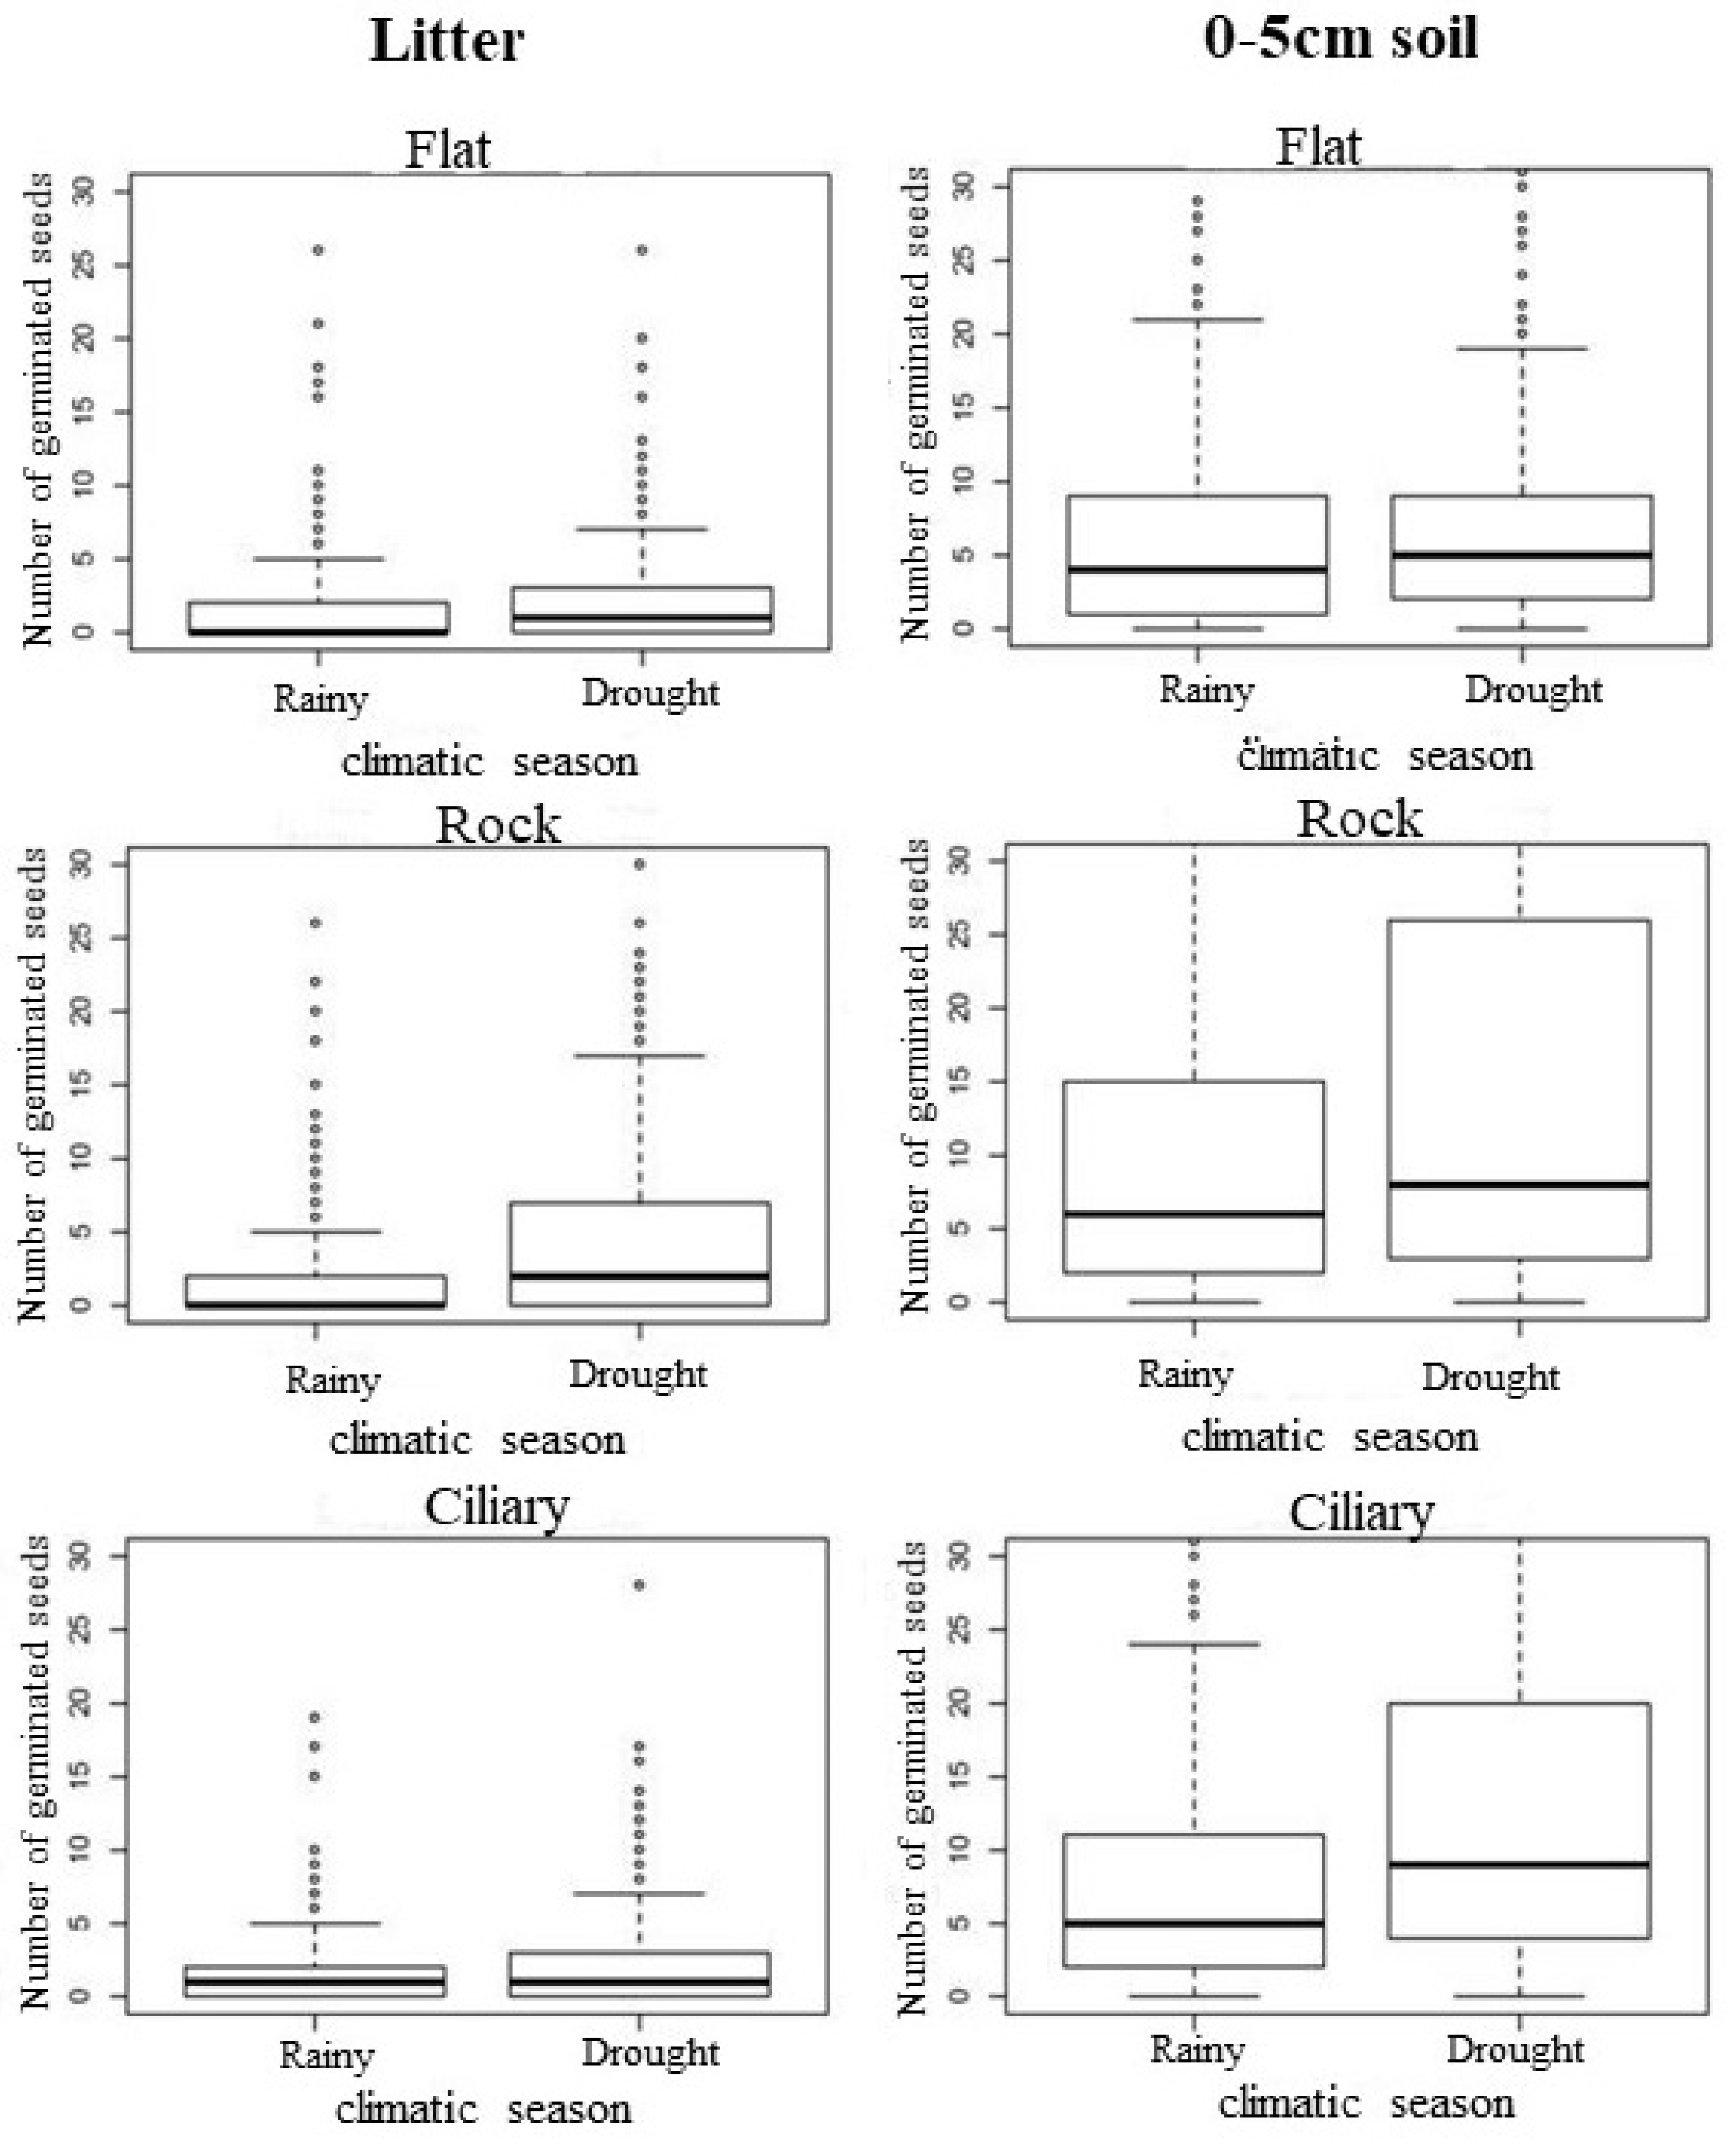
3.2. Seedling Emergence

During the seven years of the study, seed bank density ranged from 1 to 66 sem·m−2 (Table 2).
The total seed bank density was 583 sem·m−2, with 235 sem·m−2 in the rainy season and 348 sem·m−2 in the dry season. In the vertical space, 119 sem·m−2 germinated in the litter and 464 sem·m−2 in the 0–5 cm soil. In the horizontal space, 121 sem·m−2 germinated in the flat microhabitat, 287 sem·m−2 in the rocky microhabitat, and 175 sem·m−2 in the ciliary microhabitat.
GLM analysis showed that microhabitat type and soil depth, besides seasonal and annual variations in the present and past rainfall, and considering most of their interactions, partly explained the variations found in seedling emergence (Table 1). GLM analysis also showed that soil depth explained 16.1% of seedling emergence, followed by the previous year’s precipitation at 7.0%, microhabitat at 6.1%, and the current year’s precipitation at 3.1% (Table 1).
Considering the seven years, seedling emergence was higher in the first year, in the two soil depths, and in the three microhabitats (Figure 6). By analyzing the spatial variations individually, it was possible to determine that the soil (0–5 cm) and the rocky microhabitat had the largest number of germinated seeds (Figure 6).
By analyzing the climatic seasons individually, it was verified that the dry season had the highest number of seeds in the two depths of soil, and in the three microhabitats (Figure 7).

4. Discussion

4.1. Temporal Variation Effect on the Seed Bank

Species composition, richness, and seedling emergence recorded in the soil seed bank are affected by seasonal and annual variations in present and past precipitation. Most studies on soil seed banks from dry environments show that rainfall positively influences the composition and richness of the species, as well as the seed number that reaches the soil [4,6,7,11]. For example, years with greater rainfall can help increase plant reproduction and consequently the produced number of seeds that are dispersed to the soil.
However, in this study, considering seasonal variation alone, it was observed that the numbers of species found in the soil bank were similar between the climatic seasons. However, the floristic composition differed significantly between seasons, and the germinated number of seeds from the bank was higher in the dry season compared to the rainy season.
Other studies have found that seed density and species richness are greater during dry periods [10,12,13,29]. According to the authors, a higher seed density in the dry period is associated with the accumulation of the previous year’s seed production and the persistence of the soil seed bank (longevidade).
In this study, although the soil seed bank is composed mostly of herbaceous therophyte species, the rainy season may function as a seed storage period for these species. However, regarding floristic richness, it seems that the climatic season does not affect the number of species that reach the soil since the registered species number was similar both in the dry season and in the rainy season.
The influence of annual rainfall variability on the soil seed bank showed that, in wetter years, there were more species and seeds in the soil [9,34,35]. However, this trend was not found in this study, since the number of seeds and species was higher in the first year, which presented a lower rainfall index (602 mm) than the other years, except year VII with (350.8 mm).
According to Silva et al. [6], the number of species and seeds found in the soil bank is better explained by the rainfall behavior from previous years than by the precipitation of the current year. In the present study, this assertion was not observed, since current and previous precipitation showed explanation power smaller than 10% for both species richness and seedling emergence. According to Ooi [36], the decrease in annual average levels of precipitation that occurs in most semiarid and arid ecosystems, mainly due to global warming, phenology, and plant reproduction may change and cause subsequent changes in species composition. Perhaps this is happening in the studied area, drastically affecting the number of seeds and the composition of species that form the soil bank, since year VII went through a severe and prolonged drought, with only 350 mm of annual precipitation, and had a significantly reduced floristic composition compared to the other years. In the seventh year, 52 species were recorded, of which 8 occurred exclusively. Of these exclusive species, seven are herbaceous, and only one is arboreal. It is possible that seedlings of these species tolerate longer dry seasons or have a permanent soil bank that may have been produced in previous years.
Although it was not quantified during our study, seed predations that are stored in the soil can reduce seed viability. Consequently, seed predation can alter temporal variability in the richness, species composition, and density of seeds available in the soil for the natural regeneration of Caatinga vegetation. Therefore, further studies are needed to test this hypothesis.

4.2. Effect of Spatial Variation on the Seed Bank

Soil depth and the different microhabitats affected the species composition, richness, and emergence of seedlings from the soil seed bank. Regarding the variations in the vertical space, it was possible to verify that the 0–5 cm soil contained the largest number of species and seeds. Research on soil seed banks has shown that the litter has fewer species and seeds compared to the soil layers [2,3,5,15,20]. In these works, the authors report that this occurs because seeds are more easily predated by animals in the litter [3,20] thus there is no possibility of storing seeds and, consequently, the formation of a soil seed bank [3,15]. Thus, the viable seeds found in the litter remain in this layer for a short time interval from one season to another without exceeding the year [3].
In the present study, this trend was also verified through the quantification of species and seeds found in this layer and also by differences in composition between litter and soil (0–5 cm). In this way, we can affirm that the seeds dispersed in the litter constitute a transient soil bank where part of these seeds germinate within a year and those that do not germinate during this interval are potentially deposited in the soil (0–5 cm).
Regarding the horizontal space, it was verified that the significant effect of microhabitats on the species richness was very low. However, the ciliary microhabitat had a different floristic composition as well as a greater number of species compared to the flat and rocky microhabitats. However, for seed density, the microhabitat variable had a high effect, with the rocky microhabitat having the highest number of seeds. Studies that have been carried out with the objective of quantifying species and seeds in different types of microhabitats report that species richness and seedling emergence are significantly higher in microhabitats with specific characteristics such as higher humidity [4,11,18,19], higher shading [16,20,21], and higher temperature [15,22].
These characteristics can also be observed in the ciliary microhabitat. According to the study by Santos et al. [5], conducted in the same area, the ciliary microhabitat also had higher species richness due to the greater number of exclusive species. The authors reported that this environment may have water availability for a longer time compared to the rocky and flat microhabitats. In addition, the woody vegetation in this section formed a more closed canopy that maintained foliage for a longer time, providing greater shading for the soil. In the study by Santos et al. [5], analysis of the influence of microhabitats on the soil seed bank was carried out for three consecutive years. In the present study, this analysis lasted seven consecutive years, suggesting that there is a tendency for ciliary microhabitats to have the greatest number of species and a different floristic composition compared to other microhabitats.
Regarding the rocky microhabitat containing the largest number of seeds, similar results were observed by Santos et al. [5]. The authors reported that rocky microhabitats might offer greater persistence of seed bank storage because they are covered by lichens and bryophytes in addition to containing depressions and crevices that favor the accumulation of soil and litter. In addition, cracks and fissures in the rocks contribute to seed retention in this microhabitat. Therefore, this study confirms that the rocky microhabitat contributes to the formation of the soil seed bank in this Caatinga area.
We found that the soil seed banks of tropical dry forests show fluctuations in species richness, seed density, and species composition over time and space. Understanding long-term seed bank dynamics shows the potential it has to contribute to the natural regeneration of dry tropical forests after any natural or anthropogenic disturbances. Furthermore, it also allows us to recommend transplanting the seed bank from conserved areas to restore degraded areas. It is worth noting that microhabitats play an important role in conserving the diversity of the seed bank. Consequently, variations in plant establishment conditions must be considered during conservation and restoration actions in tropical dry forests.

5. Conclusions

The species composition, richness, and seedling emergence of the soil seed bank are influenced by the spatiotemporal variations found in dry environments. Thus, it can be affirmed that all variables tested in this study partially explained the behavior of the seed bank.
However, some variables had greater explanatory power, for example, the soil depth, while others had low explanatory power, for example, the microhabitat. For temporal variations, the seven-year research demonstrates that the variability in quantitative rainfall leads to differences in the seed number and species that are stored in the soil.
For spatial variations, it was possible to verify that seed number and species were higher in the soil (0–5 cm) than in the litter during the seven consecutive years. This demonstrates that the soil probably has the potential to store species through its seeds with a high density due to the protection provided by the litter. Thus, even though the litter does not have the same richness and density, its role is also important for maintaining plant populations in the form of seeds.
Concerning the effect of the microhabitats, it was possible to prove that the ciliary microhabitat maintains a greater number of species. However, for seedling emergence, the rocky microhabitat was the microhabitat that retained the largest number of seeds, revealing their importance for the conservation of the biological diversity of dry environments.
Therefore, it is possible to state that, for seven consecutive years, the soil seed bank of the Caatinga vegetation is formed with the help of variations in precipitation and the conditions of different types of microhabitats.

Supplementary Materials

The following supporting information can be downloaded at: https://www.mdpi.com/article/10.3390/f15071108/s1, Table S1: Emerging seedling species in the caatinga area, between climatic seasons (Rainy and Dry) and in litter and soil (0–5 cm) in three microhabitats (Flat, Rocky, and Ciliary) during seven years of study in a semi-arid area in northeastern Brazil.

Author Contributions

Conceptualization, D.M.d.S., K.A.d.S. and E.d.L.A.; methodology, D.M.d.S., B.A.d.S.A., P.S.d.S., V.K.R.d.A. and J.M.F.F.d.S.; software, S.R.d.C.; validation, D.M.d.S., K.A.d.S. and E.d.L.A.; formal analysis, S.R.d.C. and K.A.d.S.; investigation, D.M.d.S., B.A.d.S.A., P.S.d.S., V.K.R.d.A. and J.M.F.F.d.S.; resources, E.d.L.A.; data curation, E.d.L.A.; writing—original draft preparation, D.M.d.S.; writing—review and editing, D.M.d.S., K.A.d.S., S.R.d.C., B.A.d.S.A., P.S.d.S., V.K.R.d.A. and J.M.F.F.d.S.; visualization, K.A.d.S. and E.d.L.A.; supervision, K.A.d.S. and E.d.L.A.; project administration, D.M.d.S., K.A.d.S. and E.d.L.A.; funding acquisition, D.M.d.S. and E.d.L.A. All authors have read and agreed to the published version of the manuscript.

Funding

This research was funded by Conselho Nacional de Desenvolvimento Científico e Tecnológico (APQ-1318-2.05/15) and Fundação de Amparo a Ciência e Tecnologia de Pernambuco (DCR-0015-2.05/16).

Data Availability Statement

The data presented in this study are available from the corresponding author upon request.

Acknowledgments

The authors would like to thank the Agronomic Institute of Agricultural Research (IPA) for the logistics and permission to work on their property, and the researchers at the Laboratory of Plant Ecology and Northeastern Ecosystems (LEVEN) for their support.

Conflicts of Interest

The authors declare no conflicts of interest.

References

  1. Hamin, N.; Quaye, M.; Westberg, E.; Barazoni, O. Soil seed bank among-years genetic diversity in arid populations of Eruca sativa Miller (Brassicaceae). J. Arid Environ. 2013, 91, 151–154. [Google Scholar] [CrossRef]
  2. Vandvik, V.; Klanderud, K.; Meineri, E.; Maren, I.E.; Topper, J. Seed banks are biodiversity reservoirs: Species-area relationships above versus below ground. Oikos 2016, 125, 218–228. [Google Scholar] [CrossRef]
  3. Hopfensperger, K.N. A review of similarity between seed bank and standing vegetation across ecosystems. Oikos 2007, 116, 1438–1448. [Google Scholar] [CrossRef]
  4. Quevedo-Robledo, L.; Pucheta, E.; Ribas-Fernandéz, Y. Influences of inter-year rainfall variability and microhabitat on the germinable seed bank of annual plants in a Sandy Monte Desert. J. Arid Environ. 2009, 74, 167–172. [Google Scholar] [CrossRef]
  5. Santos, D.M.; Silva, K.A.; Albuquerque, U.P.; Santos, J.M.F.F.; Lopes, C.G.R.; Araújo, E.L. Can spatial variation and inter-annual variation in precipitation explain the seed density and species richness of the germinable soil seed bank in a tropical dry forest in north-eastern Brazil? Flora 2013, 208, 445–452. [Google Scholar] [CrossRef]
  6. Silva, K.A.; Santos, D.M.; Santos, J.M.F.F.; Albuquerque, U.P.; Ferraz, E.M.N.; Araújo, E.L. Spatio-temporal variation in a seed bank of a semi-arid region in northeastern Brazil. Acta Oecol. 2013, 46, 25–32. [Google Scholar] [CrossRef]
  7. Sotomayor, D.A.; Gutiérrez, J.R. Seed bank of desert annual plants along an aridity gradient in the southern Atacama coastal desert. J. Veg. Sci. 2015, 26, 1148–1158. [Google Scholar] [CrossRef]
  8. Peters, D.P.C. Plant species dominance at a grassland-Shrubland ecotone: And individual-based gap dynamics model of herbaceous and species woody. Ecol. Model. 2002, 152, 5–32. [Google Scholar] [CrossRef]
  9. Facelli, J.M.; Chesson, P.; Barnes, N. Differences in seed biology of annual plants in arid lands: A key ingredient of the storage effect. Ecology 2005, 86, 2998–3006. [Google Scholar] [CrossRef]
  10. Traba, J.; Azcárate, F.M.; Peco, B. The fate of seeds in Mediterranean soil seed bank in relation to their traits. J. Veg. Sci. 2006, 17, 5–10. [Google Scholar] [CrossRef]
  11. Hegazy, A.K.; Hammouda, O.; Lovett-Doust, J.; Gomaa, N.H. Variations of the germinable soil seed bank along the altitudinal gradient in the northwestern Red Sea region. Acta Ecol. Sin. 2009, 29, 20–29. [Google Scholar] [CrossRef]
  12. Cabin, R.J.; Marshall, D.C. The demographic role of soil seed banks. I. Spatial and temporal comparisons of below- and above-ground populations of the desert mustard Lesquerella fendleri. J. Ecol. 2000, 88, 233–292. [Google Scholar] [CrossRef]
  13. Arroyo, M.T.K.; Chacon, P.; Cavieres, L.A. Relationship between seed bank expression, adult longevity and aridity in species of Chaetanthera (asteraceae) in Central Chile. Ann. Bot. 2006, 98, 591–600. [Google Scholar] [CrossRef]
  14. Valdez-Hernández, M.; Andrade, J.L.; Jackson, P.C.; Rebolledo-Vieyra, M. Phenology of five tree species of a tropical dry forest in Yucatan, Mexico: Effects of environmental and physiological factors. Plant Soil 2010, 329, 155–171. [Google Scholar] [CrossRef]
  15. Yu, S.; Bell, D.; Sternberg, M.; Kutiel, P. The effect of microhabitats on vegetation and its relationships with seedlings and soil seed bank in a Mediterranean coastal sand dune community. J. Arid Environ. 2008, 72, 2040–2053. [Google Scholar] [CrossRef]
  16. Erfanzadeh, R.; Shahbazian, R.; Zali, H. Role of plant patches in preserving flora from the soil seed bank in an overgrazed high-mountain habitat in Northern Iran. J. Agric. Sci. Technol. 2014, 19, 229–238. [Google Scholar]
  17. Valenta, K.; Steffens, T.S.; Rafaliarison, R.R.; Chapman, C.A.; Lehman, S.M. Seed banks in Savanna, forest fragments and a continuous forest edges differ in a tropical dry forest in Madagascar. Biotropica 2015, 47, 435–440. [Google Scholar] [CrossRef]
  18. Donnell, J.O.; Fryirs, K.; Leishman, M.R. Can the regeneration of vegetation from riparian seed banks support biogeomorphic succession and the geomorphic recovery of degraded river channels? River Res. Appl. 2015, 31, 834–846. [Google Scholar] [CrossRef]
  19. Donnell, J.O.; Fryirs, K.; Leishman, M.R. Seed banks as a source of vegetation regeneration to support the recovery of degraded rivers: A comparison of river reaches of varying condition. Sci. Total Environ. 2016, 542, 591–602. [Google Scholar] [CrossRef]
  20. Caballero, I.; Olano, J.M.; Escudero, A.; Loidi, J. Seed bank spatial structure in semi-arid environments: Beyond the patch-bare area dichotomy. Plant Ecol. 2008, 195, 215–223. [Google Scholar] [CrossRef]
  21. Dreber, N.; Oldeland, J.; Gretil, M.V.; Rooyen, V. Species, functional groups and community structure in seed banks of the arid Nama Karoo: Grazing impacts and implications for rangelands restoration. Agric. Ecosyst. Environ. 2011, 141, 399–409. [Google Scholar] [CrossRef]
  22. Mayor, M.D.; Bóo, R.M.; Pelaéz, D.V.; Elía, O.R.; Tomáz, M.A. Influence of shrub cover on germination, dormancy and viability of buried and unburied seeds of Piptochaetium napostaense (Speg.) Hackel. J. Arid Environ. 2007, 68, 509–521. [Google Scholar] [CrossRef]
  23. Araújo, E.L.; Castro, C.C.; Albuquerque, U.P. Dynamics of Brazilian caatinga—A review concerning the plants, environment and people. Funct. Ecosist. Commun. 2007, 1, 15–28. [Google Scholar]
  24. Lucena, R.F.P.; Nascimento, V.T.; Araújo, E.L.; Albuquerque, U.P. Local uses of native plants in an area of caatinga vegetation (Pernambuco, NE-Brazil). Ethnobot. Res. Appl. 2008, 6, 3–13. [Google Scholar] [CrossRef]
  25. Köppen, W. Grundriss der Klimakunde; Walter de Gruyter: Berlin, Germany, 1931; 390p. [Google Scholar]
  26. Reis, A.M.S.; Araújo, E.L.; Ferraz, E.M.N.; Moura, A.N. Variações interanuais na florística e fitossociologia do componente herbáceo de uma área de caatinga, Pernambuco, Brasil. Acta Bot. Bras. 2006, 29, 497–508. [Google Scholar]
  27. Alcoforado-Filho, F.G.; Sampaio, E.V.S.B.; Rodal, M.J.N. Florística fitossociologia de um remanescente de vegetação caducifólia espinhosa arbórea em Caruaru. Acta Bot. Bras. 2003, 17, 287–303. [Google Scholar] [CrossRef]
  28. Begon, M.; Harper, J.L.; Townsend, C.R. Ecologia—De Individuos A Ecossistemas, 4th ed.; Artmed Editora: Porto Alegre, Brazil, 2007; pp. 1–752. [Google Scholar]
  29. Santos, D.M.; Santos, J.M.F.F.; Silva, K.A.; Araújo, V.K.R.; Araújo, E.L. Composition, species richness and density of the germinable seed bank over 4 years in young and mature forests in Brazilian semiarid regions. J. Arid Environ. 2016, 129, 93–101. [Google Scholar] [CrossRef]
  30. Souza, V.C.; Lorenzi, H. Botânica Sistemática: Guia Ilustrado para Identificação das Famílias de Fanerógamas Nativas e Exóticas no Brasil, Baseado em APGIV, 3rd ed.; Instituto Plantarum: Nova Odessa, Brazil, 2012; pp. 1–768. [Google Scholar]
  31. Clarke, K.R.; Gorley, R.N. Primer v6: User Manual/Tutorial, 6th ed.; Plymouth Marine Laboratory: Plymouth, UK, 2006; pp. 1–190. [Google Scholar]
  32. Dobson, A.J. An Introduction to Generalized Linear Models, 2nd ed.; Chapman & Hall/CRC: Boca Raton, FL, USA, 2002; pp. 50–62. [Google Scholar]
  33. Akaike, H. A new look at the statistical model identification. Trans. Automat. Contr. 1974, 19, 716–723. [Google Scholar] [CrossRef]
  34. Pugnaire, F.I.; Lazaró, R. Seed bank and understorey species composition in a semi-arid environment: The effect of shrub age and rainfall. Ann. Bot. 2000, 86, 807–813. [Google Scholar] [CrossRef]
  35. López, R.P. Soil seed bank in the semi-arid Prepuna of Bolivia. Plant Ecol. 2003, 168, 85–92. [Google Scholar] [CrossRef]
  36. Ooi, M.K.J. Seed bank persistence and climate change. Seed Sci. Res. 2012, 22, 53–60. [Google Scholar] [CrossRef]
Figure 1. Monthly and total precipitation during the rainy and dry seasons over seven years. Arrows with full rows indicate the period of sample collection at the end of the rainy seasons, and arrows with dashed lines indicate the period of sample collection at the end of the dry seasons. Data were provided by the meteorological station in Empresa Pernambucana de Pesquisa Agropecuária (IPA) in Caruaru, Pernambuco, Brazil.
Forests 15 01108 g001
Figure 2. Experimental design for soil collection (20 × 20 × 5 cm plots) in the surroundings of the fixed plots of 1 × 1 m in a semi-arid area of Northeast Brazil.
Forests 15 01108 g002
Figure 3. Multidimensional scaling (MDS) analysis of the germinated species in the soil seed bank in a dry forest area (Caatinga) (a) during seven consecutive years, (b) between climatic seasons (Rainy and Dry), (c) between two depths (litter and 0–5 cm soil), and (d) between three microhabitats (Ciliary, Flat, and Rock). The charts were produced based on species richness. Graph symbols represent the soil samples and their respective germinated species, considering the seven years of study.
Forests 15 01108 g003
Figure 4. Distribution of species number based on depth, microhabitat, and study year in a Caatinga area, Caruaru, PE. The box-plot = 50% of the collected data; upper and lower bars = 25% of the data variation; o = more than extreme points between the data collected; box inside line = median of the data distribution; the non-overlap of the median in the comparison between the years indicates a significant difference.
Forests 15 01108 g004
Figure 5. Distribution of species number based on depth, microhabitat, and climatic season in a Caatinga area, Caruaru, PE. The box-plot = 50% of the collected data; upper and lower bars = 25% of the data variation; o = more than extreme points between the data collected; box inside line = median of the data distribution; the non-overlap of the median in the comparison between the years indicates a significant difference.
Forests 15 01108 g005
Figure 6. Distribution of the number of germinated seeds based on depth, microhabitat, and study year in a Caatinga area, Caruaru, PE. The box-plot = 50% of the collected data; upper and lower bars = 25% of the data variation; o = more than extreme points between the data collected; box inside line = median of the data distribution; the non-overlap of the median in the comparison between the years indicates a significant difference.
Forests 15 01108 g006
Figure 7. Distribution of germinated seed based on depth, microhabitat, and climatic season in a Caatinga area, Caruaru, PE. The box-plot = 50% of the collected data; upper and lower bars = 25% of the data variation; o = more than extreme points between the data collected; box inside line = median of the data distribution; the non-overlap of the median in the comparison between the years indicates a significant difference.
Forests 15 01108 g007
Table 1. GLM results used to analyze the variations in species richness and emergence of seedlings in a Caatinga area. DF: degree of freedom; PRD: proportional reduction of variance with the inclusion of the explanatory variable (pseudo r2); CPRD: accumulated PRD.
Variable ResponseExplanatory Variations and Their InteractionsDFDeviance Explained by the VariableResidual DFResidual Deviancep-ValuePRDCPRDCPRD%
Species richnessNULLNANA29395,762,075,032
Depth1113,201,88929384,630,056,1420.00000.1960.19619.6
Previous year’s precipitation12,430,666,24429374,386,989,5170.00000.0420.2394.2
Precipitation of the year1239,359,41829364,147,630,0990.00000.0420.2804.2
Climatic station precipitation13,437,730,60629354,144,192,3690.06370.0010.2810.1
Microhabitat21,090,314,18129334,133,289,2270.00430.0020.2830.2
Precipitation of the previous climatic season13,257,551,86229324,130,031,6750.07110.0010.2830.1
Emergence of seedlingsNULLNANA293962,454NA
Depth110,043293852,4110.00000.1610.16116.1
Previous year’s precipitation14391293748,0200.00000.0700.2317.0
Microhabitat23840293544,1790.00000.0610.2936.1
Precipitation of the previous climatic season1918293443,2610.00000.0150.3071.5
Precipitation of the year11966293341,2960.00000.0310.3393.1
Climatic station precipitation1181293241,1150.00000.0030.3420.3
Table 2. The number of germinated seeds per square meter (sem·m−2) in the three microhabitats (Flat, Rock, and Ciliary) in the two climatic seasons (Rainy and Dry) in the litter and 0–5 cm soil for seven consecutive years in a Caatinga area of northeastern Brazil.
Emergence of Seedlings
FlatRockyCiliary
RainyDryRainyDryRainyDry
YearLitterSoilLitterSoilLitterSoilLitterSoilLitterSoilLitterSoil
I6294148431466315429
II1713294821518
III12161392113113
IV1314111271313
V143721212251539
VI151516132161617
VII1218141511422
Total1152124615885415413571518
Disclaimer/Publisher’s Note: The statements, opinions and data contained in all publications are solely those of the individual author(s) and contributor(s) and not of MDPI and/or the editor(s). MDPI and/or the editor(s) disclaim responsibility for any injury to people or property resulting from any ideas, methods, instructions or products referred to in the content.

