Article

Accumulation Pattern and Potential Ecological Risk of Heavy Metals in Topsoil as Affected by Diverse Sources in Different Ecosystems in Western Dabie Mountain

1
Changsha General Survey of Natural Resources Center, China Geological Survey, Changsha 410600, China
2
Huangshan Observation and Research Station for Land-Water Resources, Huangshan 245000, China
3
Hubei Key Laboratory of Regional Development and Environmental Response, Faculty of Resources and Environmental Sciences, Hubei University, Wuhan 430062, China
*
Author to whom correspondence should be addressed.
Forests 2024, 15(7), 1116; https://doi.org/10.3390/f15071116
Submission received: 25 May 2024 / Revised: 22 June 2024 / Accepted: 25 June 2024 / Published: 27 June 2024

Abstract

:
Soil heavy metal (HM) control has become a pressing global ecological and environmental issue, with a significant focus on the western Dabie Mountain in China, a region that is recognized for its ecological barriers and water sources. We analyzed the concentrations, pollution status, and potential ecological risks of 10 HMs (i.e., Cu, +Pb, Zn, Cr, Ni, Co, Cd, As, Hg, and Mn) in the topsoil of different ecosystems in this region. The effects of four soil groups (Anthrosol, Fluvisols, Gleysol, and Alisols) and three soil texture types (sandy, clayey, and loamy soils) on the above aspects were also analyzed. Positive Matrix Factorization (PMF) models were performed to identify and quantify the potential sources and contribution rates of these HMs. Results showed that the level of HM pollution may be negligible, and there was no potential ecological risk. Of all metals, Pb and Cd exhibited the highest levels of pollution. The potential ecological risk associated with soil HMs decreased from croplands to urban and further to forests. Cu and Co were more likely to accumulate in Anthrosols, while Alisols were more likely to accumulate Pb, Cd, and Hg and had a higher overall potential ecological risk. The overall risk in clayey and loamy soils is both higher than in sandy soils. The HM accumulation in topsoil was closely related to the soil organic matter and clay contents. The potential main sources of HMs in this region can be agricultural activities, soil parent material, mining, industrial activities, and vehicle emissions. These findings suggest that special attention should be paid to soil Pb and Cd in western Dabie Mountain. Future efforts can focus on reducing mining, smelting, and industrial emissions, as well as strengthening the research on the migration patterns and mechanisms of HMs.

1. Introduction

Soil heavy metal (HM) distribution and pollution is a worldwide environmental and health issue [1]. The origins of this pollution are classified into natural and human-induced sources [2]. Natural sources arise from inherent processes of soil formation. In contrast, anthropogenic sources stem from human activities, including industrial coal combustion, mining, smelting, application of fertilizers and pesticides, and emissions from vehicles and electronic devices [3]. HM pollution is characterized by its insidious nature, persistence, and ability to bioaccumulate, making it challenging to eliminate it from the soil [4]. High levels of HMs can not only hinder plant growth and development, decreasing crop yields and the quality of agricultural products, but also enter the human body, potentially causing a range of health issues [1,5,6,7,8]. Consequently, preventing and controlling soil HM pollution is crucial.
In recent years, there has been increasing attention to soil HM pollution. Current studies are often focused on assessing the characteristics of soil pollution, evaluating the risks posed by HMs, and analyzing the sources of this contamination [3,9,10,11]. Various indices are commonly used in the assessments, such as the single factor index, enrichment factor, geoaccumulation index, and potential ecological risk index [2,5,6]. However, using the single factor index to assess pollution relies too much on one factor within the formula, and the assessment results can easily be inconsistent with the actual results [12,13]. Meanwhile, in the current context of complex metal pollution, this method is not comprehensive enough.
In order to avoid the threats caused by HMs, it is important to identify potential sources of contamination. Source analysis models are the primary tools for analyzing pollution sources. These models can qualitatively and quantitatively determine the contribution of various pollution sources. The most commonly used models include the Positive Matrix Factorization (PMF) model, UNMIX model, and multivariate statistical analysis models [14,15,16]. Among these models, PMF is particularly advanced and capable of accurately identifying and quantifying HM pollution in the environment. It does not require a source component spectrum for data processing, and both factor component spectrum and source contribution are non-negative. Additionally, it can handle missing data and data with large errors [17]. Due to these advantages, the PMF model is recommended by the U.S. Environmental Protection Agency and has been widely used to identify and quantify the sources of HM pollution [15,16,17,18].
Dabie Mountain, situated in East China, straddles the provinces of Anhui, Hubei, and Henan. It serves as the watershed dividing the Yangtze River and the Huai River. This mountain range plays a crucial role in water conservation for the middle and lower stretches of the Yangtze River, with numerous rivers feeding into it. Dabie Mountain can be categorized into three distinct sections based on its natural terrain: east, middle, and west. Rugged landscapes and significant soil erosion characterize the western part, leading to an importance in implementing vegetation restoration and protection measures to mitigate soil and water loss and uphold ecological equilibrium. On the other hand, despite being part of China’s historical revolutionary base area, the region’s economic development lags. However, significant progress has been made in recent years through industrial transformation and upgrading, distinctive agricultural development, and rural revitalization. As economic and social development progress, the issue of environmental pollution, particularly soil pollution, is becoming increasingly apparent. Therefore, it is crucial to understand the extent of soil pollution, particularly HM contamination, in key areas and to implement effective prevention and control measures alongside promoting economic and social growth. However, there is a lack of detailed reports on these aspects, highlighting the need for comprehensive assessment.
Conversely, variations in the accumulation patterns of soil HMs across different ecosystems, notably between artificial and natural ecosystems, may exist. Although researches have compared the soil HMs in different ecosystems or land use [3,19], there is a scarcity of comparative studies focusing on diverse ecosystems in mountains. Given the complex geology of the Dabie Mountain area, coupled with diverse soil parent materials, physico-chemical properties, and ecosystems, there is a crucial need for a comprehensive exploration of soil HM levels within these ecosystems. Investigating the origins and accumulation patterns of HMs across ecosystems in this area can significantly contribute to regional ecological preservation, economic development, and restoration efforts.
Hence, this study deeply explores the features and source elucidation of 10 prevalent HM elements in soils across diverse terrestrial ecosystems in western Dabie Mountain. Considering that soil properties (especially soil type and texture) affect the migration and transformation of HMs in soil [20], the impact of soil properties on HM was also analyzed. Moreover, the top layer in the soil profile is most closely related to external changes and humans; thus, we only analyzed the topsoils at the 0–20 cm layer. We focused on (i) discerning the variations in accumulation traits and pollution levels of soil HMs across diverse ecosystems and (ii) identifying their potential origins. Given the brief span of socio-economic advancement in the examined locale, we hypothesized that in western Dabie Mountain, (i) the distribution of HMs are together influenced by soil type, texture, and ecosystem; (ii) HM pollution levels are relatively minimal, particularly in natural ecosystems are significantly lower than in artificial ones; and (iii) natural factors predominantly contribute to HM sourcing.

2. Materials and Methods

2.1. Study Area Description

The study area is located in the western region of the Dabie Mountain (116°14′–116°41′ E, 30°27′–31°04′ N), spanning parts of Henan and Hubei provinces in China (Figure 1). The region falls within the warm and humid monsoon climate belt of the northern subtropical zone, characterized by typical mountain climate features, including mild temperatures, ample rainfall, and the simultaneous occurrence of rain and hot seasons. The average annual temperature in the area hovers around 17–18 °C, while the yearly precipitation stands at approximately 1100 mm. Most of the rainfall occurs during the period from May to July. The region boasts a diverse array of vegetation types, including evergreen broad-leaved forests, deciduous broad-leaved forests, and coniferous forests. As for land use, cropland and forest dominate, accounting for 51.57% and 34.46%, respectively, as of 2020, with construction land and scattered industrial areas making up the remainder.
According to the World Reference Base for Soil Resources (WBS) 2022, the study area’s soils are classified into four groups: Anthrosols, Fluvisols, Gleysols, and Alisols. Remote sensing and local statistical data indicate that Henan Province has a rich variety of mineral resources, comprising 10 metallic and 14 non-metallic minerals. The province boasts 73 mineral deposits, including 3 large, 4 medium, and 29 small deposits, as well as 37 mineral occurrences. In contrast, Hubei Province is primarily known for its non-metallic mineral resources, with smaller deposits that are more concentrated, such as phosphate and granite. The industrial and agricultural activities in the research area occasionally lead to pollution discharge, sewage irrigation, and the use of fertilizers and pesticides.

2.2. Soil Sampling

Between 2020 and 2022, soil sampling was carried out within the study area at a depth of 0–20 cm. Sampling units were established on a grid measuring 1 km × 1 km, with sampling points strategically placed in alignment with ecogeological classifications. Sampling efforts encompassed cropland, urban, and forest ecosystems. Cropland ecosystems primarily consist of regions where crops are cultivated continuously (ranges from 1–10 acres) and characterized by ongoing clearing, the removal of above-ground biomass (crop residue), and the levelling of farm fields. Urban ecosystems are mainly situated within cities, including residential areas, public management and service land, park green spaces, industrial zones, commercial service facilities, and road and transportation facilities. Forest ecosystems are comprised of biotic communities primarily consisting of trees, with the exception of urban forests. Initially, the basic sampling density was set at 9 samples/km2, with adjustments made to accommodate varying levels of ecogeological complexity. Consequently, the sampling density across the entire area ranged from 4 to 16 samples/km2.
At each sampling site, GPS coordinates were recorded during the sampling process. Following the removal of debris such as roots, fallen leaves, and gravel, soil samples were carefully mixed and transported to the laboratory for air drying. In the case of cropland soil, sampling took place after the harvest of the preceding crop and before the application of base fertilizer for the subsequent crop, with precautions taken to avoid the rainy season. In total, 702 soil samples were collected, comprising 252 from Henan and 450 from Hubei provinces, respectively.

2.3. Determination of Soil Physico-Chemical Properties and Heavy Metal Concentrations

Following air drying, the soils underwent grinding through 2 mm sieves to measure soil texture and pH value and through 0.149 mm sieves to ascertain organic matter and HM concentrations. During the soil texture determination, soil particle size was tested by using a laser particle size analyzer [21]. The percentage of soil clay (<0.002 mm), silt (0.002–0.05 mm), and sand (0.05–2 mm) were then calculated based on the soil particle size followed the USDA particle size classification system and were employed as indicators of soil texture. Soil pH value was determined with a compound electrode (MP551, China) in a water suspension with a 1:2.5 (w/w) soil: water ratio, and organic matter content was determined by the potassium dichromate oxidation method. According to the soil texture, the samples are divided into sandy, clayey, and loamy soil.
Except for Hg, the soil HMs’ concentrations (i.e., Cu, Pb, Zn, Cr, Ni, Co, Cd, As, and Mn) were determined according to the National Standard: Soil and sediment—Determination of 19 total metal elements—Inductively coupled plasma mass spectrometry (HJ 1315-2023). Briefly, approximately 0.1 g of each soil sample was weighed and transferred to a 50 mL polytetrafluoroethylene crucible. Subsequently, digestion was carried out using a mixture of “HNO3-HCl-HClO4”, and then to determine the HM concentrations, an inductively coupled plasma mass spectrometer (XSeries-2 ICP-MS, ThermoFisher, Waltham, MA, USA) was used. As for Hg, which is a volatile metal, its concentration was determined by a direct mercury analyzer (DMA-80, Milestone, Sorisole, Italy) and atomic fluorescence spectrometry (AFS) though measuring Hg vapor according to the National Standard: Soil quality—Determination of total mercury—Cold atomic absorption spectrophotometry (GB/T 17136-1997).

2.4. Evaluation Methods for Heavy Metal Pollution

The Enrichment factor (EF) and Geoaccumulation index (Igeo) [1] were employed to evaluate the extent of HM pollution. Additionally, the Potential Ecological Risk Index was utilized to gauge the ecological risk associated with these HMs [2,22]. When calculating the EF, the background value of metal concentration unaffected by human activity served as a reference point. Given the stable geochemical characteristics of Mn, it was designated as the reference metal. Furthermore, the Igeo developed by Muller was employed to comprehensively assess the influence of both natural processes and human interventions on sediment and soil. Meanwhile, the Potential Ecological Risk Index devised by Hakanson considers various factors, including the types of HMs, their concentrations, and their respective toxicity levels, making it a classic approach for evaluating the ecological risks associated with HM contamination. This method primarily involves the calculation of the Potential Ecological Risk Index (Ei) of each HM, as well as the Comprehensive Potential Ecological Risk Index (RI) considering multiple HMs [22]. The calculations for EF, Igeo, Ei, and RI are represented in Equations (1)–(4) [1,22,23,24].
E F = ( C i / C M n ) s ( C i / C M n ) b
I g e o = l o g 2 [ C i / (   k × B i ) ]
E i = T i × C i B i
R I = i = 1 n E i
where Ci represents the actual measured concentration of the target HM i, while CMn denotes the concentration of the reference metal Mn. The ratios (Ci/CMn)s and (Ci/CMn)b signify the concentrations of metal i and Mn in the target and background soil, respectively. Bi represents the background value of metal i, and K is a constant (typically k = 1.5) introduced to account for regions that might lead to fluctuations in background values [23]. Ti represents the toxicity coefficient of HM i, where the value is referenced from previous studies [22,25]. The coefficients for metal Cu, Pb, Zn, Cr, Ni, Co, Cd, As, Hg, and Mn are 5, 5, 1, 2, 5, 5, 30, 10, 40, and 1, respectively. In the above Equations, n = 10, denoting the total number of HMs considered.
The evaluation criteria for each index are represented in Table 1, and the evaluation of individual metal’s content is referred to National Standards: (1) Environmental quality standard for soils (GB 15618-1995); (2) Soil environment quality risk control standard for soil contamination of agriculture land (GB 15618-2018); and (3) Soil environment quality risk control standard for soil contamination of development land (GB 36600-2018).

2.5. Performance of PMF

The PMF model utilizes factor analysis and least squares methods to discern and quantify the sources of HMs [26,27]. Initially, the model factorizes the original matrix X(m × n) into factor matrices of F(p × n) and G(m × p), along with a residual matrix E(m × n) (Equation (5)). Subsequently, the model defines an objective function Q, which iteratively minimizes its value (Equation (6)) [27].
X(m × n) = G(m × p) × F(p × n) + E(m × n)
Q = i = 1 n j = 1 m ( e i j / s i j ) 2
where X(m × n), F(p × n), and G(m × p) denote the receptor matrix (the concentration of each component in each sample), factor spectrum matrix, and source contribution matrix, respectively. E(m × n) represents the residual matrix. Here, m, n, and p represent the number of samples, components, and sources, respectively. Sij signifies the standard deviation or uncertainty of the j-th chemical component in the i-th sample.

2.6. Statistical Analysis

Mixed linear models were employed to assess the differences in HM concentration and evaluation indices across various ecosystems and soil types (i.e., soil groups based on WBS 2022 and soil types based on texture). The ecosystem served as a fixed effect in the analysis. Before conducting the analysis, normality tests (Shapiro–Wilks) and tests for homogeneity of variances (Hartley’s F test) were carried out. Subsequently, Duncan’s multiple range test was utilized to assess the differences between the means. Additionally, Principal Component Analysis (PCA) and Pearson correlation analysis were employed to examine the relationships among the concentrations of the ten HMs and soil physico-chemical properties. PMF models were used to identify potential sources of HMs. Statistical analyses were conducted using R (v. 4.3.1), while PMF was implemented with EPA PMF v. 5.0. Significance was set at p < 0.05 for all tests unless explicitly stated otherwise.

3. Results

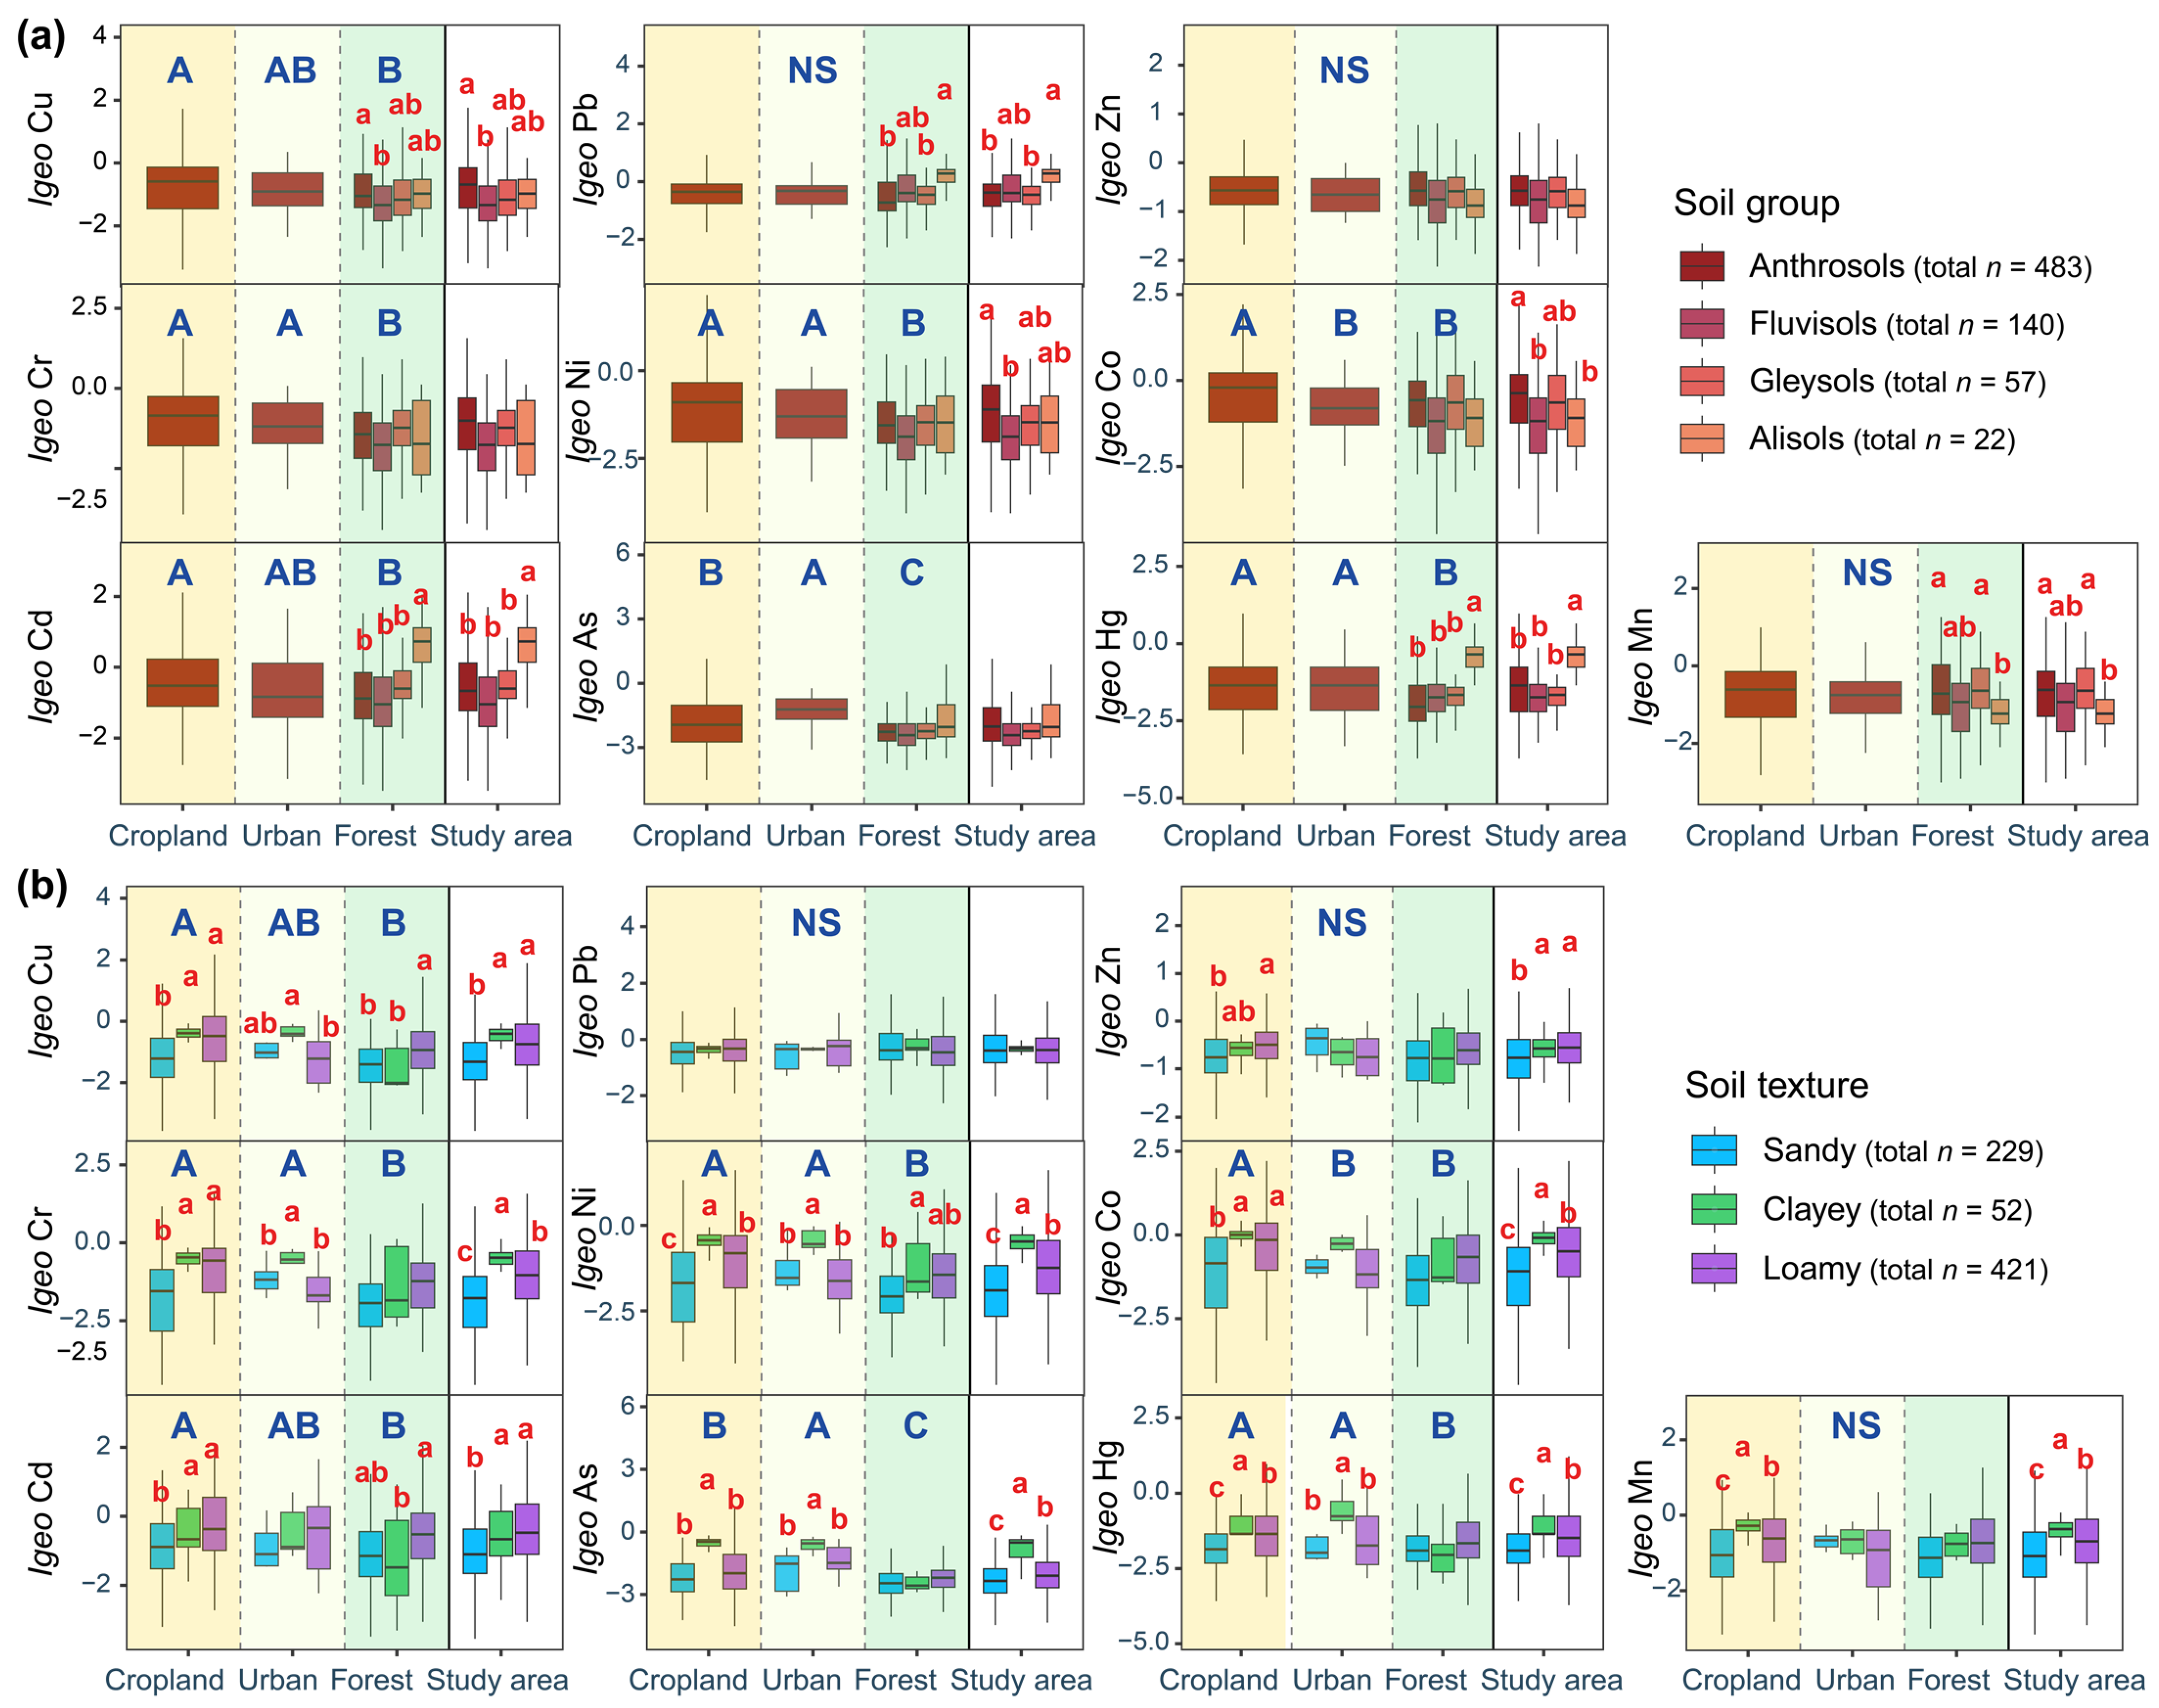
3.1. Soil Physico-Chemical Properties and Accumulation Characteristics of Heavy Metals

Similar to the land use situation in the study area, a large number of soil samples come from cropland and forest and dominated with Anthrosols (68.80%) and loamy soils (59.97%) (Table 2). The soil was neutral to slightly acidic, with an organic matter content of 1.88% (Table 3). The metals with the highest concentrations were Mn (693.67 mg/kg), Zn (79.36 mg/kg), and Cr (61.59 mg/kg). When compared to the background values, the average concentrations of these metals in Henan were significantly higher (p < 0.05). Cd in Henan was present at a concentration 2.04 times the background value. In contrast, in Hubei, only the concentrations of Pb, Zn, and Mn surpassed the background values, with Pb being 1.61 times higher than the background value. Across the study area, the concentrations of Pb and Cd were 1.68 and 1.27 times the background values, respectively.
Ecosystem or soil type significantly affected the soil pH and organic matter content, as well as the concentrations of HMs except As (p < 0.05, Table 4). Forests had higher organic matter content and lower pH values. The clay content and Cu and Cr concentrations were higher in cropland compared to urban and forest ecosystems (p < 0.05). For Ni, the concentration followed the trend cropland > urban > forest, while Co showed the trend cropland > forest > urban. There was no significant difference in the concentrations of Cu, Cr, Ni, and Co between urban and forest ecosystems (p > 0.05). However, the concentrations of Pb, Cd, and Hg were higher in forests than in cropland and urban ecosystems (p < 0.05). Among the four soil groups, pH and Cu, Zn, Cr, Co contents were higher in Anthrosols, but lowest in Alisols.

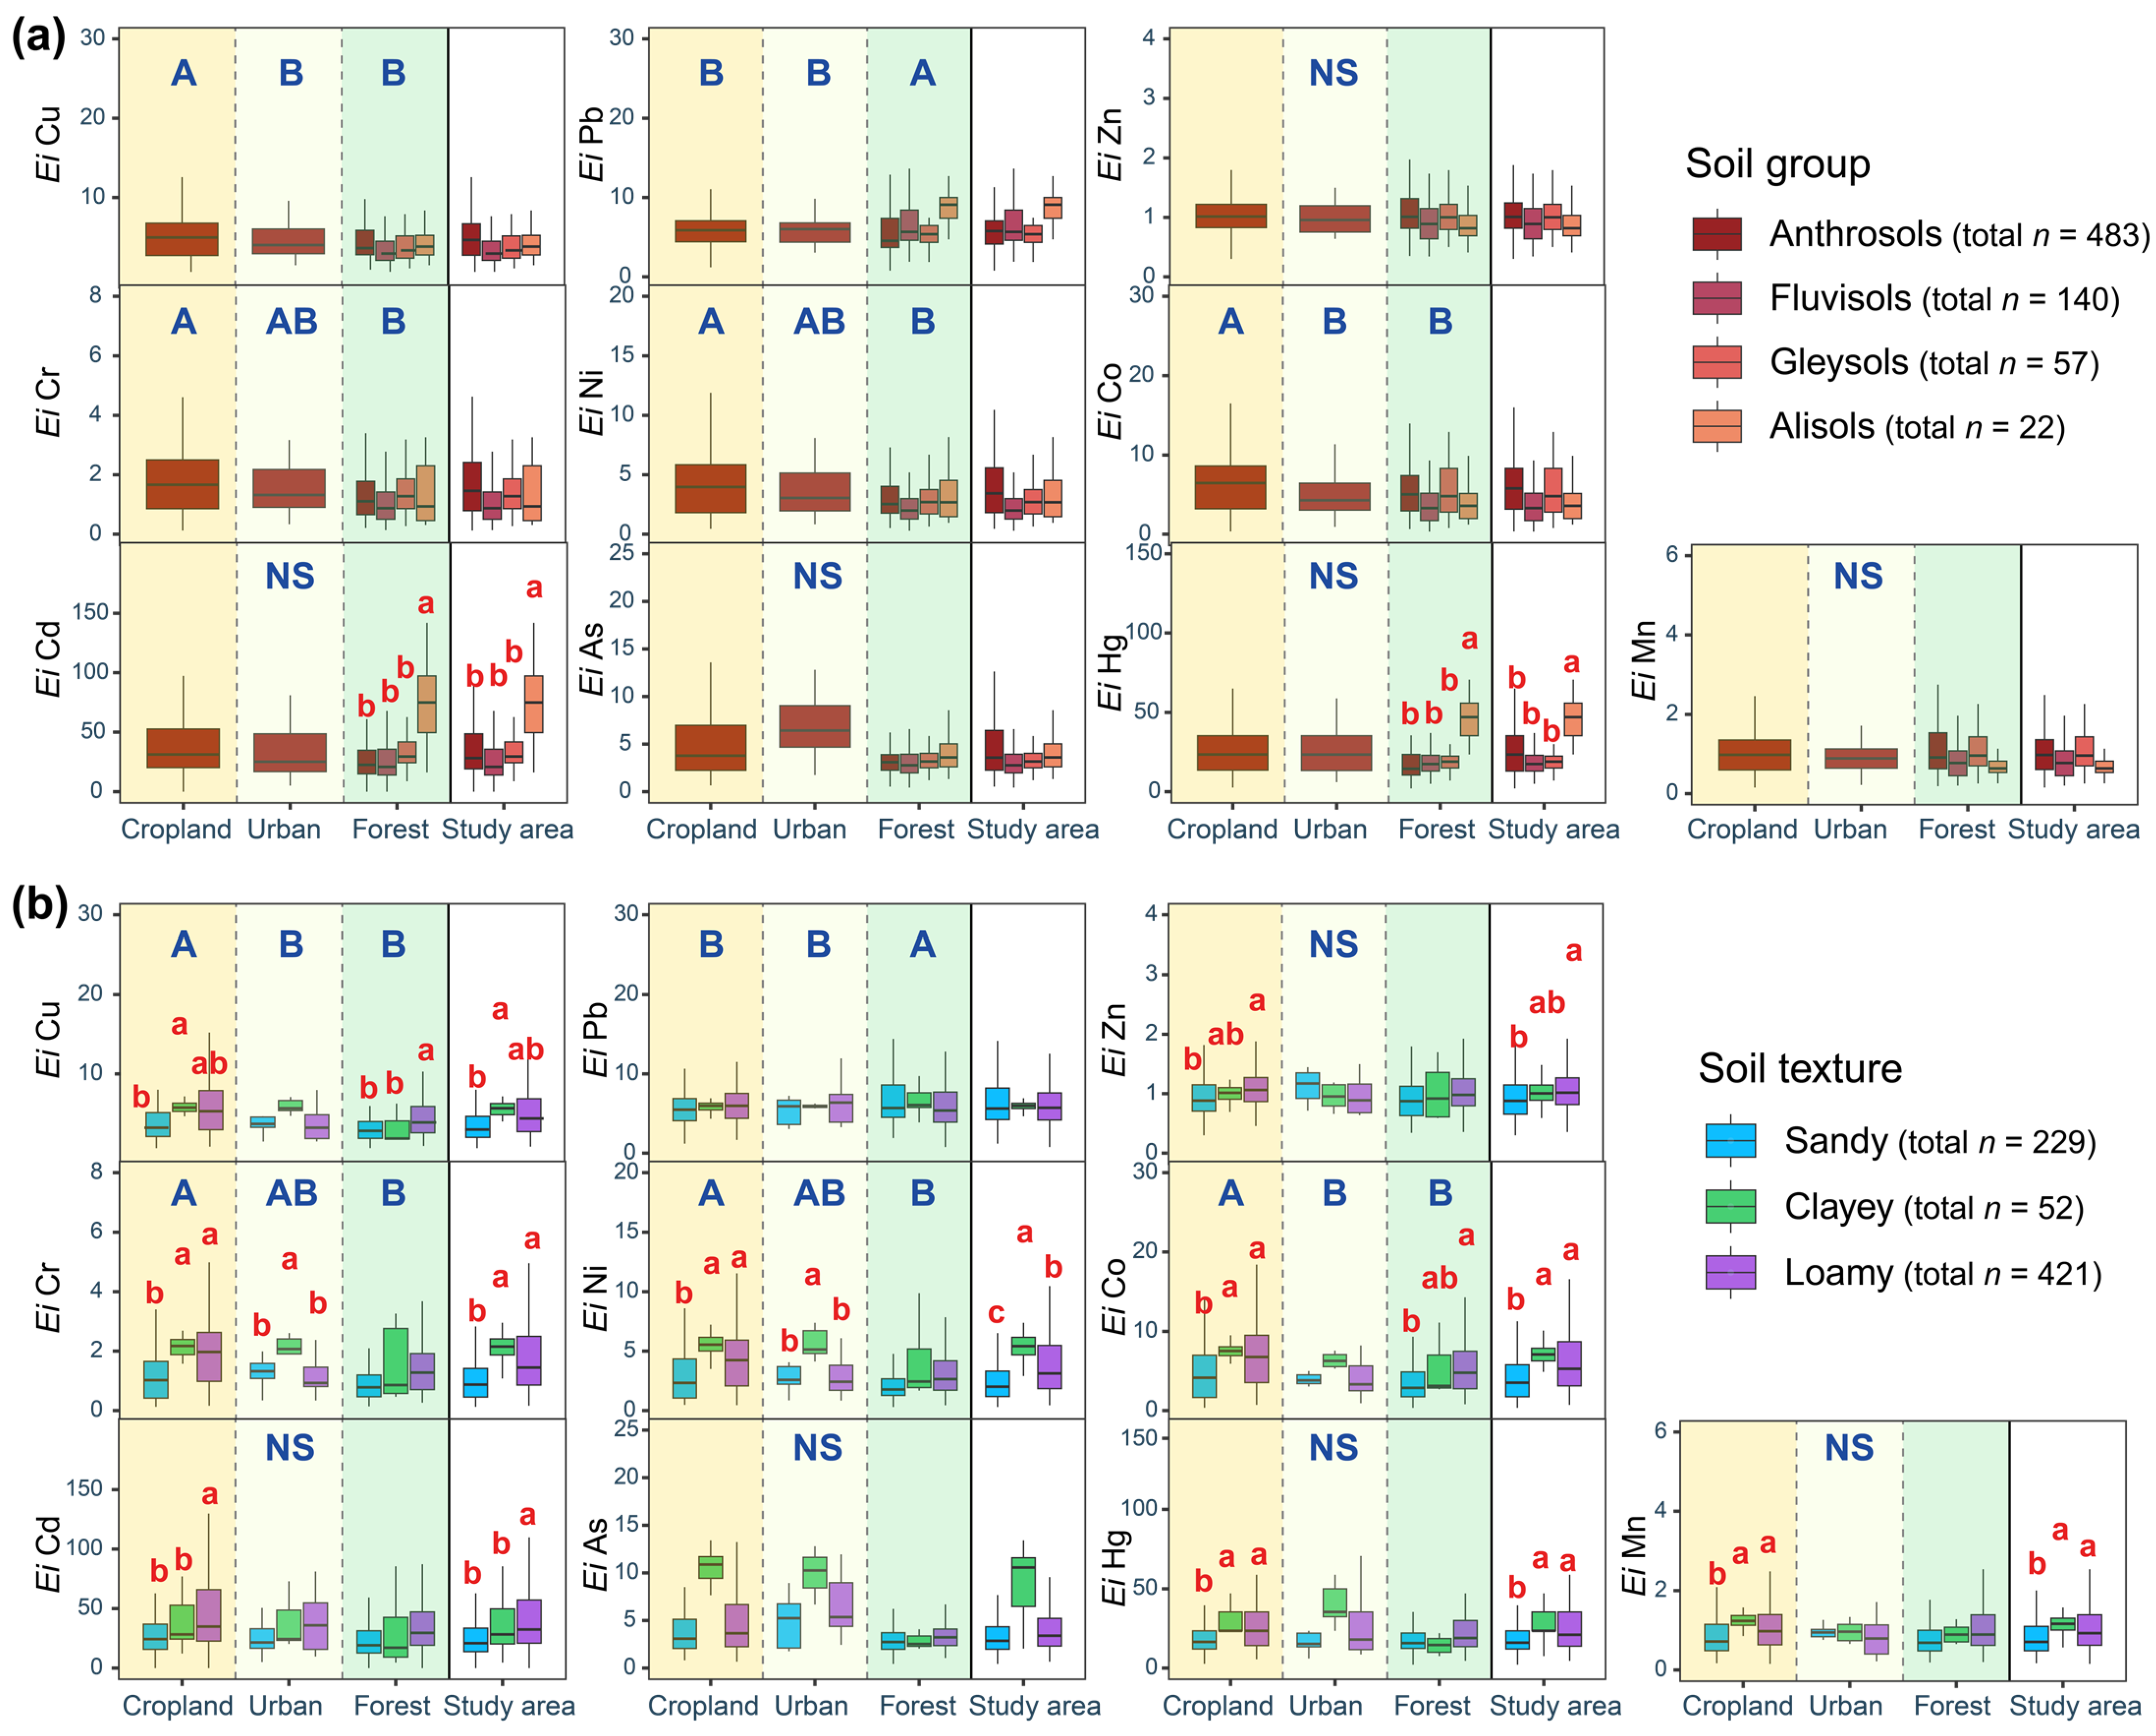
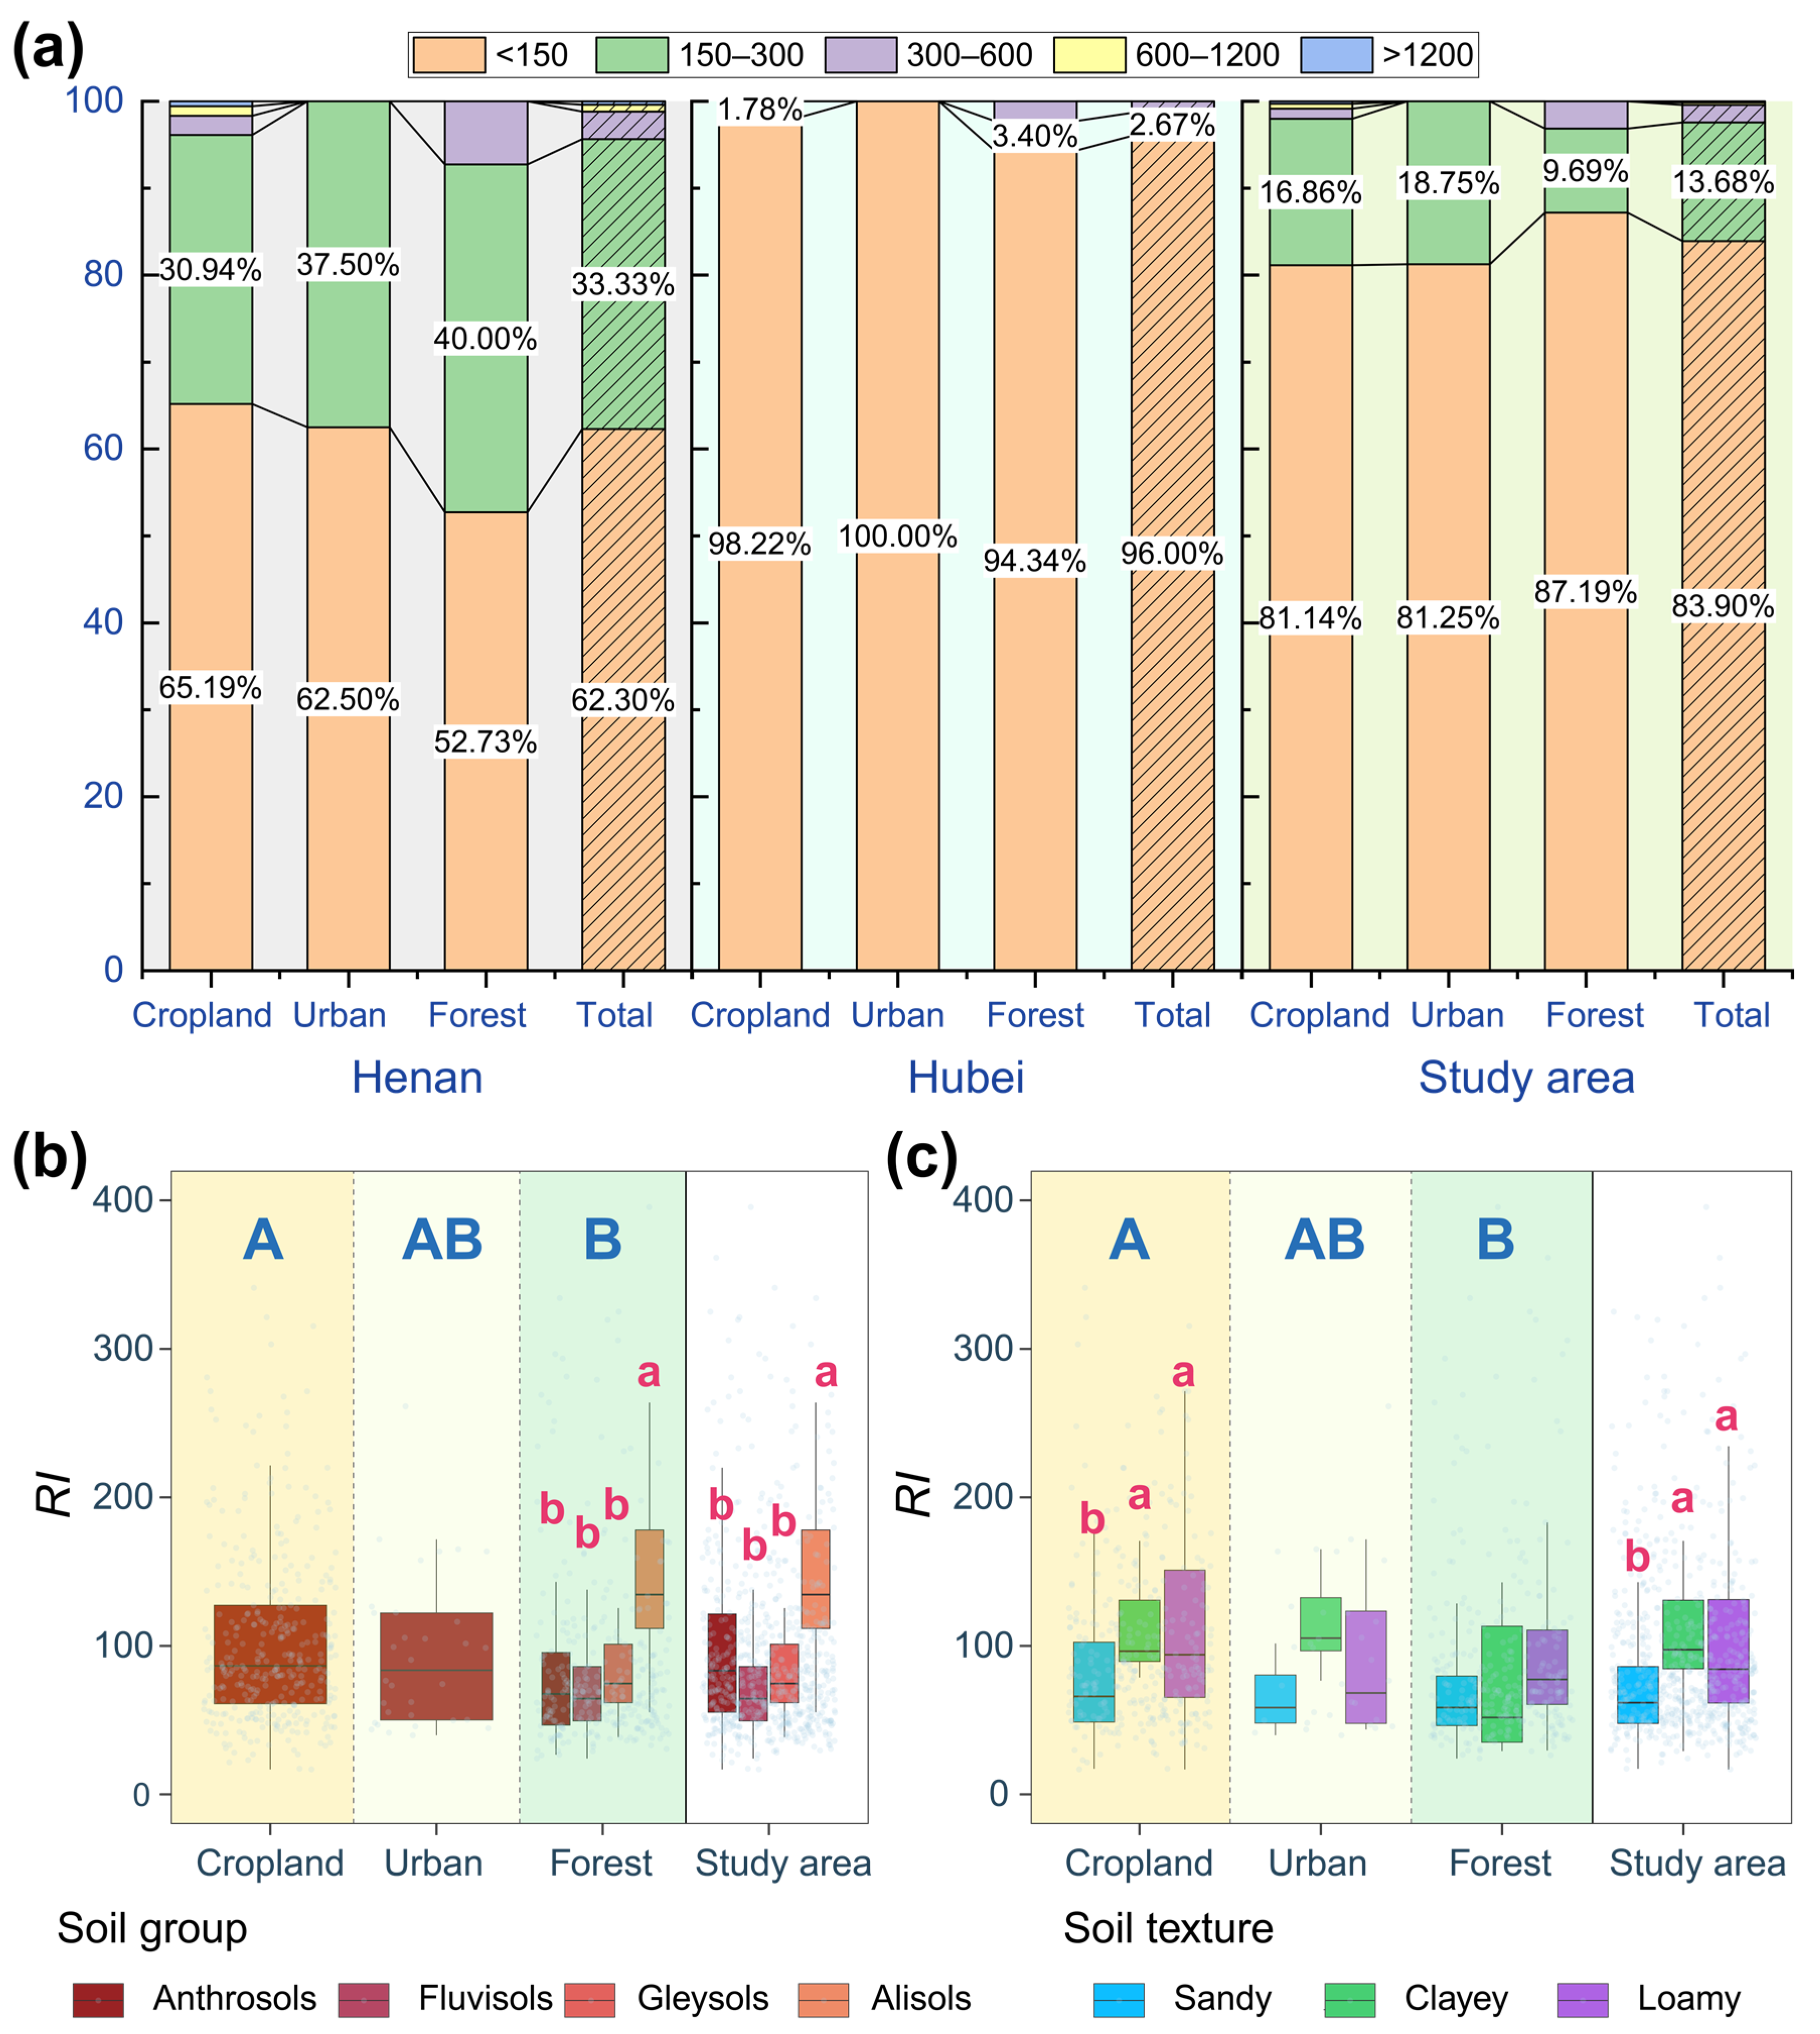
3.2. Pollution Status and Ecological Risk Assessment of Heavy Metals

The EF of HMs followed the order Pb > Cd > Cu > Zn > Co > As > Mn > Hg > Cr > Ni. According to Table 1, Hg, Cr, and Ni were considered pollution-free, while the other six metals were classified as mildly polluted. The type of ecosystem did not significantly affect the EF of Pb, Zn, Cd, Hg, and Mn (p > 0.05, Figure 2). However, the EF of Cu, Cr, and As was highest in cropland > urban > forest (p < 0.05). For Ni, the EF was similar in cropland and urban > forest (p < 0.05). For Co, the EF was highest in cropland > urban and forest (p < 0.05). The EFs of Pb, Ni, Cd, and Hg were also significantly affected by soil groups (p < 0.05), with the highest observed in Alisols. In addition, the influence of soil texture on EF was mainly manifested in cropland. The EFs of Cr, Ni, Co, and Cd in clay and loamy soils were higher than those in sandy soils, but those of Pb and Zn in sandy soils were the highest (p < 0.05).
The average Igeo of soil HMs in the study area were all <0, following the order: Pb > Cd > Zn > Co > Mn > Cu > Cr > Ni > Hg > As. The Igeo of Pb, Zn, and Mn did not significantly differ among ecosystems (p > 0.05, Figure 3). However, the Igeo for Cu and Cd were cropland > urban > forest (p < 0.05); Cr, Ni, and Hg were cropland > urban > forest (p < 0.05); and Co was cropland > urban > forest (p < 0.05), while As was urban > cropland > forest (p < 0.05). However, the soil group significantly affected the Igeo of Cu, Pb, Ni, Co, Cd, Hg, and Mn (p < 0.05). Among them, Cu, Ni, Co, and Mn were higher in Anthrosols, whereas Pb, Cd, and Hg were the highest in Alisols. Overall, except for Pb, the Igeo of the other HMs were significantly lower in sandy than in clay and loam soils (p < 0.05) and were widely present in various ecosystems.
All the Ei values of soil HMs were <40. The highest Ei values were for Cd (39.72) and Hg (26.99), followed by As (8.56) > Pb (8.08) > Co (6.06) > Cu (5.79) > Ni (3.83) > Cr (1.64) > Zn (1.07) > Mn (1.04). The ecosystem type significantly affected the Ei of Cu, Pb, Cr, Ni, and Co (p < 0.05, Figure 4). Specifically, the Ei of Cu and Co were higher in cropland than in urban and forest ecosystems (p < 0.05). The Ei for Cr and Ni followed the trend cropland > urban > forest (p < 0.05). However, the Ei for Pb was higher in forest compared to cropland and urban areas (p < 0.05). In addition, the Ei of Cd and Hg in Alisols were significantly higher than in other three soil groups (p < 0.05). Except for Pb and As, the Ei of other HMs in sandy soil were the lowest among the three soil texture types. Especially, its Ei of Cr, Ni, Co, Hg, and Mn were lower than those of clayey and loamy soils (p < 0.05).
The overall risk index (RI) in the study area was mostly <150 (Figure 5a), indicating a low ecological risk. Generally, the risk level of soil HMs in Henan was higher than in Hubei. The proportion of samples with an RI < 150 was 62.30% in Henan, 96.00% in Hubei, and 83.90% across the whole study area. The ecological risk level of HMs decreased in the order of cropland, urban, and forest ecosystems. Meanwhile, the RI of Alisols and sandy soils were higher and lower than other soil types, respectively (p < 0.05), while no significant differences were detected between other soil types (p > 0.05, Figure 5b,c).

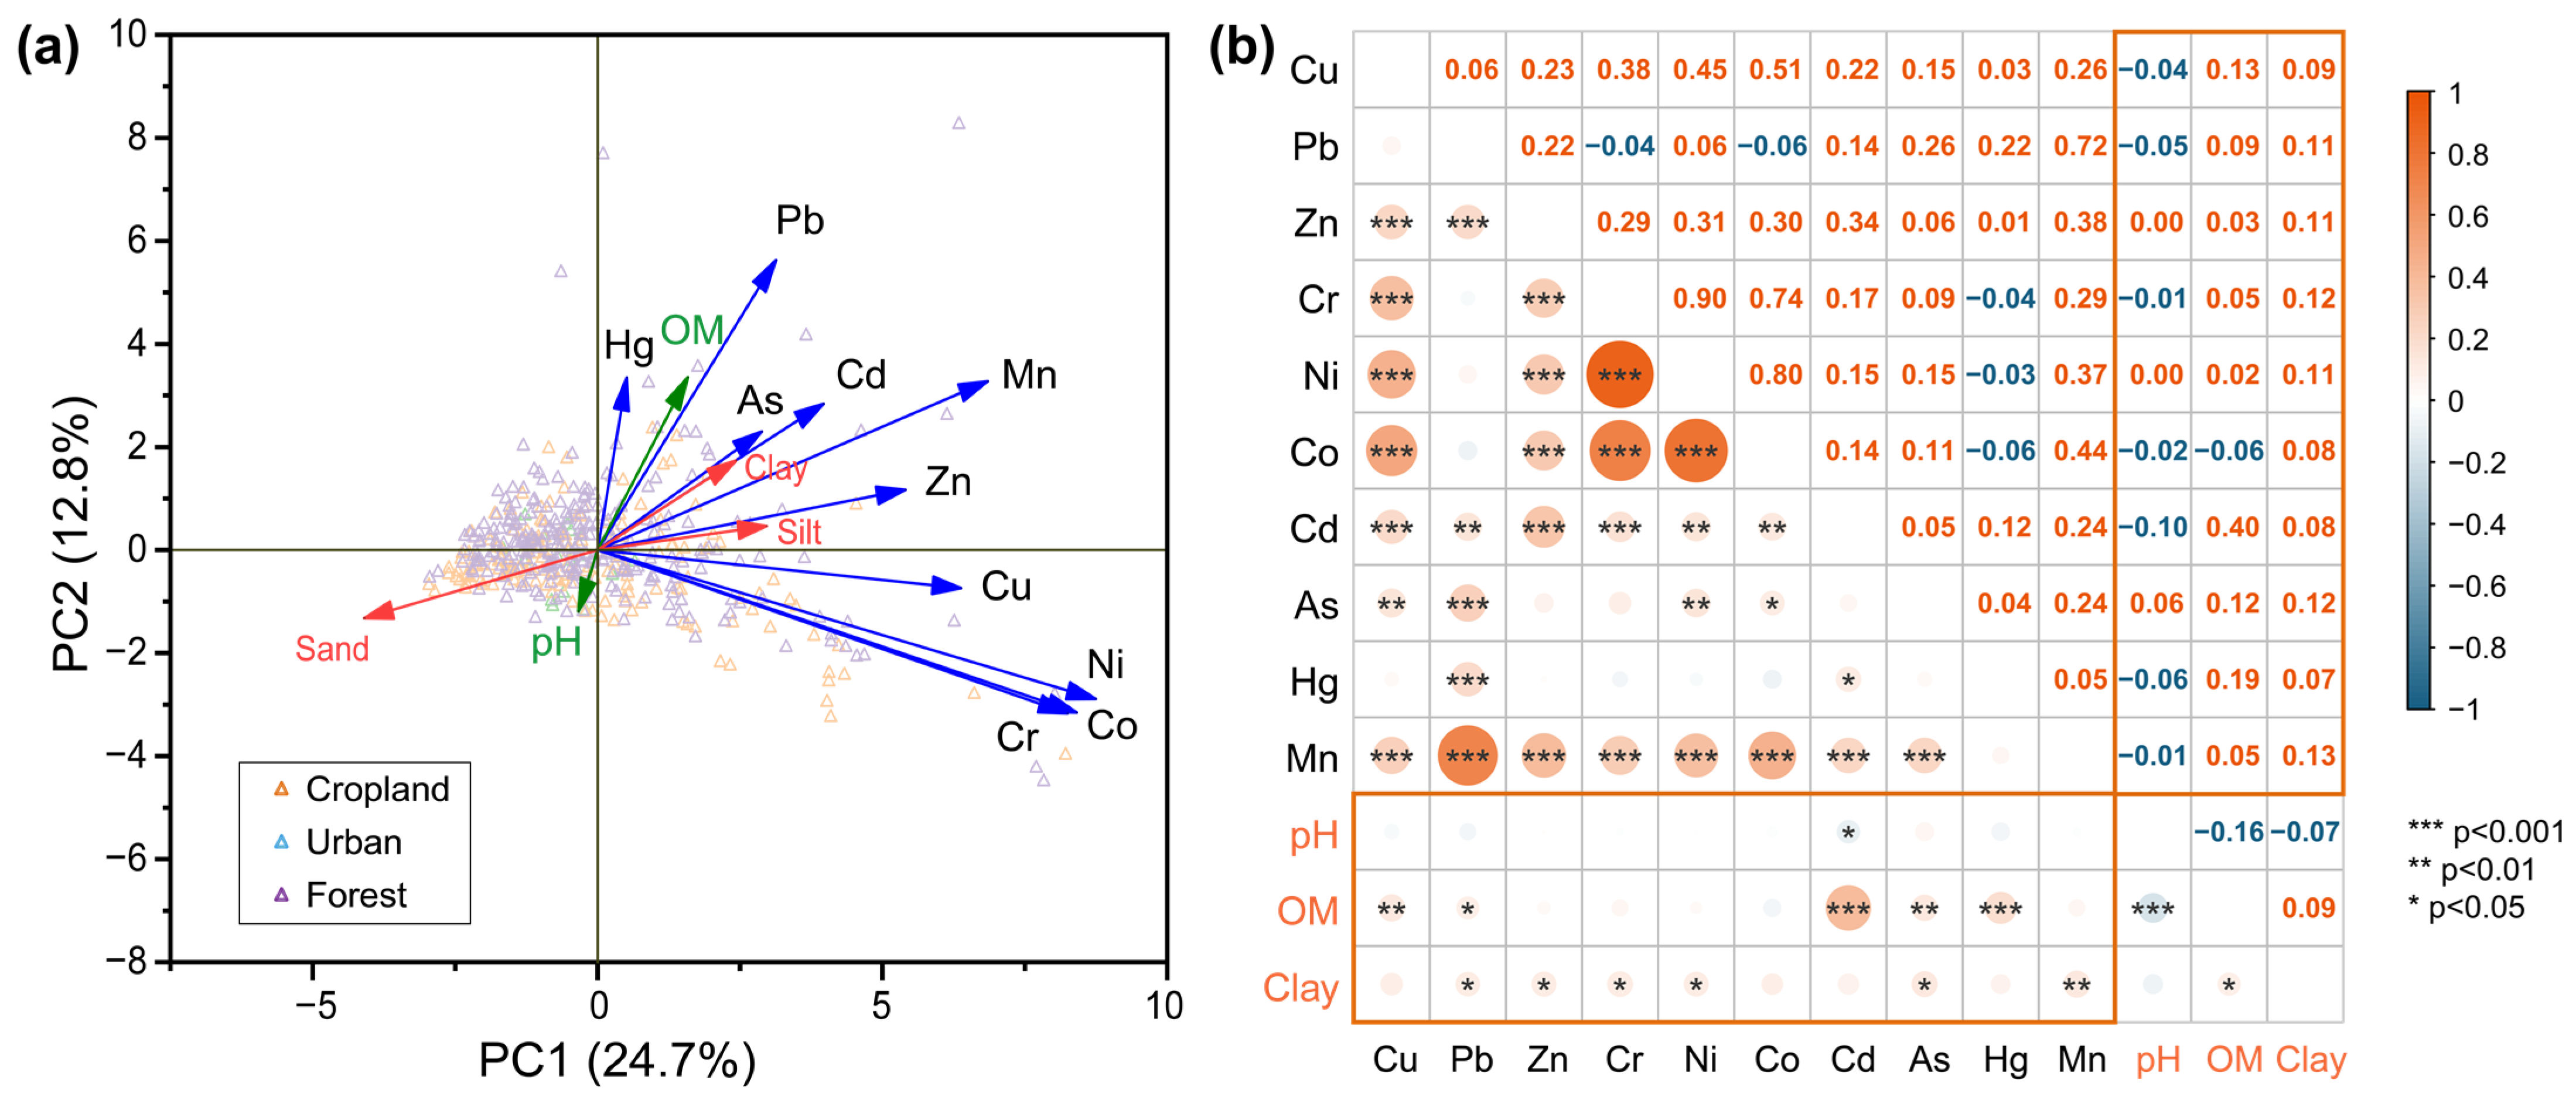
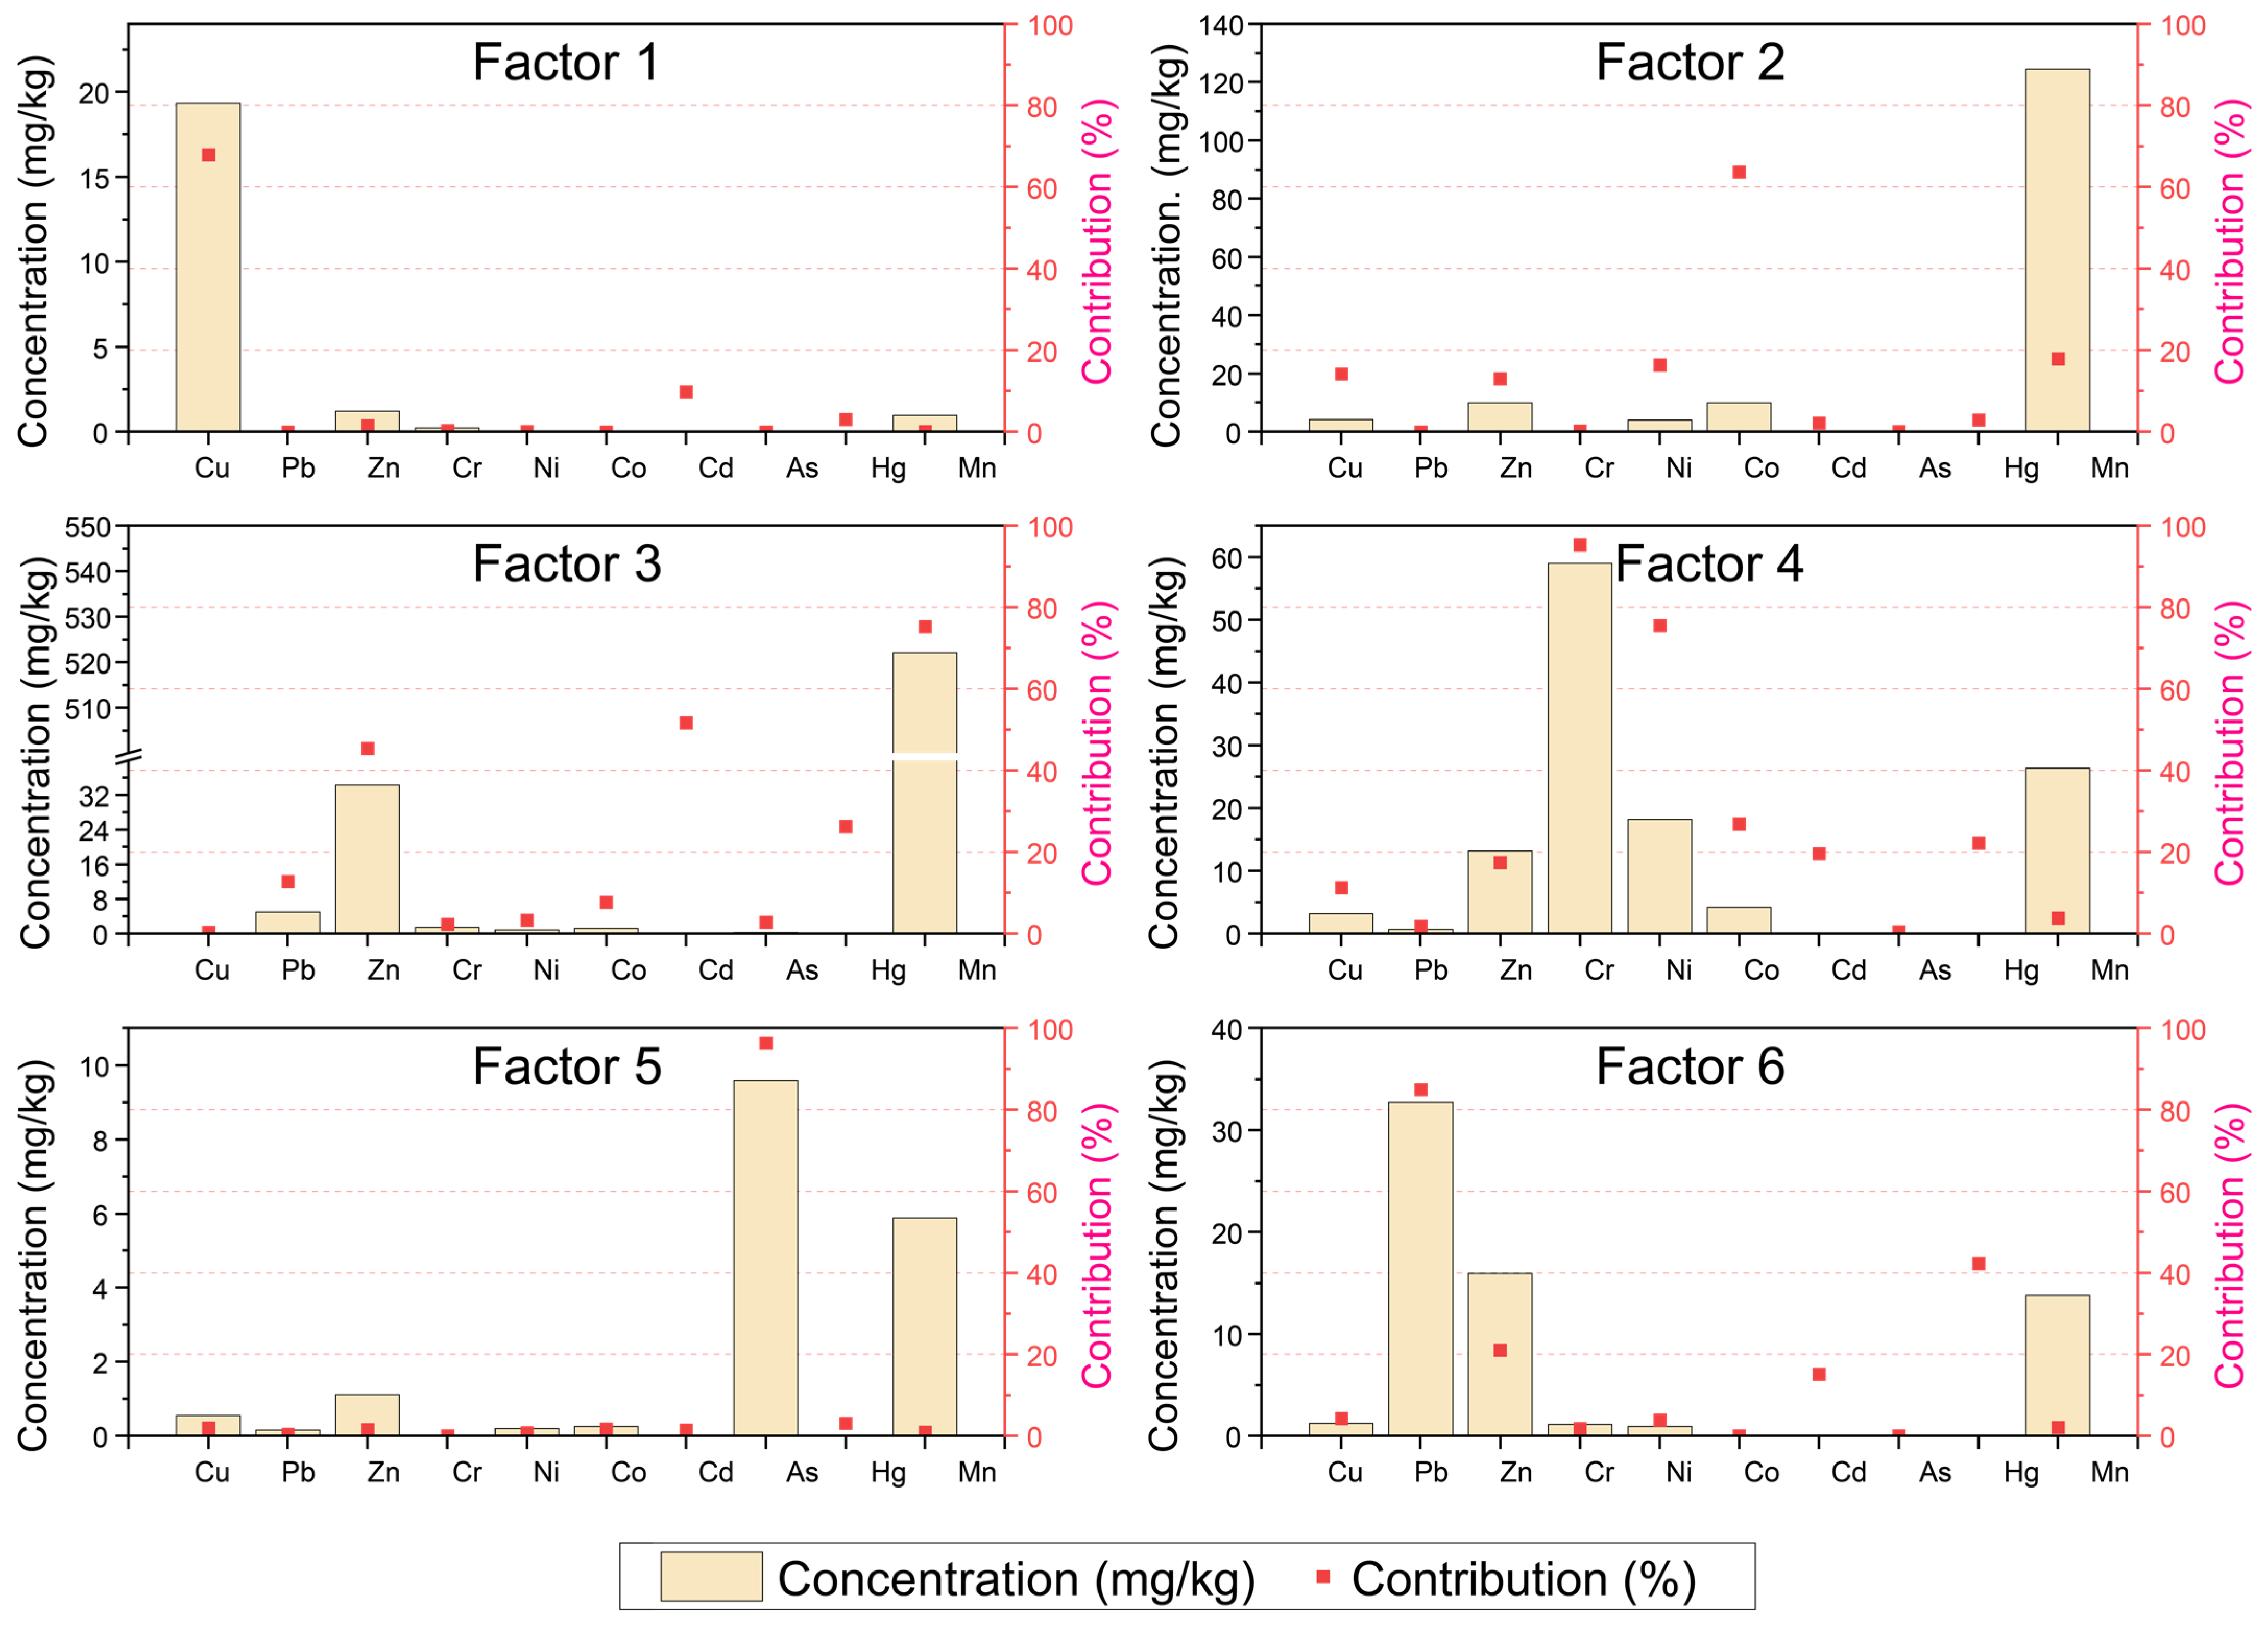
3.3. Analysis of Heavy Metal Sources

PCA indicates that PC1 and PC2 contributed 24.7% and 12.8%, respectively, to the variation in soil properties in the study area (Figure 6a). Clay and organic matter contents closely related to HMs. Ni, Co, Cr, and Mn had higher positive loadings in PC1, while Pb had a higher positive loading in PC2. The samples from urban ecosystems are mainly distributed in the left half of the graph, whereas those from forest ecosystems are primarily located in the right half.
The correlation analysis shows that the concentrations of most HMs in the soils had significant positive correlations (p < 0.05, Figure 6b). Specifically, Mn exhibited a significant positive correlation with all other metals (except Hg) (p < 0.05). Pb showed a significant positive correlation with Zn, Cd, As, Hg, and Mn (p < 0.05). Organic matter showed significant positive correlations with Cu, Pb, Cd, A, and Hg (p < 0.05). Clay showed significant positive correlations with metals other than Cu, Co, Cd, and Hg (p < 0.05). However, pH only significantly correlated with Cd (p < 0.05).
Based on the PMF model, a total of six comprehensive factors were identified as the sources of metal pollution (Figure 7). Factors 1–4 collectively accounted for 86.61% of the total sources. The main contributors for each factor were as follows: factor 1 was Cu (67.90%); factor 2 was Co (63.74%); and factor 3 was Mn (75.28%), Cd (51.73%), and Zn (45.36%). Factor 4 was Cr (95.29%) and Ni (75.54%). Factor 5 was mainly contributed by As (96.40%), while Pb (85.06%) and Hg (42.31%) contributed more to factor 6.

4. Discussion

4.1. Pollution Status and Ecological Risk of Heavy Metals

The analysis results based on our 702 samples indicate that the majority of soil in the western Dabie Mountain is not polluted by HMs (Figure 2, Figure 3 and Figure 4), and the proportion of samples with an ecological RI < 150 in the whole region was 83.90% (Figure 5), suggesting that the level of HM pollution can be negligible, and there is no potential ecological risk in this region. However, the average concentration of HMs (Table 3) and RI (Figure 5a) in Henan topsoil were all higher than in Hubei. Furthermore, all HM concentrations in Henan were higher than the background value, while only Pb, Zn, and Mn concentrations were higher than background values in Hubei (Table 3). These indicate a relatively low HM pollution in Hubei than in Henan. This discrepancy can be attributed to differences in human activities and environmental factors between the two provinces. First and foremost, according to our investigation, the mineral resources and mines in Henan are denser and larger, and mining activities are increasingly frequent. Consequently, this has resulted in more pronounced atmospheric deposition and soil HM accumulation in Henan. Secondly, Henan’s central location in China exposes it significantly to southwest winds [29], which transport particles laden with HMs from distant industrial regions and agricultural areas. This contributes to a broader distribution and higher contamination of HMs in soil.
In our study site, the soil HMs with the highest concentrations were Mn, Zn, and Cr (Table 3 and Table 4). Despite having high concentrations, their pollution level and risk level were low (Figure 2, Figure 3 and Figure 4). On the one hand, this indicates that using element concentration directly to represent pollution is one-sided, as there is a large amount of co-pollution in soils [11]. On the other hand, as an essential trace element in biological processes, for Mn, even if its concentration is high, as long as it does not surpass the level required by organisms, its potential ecological risk remains low. Also, Mn has relatively high environmental stability. Under certain environmental conditions, such as mild redox and low pH, Mn is not easily released from soil or water, which minimizes its direct impact on the environment [30].
Among the HMs analyzed, Pb and Cd exhibited the highest levels of pollution (Figure 2, Figure 3 and Figure 4). Notably, the concentration of Cd in Henan was 2.04 times the background value, while the concentration of Pb in Hubei was 1.61 times the background value (Table 3). This suggests that Pb and Cd were significantly enriched in the soil of the study area. Additionally, the Ei indicates that Cd and Hg present the highest risk levels (Figure 4) primarily because of their high toxicity coefficients. Both Cd and Hg can pose serious threats to human health and natural environment [1,31]. Nevertheless, when assessing their ecological risks, it is essential to take into account their different forms and transformation properties [1]. Therefore, future efforts to remediate and prevent HM pollution in the western Dabie Mountain should prioritize Cd, Pb, and Hg. However, given that Hg ranks 10th or 9th in concentration, EF, and Igeo among the 10 HMs detected, the immediate focus should be on Cd and Pb, while Hg does not require urgent attention at this moment.

4.2. Effects of Ecosystem and Soil Type on Heavy Metal Pollution Status and Ecological Risk

Ecosystem, soil type, and texture significantly affected the concentration (Table 4), pollution status, and ecological risk (Figure 2, Figure 3, Figure 4 and Figure 5) of most topsoil HMs in the study area. This confirms our hypothesis 1. Similar to our hypothesis 2, the pollution levels and ecological risks of most HMs were lower in natural ecosystems (i.e., forest) than in artificial ecosystems (i.e., cropland and urban ecosystems). Human activities, particularly agricultural practices such as the use of fertilizers and pesticides, along with industrial production, have elevated soil HM levels in these artificial ecosystems [19]. Wastewater irrigation and atmospheric deposition also contributed significantly to the accumulation of HMs in soil. In economically developing regions of Dabie Mountain, the absence of effective management measures coupled with prolonged agricultural activities can degrade soil structure and function, facilitating the migration and accumulation of HMs. Conversely, soil in natural ecosystems possesses better structure and fertility, eliminating the need for chemical fertilizers to support plant growth. In these environments, HMs can be degraded or transformed through absorption, microbial activity, and chemical reactions, assisting in mitigating potential environmental risks [19,32]. The high risk of topsoil HM in cropland and urban ecosystems is closely related to HM inputs resulting from agricultural and industrial activities.
Generally, among the four soil groups, Anthrosols were more likely to accumulate Cu and Co, while Alisols had a higher ability to accumulate Pb, Cd, and Hg and had a higher overall ecological risk. The concentration and potential risk of Cu, as well as the pollution level and potential risk of Co in cropland, were higher than in urban and forest ecosystems (Figure 2, Figure 3, Figure 4 and Figure 5). This suggests that Cu and Co tend to accumulate more easily in cropland, and then indirectly explains why Anthrosols are prone to accumulate Cu and Co, since Anthrosols in the study area were mainly distributed in cropland (Table 2). The primary sources of Cu in soil are chemical fertilizers, pesticides, fungicides and insecticides [33]. Agricultural activities, especially the application of fertilizers and pesticides containing Cu, elevate the soil Cu content. Higher concentrations in Cu and other metals are observed in soils and sediments of agricultural basins [34,35]. Because Co is an essential micronutrient for plant growth [36], Co-containing fertilizers are commonly used in agriculture to enhance crop yield and quality. In addition, Anthrosols, especially paddy soils, often undergo an alternation of redoxes. This leads to the changes in the solubility, migration, and precipitation behavior of metal elements in the soil [37,38]. Cu and Co may be more easy to accumulate in an insoluble form under certain redox conditions. The higher clay content (Table 4) and lower permeability in Anthrosols and cropland can also increase the soil’s ability to adsorb HMs. Altered soil pores and structures caused by artificial cultivations and higher organic matter content from litter and plant residuals may be other reasons for the higher HM pollution and risk in Anthrosols and cropland, as shown from the positive correlations between organic matter and HM (Figure 6). Similarly, the higher RI in clay and loamy soils than in sandy soils (Figure 5) is mainly because their high organic matter and clay content easily adsorb HM. However, as for the individual HM, it may be more directly attributed to the relations with other environmental and meteorological factors such as emission sources and wind. This requires further research.
We also found that the type of ecosystem did not influence the concentrations, pollution levels, or potential risk of Zn and Mn in the soil of the study area, and they neither affected by soil groups In China, Mn primarily enters the soil naturally through geological processes and rock weathering [39], whereas the composition of soil parent material largely determines the presence of Zn [40]. Therefore, the relatively same parent rocks in the study area are likely a key factor. This is supported by our findings of low variation coefficients (Table 3) and significant positive correlation between Zn and Mn (Figure 6).

4.3. Main Sources of Heavy Metals

According to the PMF model, six factors have been identified as sources of HMs (Figure 7), with factors 1–4 being more clearly defined. The primary contributor to factor 1 was Cu, which accounted for 67.90%. As previously mentioned, the main anthropogenic sources of Cu in soils are Cu-containing fertilizers and pesticides, as well as wastewater irrigation. Thus, factor 1 can be attributed to agricultural activities. This aligns with our findings that the concentration, pollution, and potential ecological risk of Cu are highest in croplands among the three ecosystems. As for factor 2 in the PMF, its primary contributor was Co. The Co in Chinese soil primarily originates from soil parent material and rock weathering [19]. Therefore, factor 2 can be attributed to the natural processes of soil parent material and rock weathering.
Similarly, Mn, Cd, and Zn were the primary contributors to factor 3. Mn in the soil primarily originates from the parent material; in particular, in rocks rich in Mn oxides, Mn is released into the soil through natural oxidation and weathering [39]. On the contrary, in central, southern, and southwestern China, where mining is prominent, the distribution of Cd in the environment is influenced by industrial activities [3], with mining being the primary source of Zn pollution in soil [41]. Therefore, factor 3 can be attributed to both soil parent material and mining as sources.
Cr and Ni primarily contributed to factor 4. Chromite serves as the primary mineral source of Cr [42], with the majority of global chromium ore production originating from chromite. Human activities like industrial emissions, leather tanning, electroplating, steel manufacturing, and other domestic issues are significant contributors to Cr levels in the environment [3,43]. Conversely, mining, combustion of fossil fuels, application of pesticides and fertilizers, emissions from vehicles, and atmospheric deposition are the primary factors contributing to soil Ni enrichment [10,19]. Under the influence of urbanization and industrialization, man-made sources have emerged as the primary contributors to HM pollution. Therefore, factor 4 can be regarded as encompassing anthropogenic sources, including industrial activities, vehicle emissions, and similar human-related activities.
Additionally, PCA indicates that Ni, Co, Cr, and Mn exhibited high positive loads in PC1, and they positively correlated with each other (Figure 6), implying they share similar origins. Based on the previous discussions, we may conclude that PC1 is dominated by natural factors such as soil parent material and rock weathering. This is basically consistent with the larger proportion of factors 2 and 3 representing natural sources in the PMF. Since PC1 contributed 24.7% in the study area (Figure 6), natural factors predominantly contributed to HM sourcing in our study. These validate our hypothesis 3. Also, samples from the natural ecosystem which are clustered on the right side of the PCA plot further reinforce our inference. Conversely, Pb exhibited a higher positive load in PC2 (Figure 6). The impact of human activities on soil Pb pollution outweighs that of natural factors [41]. Mining, smelting, municipal waste incineration, and industrial and vehicle emissions can directly release substantial amounts of Pb into the environment [3,41]. Thus, PC2 is related to human activities. Based on our results, special attention needs to be paid to Pb and Cd in the soil of western Dabie Mountain. Considering the potential sources indicated by PMF models, future endeavors to prevent and control HM pollution is recommended to concentrate on mitigating the impact of mining, smelting, and industrial emissions.
Although we have assessed the HM pollution status and ecological risk in the topsoils of various ecosystems and soil types in western Dabie Mountain, there are still numerous areas for future exploration. For instance, the accumulation and migration pathways of HMs are diverse, including industrial emissions, urban waste, pesticide use, atmospheric deposition, and others. The lack of specific data on HM input sources related to agriculture and industry, such as HM species and concentrations in fertilizers and insecticides, as well as emissions, along with meteorological factors, hinders the accurate determination of HM sources. Existing data only allow for the general analysis of potential sources of HMs using PMF, rather than identifying sources for each individual HM. Moreover, as soil depth increases, particularly in forest soils, the forms and concentrations of HMs undergo significant changes [44]. Their transformation in soil is closely linked to soil colloid properties, oxide adsorption capacity, redox state, and other factors. Therefore, additional relevant data are necessary to pinpoint the sources of HMs, enabling a better understanding of their migration patterns and mechanisms.

5. Conclusions

Extensive soil sampling was conducted in the western Dabie Mountain to investigate the distribution, pollution status, and potential ecological risks of ten HMs across various ecosystem and soil types. Our findings indicate that HM pollution in the topsoil can be disregarded, with minimal potential ecological risk observed. Ecosystem, soil type, and texture jointly affected the distribution and potential ecological risks of topsoil HM. The potential ecological risk of topsoil HMs decreased from croplands to urban and further to forests. The risk of overall HMs in Alisols was higher than in Anthrosols, Fluvisols, and Gleysols, while in sandy soil, the risk was lower than in clayey and loamy soils. The HMs were very likely primarily originate from natural factors like soil parent material and rock weathering, with additional contributions from anthropogenic sources, including agricultural activities, mining, industrial activities, and vehicle emissions. These further imply that the accumulation pattern and potential ecological risk of HMs are affected by diverse sources in different ecosystems in the western Dabie Mountain. Notably, Pb and Cd are HMs that warrant particular attention due to their high concentrations and potential ecological risks. To mitigate HM pollution in the region, future efforts are recommended to focused on reducing mining, smelting, and industrial emissions, as well strengthening research on the migration and transformation of co-pollutant in different systems.

Author Contributions

F.W. and M.L.: conceptualization, methodology, supervision. T.Y. and F.W.: writing—review and editing. J.X. and Y.Y.: data curation, writing—review and editing. X.N., F.C., Y.R., F.L., W.H. and T.L.: field work, investigation, writing—original draft. All authors have read and agreed to the published version of the manuscript.

Funding

This research was supported by the grants from China Geological Survey (CGS) (DD20230479, DD20220865, and ZD20220212), and Postgraduate Education and Teaching Reform Project of Hubei University (JGYJS202225).

Data Availability Statement

The data that support the findings of this study are available from the corresponding author upon reasonable request.

Acknowledgments

We would like to thank Canlin Chen for participating in the laboratory work and data processing.

Conflicts of Interest

The authors declare that they have no known competing financial interests or personal relationships that could have appeared to influence the work reported in this paper.

References

  1. Chen, L.; Luo, X.; He, H.; Duan, T.; Zhou, Y.; Yang, L.; Zeng, Y.; Chen, H.; Fang, L. Hg-mining-induced soil pollution by potentially toxic metal(loid)s presents a potential environmental risk and threat to human health: A global meta-analysis. Soil Ecol. Lett. 2024, 6, 240233. [Google Scholar] [CrossRef]
  2. Yaşar Korkanç, S.; Korkanç, M.; Amiri, A.F. Effects of land use/cover change on heavy metal distribution of soils in wetlands and ecological risk assessment. Sci. Total Environ. 2024, 923, 171603. [Google Scholar] [CrossRef] [PubMed]
  3. Du, H.; Wang, J.; Wang, Y.; Yao, Y.; Liu, X.; Zhou, Y. Contamination characteristics, source analysis, and spatial prediction of soil heavy metal concentrations on the Qinghai-Tibet Plateau. J. Soils Sediments 2023, 23, 2202–2215. [Google Scholar] [CrossRef]
  4. Hou, D.; O’Connor, D.; Nathanail, P.; Tian, L.; Ma, Y. Integrated GIS and multivariate statistical analysis for regional scale assessment of heavy metal soil contamination: A critical review. Environ. Pollut. 2017, 231, 1188–1200. [Google Scholar] [CrossRef]
  5. Mensah, A.K.; Addai, P. Cadmium, Cu, Hg, Sb, Se and Ti contamination in abandoned and active mining sites in Ghana shows concerns for soil and human health risks. Environ. Adv. 2024, 15, 100500. [Google Scholar] [CrossRef]
  6. Goncharov, G.; Soktoev, B.; Farkhutdinov, I.; Matveenko, I. Heavy metals in urban soil: Contamination levels, spatial distribution and human health risk assessment (the case of Ufa city, Russia). Environ. Res. 2024, 2024, 119216. [Google Scholar] [CrossRef]
  7. Suciu, N.A.; De Vivo, R.; Rizzati, N.; Capri, E. Cd content in phosphate fertilizer: Which potential risk for the environment and human health? Curr. Opin. Environ. Sci. Health 2022, 30, 100392. [Google Scholar] [CrossRef]
  8. Li, B.; Wu, G.; Yang, X.; Li, Z.; Albasher, G.; Alsultan, N.; Memon, A.A.; Afridi, H.I. Correlation of endocrine disrupting chemicals with essential elements in biological samples of children (1–5 years) with different infectious diseases and impact on sustainable outdoor activities. Environ. Res. 2023, 229, 115781. [Google Scholar] [CrossRef] [PubMed]
  9. Islam, M.S.; Nur-E-Alam, M.; Iqbal, M.A.; Khan, M.B.; Al Mamun, S.; Miah, M.Y.; Rasheduzzaman, M.; Appalasamy, S.; Salam, M.A. Spatial distribution of heavy metal abundance at distance gradients of roadside agricultural soil from the busiest highway in Bangladesh: A multi-index integration approach. Environ. Res. 2024, 250, 118551. [Google Scholar] [CrossRef] [PubMed]
  10. Banerjee, S.; Ghosh, S.; Jha, S.; Kumar, S.; Mondal, G.; Sarkar, D.; Datta, R.; Mukherjee, A.; Bhattacharyya, P. Assessing pollution and health risks from chromite mine tailings contaminated soils in India by employing synergistic statistical approaches. Sci. Total Environ. 2023, 880, 163228. [Google Scholar] [CrossRef]
  11. Oyebamiji, A.O.; Olaolorun, O.A.; Popoola, O.J.; Zafar, T. Assessment of heavy metal pollution in soils of Jebba Area, Nigeria: Concentrations, source analysis and implications for ecological and human health risks. Sci. Total Environ. 2024, 945, 173860. [Google Scholar] [CrossRef] [PubMed]
  12. Kim, S.; Jeong, S.; An, Y. Application of a soil quality assessment system using ecotoxicological indicators to evaluate contaminated and remediated soils. Environ. Geochem. Health 2020, 42, 1681–1690. [Google Scholar] [CrossRef] [PubMed]
  13. Askari, M.S.; Alamdari, P.; Chahardoli, S.; Afshari, A. Quantification of heavy metal pollution for environmental assessment of soil condition. Environ. Monit. Assess. 2020, 192, 162. [Google Scholar] [CrossRef]
  14. Chen, Z.F.; Ding, Y.F.; Jiang, X.Y.; Duan, H.J.; Ruan, X.L.; Li, Z.H.; Li, Y.P. Combination of UNMIX, PMF model and Pb-Zn-Cu isotopic compositions for quantitative source apportionment of heavy metals in suburban agricultural soils. Ecotoxicol. Environ. Saf. 2022, 234, 113369. [Google Scholar] [CrossRef] [PubMed]
  15. Singh, S.; Maiti, S.K.; Raj, D. An approach to quantify heavy metals and their source apportionment in coal mine soil: A study through PMF model. Environ. Monit. Assess. 2023, 195, 306. [Google Scholar] [CrossRef]
  16. Anaman, R.; Peng, C.; Jiang, Z.C.; Liu, X.; Zhou, Z.R.; Guo, Z.H.; Xiao, X.Y. Identifying sources and transport routes of heavy metals in soil with different land uses around a smelting site by GIS based PCA and PMF. Sci. Total Environ. 2022, 823, 153759. [Google Scholar] [CrossRef]
  17. Shao, F.; Li, K.; Ouyang, D.; Zhou, J.; Luo, Y.; Zhang, H. Sources apportionments of heavy metal(loid)s in the farmland soils close to industrial parks: Integrated application of positive matrix factorization (PMF) and cadmium isotopic fractionation. Sci. Total Environ. 2024, 924, 171598. [Google Scholar] [CrossRef]
  18. Zhou, H.; Yue, X.; Chen, Y.; Liu, Y. Source-specific probabilistic contamination risk and health risk assessment of soil heavy metals in a typical ancient mining area. Sci. Total Environ. 2024, 906, 167772. [Google Scholar] [CrossRef]
  19. Luo, X.; Bing, H.; Luo, Z.; Wang, Y.; Jin, L. Impacts of atmospheric particulate matter pollution on environmental biogeochemistry of trace metals in soil-plant system: A review. Environ. Pollut. 2019, 255, 113138. [Google Scholar] [CrossRef]
  20. Mai, X.; Tang, J.; Tang, J.; Zhu, X.; Yang, Z.; Liu, X.; Zhuang, X.; Feng, G.; Tang, L. Research progress on the environmental risk assessment and remediation technologies of heavy metal pollution in agricultural soil. J. Environ. Sci. 2025, 149, 1–20. [Google Scholar] [CrossRef]
  21. Yang, X.L.; Zhang, Q.Y.; Li, X.Z.; Jia, X.X.; Wei, X.R.; Shao, M.A. Determination of Soil Texture by Laser Diffraction Method. Soil Sci. Soc. Am. J. 2015, 79, 1556–1566. [Google Scholar] [CrossRef]
  22. Hakanson, L. An Ecological Risk Index for Aquatic Pollution Control—A Sedimentological Approach. Water Res. 1980, 14, 975–1001. [Google Scholar] [CrossRef]
  23. De Nicola, F.; Maisto, G.; Alfani, A. Assessment of nutritional status and trace element contamination of holm oak woodlands through analyses of leaves and surrounding soils. Sci. Total Environ. 2003, 311, 191–203. [Google Scholar] [CrossRef] [PubMed]
  24. Muller, G. Index of Geoaccumulation in Sediments of the Rhine River. GeoJournal 1969, 2, 109–118. [Google Scholar]
  25. Xu, Z.; Ni, S.; Tuo, X.; Zhang, C. Calculation of heavy metals’ toxicity coefficient in the evaluation of potential ecological risk index. Environ. Sci. Technol. 2008, 31, 112–115. [Google Scholar]
  26. Paatero, P. Least squares formulation of robust non-negative factor analysis. Chemom. Intell. Lab. Syst. 1997, 37, 23–35. [Google Scholar] [CrossRef]
  27. Paatero, P.; Tapper, U. Positive matrix factorization: A non-negative factor model with optimal utilization of error estimates of data values. Environmetrics 1994, 5, 111–126. [Google Scholar] [CrossRef]
  28. Background Values of Soil Elements in China; China Environmental Monitoring Station: Beijing, China, 1990. (In Chinese)
  29. Cheng, Y.; Zhao, Z.; Wang, Y.; Qiu, K.; Fu, Y.; Zhao, X.; Li, L. Soil Heavy Metals Pollution in the Farmland near a Lead Smelter in Henan Province. Chin. J. Soil Sci. 2014, 45, 1505–1510. (In Chinese) [Google Scholar]
  30. Chu, X.; Ma, Z.; Wu, D.; Wang, H.; He, J.; Chen, T.; Zheng, Z.; Li, H.; Wei, P. High Fe and Mn groundwater in the Nanchang, Poyang Lake Basin of China: Hydrochemical characteristics and genesis mechanisms. Environ. Monit. Assess. 2022, 195, 124. [Google Scholar] [CrossRef]
  31. Peana, M.; Pelucelli, A.; Chasapis, C.T.; Perlepes, S.P.; Bekiari, V.; Medici, S.; Zoroddu, M.A. Biological Effects of Human Exposure to Environmental Cadmium. Biomolecules 2023, 13, 36. [Google Scholar] [CrossRef]
  32. Yang, Y.; Liu, Y.; Li, Z.; Wang, Z.; Li, C.; Wei, H. Significance of soil microbe in microbial-assisted phytoremediation: An effective way to enhance phytoremediation of contaminated soil. Int. J. Environ. Sci. Technol. 2020, 17, 2477–2484. [Google Scholar] [CrossRef]
  33. Komárek, M.; Čadková, E.; Chrastný, V.; Bordas, F.; Bollinger, J.C. Contamination of vineyard soils with fungicides: A review of environmental and toxicological aspects. Environ. Int. 2010, 36, 138–151. [Google Scholar] [CrossRef] [PubMed]
  34. Marrugo-Negrete, J.; Pinedo-Hernández, J.; Díez, S. Assessment of heavy metal pollution, spatial distribution and origin in agricultural soils along the Sinú River Basin, Colombia. Environ. Res. 2017, 154, 380–388. [Google Scholar] [CrossRef] [PubMed]
  35. Palacios-Torres, Y.; de la Rosa, J.D.; Olivero-Verbel, J. Trace elements in sediments and fish from Atrato River: An ecosystem with legal rights impacted by gold mining at the Colombian Pacific. Environ. Pollut. 2020, 256, 113290. [Google Scholar] [CrossRef] [PubMed]
  36. Hu, X.; Wei, X.; Ling, J.; Chen, J. Cobalt: An Essential Micronutrient for Plant Growth? Front. Plant Sci. 2021, 12, 768523. [Google Scholar] [CrossRef] [PubMed]
  37. Yu, Q.; Wen, J.; Zhang, S.; Wu, C.; Ouyang, H.; Hu, N.; Li, X.; Qiu, X. The coupling of sulfide and Fe-Mn mineral promotes the migration of lead and zinc in the redox cycle of high pH floodplain soils. J. Hazard. Mater. 2024, 472, 134546. [Google Scholar] [CrossRef] [PubMed]
  38. Li, X.; Cao, Z.; Du, Y.; Zhang, Y.; Wang, J.; Ma, X.; Hu, P.; Luo, Y.; Wu, L. Multi-metal contaminant mobilizations by natural colloids and nanoparticles in paddy soils during reduction and reoxidation. J. Hazard. Mater. 2024, 461, 132684. [Google Scholar] [CrossRef] [PubMed]
  39. Shi, G.; Wang, X.; Wang, W.; Liu, D.; Liu, Q.; Zhou, J.; Chi, Q.; Liu, H. Nation-wide concentration and spatial distribution of manganese with links to manganese mineralization in China. J. Geochem. Explor. 2023, 244, 107130. [Google Scholar] [CrossRef]
  40. Han, R.; Liu, W.; Xu, Z. The constraint of soil Zn isotope compositions by diverse land utilizations: Evidence from geochemical fingerprint in a typical karst area. CATENA 2024, 240, 108005. [Google Scholar] [CrossRef]
  41. Sharifi, S.A.; Zaeimdar, M.; Jozi, S.A.; Hejazi, R. Effects of Soil, Water and Air Pollution with Heavy Metal Ions Around Lead and Zinc Mining and Processing Factories. Water Air Soil Pollut. 2023, 234, 760. [Google Scholar] [CrossRef]
  42. Wang, X.; Liu, Y.; Liu, B. Vertical migration in the soil of Cr(VI) and chromite ore processing residue: Field sampling and benchtop simulation. J. Hazard. Mater. 2023, 458, 132052. [Google Scholar] [CrossRef] [PubMed]
  43. Guria, M.K.; Guha, A.K.; Bhattacharyya, M. A green chemical approach for biotransformation of Cr(VI) to Cr(III), utilizing Fusarium sp. MMT1 and consequent structural alteration of cell morphology. J. Environ. Chem. Eng. 2014, 2, 424–433. [Google Scholar] [CrossRef]
  44. Hahn, J.; Mann, B.; Bange, U.; Kimmel, M. Horizon-specific effects of heavy metal mobility on nitrogen binding forms in forest soils near a historic smelter (Germany). Geoderma 2019, 355, 113895. [Google Scholar] [CrossRef]
Figure 1. Geographical location of the study area.
Forests 15 01116 g001
Figure 2. The EF values of soil heavy metals in different ecosystems, as shown by different soil groups (a) and textures (b). Different uppercase and lowercase letters indicate significant differences between ecosystems and soil types, respectively (p < 0.05). NS, p > 0.05.
Forests 15 01116 g002
Figure 3. The Igeo values of soil heavy metals in different ecosystems, as shown by different soil groups (a) and textures (b). Different uppercase and lowercase letters indicate significant differences between ecosystems and soil types, respectively (p < 0.05). NS, p > 0.05.
Forests 15 01116 g003
Figure 4. The Ei values of soil heavy metals in different ecosystems, as shown by different soil groups (a) and textures (b). Different uppercase and lowercase letters indicate significant differences between ecosystems and soil types, respectively (p < 0.05). NS, p > 0.05.
Forests 15 01116 g004
Figure 5. Proportion of potential ecological risk index (RI) at different levels (a) and RI in different ecosystems, as shown by different soil groups (b) and textures (c). Different uppercase and lowercase letters indicate significant differences between ecosystems and soil types, respectively (p < 0.05).
Forests 15 01116 g005
Figure 6. PCA results (a) and correlations (b) of topsoil properties in the study area. The numbers represent the Pearson correlation coefficients between soil properties. OM, organic matter.
Forests 15 01116 g006
Figure 7. Plots of source factor contributions and concentrations for heavy metals based on PMF model.
Forests 15 01116 g007
Table 1. Classification criteria for heavy metal pollution and potential ecological risk index.
EFPollution StatusIgeoPollution StatusEiRIRisk Level
≤1No ≤0No <40<150Low
1~2No to moderate 0–1Slight 40–80150–300Moderate
2~5Moderate1–2Slight to moderate 80–160300–600Moderate to high
5~20Moderate to strong 2–3Moderate 160–320600–1200High
20~40Strong 3–4Strong >320>1200Very high
>40Extremely strong 4–5Strong to very strong
≥5Extremely strong
Table 2. Distribution of soil types in the study area. Numbers in parentheses are the percentages in the corresponding ecosystem.
AnthrosolsFluvisolsGleysolsAlisolsSandyClayeyLoamy
Cropland (n = 350)350 (100%)000104 (29.71%)36 (10.29%)210 (60.00%)
Urban (n = 32)32 (100%)0008 (25.00%)8 (25.00%)16 (50.00%)
Forest (n = 320)101 (31.56%)140 (43.75%)57 (17.81%)22 (6.88%)117 (36.56%)8 (2.50%)195 (60.94%)
Total (n = 702)483 (68.80%)140 (19.94%)57 (8.12%)22 (3.13%)229 (32.62%)52 (7.41%)421 (59.97%)
Table 3. Heavy metal concentrations and physico-chemical properties in the study area topsoil. The background values are derived from the book “Background Values of Chinese Soil Elements” compiled by the China Environmental Monitoring Station [28], and those in the whole study area are the mean of that in Henan and Hubei. CV, variation coefficient.
ProvinceSoil PropertiesMeanMin.Max.Std. DeviationCV (%)Background Value
for Soil Heavy Metal
HenanCu (mg/kg)35.35 5.35 484.00 47.44 134.20 19.70
Pb (mg/kg)32.06 6.62 107.00 16.54 51.59 19.60
Zn (mg/kg)70.04 18.20 204.00 31.12 44.42 60.10
Cr (mg/kg)71.54 5.37 723.00 57.91 80.96 63.80
Ni (mg/kg)29.07 2.88 178.00 20.24 69.62 26.70
Co (mg/kg)16.13 0.70 84.00 12.33 76.43 10.00
Cd (mg/kg)0.15 0.03 0.48 0.10 65.44 0.07
As (mg/kg)20.15 1.51 1130.00 99.88 495.74 11.40
Hg (mg/kg)0.04 0.01 0.15 0.02 51.88 0.03
Mn (mg/kg)609.53 88.60 2080.00 368.17 60.40 579.00
HubeiCu (mg/kg)24.63 3.85 436.00 26.43 107.28 30.70
Pb (mg/kg)41.74 4.09 1280.00 102.15 244.72 26.00
Zn (mg/kg)84.57 28.70 756.00 47.23 55.85 83.60
Cr (mg/kg)56.03 5.48 309.00 47.70 85.14 86.00
Ni (mg/kg)21.87 2.21 170.00 19.67 89.98 37.30
Co (mg/kg)15.20 1.04 71.80 11.39 74.95 15.40
Cd (mg/kg)0.16 0.00 2.38 0.17 103.77 0.17
As (mg/kg)4.25 0.53 40.80 3.71 87.36 12.30
Hg (mg/kg)0.04 0.00 0.90 0.06 156.93 0.08
Mn (mg/kg)740.79 133.00 7880.00 641.10 86.54 712.00
Study areaCu (mg/kg)28.48 3.85 484.00 35.77 125.60 25.20
Pb (mg/kg)38.27 4.09 1280.00 82.48 215.55 22.80
Zn (mg/kg)79.36 18.20 756.00 42.71 53.82 71.85
Cr (mg/kg)61.59 5.37 723.00 52.10 84.58 74.90
Ni (mg/kg)24.45 2.21 178.00 20.16 82.46 32.00
Co (mg/kg)15.53 0.70 84.00 11.73 75.55 12.70
Cd (mg/kg)0.16 0.00 2.38 0.14 92.75 0.12
As (mg/kg)9.96 0.53 1130.00 60.33 605.97 11.85
Hg (mg/kg)0.04 0.00 0.90 0.05 131.13 0.06
Mn (mg/kg)693.67 88.60 7880.00 561.92 81.01 645.50
pH5.994.128.780.7812.95-
Organic matter (%)1.880.359.861.5381.14-
Table 4. Soil properties and heavy metal concentrations (mean ± SE) as affected by ecosystem and soil types. Bold numbers with different letters indicate significant differences (p < 0.05).
Ecosystems Soil GroupsSoil Texture
CroplandUrbanForestAnthrosolsFluvisolsGleysolsAlisolsSandyClayeyLoamy
pH6.71 ± 0.01 b7.96 ± 0.09 a5.50 ± 0.02 c6.29 ± 0.03 a5.42 ± 0.03 b5.47 ± 0.05 b4.35 ± 0.02 c6.00 ± 0.05 b6.40 ± 0.07 a5.93 ± 0.04 b
Organic matter (%)1.70 ± 0.11 b1.46 ± 0.22 b2.03 ± 0.10 a1.89 ± 0.50 a2.20 ± 0.43 a2.02 ± 0.38 a1.69 ± 0.36 a1.51 ± 0.10 a1.74 ± 0.57 a2.13 ± 0.10 a
Clay (%)24.61 ± 2.71 a20.55 ± 0.61 b18.66 ± 0.48 b20.41 ± 0.52 a18.47 ± 0.63 a19.10 ± 1.25 a19.12 ± 2.15 a12.14 ± 0.32 c41.59 ± 1.99 a21.40 ± 0.36 b
Cu (mg/kg)23.30 ± 1.36 a16.93 ± 1.66 b25.95 ± 1.92 b30.71 ± 1.71 a23.94 ± 3.16 ab25.52 ± 2.19 ab16.11 ± 1.45 b20.28 ± 1.05 b21.88 ± 0.62 b33.76 ± 2.14 a
Pb (mg/kg)29.45 ± 1.71 b25.21 ± 1.83 b50.58 ± 8.07 a29.98 ± 0.89 b66.04 ± 14.93 a41.30 ± 5.76 ab35.45 ± 2.13 ab36.68 ± 2.39 a24.80 ± 0.77 a40.79 ± 5.02 a
Zn (mg/kg)84.83 ± 4.54 a76.64 ± 5.38 a84.89 ± 2.42 a79.52 ± 2.02 a79.62 ± 3.63 a86.19 ± 3.94 a56.38 ± 4.92 b73.58 ± 2.09 ab63.54 ± 2.23 b84.45 ± 2.38 a
Cr (mg/kg)58.42 ± 4.12 a43.44 ± 4.65 b55.26 ± 2.76 b65.51 ± 2.48 a48.61 ± 3.72 ab67.19 ± 6.44 a43.83 ± 7.09 b44.57 ± 2.49 b67.81 ± 2.68 a70.09 ± 2.88 a
Ni (mg/kg)22.36 ± 1.54 a16.42 ± 1.75 ab21.88 ± 1.23 b25.91 ± 0.89 a20.46 ± 1.91 a24.11 ± 2.50 a18.82 ± 3.04 a18.49 ± 1.10 b29.11 ± 1.06 a27.12 ± 1.08 a
Co (mg/kg)15.86 ± 0.90 a10.02 ± 0.89 b15.09 ± 0.70 ab16.46 ± 0.53 a12.74 ± 1.00 ab17.11 ± 1.59 a8.79 ± 1.28 b12.55 ± 0.73 b14.38 ± 0.44 ab17.29 ± 0.60 a
Cd (mg/kg)0.14 ± 0.01 ab0.12 ± 0.02 b0.17 ± 0.01 a0.15 ± 0.01 a0.16 ± 0.01 a0.19 ± 0.01 a0.19 ± 0.02 a0.13 ± 0.01 b0.10 ± 0.01 b0.18 ± 0.01 a
As (mg/kg)4.21 ± 0.35 a5.75 ± 0.66 a4.18 ± 0.19 a12.21 ± 3.30 a5.14 ± 0.55 a4.09 ± 0.22 a6.28 ± 1.36 a4.54 ± 0.30 a10.38 ± 0.53 a12.85 ± 3.79 a
Hg (mg/kg)0.03 ± 0.00 b0.03 ± 0.00 ab0.04 ± 0.00 a0.03 ± 0.00 a0.05 ± 0.01 a0.04 ± 0.00 a0.04 ± 0.00 a0.03 ± 0.00 a0.03 ± 0.00 a0.04 ± 0.00 a
Mn (mg/kg)725.86 ± 30.50 a617.44 ± 66.78 a757.75 ± 47.33 a689.76 ± 17.77 a724.51 ± 83.92 a768.26 ± 49.69 a390.09 ± 29.40 b587.66 ± 24.65 b680.33 ± 21.80 ab752.98 ± 32.28 a
Disclaimer/Publisher’s Note: The statements, opinions and data contained in all publications are solely those of the individual author(s) and contributor(s) and not of MDPI and/or the editor(s). MDPI and/or the editor(s) disclaim responsibility for any injury to people or property resulting from any ideas, methods, instructions or products referred to in the content.

