Article

Minor Effects of Canopy and Understory Nitrogen Addition on Soil Organic Carbon Turnover Time in Moso Bamboo Forests

by
Changli Zeng
1,2,
Shurui He
2,
Boyin Long
2,
Zhihang Zhou
2,
Jie Hong
2,
Huan Cao
2,
Zhihan Yang
2 and
Xiaolu Tang
1,2,3,*
1
State Key Laboratory of Geohazard Prevention and Geoenvironment Protection, Chengdu University of Technology, Chengdu 610059, China
2
College of Ecology and Environment, Chengdu University of Technology, Chengdu 610059, China
3
Tianfu Yongxing Laboratory, Chengdu 610213, China
*
Author to whom correspondence should be addressed.
Forests 2024, 15(7), 1144; https://doi.org/10.3390/f15071144
Submission received: 16 May 2024 / Revised: 18 June 2024 / Accepted: 27 June 2024 / Published: 1 July 2024
(This article belongs to the Special Issue Soil Organic Carbon and Nutrient Cycling in the Forest Ecosystems)

Abstract

:
Increased atmospheric nitrogen (N) deposition has greatly influenced soil organic carbon (SOC) dynamics. Currently, the response of SOC to atmospheric N deposition is generally detected through understory N addition, while canopy processes have been largely ignored. In the present study, canopy N addition (CN) and understory N addition (UN, 50 and 100 kg N ha−1 year−1) were performed in a Moso bamboo forest to compare whether CN and UN addition have consistent effects on SOC and SOC turnover times (τsoil: defined as the ratio of SOC stock and soil heterotrophic respiration) with a local NHx:NOy ratio of 2.08:1. The experimental results showed that after five years, the SOC content of canopy water addition without N addition (CN0) was 82.9 g C kg−1, while it was 79.3, 70.7, 79.5 and 74.5 g C kg−1 for CN50, CN100, UN50 and UN100, respectively, and no significant difference was found for the SOC content between CN and UN. Five-year N addition did not significantly change τsoil, which was 34.5 ± 7.4 (mean ± standard error) for CN0, and it was 24.9 ± 4.8, 22.4 ± 4.9, 30.5 ± 4.0 and 22.1 ± 6.5 years for CN0, CN50, CN100, UN50 and UN100, respectively. Partial least squares structural equation modeling explained 93% of the variance in τsoil, and the results showed that soil enzyme activity was the most important positive factor controlling τsoil. These findings contradicted the previous assumption that UN may overestimate the impacts of N deposition on SOC. Our findings were mainly related to the high N deposition background in the study area, the special forest type of Moso bamboo and the short duration of the experiment. Therefore, our study had significant implications for modeling SOC dynamics to N deposition for high N deposition areas.

1. Introduction

Globally, fuel combustion, fertilization use and the exhaust emissions of fossil fuels have increased atmospheric nitrogen (N) deposition by 2–3 fold since the last century [1,2]. China has emerged as the third-largest deposition region, following Europe and North America [3,4,5]. The heightened deposition of N bears diverse implications for carbon cycling in terrestrial ecosystems. Specifically, the increased N deposition is anticipated to enhance vegetation production while diminishing soil carbon output, thereby impeding the decomposition of stable carbon. This process promotes the formation of soil humus and stable carbon, consequently influencing soil organic carbon (SOC) dynamics. However, excessive N deposition can pose adverse impacts on SOC dynamics, including soil acidification and diminished biodiversity [6,7]. Therefore, predicting the response of SOC dynamics under increased N deposition is essential for studying the carbon cycle in ecosystems under climate change.
Soil constitutes the most substantial carbon reservoir in terrestrial ecosystems [8,9], with SOC stock being about 1500 Pg C (1 Pg = 1015 g) [10], which is twice the magnitude of the atmospheric carbon pool [11]. Despite being a minor fraction of SOC components, the labile fractions, including dissolved organic carbon (DOC), easily oxidized carbon (EOC), and microbial biomass carbon (MBC), are highly sensitive to environmental stimuli, such as N deposition [12,13]. Serving as bioavailable carbon resources, these labile fractions directly fuel microbial activities [14]. Consequently, the labile fractions of SOC function as critical indicators for evaluating SOC stability [15]. Owing to the pronounced sensitivity of SOC and its fractions to environmental factors, even slight alterations in SOC stocks due to environmental influences can significantly impact atmospheric CO2 concentration, thus initiating positive feedback loops contributing to global climate change. Therefore, understanding SOC dynamics is of high priority to study carbon cycling in terrestrial ecosystem under global climate change.
SOC turnover time (τsoil) serves as a pivotal indicator for assessing SOC persistence, which is calculated as the ratio of SOC stock to heterotrophic respiration [16,17]. τsoil has an important role in influencing terrestrial responses to a warming climate. Locally, τsoil is influenced by soil temperature, moisture, physical and chemical properties, and microbial communities [18,19,20]. Globally, temperature and precipitation are significant factors influencing τsoil [17,21,22]. However, emphasizing the comprehension of how τsoil responds to environmental changes, including N deposition, is deemed a crucial factor in predicting carbon cycle feedback in terrestrial ecosystems.
Numerous studies have demonstrated that τsoil displays diverse responses to changes in N deposition, which is contingent upon the dynamics of carbon input and output to N deposition. Chen et al. [23] observed that N addition reduces the C/N ratio, affects soil N utilization efficiency, and increases carbon output, thereby enhancing τsoil. Yang et al. [24] reported that microorganisms can allocate more carbon for biomass synthesis, elevating the microbial carbon growth rate and microbial carbon use efficiency, and thereby accelerating τsoil under high N conditions. However, results from different studies varied greatly, which has limited our deep understanding of climate-carbon cycle feedback and ability to alleviate predictive uncertainties.
Moso bamboo (Phyllostachys heterocycla (Carr.) Mit ford cv. Pubescens) stands out as a crucial forest type in southern China [25,26,27], characterized by a rapid growth rate, achieving full height and diameter growth within 2 months after bamboo shoot production [28,29]. Due to the lack of secondary cambium, bamboo’s height and diameter remain unchanged during its adult lifespan [29]. Consequently, it is extensively cultivated in subtropical China, representing over 70% of total land areas of bamboo forests in China between 2014 and 2018 [30]. Although numerous studies have investigated the effects of N deposition on SOC, the majority of the previous studies concentrated on understory N deposition, largely overestimating the impacts of atmospheric N deposition. The retention, assimilation, and biological transformation processes related to canopy N deposition can influence the simulation of actual atmospheric N deposition [31,32,33,34]. Hence, canopy N deposition represents a more precise approximation of natural N deposition compared to understory N deposition. The effects of N deposition on SOC and τsoil is subject to variations in deposition rates [7,35,36], deposition methods [34], deposition time [37] and N forms [38]. For instance, elevated N deposition markedly increases easily oxidized organic carbon (EOC) and particulate organic carbon (POC) contents [39]. Furthermore, Wang et al. [40] discovered that organic N inhibits SOC decomposition more effectively than inorganic N. Therefore, comparing the impacts of canopy N deposition and understory N deposition on SOC in forest ecosystems and simulating realistic local N forms are crucial for comprehending the genuine effects of atmospheric N deposition.
In this study, we carried out an experiment applying canopy (CN) and understory (UN) N addition in a Moso bamboo forest. The main objectives were to (1) assess the impacts of N deposition on SOC and its components; (2) evaluate the effects of N deposition on τsoil; and (3) compare whether the responses of SOC and τsoil to canopy and understory N deposition were consistent.

2. Materials and Methods
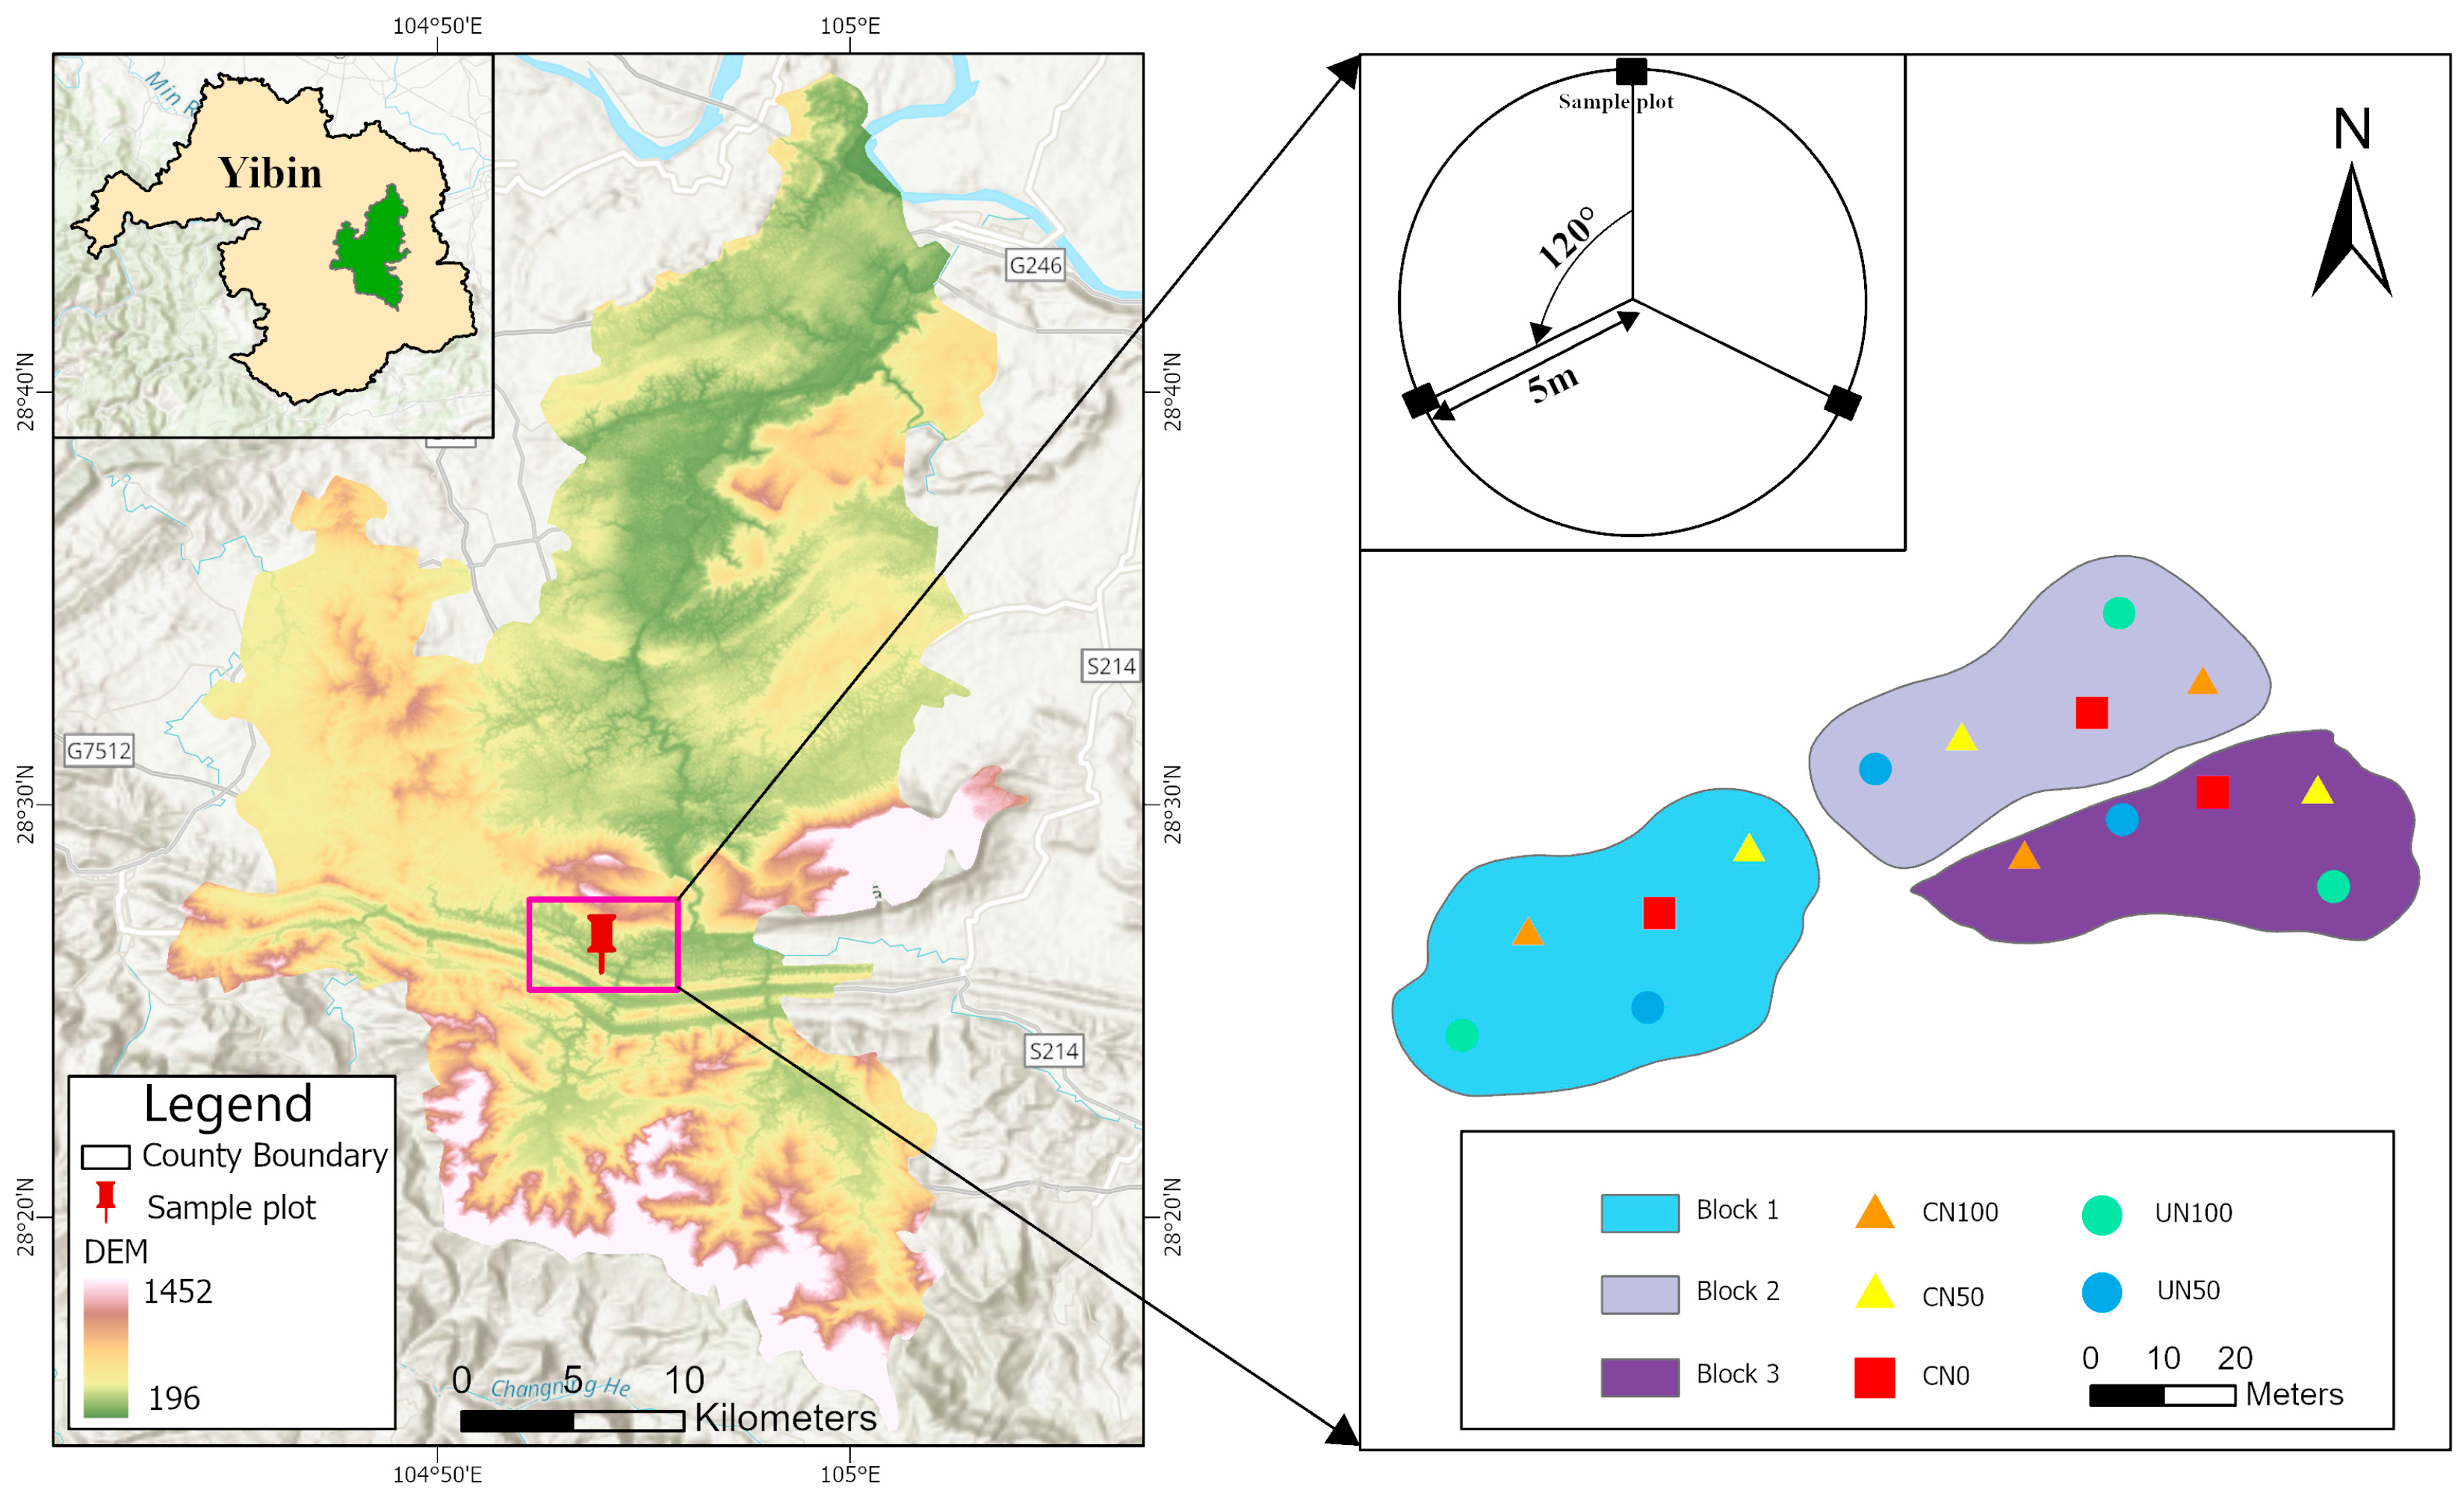
2.1. Study Site

The current study was conducted at the National Observation and Research Station of Bamboo Forests in Changning, Sichuan Province, which is positioned within the South Sichuan Bamboo Sea and situated in Changning County (26°33′17″–28°26′46″ N, 104°5′11″–105°4′54″ E), China (Figure 1). The study area is located in a mountainous region with elevations ranging from 260 to 1000 m. The multiyear mean annual precipitation ranges from 1200 to 2000 mm with a mean temperature fluctuating between 8.1 and 30 degrees Celsius. The lowest temperature occurred in January, while the highest temperatures are recorded in July and August. Soil types in the study area are yellow and purple loam. Moso bamboo is the dominant species in the study area and amounts for more than 90%, and it is mixed with Neosinocalamus affinis, Bambusa intermedia, and Dendrocalamus membranaceus. More details about the soil’s physical and chemical properties can be found in Cai et al. [41] and Supplementary Tables S1 and S2. Soil properties were not significant among different N addition treatments (p > 0.05).

2.2. Study Design

The first N addition experiment was conducted in 2019. The study site was divided into three blocks with five N treatments randomly assigned to each block. The five N deposition treatments included canopy water addition without N addition (CN0); canopy N addition with 50 (CN50) and 100 kg N ha−1 year−1 (CN100), and understory N addition with 50 (UN50) and 100 kg N ha−1 year−1 (UN100). Five sample plots with a radius of five meters were established in each block with three replicates for each treatment (Figure 1). A distance of 5–10 m was set as a buffer zone between two nearby circle plots.
N addition was sprayed in the middle of each month during the growing season (April to September). To represent the real N addition, (NH4)SO4 and KNO3 were used as the sources of NHx and NOy with a ratio of 2.08:1 in N amount [42] with a volume of 1 mm precipitation. A total volume of 6 mm mixed solution was added for one year, which represented about 0.5% of the annual precipitation. Therefore, the mixed effects of water and N addition were negligible.
Canopy N addition was conducted via an irrigation system three meters above the forest canopy. The spraying system was installed at the plot center, and the mixed solution was sprayed at a height exceeding two meters above the bamboo canopy using pump pressure. The average height of the Moso bamboo was 12 m. Since the bamboo height did not change once it reached full height [29], the height of the spray system did not change during the whole experiment period. Understory N additions were sprayed using the same irrigation system at a constant height of three meters above ground in the middle of the sampling plot, and the understory was kept when conducting experiments. In order to avoid the influence of sunlight and wind speed, the spraying time was set in the morning.

2.3. Soil Sampling and Analysis

Soil samples were collected from depths of 0–10, 10–30 and 30–50 cm using a soil corer with three duplicates and mixed within the same layer in October 2023. Soil samples were divided into two subsamples—fresh soils were kept in a refrigerator at 4 °C for soil microbial biomass carbon and N analysis. Air-dried soil samples were used for SOC and its fraction analysis. Meanwhile, intact soils were sampled using a soil ring knife for physical property analysis.
SOC content was assessed using the oil bath heating method. A K2CrO7-H2SO4 solution was employed to oxidize SOC, and the residual K2CrO7 was titrated with a standard Fe2+ solution [43]. The content of SOC was calculated based on the amount of consumed K2CrO7.
Recalcitrant organic carbon (ROC) was determined through acid hydrolysis [44]. The sample underwent a 16 h treatment with 6 mol L−1 hydrochloric acid, which was followed by sieving through a 180 µm sieve. ROC content was then measured using the K2CrO7 volumetric method (external heating method).
Dissolved organic carbon (DOC) content was quantified using an automatic analyzer [45]. At 25 °C, about ten grams of air-dried soil samples were mixed with distilled water in a 1:2 ratio. After oscillating for 30 min, the sample was filtered through a 0.45 µm membrane, and the filtrate was directly analyzed using a TOC analyzer (Elementar-TOC, Frankfurt, Germany).
The easily oxidized carbon (EOC) content was assessed using the oxidation-colorimetry method [46]. A 15 g soil sample was oxidized with 333 mmol L−1 KMnO4 solution, oscillated for 1 h, and then centrifuged for 5 min. The supernatant post-centrifugation was diluted at a ratio of 1:250 and subjected to colorimetry at 565 nm using UV-1800PC (MAPADA, Shanghai, China).
The microbial biomass carbon (MBC) content underwent a 24 h fumigation with chloroform, which was followed by leaching with a K2SO4 solution for 0.5 h to quantify the organic carbon in the leaching solution using a TOC analyzer (Elementar-TOC, Germany) [47]. MBC was calculated as the difference between the SOC content in the leaching solution of the fumigated soil and the control sample.

2.4. Data Analysis

A two-way analysis of variance was performed to evaluate the effects of addition approaches, addition rates, and their interactions on SOC and its fractions. A three-way analysis of variance was employed to evaluate the effects of N addition approaches, addition rates, soil depths, and their interactions on SOC stocks and τsoil. All data were analyzed in R 4.0.2 [48]. SOC stocks can be computed as follows:
S O C   s t o c k = S O C × D × 1 S C 100 × B D 10
SOC stock: soil organic carbon stock (Mg C ha−1); SOC: soil organic carbon content, (g C kg−1); D: layer thickness, (m); SC: sand content, (%); BD: bulk density, (g cm−3).
SOC turnover time (τsoil, years) was calculated as the ratio of SOC stock to soil heterotrophic respiration following Tian et al. [49]. τsoil can be computed as follows:
τ s o i l = S O C   s t o c k R H × 10
RH represents soil heterotrophic respiration (kg C m−2 year−1), which was taken from Cai et al. (2021) [41].
Partial least squares structural equation modeling (PLS-SEM) was employed to discern the direct and indirect impact of soil variables on τsoil [50]. Based on the theoretical understanding, an a priori model was developed. A latent variable encompassing total N content (TN), total phosphorus content (TP), total potassium content (TK), available N content (AN), available phosphorus content (AP), total potassium content (AK), and pH was employed to signify the influence of soil physical and chemical properties on τsoil. Nitratase (NR), β-glucosidase (BG), polyphenol (PO), invertase (IN), catalase (CA), and urease (UR) were utilized to denote the control of soil enzymes on SOC. Similarly, a latent group comprising soil water storage (SWS), hair tube water-holding capacity (HTWHC), soil volume water content (SVWC), and maximum water-holding capacity (MWHC), and another latent group encompassing bulk density (BD), hair tube porosity (HTP), and non-capillary porosity (NCP) were utilized to represent the controls of soil water content and porosity on SOC, respectively. Composite reliability (CR) was employed to assess the reliability of internal consistency with a typical expectation that it exceeds 0.65. The Average Variance Extracted (AVE) was utilized to validate the effectiveness of convergence with a threshold set at greater than 0.5. PLS-SEM was analyzed and visually represented using smartPLS 4.0.9. [51].

3. Results

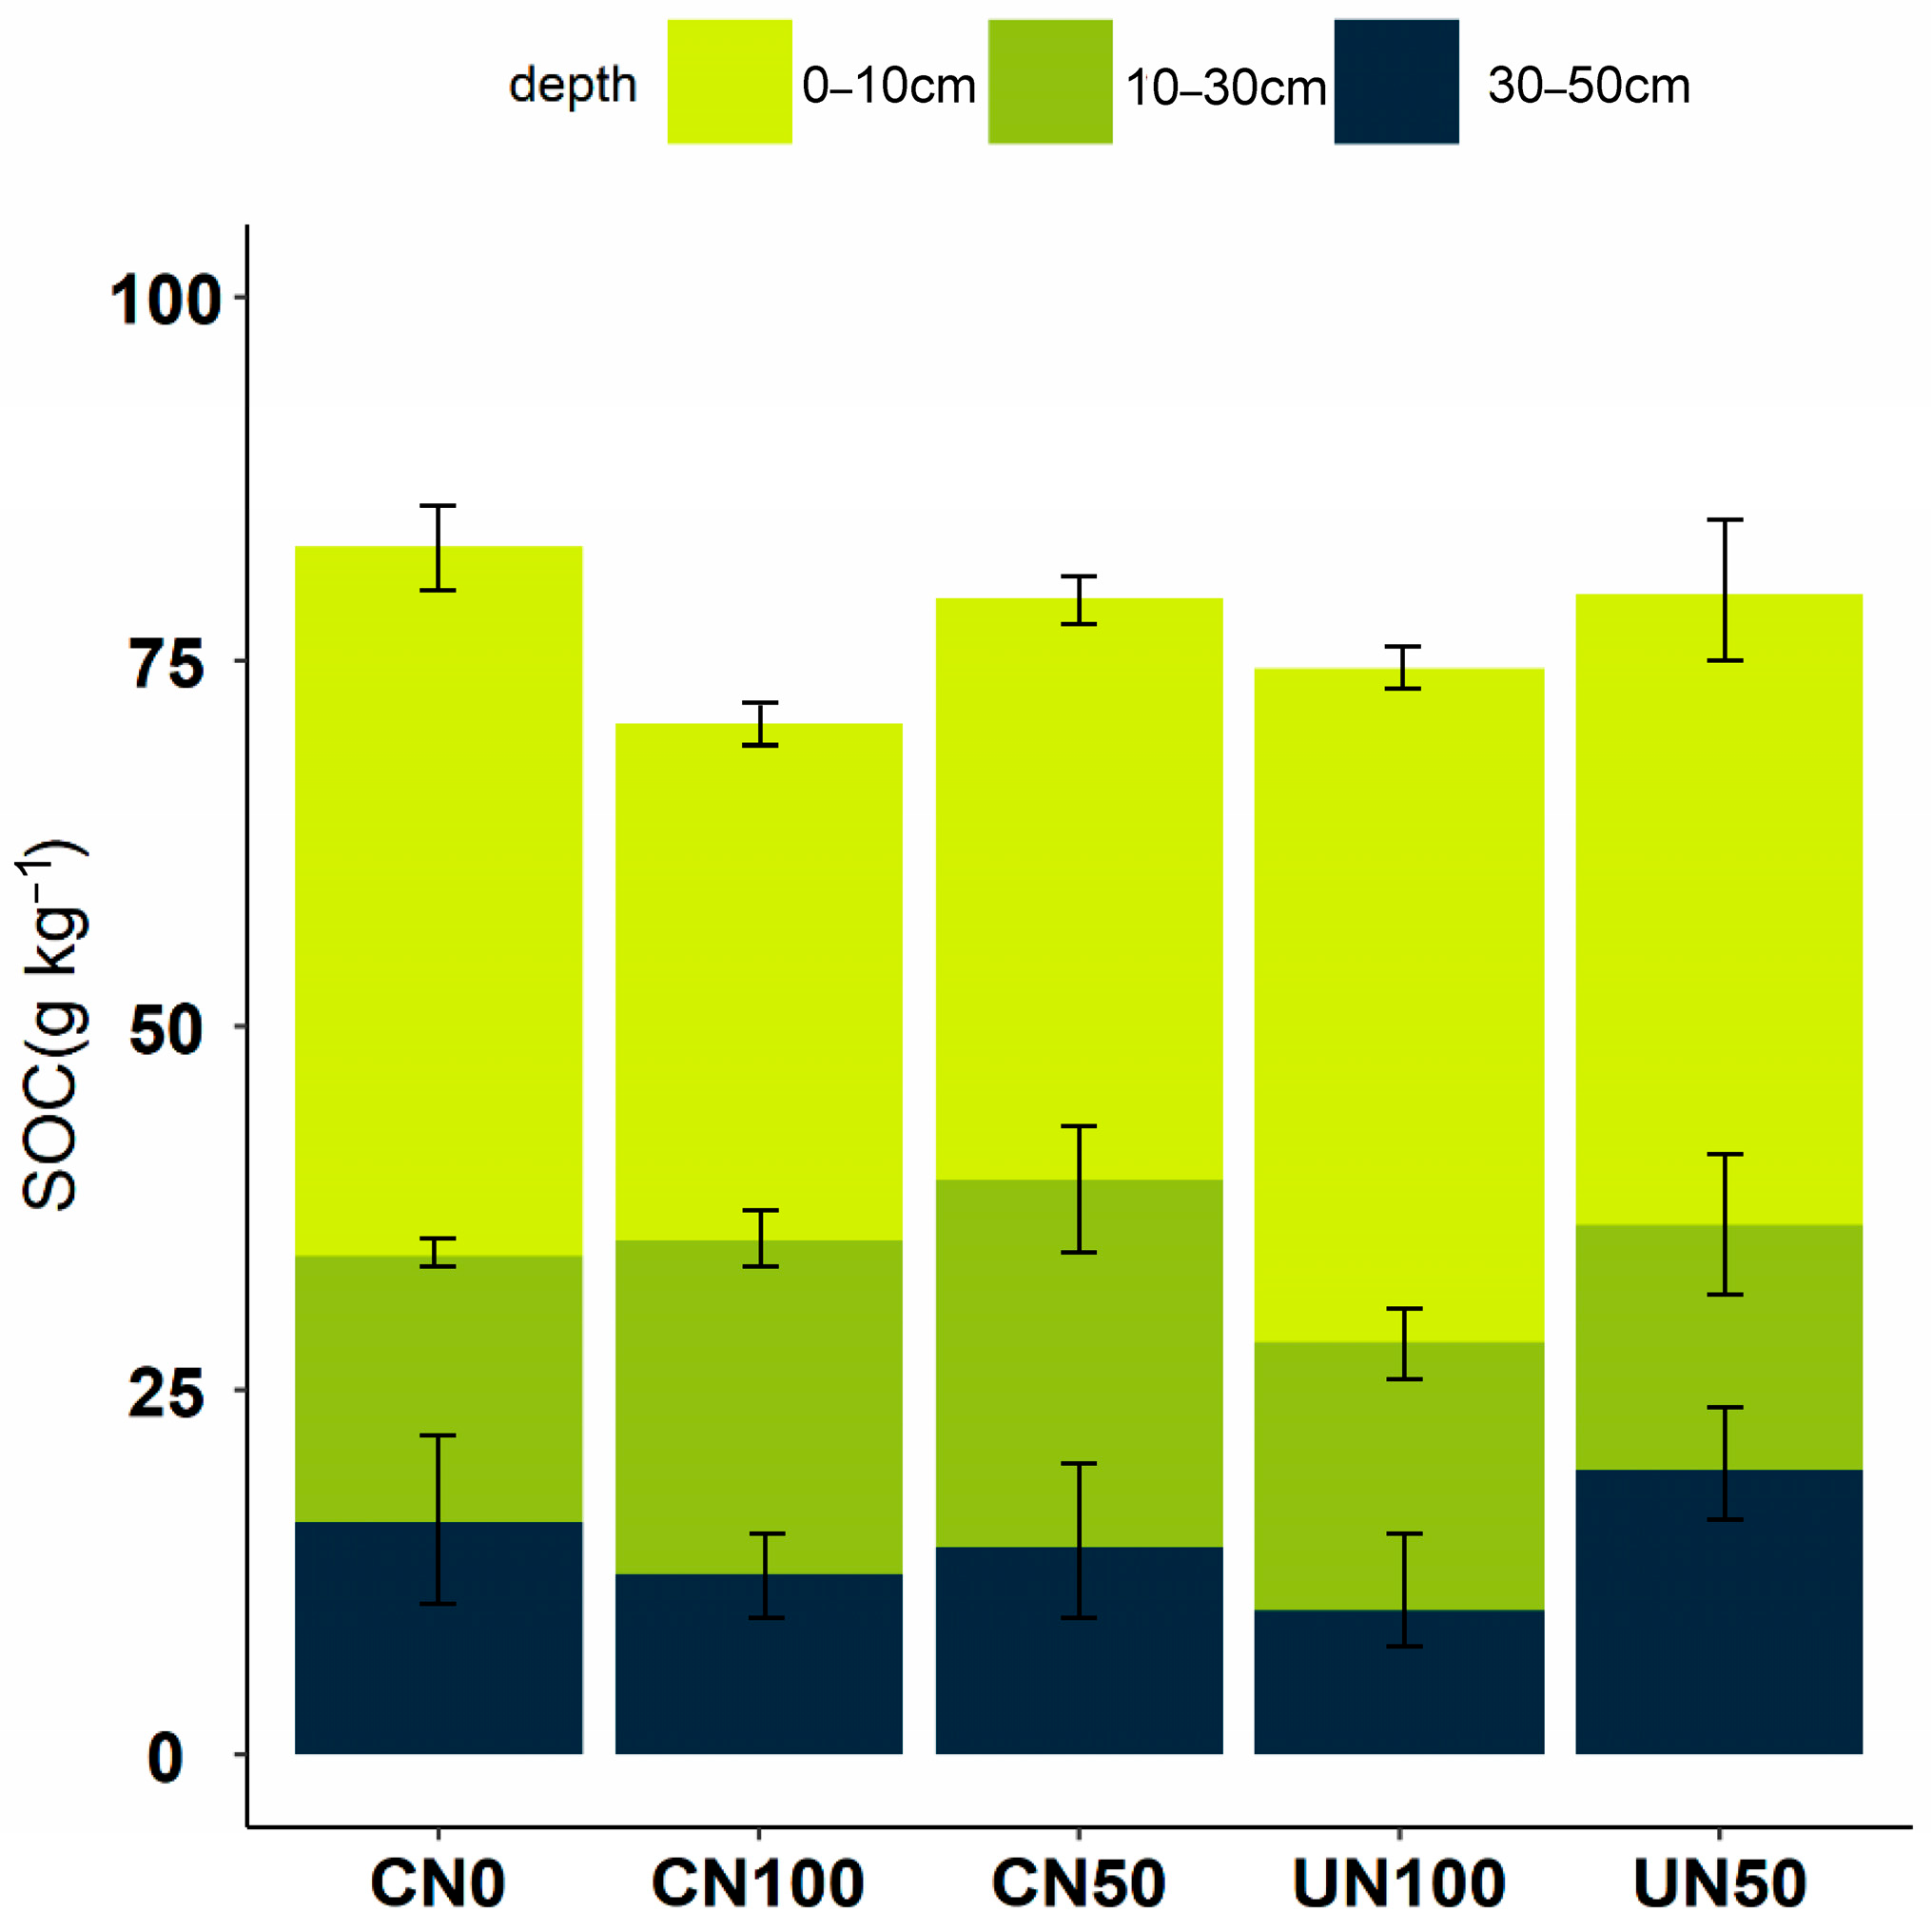
3.1. Effects of N Addition on SOC Contents and SOC Fractions

The SOC contents of CN0, CN50, CN100, UN50 and UN100 were 82.8, 79.3, 70.7, 79.5 and 74.5 g kg−1, respectively (Figure 2). N addition approaches and rates did not have a significant effect on the SOC contents (Table 1, p > 0.05), while soil depth had a significant effect on it (Table 1, p < 0.001). The interactions of N addition approaches, rates and soil depth had no effect on the SOC contents.
The EOC contents of CN0, CN50, CN100, UN50 and UN100 were 8.2, 13.6, 12.3, 14.1 and 11.9 g kg−1, respectively (Figure 3b). Except for EOC (Table 2, p < 0.05), the SOC fractions content was not significantly affected by the N addition rates and approaches (Table 2, all p > 0.05). The interactions of N addition approaches and rates had no effect on the SOC fraction contents.

3.2. Effects of N Addition on SOC Stocks and τsoil

The SOC stock of CN0 was 141.3 Mg C ha−1, and it was not significantly different from that of CN50, CN100, UN50 and UN100 (122.9, 106.5, 132.5 and 113.3 Mg C ha−1 within 0–50 cm, respectively, Figure 4a). N addition approaches, rates and soil depth had no significant effect on SOC stocks. Their interactions also had no significant effect on SOC stock (Table 1, p > 0.05).
τsoil was in the order of CN0 (34.5 ± 7.4 years) > UN50 (30.5 ± 4.0 years) > CN50 (24.9 ± 4.8 years) > CN100 (22.4 ± 4.9 years) > UN100 (22.1 ± 6.5 years) (Figure 4b). Although τsoil under was 28% lower than that of CN0, the difference was not significant (Table 1, p = 0.139). Similarly, N addition approaches, rates, soil depth and their interactions did not significantly change τsoil (Table 1, p = 0.596).

3.3. Influence of Environmental Factors on τsoil

The PLS-SEM model could explain 93% of the variance in τsoil (Figure 5). The soil chemical properties (SPCP) had a direct negative effect on τsoil and presented an indirect positive effect on τsoil by positively affecting soil enzyme activities (Enzyme). Porosity had a negative but not significant effect on SPCP. The influence of porosity, SPCP, and SWC on τsoil was not significant. Enzyme had a significant positive effect on τsoil and was the most important direct factor affecting τsoil.

4. Discussion

4.1. Effects of N Addition on SOC Contents and SOC Fractions

Based on five-year N addition experiments, we evaluated the impacts of N addition approaches and rates on SOC and its fraction contents. Although numerous similar studies have been conducted, this study was one of the first efforts to compare whether different N addition approaches had a consistent effect on SOC and its turnover times in Moso bamboo forests. The results showed that N addition approaches and rates did not significantly impact SOC (p = 0.939 and 0.528, Table 1) and its fractions (except EOC only, Table 2). These results were not consistent with a previous study [52] in which researchers observed a significant response in SOC content after both canopy and understory N addition. Lu et al. [52] attributed this difference to N retention when 30%–50% of N is sequestered by the canopy, which could reduce the N addition amount to belowground. Tu et al. [53] discovered a significant increase in SOC and MBC in a Pleioblastus amarus forest after short-term simulated N deposition. They attributed these results to an elevated input of litterfall to the soil and increased microbial activity in the rhizosphere during the simulation experiment. Ochoa-Hueso et al. [36] demonstrated that increased N deposition reduces SOC by reducing the soil faunal abundance and altering the soil C:N ratio. However, our result was consistent with those of Kuang et al. [54] and Churkina et al. [55], who found no change in SOC between canopy and understory N addition. We attributed the lack of change in SOC and its fraction to the following reasons.
First, the N content was saturated under an extremely high background of N deposition. In our study areas, there was a deposition rate of 82 to 113 kg N ha−1 year−1 [56]. Previous findings have confirmed that N sequestration and uptake by the canopy may be inhibited in high N environments. Schwarz et al. [11] found that the canopy retention of N averaged 40% across 27 forests in central Europe under a low N deposition rate of 10 kg N ha−1 year−1. Adriaenssens et al. [57] found that a small amount 1%–5% N was absorbed by branches and leaves under a N deposition rate of 30 kg N ha−1 year−1. The absorption of N content that eventually settles into the soil is negligible. Moreover, XIAO [58] found that the majority of the canopy does not take up N but is instead vulnerable to N leaching in areas with high background N values.
Second, although the forest canopy reduced the amount of N reaching the soil, the soil properties affecting the SOC content may remain relatively stable and insensitive under high N deposition background. Non-significant changes in the soil physicochemical properties and soil microbial communities after four years of canopy and understory N additions in the subtropics was also mentioned in the study by Tian et al. [59]. The soil properties that affect SOC were not significantly different after N addition (Table S1, [41]), which was similar to their results [59].
Third, SOC fractions did not respond significantly to different N addition approaches and rates (expect EOC only, Table 2). This finding was similar to those of Niu et al. [60], who found that long-term N additions tended to increase the DOC content but did not significantly change it, which was attributed to the increased stability of DOC and its reduced susceptibility to decomposition through the ligand exchange reactions of soil chemicals after N addition. Another explanation for our findings lies in the primary origins of DOC, stemming from root secretions and microbial activity [61,62]. Jian et al. [63] found a significant increase in DOC content after short-term N additions. They attributed this phenomenon to the increase in soil available nutrients after N addition, resulting in elevated root secretions, which increased DOC content. However, a previous study conducted in the same area indicated no significant alteration in soil nutrient content [41], and therefore the DOC content did not show significant changes. MBC, an indicator reflective of microbial activity, did not respond significantly to N addition. Chen et al. [64] found that the MBC decreased significantly. This was related to the decrease in soil pH after N addition, which leads to soil acidification and affects microbial activity. However, as previously stated, soil properties such as pH remained unchanged, suggesting that microbial activity might not have been affected. The ROC primarily consists of lignin and humus, and its composition is influenced by the decomposition rates of aboveground litter and belowground root [65,66]. Our previous study found that both canopy and understory N addition did not affect litterfall production. This finding could elucidate the lack of significant differences in ROC content. ROC and the majority of labile organic carbon showed no significant changes. Only EOC significantly increased after N addition, albeit it was insufficient to disrupt SOC content.
Finally, short-term N addition experiments also contributed to insignificant changes in SOC content and SOC fractions under canopy and understory N additions. However, many of the current studies involve short-term N addition experiments spanning 1–10 years [62,67,68], and the reaction of SOC to N addition unfolds as a gradual process. Our experiment furnishes initial monitoring data spanning 5 years, but longer experiments are needed to explore the mechanisms of N deposition on SOC.

4.2. Effects of N Addition on τsoil

τsoil ranged from 22.1 ± 6.5 years to 34.5 ± 7.4 years, which fell in the range of the forest ecosystem in China (15.4–53.8 years, [17]) and other temperate forests (11–40 years, [69]). However, our result was higher than that of two tropical forests (10.5 and 13.7 years, respectively [70]). This difference may be related to forest type and climate: the shortest τsoil is seen in tropical areas, and the longest τsoil is seen in boreal areas [17,71]. This phenomenon can be attributed to increasing temperature, which enhances SOC decomposition by stimulating soil microbes and enzymes. Furthermore, distinct calculation methodologies represent another pivotal factor contributing to variations in τsoil. For example, Wang et al. [17] calculated τsoil by the ratio of SOCS and net primary production under the assumption of steady state, and Ge et al. [72] estimated τsoil by the ratio of RH and dead organic carbon (sum of SOC and litter carbon). Realistically, it is difficult for natural ecosystems to meet a steady-state assumption (the carbon input equals carbon output).
Our results showed that N addition approaches and rates had no significant impact on τsoil (Table 2, p = 0.777 and 0.139), which differs from the findings of previous studies [23,70] in which N addition stimulated τsoil. Chen et al. [23] attributed the accelerated τsoil to the easily accessed and readily decomposable SOC by microorganisms and increased RH. Similarly, Cusack et al. [70] attributed it to RH inhibition and decreased oxidase activity. In our study, we attribute the lack of change in τsoil to there being no change in the carbon input (indicated by NPP and litterfall) and carbon output (indicated by total soil respiration and RH) under different N addition experiments [41]. The reasons for there being no change in carbon input and output include, but are not limited to, the high N deposition background in the study area [56] and short duration N addition experiments as indicated above. Furthermore, it is noteworthy that several potential factors influencing τsoil remained largely unaffected under both canopy and understory N additions. Previous studies have used microbial biomass, soil enzymes, and soil respiration to determine whether N additions increase microbial activity [73,74,75]. Wang et al. [40] observed no significant differences in soil microbial communities after simulating canopy and understory N deposition in two subtropical forests (same as the climate of our study area). The lack of significant differences in both microbial communities and enzyme activities (Figure S1) was one of the main reasons [76] for no change in τsoil under two N additions approaches. Similarly, the soil physicochemical properties, which are direct factors that can influence enzyme activity and τsoil (Figure 4), were not significantly altered under canopy and understory N additions. Consequently, the lack of change in τsoil has significant implications for comprehending SOC dynamics and its responsiveness to climatic changes in forest ecosystems, irrespective of the quantity and approaches of N addition, particularly in areas with high N deposition.

5. Conclusions

This study systematically compared the impacts of canopy and understory N addition with different addition rates on SOC and τsoil for the first time in a Moso bamboo forest. We found an insignificant change in SOC content and SOC fractions following canopy and understory N addition, indicating that N addition did not affect SOC regardless of the N addition approaches and rates. Although τsoil varied from 22.1 ± 6.5 to 30.5 ± 4.0 years among different N addition treatments, N addition had no significant impact on τsoil. The unchanged SOC and τsoil may be related to the high background of N deposition of the study area or short duration of N addition. Therefore, for areas experiencing high N deposition, further studies are encouraged to evaluate the long-term effects of N addition on SOC cycling, which has important implications for modelling the impact of N deposition on SOC dynamics in biogeochemical models for areas experiencing high N deposition.

Supplementary Materials

The following supporting information can be downloaded at https://www.mdpi.com/article/10.3390/f15071144/s1, Figure S1: Changes in soil organic carbon fractions of canopy nitrogen deposition and understory nitrogen deposition. The error bars mean standard error (n = 3). BG: β-glucosidase; CA: catalase; IN: invertase; NR: nitratase; UR: urease; PO: polyphenol; Table S1: Soil chemical properties in Moso bamboo forests (mean ± standard deviation) [41]. The same letters show that there is no significant difference under different nitrogen deposition treatments at p < 0.05 by one-way analysis of variance; Table S2: Soil physical properties in Moso bamboo forests (mean ± standard deviation). The same letters show that there is no significant difference under different nitrogen deposition treatments at p < 0.05 by one-way analysis of variance.

Author Contributions

C.Z., S.H., H.C., J.H. and X.T. designed the experiment. C.Z., S.H., H.C., J.H. and Z.Z. performed the experiment. C.Z., S.H., B.L. and Z.Y. processed the data and performed the statistical analyses. The manuscript was drafted by C.Z. and X.T., and it was finalized by C.Z., S.H., B.L. and X.T. All authors have read and agreed to the published version of the manuscript.

Funding

This study was funded by the National Natural Science Foundation of China (32271856).

Data Availability Statement

Data will be made available on request.

Acknowledgments

We sincerely thank our colleagues from Chengdu University of Technology for their assistance with soil sampling.

Conflicts of Interest

The authors declare no conflicts of interest.

References

  1. Schulte-Uebbing, L.; de Vries, W. Global-scale impacts of nitrogen deposition on tree carbon sequestration in tropical, temperate, and boreal forests: A meta-analysis. Glob. Chang. Biol. 2018, 24, e416–e431. [Google Scholar] [CrossRef] [PubMed]
  2. Wang, C.; Liu, D.; Bai, E. Decreasing soil microbial diversity is associated with decreasing microbial biomass under nitrogen addition. Soil Biol. Biochem. 2018, 120, 126–133. [Google Scholar] [CrossRef]
  3. Erisman, J.W.; Galloway, J.N.; Seitzinger, S.; Bleeker, A.; Dise, N.B.; Petrescu, A.M.; Leach, A.M.; de Vries, W. Consequences of human modification of the global nitrogen cycle. Philos. Trans. R. Soc. Lond. B Biol. Sci. 2013, 368, 20130116. [Google Scholar] [CrossRef] [PubMed]
  4. Lu, X.; Vitousek, P.M.; Mao, Q.; Gilliam, F.S.; Luo, Y.; Turner, B.L.; Zhou, G.; Mo, J. Nitrogen deposition accelerates soil carbon sequestration in tropical forests. Proc. Natl. Acad. Sci. USA 2021, 118, e2020790118. [Google Scholar] [CrossRef] [PubMed]
  5. Xu, C.; Xu, X.; Ju, C.; Chen, H.Y.H.; Wilsey, B.J.; Luo, Y.; Fan, W. Long-term, amplified responses of soil organic carbon to nitrogen addition worldwide. Glob. Chang. Biol. 2021, 27, 1170–1180. [Google Scholar] [CrossRef]
  6. Janssens, I.A.; Dieleman, W.; Luyssaert, S.; Subke, J.A.; Reichstein, M.; Ceulemans, R.; Ciais, P.; Dolman, A.J.; Grace, J.; Matteucci, G.; et al. Reduction of forest soil respiration in response to nitrogen deposition. Nat. Geosci. 2010, 3, 315–322. [Google Scholar] [CrossRef]
  7. Shi, L.; Zhang, H.; Liu, T.; Zhang, W.; Shao, Y.; Ha, D.; Li, Y.; Zhang, C.; Cai, X.A.; Rao, X.; et al. Consistent effects of canopy vs. Understory nitrogen addition on the soil exchangeable cations and microbial community in two contrasting forests. Sci. Total Environ. 2016, 553, 349–357. [Google Scholar] [CrossRef]
  8. Luo, Z.; Wang, G.; Wang, E. Global subsoil organic carbon turnover times dominantly controlled by soil properties rather than climate. Nat. Commun. 2019, 10, 3688. [Google Scholar] [CrossRef] [PubMed]
  9. Wang, M.; Li, F.; Dong, L.; Wang, X.; Han, L.; Olesen, J.E. Effects of exogenous organic/inorganic nitrogen addition on carbon pool distribution and transformation in grassland soil. Sci. Total Environ. 2023, 858, 159919. [Google Scholar] [CrossRef]
  10. Scharlemann, J.; Tanner, E.; Hiederer, R.; Kapos, V. Global soil carbon: Understanding and managing the largest terrestrial carbon pool. Carbon Manag. 2014, 5, 81–91. [Google Scholar] [CrossRef]
  11. Schwarz, M.T.; Bischoff, S.; Blaser, S.; Boch, S.; Schmitt, B.; Thieme, L.; Fischer, M.; Michalzik, B.; Schulze, E.-D.; Siemens, J.; et al. More efficient aboveground nitrogen use in more diverse central european forest canopies. For. Ecol. Manag. 2014, 313, 274–282. [Google Scholar] [CrossRef]
  12. Tan, Q.; Wang, G.; Liu, X.; Hao, T.; Tan, W. Responses of soil organic carbon turnover to nitrogen deposition are associated with nitrogen input rates: Derived from soil 14C evidences. Environ. Poll. 2018, 238, 500–507. [Google Scholar] [CrossRef] [PubMed]
  13. Yang, X.; Wang, D.; Lan, Y.; Meng, J.; Jiang, L.; Sun, Q.; Cao, D.; Sun, Y.; Chen, W. Labile organic carbon fractions and carbon pool management index in a 3-year field study with biochar amendment. J. Soils Sediments 2018, 18, 1569–1578. [Google Scholar] [CrossRef]
  14. Yang, S.; Chen, X.; Jiang, Z.; Ding, J.; Sun, X.; Xu, J. Effects of biochar application on soil organic carbon composition and enzyme activity in paddy soil under water-saving irrigation. Int. J. Environ. Res. Public Health 2020, 17, 333. [Google Scholar] [CrossRef] [PubMed]
  15. Leifeld, J.; Kögel-Knabner, I. Soil organic matter fractions as early indicators for carbon stock changes under different land-use? Geoderma 2005, 124, 143–155. [Google Scholar] [CrossRef]
  16. Garten, C.T.; Hanson, P.J. Measured forest soil c stocks and estimated turnover times along an elevation gradient. Geoderma 2006, 136, 342–352. [Google Scholar] [CrossRef]
  17. Wang, J.; Sun, J.; Xia, J.; He, N.; Li, M.; Niu, S. Soil and vegetation carbon turnover times from tropical to boreal forests. Funct. Ecol. 2018, 32, 71–82. [Google Scholar] [CrossRef]
  18. Trugman, A.T.; Medvigy, D.; Mankin, J.S.; Anderegg, W.R.L. Soil moisture stress as a major driver of carbon cycle uncertainty. Geophys. Res. Lett. 2018, 45, 6495–6503. [Google Scholar] [CrossRef]
  19. Wagner, S.; Cattle, S.R.; Scholten, T. Soil-aggregate formation as influenced by clay content and organic-matter amendment. J. Soil Sci. Plant Nutr. 2007, 170, 173–180. [Google Scholar] [CrossRef]
  20. Walker, T.W.N.; Kaiser, C.; Strasser, F.; Herbold, C.W.; Leblans, N.I.W.; Woebken, D.; Janssens, I.A.; Sigurdsson, B.D.; Richter, A. Microbial temperature sensitivity and biomass change explain soil carbon loss with warming. Nat. Clim. Chang. 2018, 8, 885–889. [Google Scholar] [CrossRef]
  21. Giardina, C.P.; Ryan, M.G. Evidence that decomposition rates of organic carbon in mineral soil do not vary with temperature. Nature 2000, 404, 858–861. [Google Scholar] [CrossRef] [PubMed]
  22. Posada, J.M.; Schuur, E.A. Relationships among precipitation regime, nutrient availability, and carbon turnover in tropical rain forests. Oecologia 2011, 165, 783–795. [Google Scholar] [CrossRef] [PubMed]
  23. Chen, L.; Wen, Z.; Yin, R.; Deng, P.; Gao, Y.; Xu, H.; Xu, X. Soil organic carbon turnover response to nitrogen and phosphorus additions in eastern china: Evidence from stable carbon isotopes. Forests 2023, 14, 1314. [Google Scholar] [CrossRef]
  24. Yang, X.; Duan, P.; Hicks, L.; Wang, K.; Li, D. Mechanisms underlying the responses of microbial carbon and nitrogen use efficiencies to nitrogen addition are mediated by topography in a subtropical forest. Sci. Total Environ. 2023, 880, 163236. [Google Scholar] [CrossRef] [PubMed]
  25. Huang, K.; Li, Y.; Hu, J.; Tang, C.; Zhang, S.; Fu, S.; Jiang, P.; Ge, T.; Luo, Y.; Song, X.; et al. Rates of soil respiration components in response to inorganic and organic fertilizers in an intensively-managed moso bamboo forest. Geoderma 2021, 403, 115212. [Google Scholar] [CrossRef]
  26. Song, X.; Gu, H.; Wang, M.; Zhou, G.; Li, Q. Management practices regulate the response of moso bamboo foliar stoichiometry to nitrogen deposition. Sci. Rep. 2016, 6, 24107. [Google Scholar] [CrossRef] [PubMed]
  27. Zhang, J.; Li, Q.; Lv, J.; Peng, C.; Gu, Z.; Qi, L.; Song, X.; Song, X. Management scheme influence and nitrogen addition effects on soil CO2, CH4, and N2O fluxes in a moso bamboo plantation. For. Ecosys. 2021, 8, 6. [Google Scholar] [CrossRef]
  28. Lei, Z.; Li, Q.; Song, X.; Wang, W.; Zhang, Z.; Peng, C.; Tian, L. Biochar mitigates dissolved organic carbon loss but does not affect dissolved organic nitrogen leaching loss caused by nitrogen deposition in moso bamboo plantations. Glob. Ecol. Conserv. 2018, 16, e00494. [Google Scholar] [CrossRef]
  29. Song, X.; Peng, C.; Ciais, P.; Li, Q.; Xiang, W.; Xiao, W.; Zhou, G.; Deng, L. Nitrogen addition increased CO2 uptake more than non-CO2 greenhouse gases emissions in a moso bamboo forest. Sci. Adv. 2020, 6, eaaw5790. [Google Scholar] [CrossRef]
  30. Li, Y.; Feng, P. Bamboo resources in china based on the ninth national forest inventory data. World Bamboo Ratt. 2019, 17, 45–48, (In Chinese with English Abstract). [Google Scholar]
  31. Guerrieri, R.; Templer, P.; Magnani, F. Canopy exchange and modification of nitrogen fluxes in forest ecosystems. Curr. For. Rep. 2021, 7, 115–137. [Google Scholar] [CrossRef]
  32. Liu, Y.; Tan, X.; Wang, Y.; Guo, Z.; He, D.; Fu, S.; Wan, S.; Ye, Q.; Zhang, W.; Liu, W.; et al. Responses of litter, organic and mineral soil enzyme kinetics to 6 years of canopy and understory nitrogen additions in a temperate forest. Sci. Total Environ. 2020, 712, 136383. [Google Scholar] [CrossRef] [PubMed]
  33. Lu, X.; Ren, W.; Hou, E.; Tang, S.; Zhang, L.; Liu, Z.; Lin, Y.; Fu, S.; Wen, D.; Kuang, Y. Different effects of canopy and understory nitrogen addition on soil organic carbon and its related processes in a subtropical forest. J. Soils Sediments 2020, 21, 235–244. [Google Scholar] [CrossRef]
  34. Lu, X.; Ren, W.; Hou, E.; Zhang, L.; Wen, D.; Liu, Z.; Lin, Y.; Wang, J.; Kuang, Y. Negative effects of canopy N addition on soil organic carbon in wet season are primarily detected in uppermost soils of a subtropical forest. Glob. Ecol. Conserv. 2019, 17, e00543. [Google Scholar] [CrossRef]
  35. Mo, J.; Zhang, W.E.I.; Zhu, W.; Gundersen, P.E.R.; Fang, Y.; Li, D.; Wang, H.U.I. Nitrogen addition reduces soil respiration in a mature tropical forest in southern china. Glob. Chang. Biol. 2008, 14, 403–412. [Google Scholar] [CrossRef]
  36. Ochoa-Hueso, R.; Rocha, I.; Stevens, C.J.; Manrique, E.; Luciañez, M.J. Simulated nitrogen deposition affects soil fauna from a semiarid mediterranean ecosystem in central spain. Biol. Fertil. Soils 2014, 50, 191–196. [Google Scholar] [CrossRef]
  37. Frey, S.D.; Ollinger, S.; Nadelhoffer, K.; Bowden, R.; Brzostek, E.; Burton, A.; Caldwell, B.A.; Crow, S.; Goodale, C.L.; Grandy, A.S.; et al. Chronic nitrogen additions suppress decomposition and sequester soil carbon in temperate forests. Biogeochemistry 2014, 121, 305–316. [Google Scholar] [CrossRef]
  38. Wu, X.; Yuan, J.; Ma, S.; Feng, S.; Zhang, X.; Hu, D. Seasonal spatial pattern of soil respiration in a temperate urban forest in beijing. Urban For. Urban Green. 2015, 14, 1122–1130. [Google Scholar] [CrossRef]
  39. Chen, X.; Li, Y.; Mo, J.; Otieno, D.; Tenhunen, J.; Yan, J.; Liu, J.; Zhang, D. Effects of nitrogen deposition on soil organic carbon fractions in the subtropical forest ecosystems of s china. J. Plant Nutr. Soil Sci. 2012, 175, 947–953. [Google Scholar] [CrossRef]
  40. Wang, Q.; Tian, P.; Liu, S.; Sun, T. Inhibition effects of n deposition on soil organic carbon decomposition was mediated by n types and soil nematode in a temperate forest. Appl. Soil Ecol. 2017, 120, 105–110. [Google Scholar] [CrossRef]
  41. Cai, C.; Yang, Z.; Liu, L.; Lai, Y.; Lei, J.; Fan, S.; Tang, X. Consistent effects of canopy vs. Understory nitrogen addition on soil respiration and net ecosystem production in moso bamboo forests. Forests 2021, 12, 1427. [Google Scholar] [CrossRef]
  42. Tian, H.; Yang, J.; Lu, C.; Xu, R.; Canadell, J.G.; Jackson, R.B.; Arneth, A.; Chang, J.; Chen, G.; Ciais, P.; et al. The global N2O model intercomparison project. Bull. Am. Meteorol. Soc. 2018, 99, 1231–1251. [Google Scholar] [CrossRef]
  43. Zhang, L.H.; Xie, Z.K.; Zhao, R.F.; Wang, Y.J. The impact of land use change on soil organic carbon and labile organic carbon stocks in the longzhong region of loess plateau. J. Arid Land 2012, 4, 241–250. [Google Scholar] [CrossRef]
  44. Luo, R.; Fan, J.; Wang, W.; Luo, J.; Kuzyakov, Y.; He, J.S.; Chu, H.; Ding, W. Nitrogen and phosphorus enrichment accelerates soil organic carbon loss in alpine grassland on the qinghai-tibetan plateau. Sci. Total Environ. 2019, 650, 303–312. [Google Scholar] [CrossRef] [PubMed]
  45. Hu, H.; Ma, H.; Luo, C.; Hu, T. Forest soil organic carbon fraction and its measure methods. J. Soil Sci. 2010, 41, 1018–1024. [Google Scholar]
  46. Chen, Z.; Xu, C.; An, Z.; Wang, Y.; Sun, D.; Wang, S. Research progress on fraction and analysis methods of soil carbon. Rock Miner. Anal. 2019, 38, 233–244. [Google Scholar]
  47. Haynes, R.J. Labile organic matter as an indicator of organic matter quality in arable and pastoral soils in new zealand. Soil Biol. Biochem. 2000, 32, 211–219. [Google Scholar] [CrossRef]
  48. R Core Team. R: A Language and Environment for Statistical Computing; R Foundation for Statistical Computing: Vienna, Austria, 2019; Available online: http://www.R-project.Org/ (accessed on 11 June 2019).
  49. Tian, H.; Lu, C.; Yang, J.; Banger, K.; Huntzinger, D.N.; Schwalm, C.R.; Michalak, A.M.; Cook, R.; Ciais, P.; Hayes, D.; et al. Global patterns and controls of soil organic carbon dynamics as simulated by multiple terrestrial biosphere models: Current status and future directions. Glob. Biogeochem. Cycles 2015, 29, 775–792. [Google Scholar] [CrossRef] [PubMed]
  50. Jouquet, P.; Harit, A.; Bottinelli, N.; Eldridge, D.J. Termite bioturbation: Fungal versus non-fungal building strategies lead to different soil sheeting stability. Soil Biol. Biochem. 2023, 176, 108868. [Google Scholar] [CrossRef]
  51. Wang, C.; Ma, L.; Zhang, Y.; Chen, N.; Wang, W. Spatiotemporal dynamics of wetlands and their driving factors based on pls-sem: A case study in wuhan. Sci. Total Environ. 2022, 806, 151310. [Google Scholar] [CrossRef]
  52. Lu, X.; Kuang, Y.; Mou, L.; Hou, E.; Fu, S.; Li, J. Canopy mitigates the effects of nitrogen deposition on soil carbon-related processes in a subtropical forest. Sci. Total Environ. 2021, 757, 143847. [Google Scholar] [CrossRef] [PubMed]
  53. Tu, L.; Hu, T.; Zhang, J.; Li, R.; Dai, H.; Luo, S. Response of soil organic carbon and nutrients to simulated nitrogen deposition in pleioblastus amarus plantation, rainy area of west china. Acta Phytoecol. Sin. 2011, 35, 125–136. [Google Scholar] [CrossRef]
  54. Kuang, L.; Mou, Z.; Li, Y.; Lu, X.; Kuang, Y.; Wang, J.; Wang, F.; Cai, X.; Zhang, W.; Fu, S.; et al. Depth-driven responses of microbial residual carbon to nitrogen addition approaches in a tropical forest: Canopy addition versus understory addition. J. Environ. Manag. 2023, 340, 118009. [Google Scholar] [CrossRef] [PubMed]
  55. Churkina, G.; Trusilova, K.; Vetter, M.; Dentener, F. Contributions of nitrogen deposition and forest regrowth to terrestrial carbon uptake. Carbon Balance Manag. 2007, 2, 5. [Google Scholar] [CrossRef] [PubMed]
  56. Tu, L.H.; Chen, G.; Peng, Y.; Hu, H.L.; Hu, T.X.; Zhang, J.; Li, X.W.; Liu, L.; Tang, Y. Soil biochemical responses to nitrogen addition in a bamboo forest. PLoS ONE 2014, 9, e102315. [Google Scholar] [CrossRef] [PubMed]
  57. Adriaenssens, S.; Staelens, J.; Wuyts, K.; Van Wittenberghe, S.; Wuytack, T.; Verheyen, K.; Boeckx, P.; Samson, R. Canopy uptake of 15NH3 by four temperate tree species and the interaction with leaf properties. Water Air Soil Pollut. 2012, 223, 5643–5657. [Google Scholar] [CrossRef]
  58. Xiao, H. Atmospheric nitrogen deposition and nitrogen dynamics of forest ecosystems. Acta Ecol. Sin. 1999, 16, 90–99. [Google Scholar]
  59. Tian, Y.; Tao, L.; Wang, J.; Lu, H.; Zhou, L.; Campbell, D.E.; Ren, H. Canopy and understory nitrogen additions did not significantly change the community structure of soil fauna under a mature subtropical forest. Sci. Total Environ. 2020, 718, 137438. [Google Scholar] [CrossRef] [PubMed]
  60. Niu, G.; Yin, G.; Mo, X.; Mao, Q.; Mo, J.; Wang, J.; Lu, X. Do long-term high nitrogen inputs change the composition of soil dissolved organic matter in a primary tropical forest? Environ. Res. Lett. 2022, 17, 095015. [Google Scholar] [CrossRef]
  61. Jiang, Y.M.; Chen, C.R.; Liu, Y.Q.; Xu, Z.H. Soil soluble organic carbon and nitrogen pools under mono- and mixed species forest ecosystems in subtropical china. J. Soils Sediments 2010, 10, 1071–1081. [Google Scholar] [CrossRef]
  62. Li, Y.; Wang, B.; Dou, S.; Shen, H.; Mei, L.; Zhang, Y.; Zeng, X.; Zhang, Y.; Pei, Y.; Ren, H.; et al. Divergent responses of soil carbon and nitrogen pools to short-term nitrogen addition between two plantations in northeast china. Int. J. Agric. Biol. Eng. 2019, 12, 82–90. [Google Scholar] [CrossRef]
  63. Jian, J.-N.; Liu, W.-C.; Zhu, Y.-F.; Li, J.-X.; Wen, Y.-H.; Liu, F.-H.; Ren, C.-J.; Han, X.-H. Effects of short-term nitrogen addition on soil organic carbon components in robinia pseudoacacia l. Plantation. Envrion. Sci. 2023, 44, 2767–2774, (In Chinese with English Abstract). [Google Scholar]
  64. Chen, X.; Liu, J.; Deng, Q.; Yan, J.; Zhang, D. Effects of elevated CO2 and nitrogen addition on soil organic carbon fractions in a subtropical forest. Plant Soil 2012, 357, 25–34. [Google Scholar] [CrossRef]
  65. Rovira, P.; Vallejo, V.R. Labile and recalcitrant pools of carbon and nitrogen in organic matter decomposing at different depths in soil: An acid hydrolysis approach. Geoderma 2002, 107, 109–141. [Google Scholar] [CrossRef]
  66. Wang, X.; Tian, Q.; Li, Q.; Liao, C.; He, M.; Liu, F. Lignin characteristics in soil profiles in different plant communities in a subtropical mixed forest. J. Plant Ecol. 2018, 11, 560–568. [Google Scholar] [CrossRef]
  67. Tu, L.-H.; Hu, T.-X.; Zhang, J.; Li, R.-H.; Dai, H.-Z.; Luo, S.-H. Short-term simulated nitrogen deposition increases carbon sequestration in a pleioblastus amarus plantation. Plant Soil 2010, 340, 383–396. [Google Scholar] [CrossRef]
  68. Verstraeten, A.; De Vos, B.; Neirynck, J.; Roskams, P.; Hens, M. Impact of air-borne or canopy-derived dissolved organic carbon (doc) on forest soil solution doc in flanders, belgium. Atmos. Environ. 2014, 83, 155–165. [Google Scholar] [CrossRef]
  69. Tate, K.R.; Parshotam, A.; Ross, D.J. Soil carbon storage and turnover in temperate forests and grasslands—A new zealand perspective. J. Biogeo. 1995, 22, 695–700. [Google Scholar] [CrossRef]
  70. Cusack, D.F.; Torn, M.S.; McDowell, W.H.; Silver, W.L. The response of heterotrophic activity and carbon cycling to nitrogen additions and warming in two tropical soils. Glob. Chang. Biol. 2010, 16, 2555–2572. [Google Scholar] [CrossRef]
  71. Carvalhais, N.; Forkel, M.; Khomik, M.; Bellarby, J.; Jung, M.; Migliavacca, M.; Mu, M.; Saatchi, S.; Santoro, M.; Thurner, M.; et al. Global covariation of carbon turnover times with climate in terrestrial ecosystems. Nature 2014, 514, 213–217. [Google Scholar] [CrossRef]
  72. Ge, R.; He, H.; Zhang, L.; Ren, X.; Williams, M.; Yu, G.; Luke Smallman, T.; Zhou, T.; Li, P.; Xie, Z.; et al. Climate sensitivities of carbon turnover times in soil and vegetation: Understanding their effects on forest carbon sequestration. J. Geophys. Res. Biogeosci. 2022, 127, e2020JG005880. [Google Scholar] [CrossRef]
  73. Allison, S.D.; LeBauer, D.S.; Ofrecio, M.R.; Reyes, R.; Ta, A.M.; Tran, T.M. Low levels of nitrogen addition stimulate decomposition by boreal forest fungi. Soil Biol. Biochem. 2009, 41, 293–302. [Google Scholar] [CrossRef]
  74. Lee, S.H.; Lee, S.; Kim, D.Y.; Kim, J.G. Degradation characteristics of waste lubricants under different nutrient conditions. J. Hazard. Mater. 2007, 143, 65–72. [Google Scholar] [CrossRef] [PubMed]
  75. Aspray, T.J.; Gluszek, A.; Carvalho, D. Effect of nitrogen amendment on respiration and respiratory quotient (rq) in three hydrocarbon contaminated soils of different type. Chemosphere 2008, 72, 947–951. [Google Scholar] [CrossRef]
  76. Liu, L.; Zhang, T.; Gilliam, F.S.; Gundersen, P.; Zhang, W.; Chen, H.; Mo, J. Interactive effects of nitrogen and phosphorus on soil microbial communities in a tropical forest. PLoS ONE 2013, 8, e61188. [Google Scholar] [CrossRef]
Figure 1. Geographic location of the study area and map of the sample plots. CN0: canopy water addition without N addition; CN50 and CN100: canopy N addition with 50 and 100 kg N ha−1 year−1; UN50 and UN100: understory N addition with 50 and 100 kg N ha−1 year−1. The same below.
Forests 15 01144 g001
Figure 2. Changes in SOC content to canopy and understory N addition. The error bars indicate the standard error (n = 3). The abbreviations can be found in Section 2.2.
Forests 15 01144 g002
Figure 3. Changes in topsoil (0–10 cm) (a) recalcitrant organic carbon (ROC, mg kg−1), (b) easily oxidized carbon (EOC, mg kg−1), (c) dissolved organic carbon (DOC, mg kg−1) and (d) microbial biomass carbon (MBC, mg kg−1) contents to canopy and understory N addition. The error bars indicate the standard error (n = 3). ** p < 0.01.
Forests 15 01144 g003
Figure 4. Changes in (a) SOC stocks (Mg C ha−1) and (b) SOC turnover time (τsoil, years) of canopy and understory N addition. The error bars indicate the standard error (n = 3).
Forests 15 01144 g004
Figure 5. The PLS-SEM model diagram shows the relationship between each environment variable and mean turnover time. SPCP: soil chemical properties; SWC: soil water content; BD: bulk density; HTP: hair tube porosity; NCP: non-capillary porosity; SWS: soil water storage; MWHC: maximum water-holding capacity; HTWHC: hair tube water-holding capacity; SVWC: soil volume water content. Lines and arrows represent relationships between variables. The blue and red lines represent positive and negative effects, respectively. The number represents the path coefficient. *** p < 0.001.
Forests 15 01144 g005
Table 1. p values of three-way analysis of the effects of N addition approaches, rates, soil depth and their interactions on SOC, SOC stock and τsoil.
FactorSOCSOC Stockτsoil
CN or UN0.9390.9630.777
N addition rate0.5280.2120.139
Soil depth<0.0010.6400.514
Approach × Rate0.8300.9320.697
Approach × Soil depth0.4500.4590.516
Rate × Soil depth0.3160.1770.199
Approach × Rate × Soil depth0.5020.5160.596
Table 2. p values of two-way analysis of the effects of N addition approaches, rates and their interactions on soil recalcitrant organic carbon (ROC), easily oxidized organic carbon (EOC), dissolved organic carbon (DOC), and microbial biomass carbon (MBC).
FactorROCEOCDOCMBC
CN or UN 0.5050.0940.3790.268
N addition rate0.5680.0090.8940.229
Approach × rate0.0930.7410.4730.456
Disclaimer/Publisher’s Note: The statements, opinions and data contained in all publications are solely those of the individual author(s) and contributor(s) and not of MDPI and/or the editor(s). MDPI and/or the editor(s) disclaim responsibility for any injury to people or property resulting from any ideas, methods, instructions or products referred to in the content.

