
Spatiotemporal Variations of Vegetation and Its Response to Climate Change and Human Activities in Arid Areas—A Case Study of the Shule River Basin, Northwestern China

Abstract
:1. Introduction
2. Materials and Methods
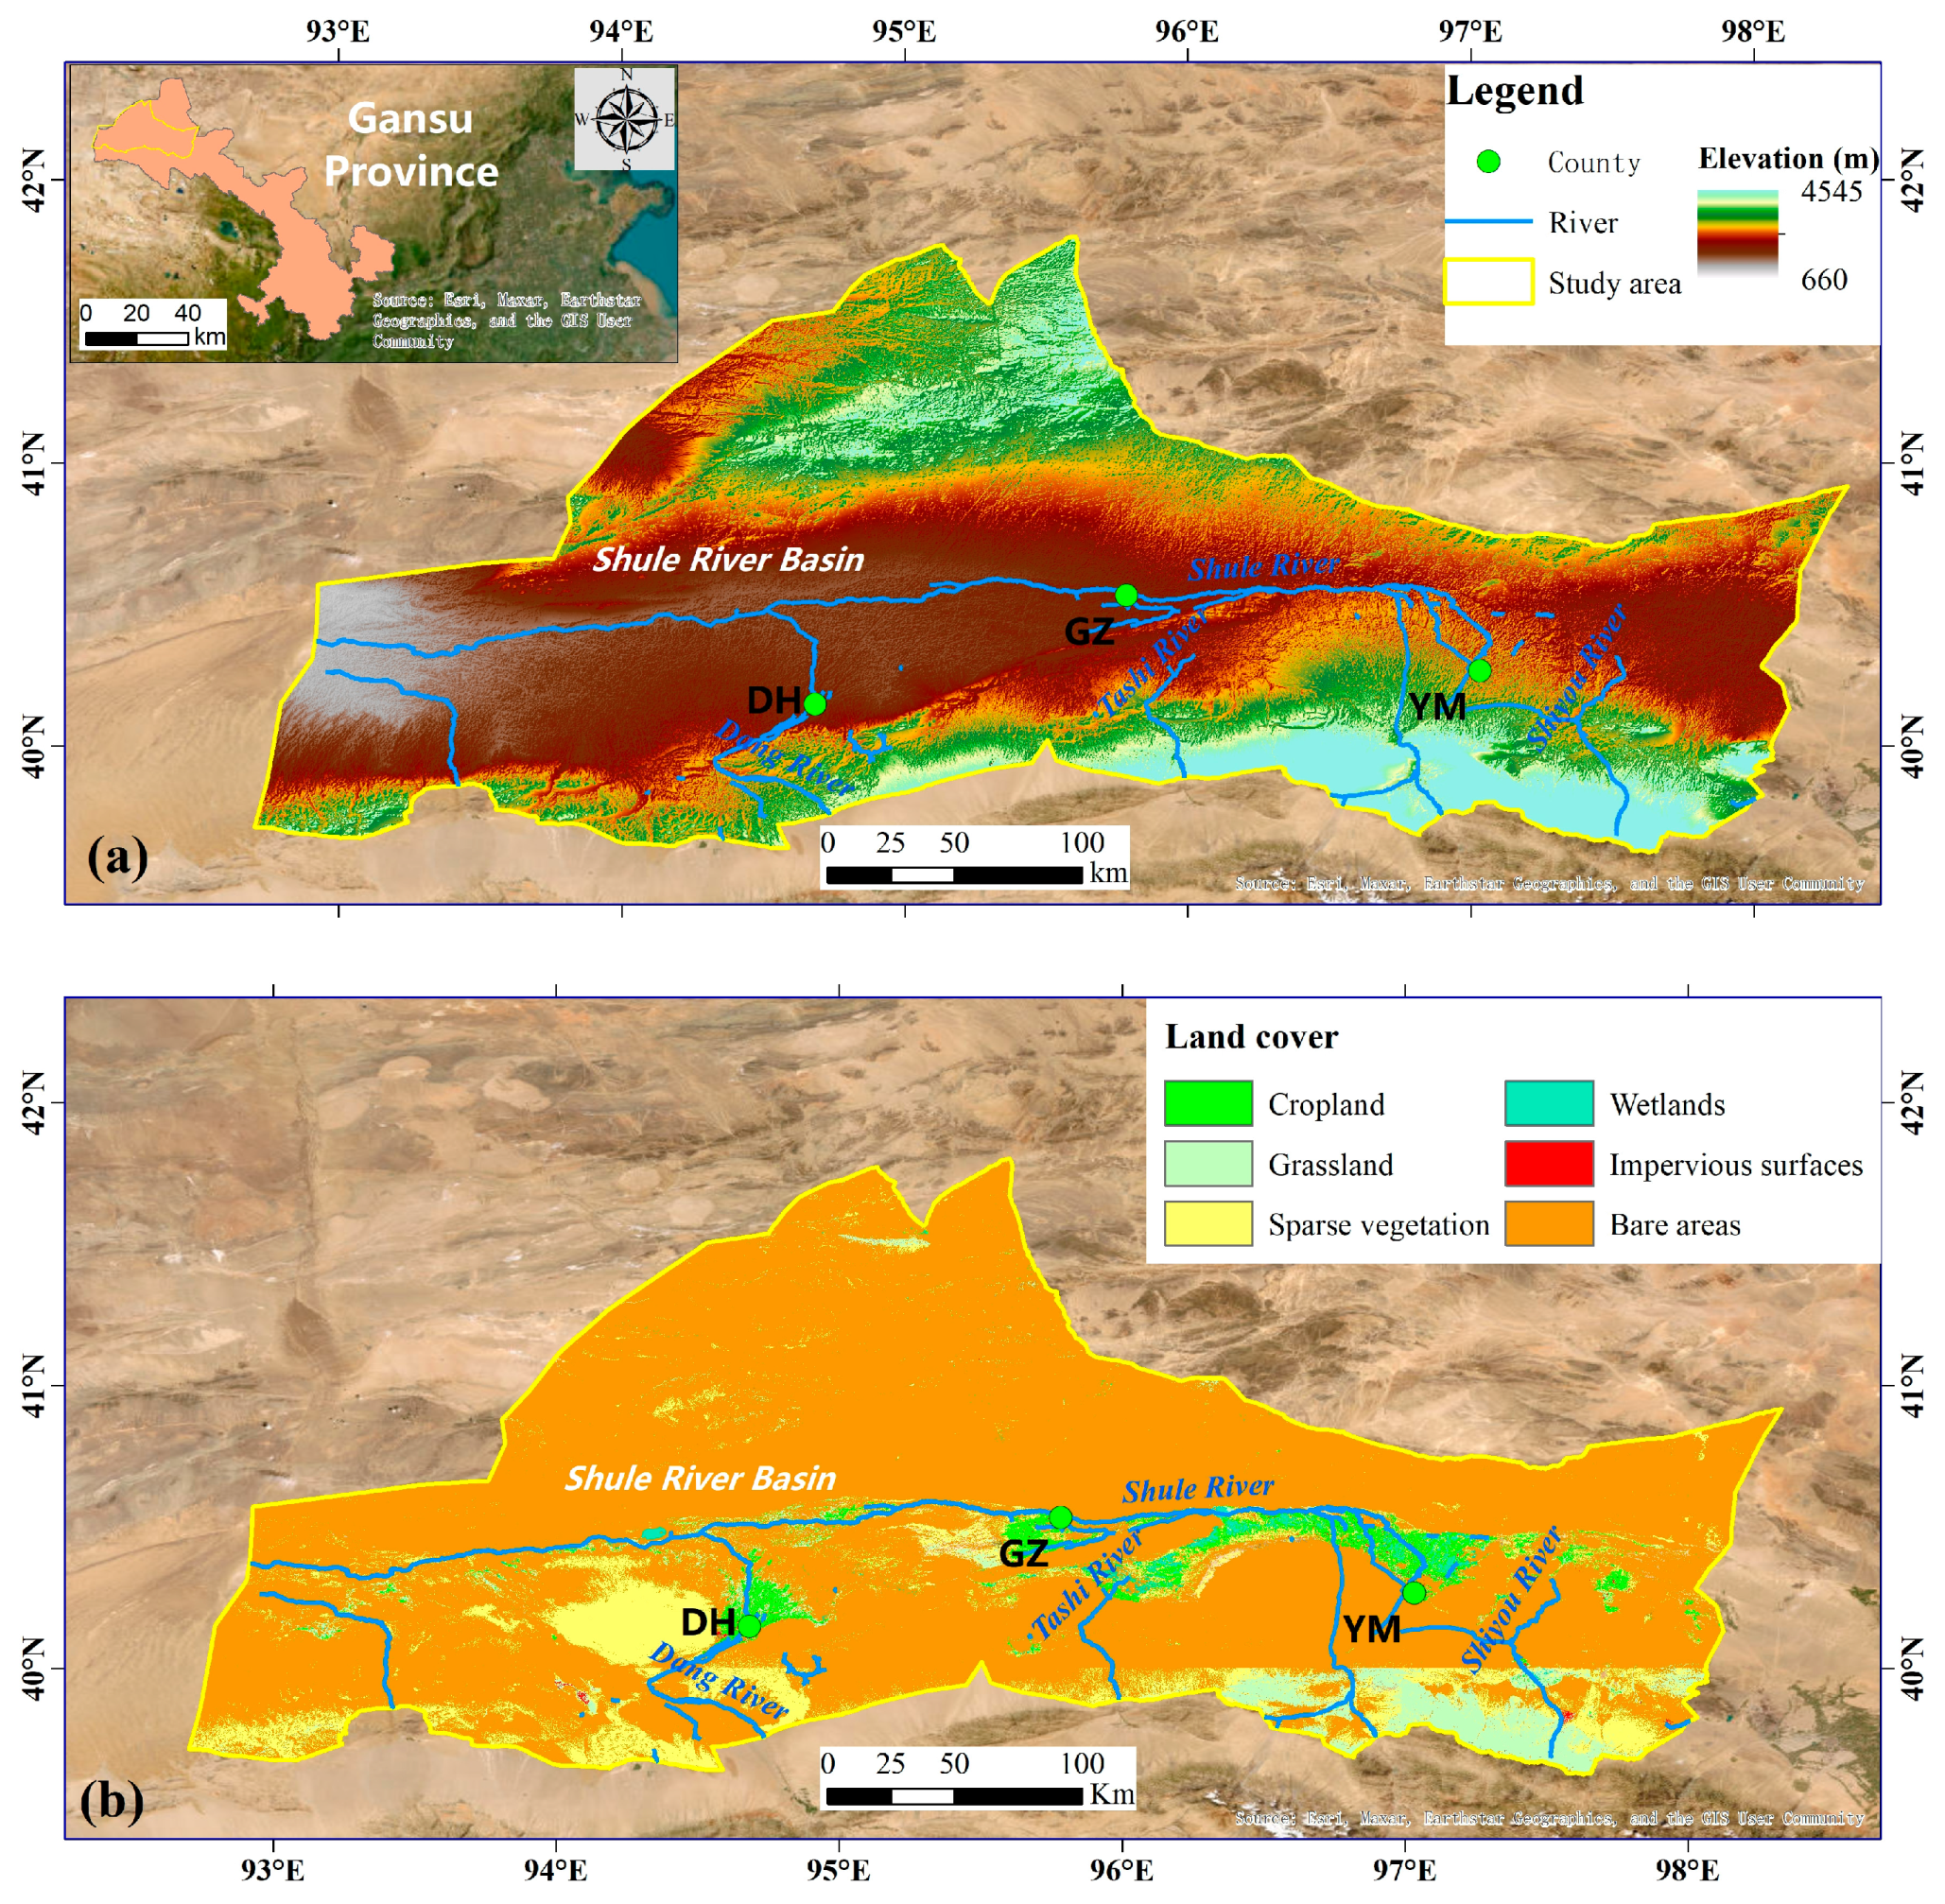
2.1. Study Area
2.2. Datasets
2.2.1. Vegetation
2.2.2. Land Cover
2.2.3. Precipitation
2.2.4. Land Surface Temperature
2.2.5. Surface Water Area
2.2.6. DEM and Road
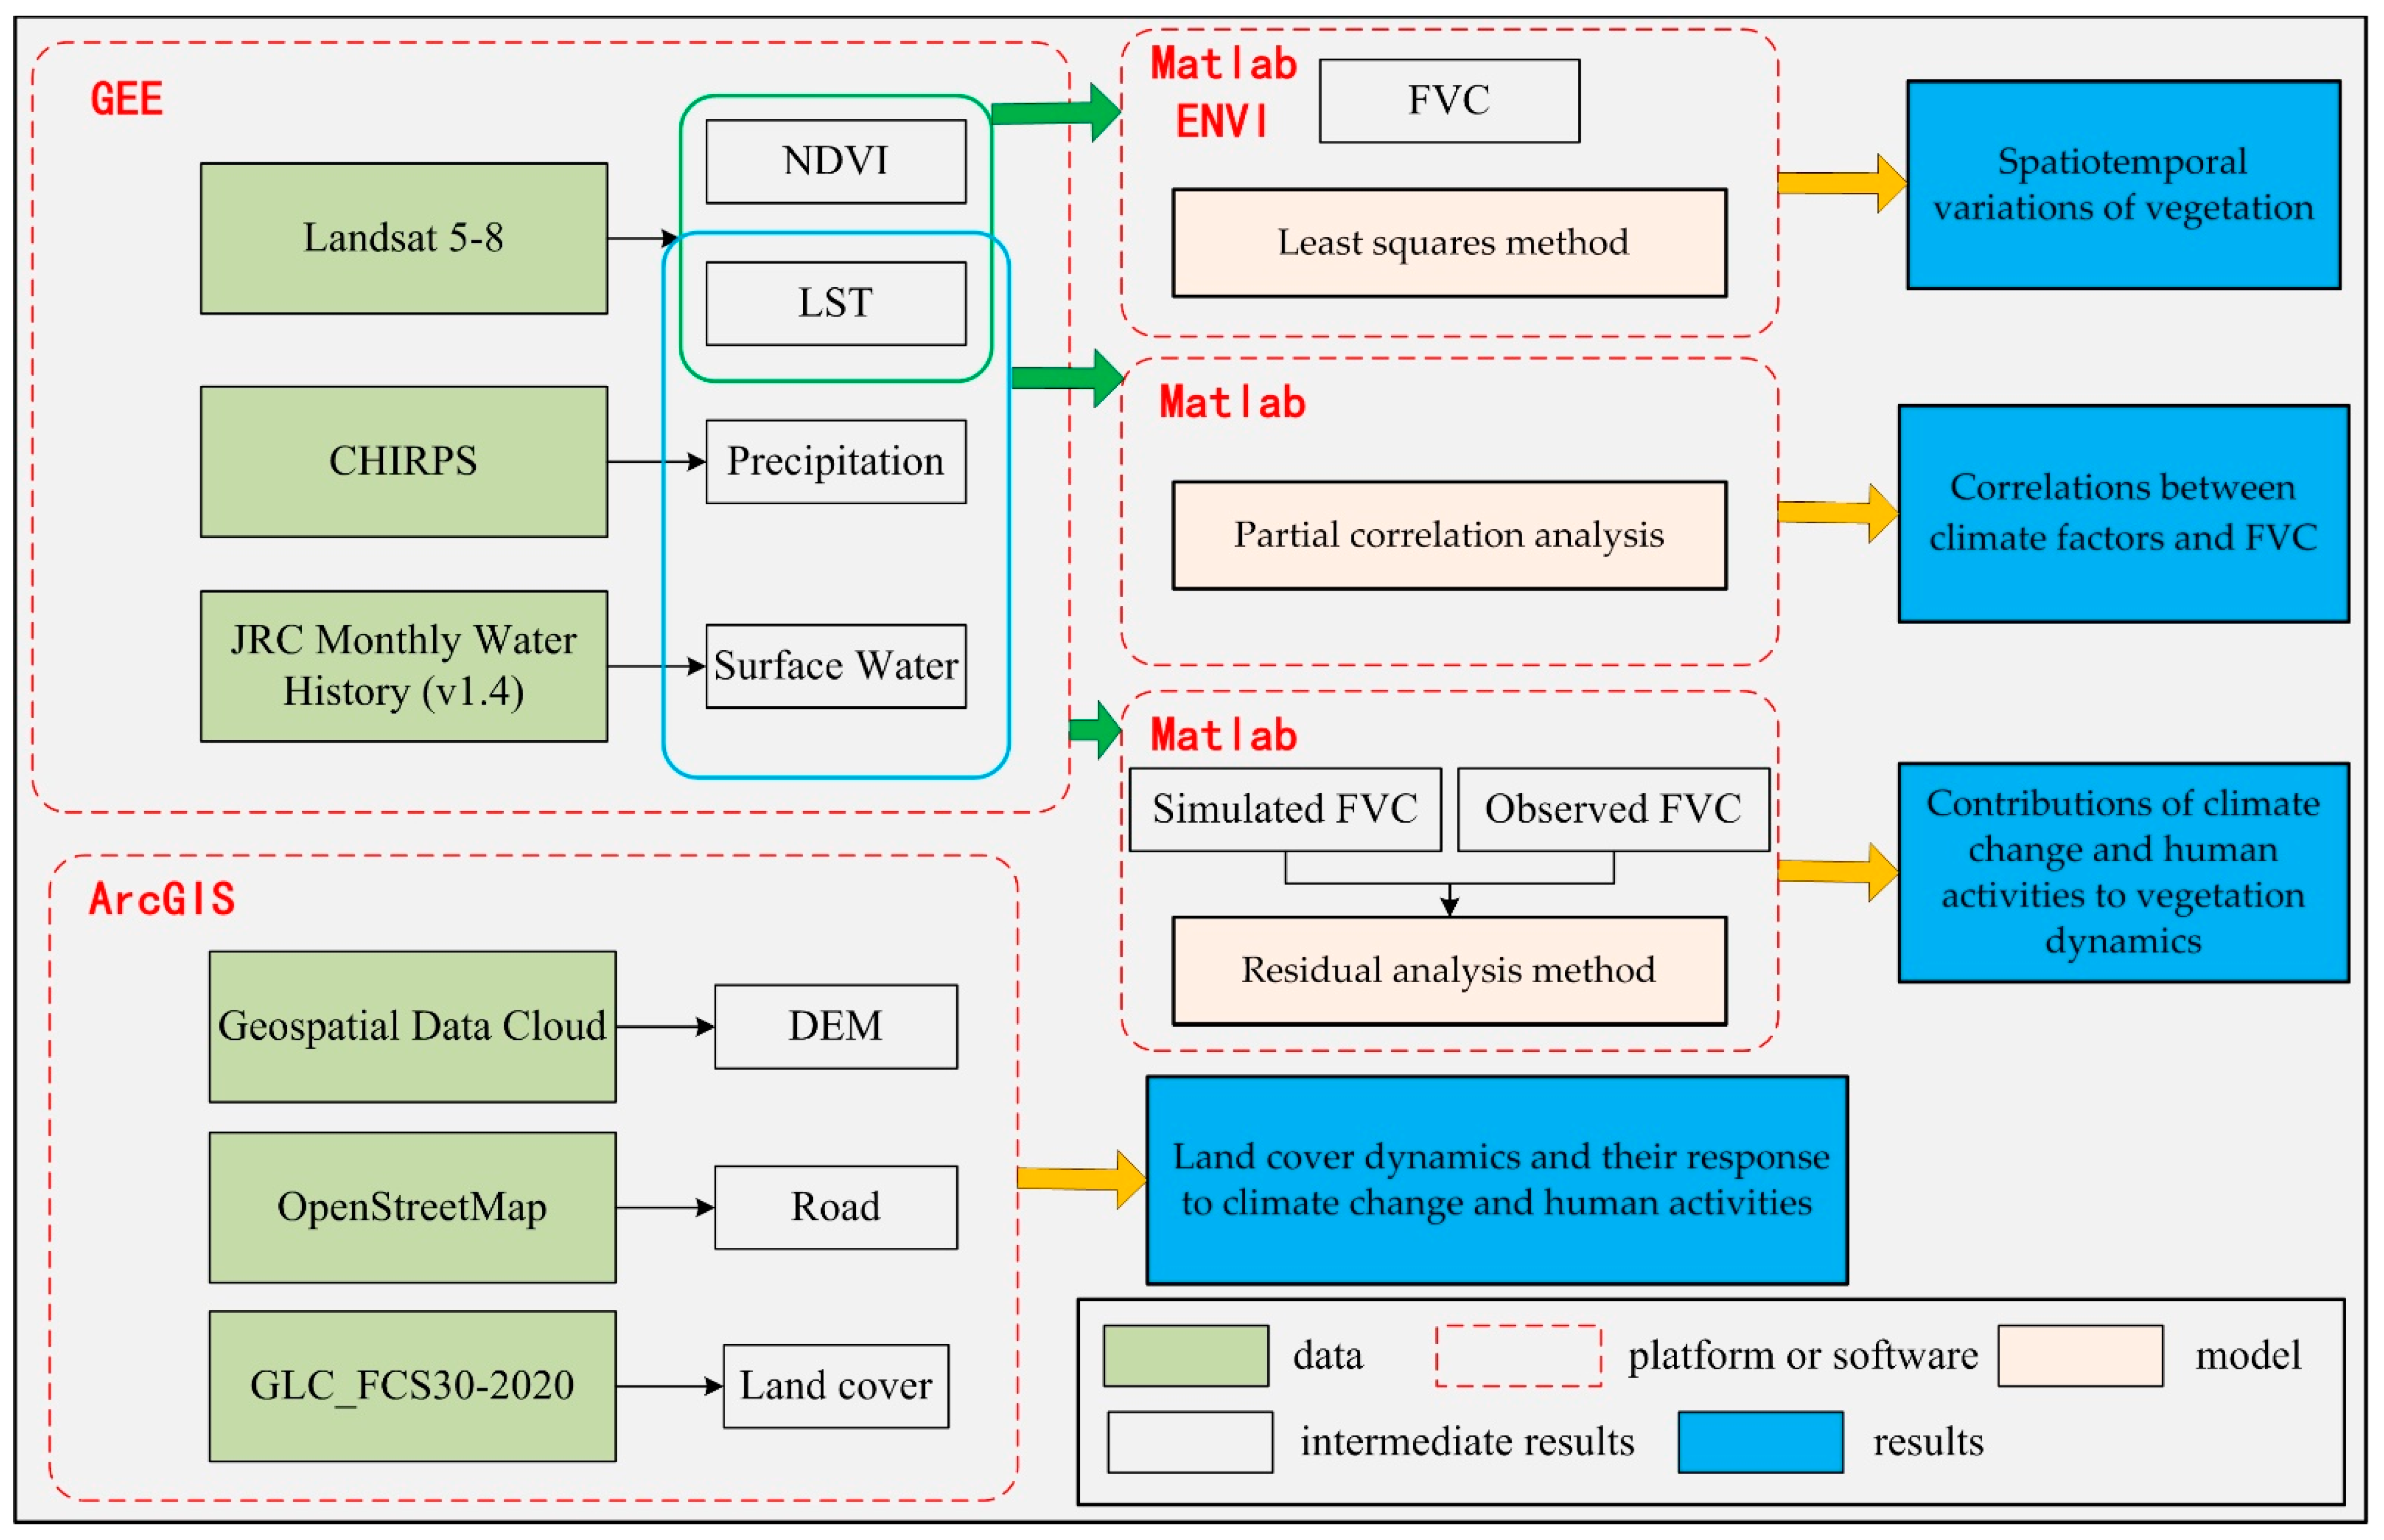
2.3. Methods
2.3.1. Retrieval of FVC Time Series Data
2.3.2. Vegetation Trend Analysis
2.3.3. Partial Correlation Analysis
2.3.4. Calculating Contribution of Driving Factors to Variation in FVC
3. Results
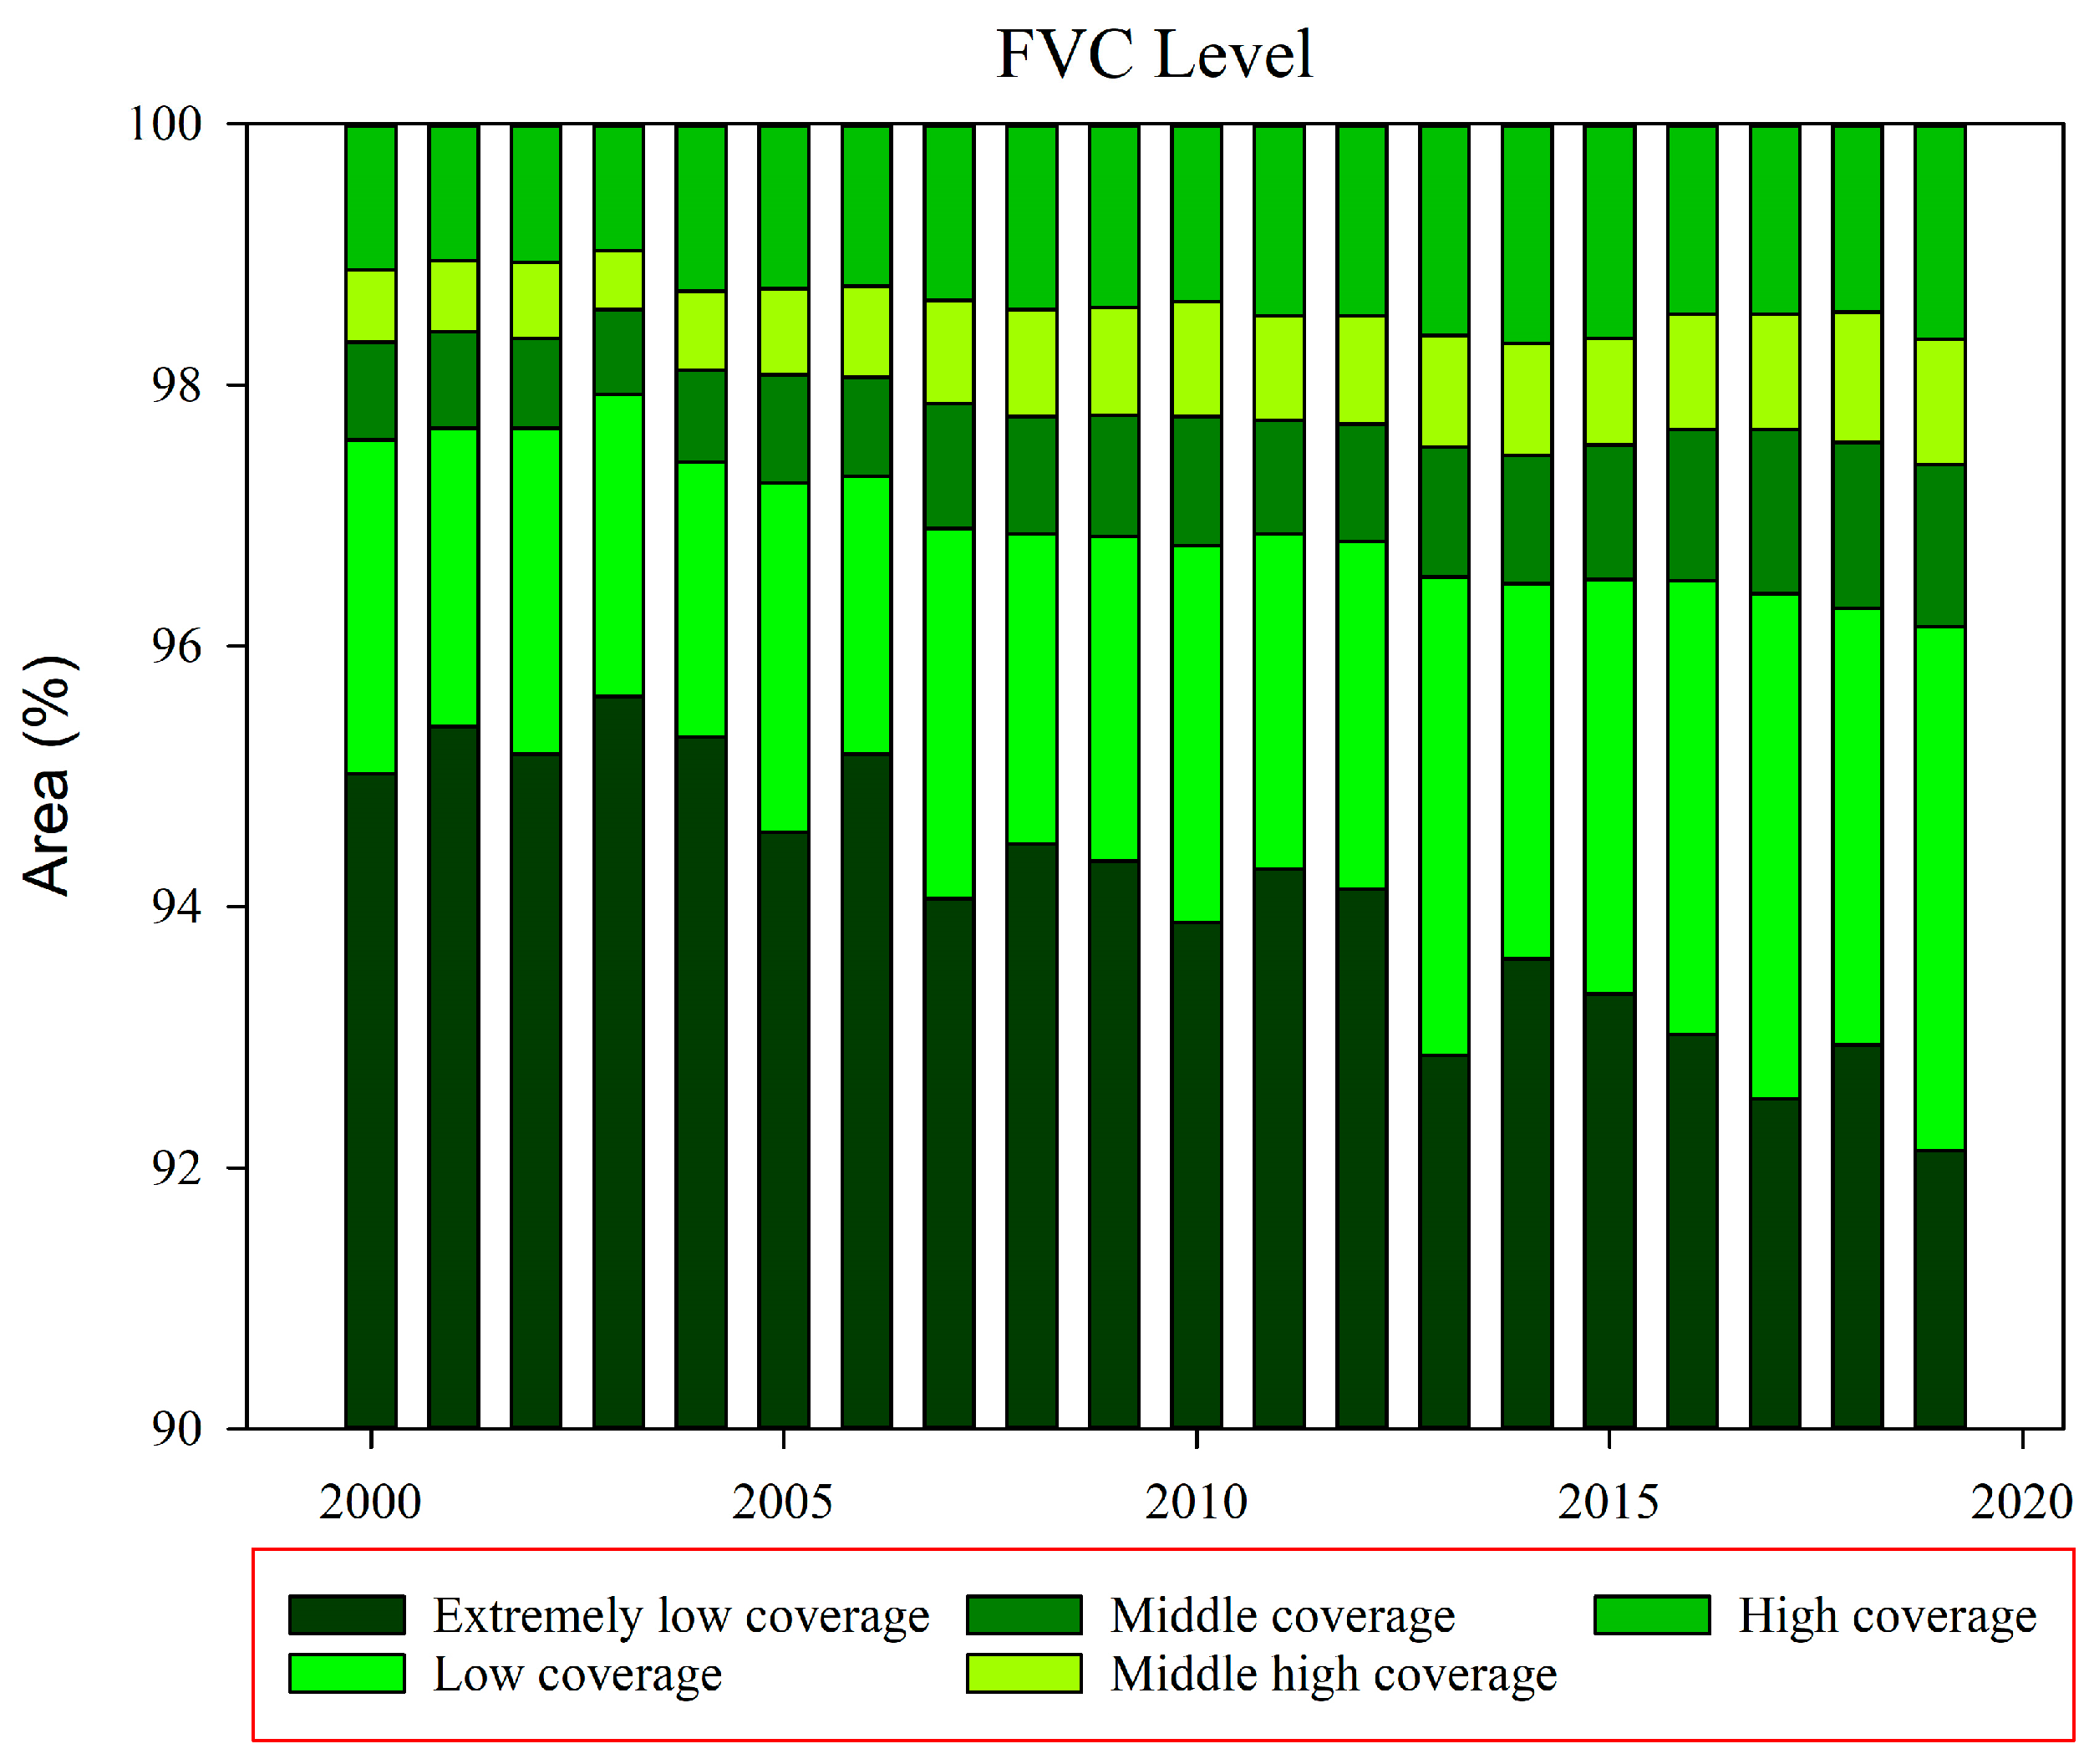
3.1. Temporal Change of Vegetation
3.2. Spatial Pattern of Vegetation Dynamics
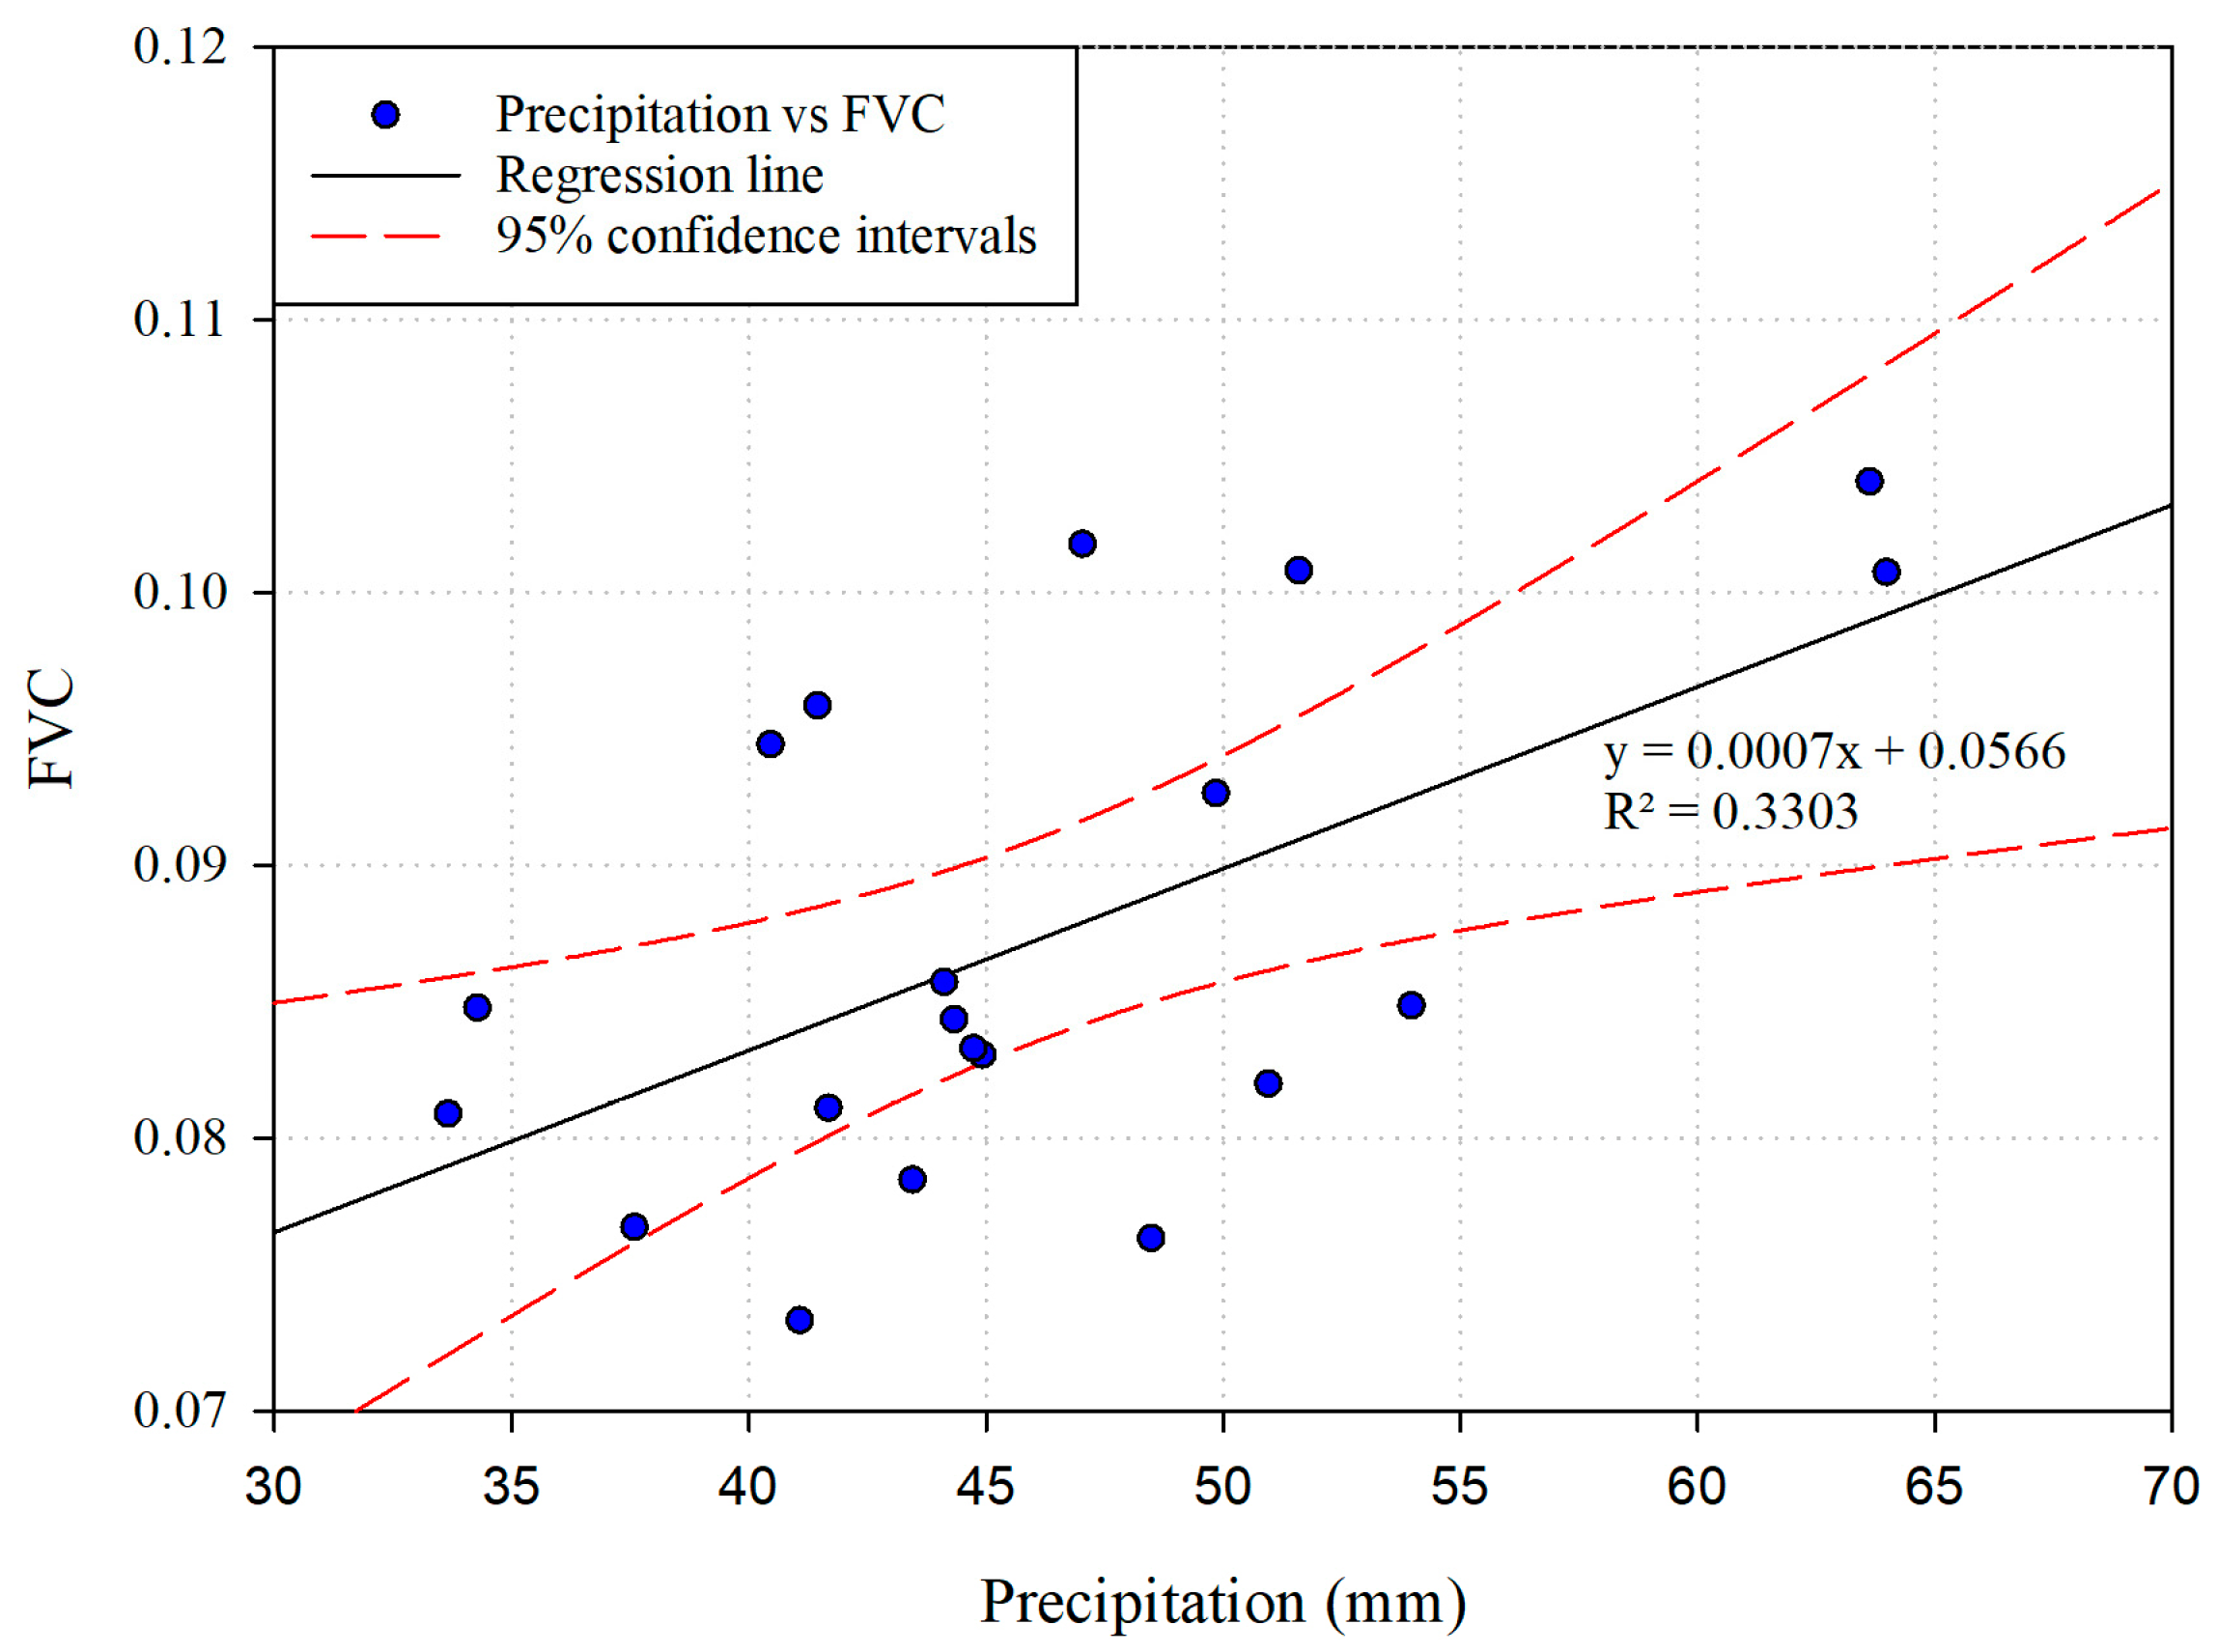
3.3. Correlations between Climate Factors and FVC
4. Discussion
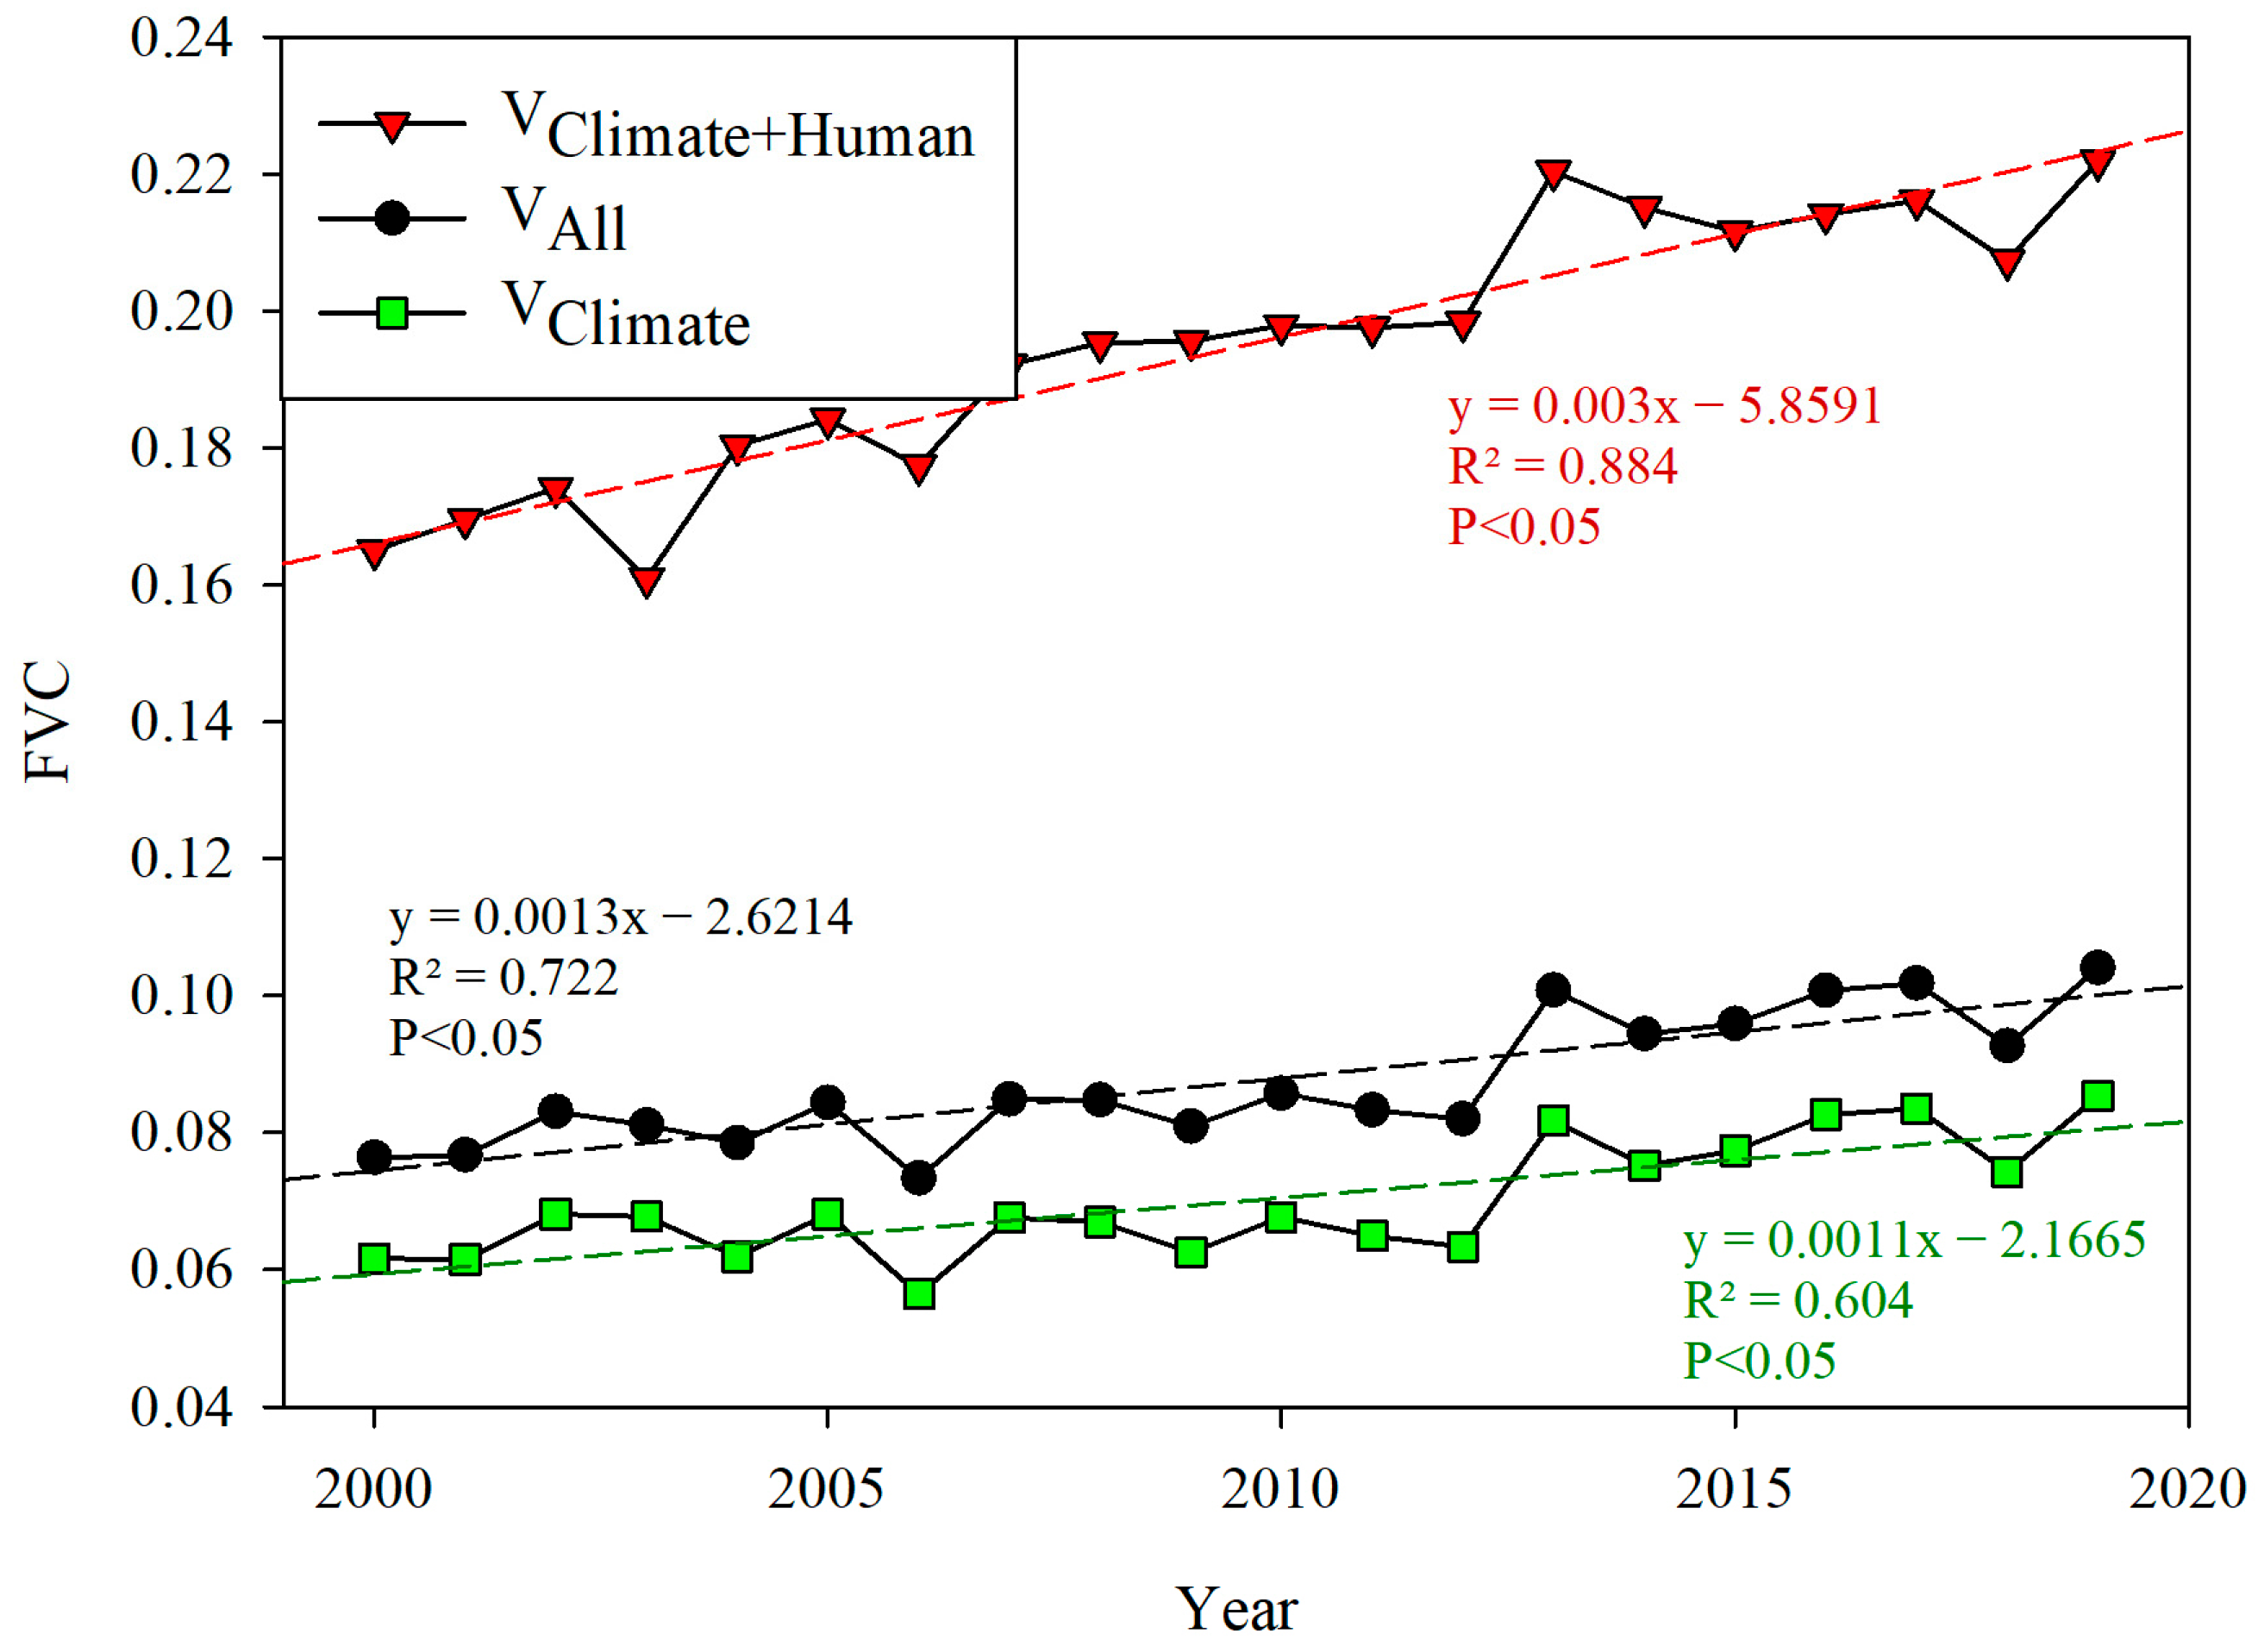
4.1. Contributions of Climate Change and Human Activities to Vegetation Dynamics
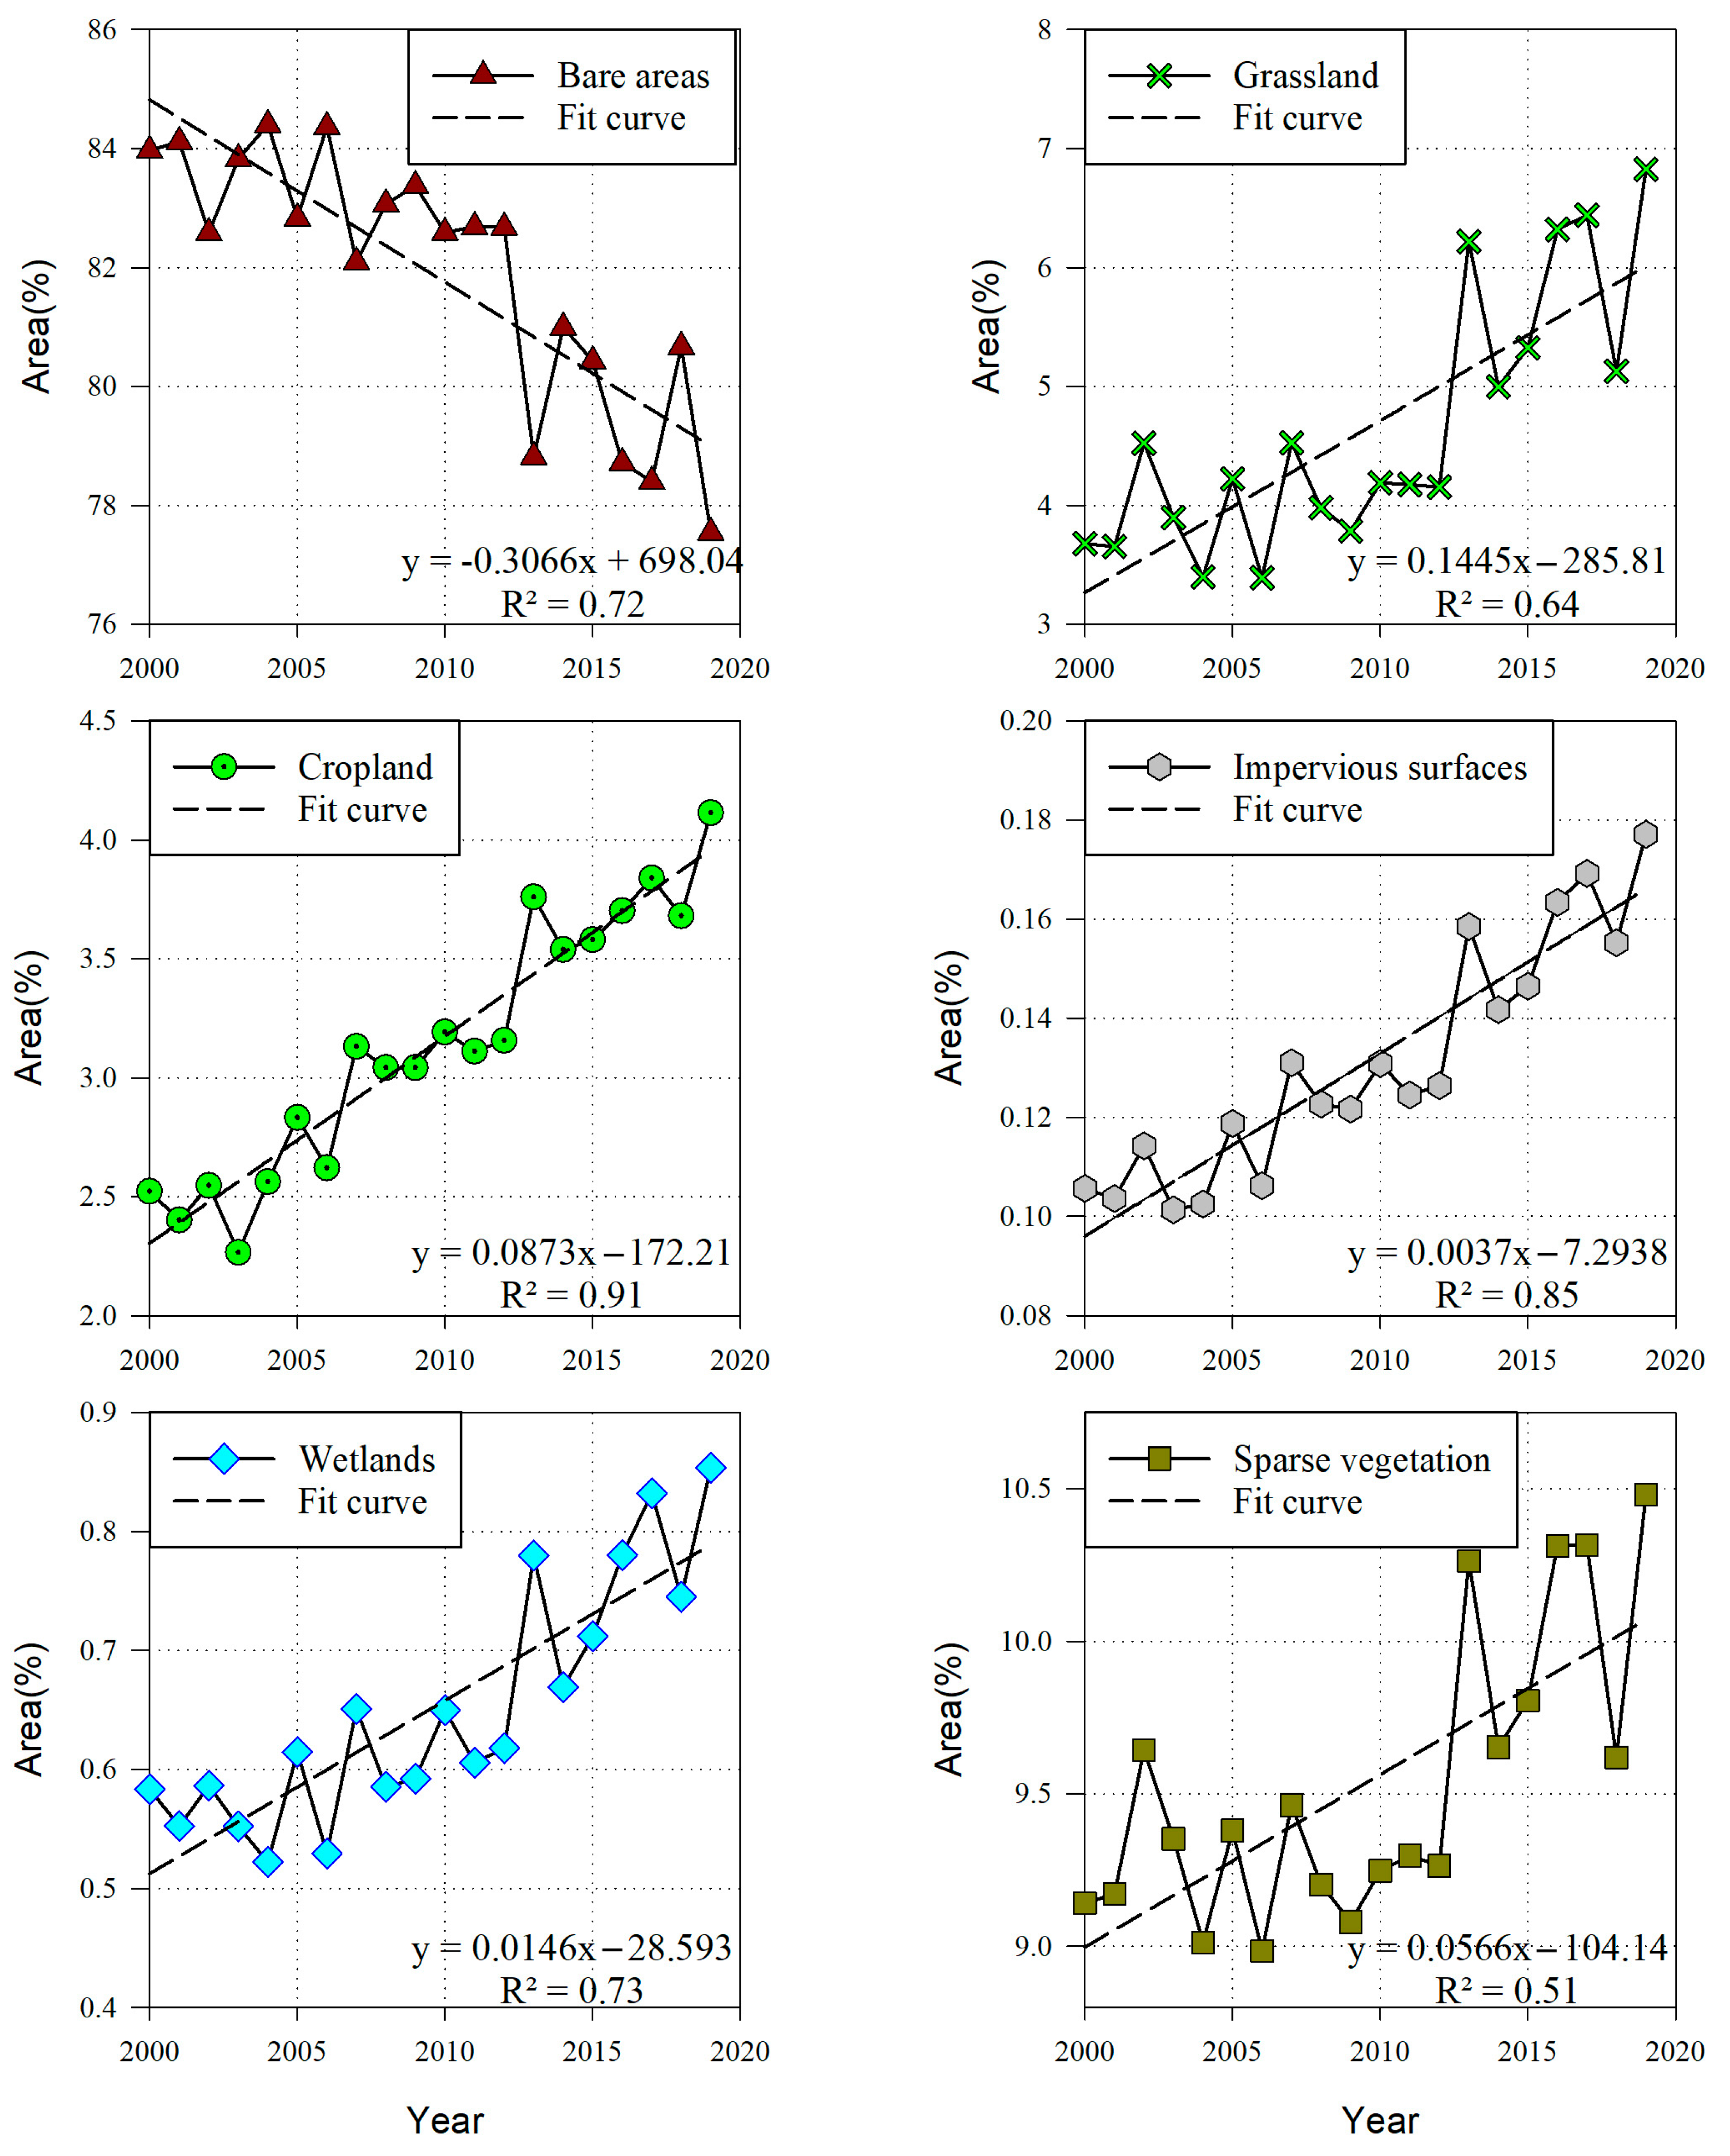
4.2. Land Cover Dynamics and Their Response to Climate Change and Human Activities
5. Conclusions
Author Contributions
Funding
Data Availability Statement
Conflicts of Interest
References
- Lunetta, R.S.; Knight, J.F.; Ediriwickrema, J.; Lyon, J.G.; Worthy, L.D. Land-cover change detection using multi-temporal MODIS NDVI data. Remote Sens. Environ. 2006, 105, 142–154. [Google Scholar] [CrossRef]
- Guan, Q.; Yang, L.; Guan, W.; Wang, F.; Liu, Z.; Xu, C. Assessing vegetation response to climatic variations and human activities: Spatiotemporal NDVI variations in the Hexi Corridor and surrounding areas from 2000 to 2010. Theor. Appl. Climatol. 2018, 135, 1179–1193. [Google Scholar] [CrossRef]
- Wang, H.; Liu, G.; Li, Z.; Wang, P.; Wang, Z. Comparative Assessment of Vegetation Dynamics under the Influence of Climate Change and Human Activities in Five Ecologically Vulnerable Regions of China from 2000 to 2015. Forests 2019, 10, 317. [Google Scholar] [CrossRef]
- Chen, Y.; Li, Z.; Fan, Y.; Wang, H.; Deng, H. Progress and prospects of climate change impacts on hydrology in the arid region of northwest China. Environ. Res. 2015, 139, 11–19. [Google Scholar] [CrossRef] [PubMed]
- Fokeng, R.M.; Fogwe, Z.N. Landsat NDVI-based vegetation degradation dynamics and its response to rainfall variability and anthropogenic stressors in Southern Bui Plateau, Cameroon. Geosyst. Geoenviron. 2022, 1, 100075. [Google Scholar] [CrossRef]
- Jiang, H.; Xu, X.; Guan, M.; Wang, L.; Huang, Y.; Jiang, Y. Determining the contributions of climate change and human activities to vegetation dynamics in agro-pastural transitional zone of northern China from 2000 to 2015. Sci. Total Environ. 2020, 718, 134871. [Google Scholar] [CrossRef] [PubMed]
- Liu, Y.; Zhang, Z.; Tong, L.; Khalifa, M.; Wang, Q.; Gang, C.; Wang, Z.; Li, J.; Sun, Z. Assessing the effects of climate variation and human activities on grassland degradation and restoration across the globe. Ecol. Indic. 2019, 106, 105504. [Google Scholar] [CrossRef]
- Sun, B.; Li, Z.; Gao, W.; Zhang, Y.; Gao, Z.; Song, Z.; Qin, P.; Tian, X. Identification and assessment of the factors driving vegetation degradation/regeneration in drylands using synthetic high spatiotemporal remote sensing Data—A case study in Zhenglanqi, Inner Mongolia, China. Ecol. Indic. 2019, 107, 105614. [Google Scholar] [CrossRef]
- Xue, X.; Wang, Z.; Hou, S. NDVI-Based Vegetation Dynamics and Response to Climate Changes and Human Activities in Guizhou Province, China. Forests 2023, 14, 753. [Google Scholar] [CrossRef]
- Gao, W.; Zheng, C.; Liu, X.; Lu, Y.; Chen, Y.; Wei, Y.; Ma, Y. NDVI-based vegetation dynamics and their responses to climate change and human activities from 1982 to 2020: A case study in the Mu Us Sandy Land, China. Ecol. Indic. 2022, 137, 108745. [Google Scholar] [CrossRef]
- Yu, M.; Song, S.; He, G.; Shi, Y. Vegetation Landscape Changes and Driving Factors of Typical Karst Region in the Anthropocene. Remote Sens. 2022, 14, 5391. [Google Scholar] [CrossRef]
- He, J.; Shi, X.; Fu, Y. Identifying vegetation restoration effectiveness and driving factors on different micro-topographic types of hilly Loess Plateau: From the perspective of ecological resilience. J. Environ. Manag. 2021, 289, 112562. [Google Scholar] [CrossRef] [PubMed]
- Zhang, X.; Jin, X. Vegetation dynamics and responses to climate change and anthropogenic activities in the Three-River Headwaters Region, China. Ecol. Indic. 2021, 131, 108223. [Google Scholar] [CrossRef]
- Liu, N.; Ding, Y.; Peng, S. Temporal effects of climate on vegetation trigger the response biases of vegetation to human activities. Glob. Ecol. Conserv. 2021, 31, e01822. [Google Scholar] [CrossRef]
- Teng, M.; Zeng, L.; Hu, W.; Wang, P.; Yan, Z.; He, W.; Zhang, Y.; Huang, Z.; Xiao, W. The impacts of climate changes and human activities on net primary productivity vary across an ecotone zone in Northwest China. Sci. Total Environ. 2020, 714, 136691. [Google Scholar] [CrossRef] [PubMed]
- Zhao, S.; Pereira, P.; Wu, X.; Zhou, J.; Cao, J.; Zhang, W. Global karst vegetation regime and its response to climate change and human activities. Ecol. Indic. 2020, 113, 106208. [Google Scholar] [CrossRef]
- Yin, L.; Dai, E.; Zheng, D.; Wang, Y.; Ma, L.; Tong, M. What drives the vegetation dynamics in the Hengduan Mountain region, southwest China: Climate change or human activity? Ecol. Indic. 2020, 112, 106013. [Google Scholar] [CrossRef]
- Chen, T.; Bao, A.; Jiapaer, G.; Guo, H.; Zheng, G.; Jiang, L.; Chang, C.; Tuerhanjiang, L. Disentangling the relative impacts of climate change and human activities on arid and semiarid grasslands in Central Asia during 1982-2015. Sci. Total Environ. 2019, 653, 1311–1325. [Google Scholar] [CrossRef]
- Meng, M.; Huang, N.; Wu, M.; Pei, J.; Wang, J.; Niu, Z. Vegetation change in response to climate factors and human activities on the Mongolian Plateau. PeerJ 2019, 7, e7735. [Google Scholar] [CrossRef]
- Ma, Q.; Long, Y.; Jia, X.; Wang, H.; Li, Y. Vegetation response to climatic variation and human activities on the Ordos Plateau from 2000 to 2016. Environ. Earth Sci. 2019, 78, 709. [Google Scholar] [CrossRef]
- Liu, R.; Xiao, L.; Liu, Z.; Dai, J. Quantifying the relative impacts of climate and human activities on vegetation changes at the regional scale. Ecol. Indic. 2018, 93, 91–99. [Google Scholar] [CrossRef]
- Wu, Z.Y.; Saito, Y.; Zhao, D.N.; Zhou, J.Q.; Cao, Z.Y.; Li, S.J.; Shang, J.H.; Liang, Y.Y. Impact of human activities on subaqueous topographic change in Lingding Bay of the Pearl River estuary, China, during 1955–2013. Sci. Rep. 2016, 6, 37742. [Google Scholar] [CrossRef]
- Zhang, J.; Niu, J.; Bao, T.; Buyantuyev, A.; Zhang, Q.; Dong, J.; Zhang, X. Human induced dryland degradation in Ordos Plateau, China, revealed by multilevel statistical modeling of normalized difference vegetation index and rainfall time-series. J. Arid. Land. 2013, 6, 219–229. [Google Scholar] [CrossRef]
- Yang, T.; Zhang, Q.; Wang, W.; Yu, Z.; Chen, Y.D.; Lu, G.; Hao, Z.; Baron, A.; Zhao, C.; Chen, X.; et al. Review of Advances in Hydrologic Science in China in the Last Decades: Impact Study of Climate Change and Human Activities. J. Hydrol. Eng. 2013, 18, 1380–1384. [Google Scholar] [CrossRef]
- Tu, X.; Zhang, Q.; Singh, V.P.; Chen, X.; Liu, C.-L.; Wang, S.-B. Space–time changes in hydrological processes in response to human activities and climatic change in the south China. Stoch. Environ. Res. Risk Assess. 2011, 26, 823–834. [Google Scholar] [CrossRef]
- Liu, X.; Du, G.; Bi, H.; Li, Z.; Zhang, X. Normal Difference Vegetation Index Simulation and Driving Analysis of the Tibetan Plateau Based on Deep Learning Algorithms. Forests 2024, 15, 137. [Google Scholar] [CrossRef]
- Li, G.; Liang, J.; Wang, S.; Zhou, M.; Sun, Y.; Wang, J.; Fan, J. Characteristics and Drivers of Vegetation Change in Xinjiang, 2000–2020. Forests 2024, 15, 231. [Google Scholar] [CrossRef]
- Hou, X.; Zhang, B.; Chen, J.; Zhou, J.; He, Q.-Q.; Yu, H. Response of Vegetation Productivity to Greening and Drought in the Loess Plateau Based on VIs and SIF. Forests 2024, 15, 339. [Google Scholar] [CrossRef]
- Zhang, Q.; Gu, L.; Liu, Y.; Zhang, Y. Spatio-Temporal Dynamics of Normalized Difference Vegetation Index and Its Response to Climate Change in Xinjiang, 2000–2022. Forests 2024, 15, 370. [Google Scholar] [CrossRef]
- He, Q.; Yang, Q.; Jiang, S.; Zhan, C. A Comprehensive Analysis of Vegetation Dynamics and Their Response to Climate Change in the Loess Plateau: Insight from Long-Term kernel Normalized Difference Vegetation Index Data. Forests 2024, 15, 471. [Google Scholar] [CrossRef]
- Shi, S.; Yu, J.; Wang, F.; Wang, P.; Zhang, Y.; Jin, K. Quantitative contributions of climate change and human activities to vegetation changes over multiple time scales on the Loess Plateau. Sci. Total Environ. 2021, 755, 142419. [Google Scholar] [CrossRef] [PubMed]
- Li, B.; Chen, L.; Wang, Q.; Wang, P. Analysis of Linkage between Long-Term Morphological Spatial Pattern Analysis and Vegetation Carbon Storage of Forests in Hunan, China. Forests 2024, 15, 428. [Google Scholar] [CrossRef]
- Araujo, H.F.P.; Canassa, N.F.; Machado, C.C.C.; Tabarelli, M. Human disturbance is the major driver of vegetation changes in the Caatinga dry forest region. Sci. Rep. 2023, 13, 18440. [Google Scholar] [CrossRef] [PubMed]
- Zhu, B.; Zhang, Z.; Tian, J.; Kong, R.; Chen, X. Increasing Negative Impacts of Climatic Change and Anthropogenic Activities on Vegetation Variation on the Qinghai–Tibet Plateau during 1982–2019. Remote Sens. 2022, 14, 4735. [Google Scholar] [CrossRef]
- Wang, X.; Zhang, X.; Li, W.; Cheng, X.; Zhou, Z.; Liu, Y.; Wu, X.; Hao, J.; Ling, Q.; Deng, L.; et al. Quantitative Analysis of Climate Variability and Human Activities on Vegetation Variations in the Qilian Mountain National Nature Reserve from 1986 to 2021. Forests 2023, 14, 2042. [Google Scholar] [CrossRef]
- Ma, S.; Wang, L.-J.; Jiang, J.; Chu, L.; Zhang, J.-C. Threshold effect of ecosystem services in response to climate change and vegetation coverage change in the Qinghai-Tibet Plateau ecological shelter. J. Clean. Prod. 2021, 318, 128592. [Google Scholar] [CrossRef]
- Luo, D.L.; Jin, H.J.; Bense, V.F. Ground surface temperature and the detection of permafrost in the rugged topography on NE Qinghai-Tibet Plateau. Geoderma 2019, 333, 57–68. [Google Scholar] [CrossRef]
- Aizizi, Y.; Kasimu, A.; Liang, H.; Zhang, X.; Wei, B.; Zhao, Y.; Ainiwaer, M. Evaluation of Ecological Quality Status and Changing Trend in Arid Land Based on the Remote Sensing Ecological Index: A Case Study in Xinjiang, China. Forests 2023, 14, 1830. [Google Scholar] [CrossRef]
- Sharma, R.C. Dominant Species-Physiognomy-Ecological (DSPE) System for the Classification of Plant Ecological Communities from Remote Sensing Images. Ecologies 2022, 3, 323–335. [Google Scholar] [CrossRef]
- Li, S.; Yan, J.; Liu, X.; Wan, J. Response of vegetation restoration to climate change and human activities in Shaanxi-Gansu-Ningxia Region. J. Geogr. Sci. 2013, 23, 98–112. [Google Scholar] [CrossRef]
- Akiyama, T.; Kharrazi, A.; Li, J.; Avtar, R. Agricultural water policy reforms in China: A representative look at Zhangye City, Gansu Province, China. Environ. Monit. Assess. 2017, 190, 9. [Google Scholar] [CrossRef] [PubMed]
- Zhang, H.; He, Z.; Xu, J.; Mu, W.; Chen, Y.; Wang, G. Analysis of Spatial and Temporal Changes in Vegetation Cover and Driving Forces in the Wuding River Basin, Loess Plateau. Forests 2024, 15, 82. [Google Scholar] [CrossRef]
- Liu, C.; Zhang, X.; Wang, T.; Chen, G.; Zhu, K.; Wang, Q.; Wang, J. Detection of vegetation coverage changes in the Yellow River Basin from 2003 to 2020. Ecol. Indic. 2022, 138, 108818. [Google Scholar] [CrossRef]
- Ma, L.; Bo, J.; Li, X.; Fang, F.; Cheng, W. Identifying key landscape pattern indices influencing the ecological security of inland river basin: The middle and lower reaches of Shule River Basin as an example. Sci. Total Environ. 2019, 674, 424–438. [Google Scholar] [CrossRef] [PubMed]
- Funk, C.; Peterson, P.; Landsfeld, M.; Pedreros, D.; Verdin, J.; Shukla, S.; Husak, G.; Rowland, J.; Harrison, L.; Hoell, A.; et al. The climate hazards infrared precipitation with stations—A new environmental record for monitoring extremes. Sci. Data 2015, 2, 150066. [Google Scholar] [CrossRef] [PubMed]
- Ermida, S.L.; Soares, P.; Mantas, V.; Göttsche, F.-M.; Trigo, I.F. Google Earth Engine Open-Source Code for Land Surface Temperature Estimation from the Landsat Series. Remote Sens. 2020, 12, 1471. [Google Scholar] [CrossRef]
- Luo, D.; Jin, H.; Wu, Q.; Bense, V.F.; He, R.; Ma, Q.; Gao, S.; Jin, X.; Lu, L. Thermal regime of warm-dry permafrost in relation to ground surface temperature in the Source Areas of the Yangtze and Yellow rivers on the Qinghai-Tibet Plateau, SW China. Sci. Total Environ. 2018, 618, 1033–1045. [Google Scholar] [CrossRef] [PubMed]
- Pekel, J.F.; Cottam, A.; Gorelick, N.; Belward, A.S. High-resolution mapping of global surface water and its long-term changes. Nature 2016, 540, 418–422. [Google Scholar] [CrossRef] [PubMed]
- Xia, C.; Liu, G.; Zhou, J.; Meng, Y.; Chen, K.; Gu, P.; Yang, M.; Huang, X.; Mei, J. Revealing the impact of water conservancy projects and urbanization on hydrological cycle based on the distribution of hydrogen and oxygen isotopes in water. Environ. Sci. Pollut. Res. Int. 2021, 28, 40160–40177. [Google Scholar] [CrossRef] [PubMed]
- Liang, W.; Quan, Q.; Wu, B.; Mo, S. Response of Vegetation Dynamics in the Three-North Region of China to Climate and Human Activities from 1982 to 2018. Sustainability 2023, 15, 3073. [Google Scholar] [CrossRef]
- Carlson, T.N.; Ripley, D.A. On the relation between NDVI, fractional vegetation cover, and leaf area index. Remote Sens. Environ. 1997, 62, 241–252. [Google Scholar] [CrossRef]
- Wang, Y.; Zhang, J.; Tong, S.; Guo, E. Monitoring the trends of aeolian desertified lands based on time-series remote sensing data in the Horqin Sandy Land, China. Catena 2017, 157, 286–298. [Google Scholar] [CrossRef]
- Xu, X.; Liu, H.; Jiao, F.; Gong, H.; Lin, Z. Time-varying trends of vegetation change and their driving forces during 1981–2016 along the silk road economic belt. Catena 2020, 195, 104796. [Google Scholar] [CrossRef]
- Zhang, Y.; Zhang, C.; Wang, Z.; Chen, Y.; Gang, C.; An, R.; Li, J. Vegetation dynamics and its driving forces from climate change and human activities in the Three-River Source Region, China from 1982 to 2012. Sci. Total Environ. 2016, 563–564, 210–220. [Google Scholar] [CrossRef] [PubMed]
- Zhang, D.; Ge, W.; Zhang, Y. Evaluating the vegetation restoration sustainability of ecological projects: A case study of Wuqi County in China. J. Clean. Prod. 2020, 264, 121751. [Google Scholar] [CrossRef]
- Hou, W.; Gao, J.; Wu, S.; Dai, E. Interannual Variations in Growing-Season NDVI and Its Correlation with Climate Variables in the Southwestern Karst Region of China. Remote Sens. 2015, 7, 11105–11124. [Google Scholar] [CrossRef]
- Yin, L.; Wang, X.; Feng, X.; Fu, B.; Chen, Y. A comparison of SSEBop-Model-Based evapotranspiration with eight evapotranspiration products in the Yellow River Basin, China. Remote Sens. 2020, 12, 2528. [Google Scholar] [CrossRef]
- Yin, L.; Feng, X.; Fu, B.; Chen, Y.; Wang, X.; Tao, F. Irrigation water consumption of irrigated cropland and its dominant factor in China from 1982 to 2015. Adv. Water Resour. 2020, 143, 103661. [Google Scholar] [CrossRef]
- Yang, S.; Liu, J.; Wang, C.; Zhang, T.; Dong, X.; Liu, Y. Vegetation dynamics influenced by climate change and human activities in the Hanjiang River Basin, central China. Ecol. Indic. 2022, 145, 109586. [Google Scholar] [CrossRef]
- Ma, Y.; Wang, W.; Jin, S.; Li, H.; Liu, B.; Gong, W.; Fan, R.; Li, H. Spatiotemporal variation of LAI in different vegetation types and its response to climate change in China from 2001 to 2020. Ecol. Indic. 2023, 156, 111101. [Google Scholar] [CrossRef]
- Wang, N.; Du, Y.; Liang, F.; Wang, H.; Yi, J. The spatiotemporal response of China’s vegetation greenness to human socio-economic activities. J. Environ. Manag. 2022, 305, 114304. [Google Scholar] [CrossRef]
- Gu, Y.; Pang, B.; Qiao, X.; Xu, D.; Li, W.; Yan, Y.; Dou, H.; Ao, W.; Wang, W.; Zou, C.; et al. Vegetation dynamics in response to climate change and human activities in the Hulun Lake basin from 1981 to 2019. Ecol. Indic. 2022, 136, 108700. [Google Scholar] [CrossRef]
- Peng, J.; Jiang, H.; Liu, Q.; Green, S.M.; Quine, T.A.; Liu, H.; Qiu, S.; Liu, Y.; Meersmans, J. Human activity vs. climate change: Distinguishing dominant drivers on LAI dynamics in karst region of southwest China. Sci. Total Environ. 2021, 769, 144297. [Google Scholar] [CrossRef]
- Ibisch, P.L.; Hoffmann, M.T.; Kreft, S.; Pe’er, G.; Kati, V.; Biber-Freudenberger, L.; DellaSala, D.A.; Vale, M.M.; Hobson, P.R.; Selva, N. A global map of roadless areas and their conservation status. Science 2016, 354, 1423–1427. [Google Scholar] [CrossRef] [PubMed]
- Ge, W.; Deng, L.; Wang, F.; Han, J. Quantifying the contributions of human activities and climate change to vegetation net primary productivity dynamics in China from 2001 to 2016. Sci. Total Environ. 2021, 773, 145648. [Google Scholar] [CrossRef]
- Chen, X.; Guan, T.; Zhang, J.; Liu, Y.; Jin, J.; Liu, C.; Wang, G.; Bao, Z. Identifying and Predicting the Responses of Multi-Altitude Vegetation to Climate Change in the Alpine Zone. Forests 2024, 15, 308. [Google Scholar] [CrossRef]
- Ma, M.; Zhang, H.; Qin, J.; Liu, Y.; Wu, B.; Su, X. Analysis of Factors Driving Subtropical Forest Phenology Differentiation, Considering Temperature and Precipitation Time-Lag Effects: A Case Study of Fujian Province. Forests 2024, 15, 334. [Google Scholar] [CrossRef]
- Lin, N.; Li, J.; Jiang, R.; Li, X.; Liu, S. Quantifying the Spatiotemporal Variation of NPP of Different Land Cover Types and the Contribution of Its Associated Factors in the Songnen Plain. Forests 2023, 14, 1841. [Google Scholar] [CrossRef]
- Lai, J.; Zhao, T.; Qi, S. Spatiotemporal Variation in Vegetation and Its Driving Mechanisms in the Southwest Alpine Canyon Area of China. Forests 2023, 14, 2357. [Google Scholar] [CrossRef]
- Liu, L.; Zhang, X.; Gao, Y.; Chen, X.; Shuai, X.; Mi, J. Finer-Resolution Mapping of Global Land Cover: Recent Developments, Consistency Analysis, and Prospects. J. Remote Sens. 2021, 2021, 5289697. [Google Scholar] [CrossRef]
- Gao, Y.; Liu, Z.; Li, R.; Shi, Z. Long-Term Impact of China’s Returning Farmland to Forest Program on Rural Economic Development. Sustainability 2020, 12, 1492. [Google Scholar] [CrossRef]
- Li, Z.; Sun, X.; Huang, Z.; Zhang, X.; Wang, Z.; Li, S.; Zheng, W.; Zhai, B. Changes in nutrient balance, environmental effects, and green development after returning farmland to forests: A case study in Ningxia, China. Sci. Total Environ. 2020, 735, 139370. [Google Scholar] [CrossRef] [PubMed]
- Zhang, X.; Liu, L.; Wu, C.; Chen, X.; Gao, Y.; Xie, S.; Zhang, B. Development of a global 30 m impervious surface map using multisource and multitemporal remote sensing datasets with the Google Earth Engine platform. Earth Syst. Sci. Data 2020, 12, 1625–1648. [Google Scholar] [CrossRef]


| Year | Minimum | Maximum | NDVIsoil (0.5%) | NDVIveg (99.5%) |
|---|---|---|---|---|
| 2000 | −0.488 | 0.905 | 0.004 | 0.659 |
| 2001 | −0.141 | 0.491 | 0.000 | 0.327 |
| 2002 | −0.137 | 0.531 | 0.002 | 0.371 |
| 2003 | −0.482 | 0.993 | 0.004 | 0.600 |
| 2004 | −0.083 | 0.550 | 0.001 | 0.378 |
| 2005 | −0.385 | 0.541 | 0.000 | 0.356 |
| 2006 | −0.135 | 0.696 | 0.002 | 0.412 |
| 2007 | −0.365 | 0.543 | 0.002 | 0.365 |
| 2008 | −0.379 | 0.561 | 0.000 | 0.373 |
| 2009 | −0.153 | 0.554 | 0.002 | 0.363 |
| 2010 | −0.087 | 0.552 | 0.000 | 0.397 |
| 2011 | −0.163 | 0.554 | 0.003 | 0.416 |
| 2012 | −0.087 | 0.662 | 0.004 | 0.433 |
| 2013 | −0.085 | 0.691 | 0.015 | 0.521 |
| 2014 | −0.048 | 0.669 | 0.017 | 0.520 |
| 2015 | 0.001 | 0.686 | 0.017 | 0.516 |
| 2016 | −0.009 | 0.680 | 0.015 | 0.501 |
| 2017 | −0.055 | 0.680 | 0.015 | 0.507 |
| 2018 | −0.035 | 0.677 | 0.018 | 0.520 |
| 2019 | −0.106 | 0.671 | 0.016 | 0.513 |
| Trend of FVC | p | Slope | Area (%) | |||
|---|---|---|---|---|---|---|
| 2000–2004 | 2005–2009 | 2010–2014 | 2015–2019 | |||
| Significantly increased | p < 0.05 | slope ≥ 0.01 | 0.20 | 0.38 | 0.89 | 0.68 |
| Significantly decreased | p < 0.05 | slope ≤ −0.01 | 0.29 | 0.21 | 0.32 | 0.25 |
| Significantly stable | p < 0.05 | −0.01 < slope < 0.01 | 46.75 | 46.59 | 48.18 | 46.65 |
| Non-significant change | p ≥ 0.05 | - | 52.76 | 52.82 | 50.61 | 52.42 |
| VAll | Precipitation | LST | Area of Surface Water | |
|---|---|---|---|---|
| VAll | 1 | 0.575 | −0.107 | 0.744 |
| Precipitation | 0.575 | 1 | −0.136 | 0.548 |
| LST | −0.107 | −0.136 | 0 | 0.030 |
| Area of surface water | 0.744 | 0.548 | 0.030 | 0 |
| 2000–2004 | 2005–2009 | 2010–2014 | 2015–2019 | |
|---|---|---|---|---|
| The contribution of climate change | 17.47% | 25.48% | 28.31% | 30.81% |
| The contribution of human activities | 24.14% | 30.45% | 25.69% | 26.80% |
| Land Cover Types | FVC (%) | |||||||||
|---|---|---|---|---|---|---|---|---|---|---|
| [0, 0.1] | (0.1, 0.2] | (0.2, 0.3] | (0.3, 0.4] | (0.4, 0.5] | (0.5, 0.6] | (0.6, 0.7] | (0.7, 0.8] | (0.8, 0.9] | (0.9, 1.0] | |
| Cropland | 0.01 | 3.32 | 19.03 | 31.73 | 46.81 | 56.59 | 68.38 | 79.62 | 83.80 | 83.47 |
| Grassland | 0.45 | 28.61 | 41.77 | 38.87 | 32.75 | 31.51 | 26.88 | 13.58 | 14.08 | 13.70 |
| Sparse vegetation | 8.05 | 23.67 | 23.30 | 11.32 | 6.59 | 2.25 | 1.19 | 1.89 | 0.00 | 0.47 |
| Wetlands | 0.17 | 0.81 | 10.60 | 15.87 | 10.77 | 4.18 | 1.19 | 1.13 | 1.76 | 0.00 |
| Impervious surfaces | 0.01 | 0.36 | 0.63 | 1.48 | 1.54 | 5.47 | 1.98 | 3.77 | 0.35 | 1.06 |
| Bare areas | 91.31 | 43.23 | 4.67 | 0.74 | 1.54 | 0.00 | 0.40 | 0.00 | 0.00 | 1.30 |
Disclaimer/Publisher’s Note: The statements, opinions and data contained in all publications are solely those of the individual author(s) and contributor(s) and not of MDPI and/or the editor(s). MDPI and/or the editor(s) disclaim responsibility for any injury to people or property resulting from any ideas, methods, instructions or products referred to in the content. |
© 2024 by the authors. Licensee MDPI, Basel, Switzerland. This article is an open access article distributed under the terms and conditions of the Creative Commons Attribution (CC BY) license (https://creativecommons.org/licenses/by/4.0/).
Share and Cite
He, X.; Zhang, L.; Lu, Y.; Chai, L. Spatiotemporal Variations of Vegetation and Its Response to Climate Change and Human Activities in Arid Areas—A Case Study of the Shule River Basin, Northwestern China. Forests 2024, 15, 1147. https://doi.org/10.3390/f15071147
He X, Zhang L, Lu Y, Chai L. Spatiotemporal Variations of Vegetation and Its Response to Climate Change and Human Activities in Arid Areas—A Case Study of the Shule River Basin, Northwestern China. Forests. 2024; 15(7):1147. https://doi.org/10.3390/f15071147
Chicago/Turabian StyleHe, Xiaorui, Luqing Zhang, Yuehan Lu, and Linghuan Chai. 2024. "Spatiotemporal Variations of Vegetation and Its Response to Climate Change and Human Activities in Arid Areas—A Case Study of the Shule River Basin, Northwestern China" Forests 15, no. 7: 1147. https://doi.org/10.3390/f15071147