Article

Effects of Stand Density on Tree Growth, Diversity of Understory Vegetation, and Soil Properties in a Pinus koraiensis Plantation

1
College of Forestry, Northeast Forestry University, Harbin 150040, China
2
Key Laboratory of Sustainable Forest Ecosystem Management-Ministry of Education, Northeast Forestry University, Harbin 150040, China
3
Department of Forestry and Forest Resources Management, Faculty of Natural Resources & Environment, University for Development Studies, Nyankpala Campus, Tamale P.O. Box TL 1882, Ghana
4
College of Life Science, Northeast Forestry University, Harbin 150040, China
5
State Forestry and Grassland Administration Engineering Technology Research Center of Korean Pine, Harbin 150040, China
*
Author to whom correspondence should be addressed.
Forests 2024, 15(7), 1149; https://doi.org/10.3390/f15071149
Submission received: 31 May 2024 / Revised: 24 June 2024 / Accepted: 30 June 2024 / Published: 2 July 2024
(This article belongs to the Special Issue Silviculture and Management Strategy in Coniferous Forests)

Abstract

:
The regulation of stand density has been studied in specific aspects of plantations with different age categories. A clearer understanding is still required of the extent to which stand density impacts multiple plantation attributes such as tree growth, understory vegetation diversity, and soil properties in Korean pine (Pinus koraeinsis Sieb. et Zucc) plantations. This study utilized a 43-year-old middle-aged Korean pine plantation in Qingping Forest Farm in northeast China to answer the research question posed. Three stand density levels, low stand density (LSD, 716 trees/ha), medium stand density (MSD, 850 trees/ha), and high stand density (HSD, 916 trees/ha) were studied for their effects on plantation attributes enumerated above. The results revealed a significant (p < 0.05) effect of stand density on mean stand volume (m3). Medium stand density had the highest mean stand volume of 26.16 (±0.27) m3 while the lowest stand volume was recorded for the low stand density at 14.90 (±1.72) m3. Also, significant differences in total nitrogen, total potassium, available nitrogen, available potassium, and percentage soil moisture content were observed among stand density levels. Additionally, stand density was found to have significant effects on species richness, Shannon–Wiener, and Simpson’s diversity indexes for the shrub and herb layers of the plantation. This study shows that a medium stand density is the most optimal for promoting tree growth and understory biodiversity, as well as enhancing the status of certain soil nutrients. Thus, medium density achieves a balance between growth, nutrient availability, and biodiversity in middle-aged Korean pine plantations after a short period of thinning. These findings provide valuable knowledge for forest management, emphasizing the significance of continuous, long-term, and site-specific research.

1. Introduction

According to Burkhart [1], stand density is a crucial aspect of forests, mainly employed to promote wood growth [2]. Studies have indicated that the management of forests, encompassing tree growth [3], soil nutrient cycling [4], and forest regeneration benefit from the control of stand densities [5]. Optimal forest stand structures are essential for fostering robust plant growth, optimizing soil nutrient utilization, augmenting site productivity, and guaranteeing the sustained advancement of cultivated forests [6]. Moderate stand density in conifers significantly influences tree growth and has a beneficial effect on the enlargement of tree diameter [7]. Reduced stand density has been shown to improve soil qualities, including N, P, K, and many other vital nutrients for plant growth [8]. A reduction in the density of tree stands frequently leads to a decrease in competition among trees for soil nutrients such as nitrogen (N) and phosphorus (P) [9].
The Korean pine (Pinus Koraeinsis Sieb. et Zucc), a prominent species in the temperate forests of northeast China, is economically valuable because it provides food, lumber, and habitat for wildlife. However, overharvesting has led to a reduction in its dominance in recent decades [10]. According to earlier research, stand density and tree growth are connected. Higher quality timber production was noted in stands with less density [11]. The regulation of stand density in forests is well understood, but further research is needed to understand its impact on understory vegetation and soil properties [12].
Additionally, research in various species has proposed density reduction as a way to enhance tree growth, as the diameter increment of Aleppo pine (Pinus halepensis Miller) was more noteworthy in a stand with a lower density [13]. However, the dynamics and functions of forest stands are significantly influenced by silvicultural techniques and management activities, which must be appropriately carried out to preserve the sustainable performance of forests [14]. Nonetheless, the primary objectives of wood production are to sustainably increase the managed stand’s size or enhance its quality. Managing stand density or starting planting densities is the primary strategy to do this [15]. Accurately measuring stand density is essential for forecasting forest development and productivity [1].
Soil nutrient levels and other physical and chemical indicators are frequently employed to evaluate the condition of the soil [16]. According to a common notion, suppressed trees are expanding within stands toward their lower survival threshold at the tree level [17]. When stand density (thinning) decreased, tree DBH increased [18]. Soil, primarily responsible for delivering water and nutrients to agricultural plants, also regulates water flow and quality and provides habitat for soil biota [19]. Meanwhile, little research has been carried out on the characteristics of the soil beneath various forest stands, which is crucial for sustaining ecosystems [20].
However, most Korean pine plantations face environmental problems due to inappropriate starting densities. While there are still a lot of unanswered questions regarding the best stand densities to maximize ecological benefits, these species must continue to develop sustainably. According to a report, understory biodiversity is crucial in maintaining forest ecosystems and forest variety [21]. The variety of understory vegetation displays how an organism dynamically adapts to its environment and represents the make-up, arrangement, and stage of development of community structures [22]. Research has confirmed that a higher species diversity contributes to the stability of forest ecosystems [23]. The Simpson, Shannon–Wiener, and Pielou indices are commonly employed to quantify vegetation diversity [24,25]. It was reported that, in a high-density stand, restricted tree growth is most likely the result of intense competition that slows down tree growth [26].
Moreover, the effects of stand density regulation on tree growth, soil qualities, and understory vegetation are a topic of ongoing research and have yet to be sufficiently clarified. Therefore, the present work is undertaken to evaluate the effect of stand density on the growth of Pinus koraiensis, soil properties, and understory flora diversity and to determine the optimal stand density that could be appropriate for these factors. We hypothesized that the medium stand density would have the maximum total volume and diameter of trees, nutrient contents, as well high biodiversity status since the medium stand will encourage favorable environmental factors and less competition.

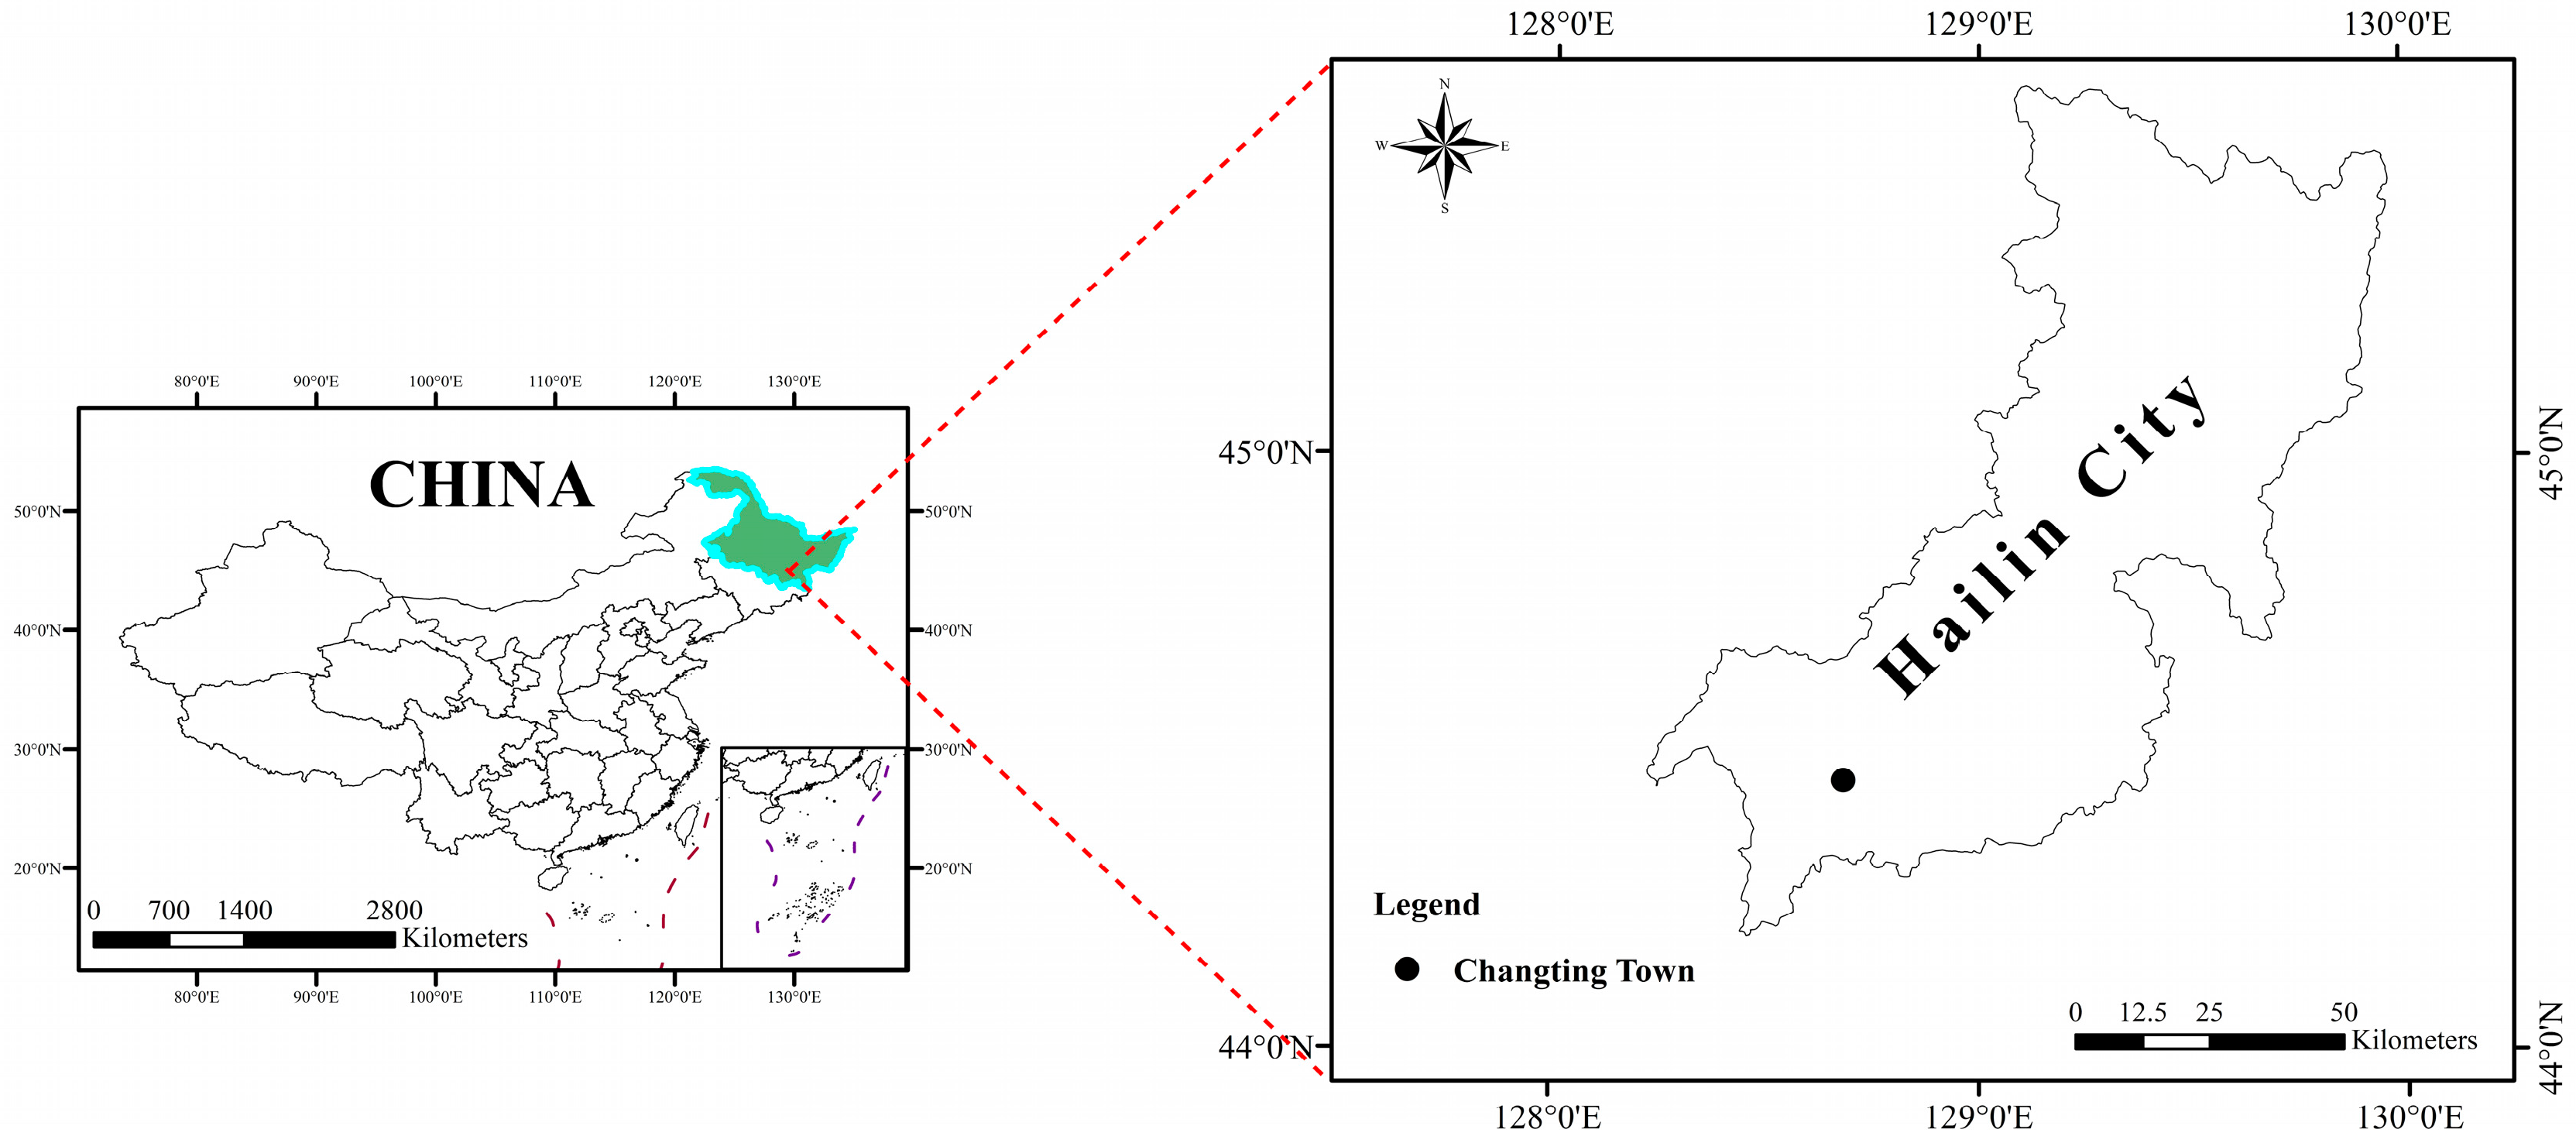
2. Materials and Methods

This research was carried out in Qingping Forest Farm, part of the Dahailin Forestry Bureau, Heilongjiang Province, northeast China. It is located southwest of Mudanjiang City. The location is 508 m above sea level and lies in Changting Town, Hailin County (44°03′–44°41′ N and 128°02′–129°01′ E) (Figure 1). The climate in this region is a sub-temperate monsoon. The lowest temperature in the area is −35 °C and the highest is 33 °C, which occur in January and July, respectively. The plantation was established in 1976 with an initial planting distance of 1.5 m × 2 m. The plantation was 43 years old at the time of the thinning operation carried out in 2019. The local forestry authorities decided to implement a thinning operation on the 43-year-old Korean pine (Pinus koraiensis) plantation due to the initial high density of trees planted during afforestation and following standard silvicultural practices and a comprehensive forest management plan. The purpose of this decision is to optimize the development, vitality, and overall condition of the trees by reducing competition among them. Thinning was carried out as a management practice to pave the way for desirable species. The study area covers a total of 8.6 hectares, within which the local authorities have designated six adjacent plots for research purposes. The most dominant shrub species was Lespedeza bicolor Turcz, which also had the highest species important value (IV) index. However, the species with the highest (IV) under the herb layer were Athyrium brevifrons Nakai ex Kitagawa (48.90), Athyrium brevifrons Nakai ex Kitagawa (32.27), and Festuca rubra L. (62.20) in low, medium, and high stand densities, respectively. Detailed information about the species’ important value is presented in Section 3.9.

2.1. Experimental Design

In this study, we used 6 permanent circular plots with each having a size of 0.06 ha following the research methods in [27]. A total of 3 stand density levels, low stand density (LSD 716 trees ha−1), medium stand density (MSD 850 trees ha−1), and high stand density (HSD 916 trees ha−1), were selected in the third week of September 2023 in a 43-year-old middle-aged (Pinus koraeinsis Sieb. et Zucc) plantation. The 43-year-old Korean pine plantations were selected as they represent the middle-aged plantation [28] for this species. This allows us to analyze the development and durability of the ecosystem at its peak. Our research primarily centers on the mid-life period of Korean pine plantations. This stage is crucial for understanding the transition from fast expansion to senescence. Furthermore, the specific management technique or silvicultural treatment that we aim to evaluate in this study is associated with the age of 43 years. Variation in stand density levels was created during the thinning operation in 2019. The plantation is homogeneous in environmental conditions such as (stand type, temperature, aspect, slope, elevation, and soil type). The six neighboring plots were carefully selected to minimize bias. Grouping of stand density types was carried out a posteriori based on the number of trees per plot (Table 1). Low stand density ranged from 700 to 716 trees/ha, stand density for medium class ranged from 833 to 850, and high stand density ranged from 883 to 916 trees/ha.

2.2. Vegetation Data Collection

All trees were measured at breast height at 1.3 m above ground, and their height was recorded. Tree volume was calculated using the formula reported in [29].
V = 0000589865D1.966609091H0.904763956
where V is tree volume (stem volume over bark), D is the diameter at breast height, and H is total tree height.
Understory vegetation was assessed in two layers: shrubs and herbs. Shrub species were recorded from five (5 m × 5 m) quadrats located at the four corners and one in the center of each plot, while herb species were recorded from five (1 m × 1 m) quadrats located at the four corners and one in the center of each plot. Species diversity indices were used as a measure of community species diversity of each plot, using species richness (S), Shannon–Wiener (H), Simpson (D), and Pielou’s equitability (Jsi) reported in [30,31]. Species diversity, species richness, and Simpson, Shannon–Wiener, and Pielou indices were determined using the following formulas:
Species   richness ,   S = N i
Shannon Wiener ,   ( H ) = i = 1 s P i × l n P i
Pielou index ,   ( E ) = H / I n s
Simpson s diversity index , ( D ) = 1 i = 1 s P i 2
where Ni = number of individuals for each species present in the sample area. D is the Simpson index, H’ is the Shannon–Wiener index, E is the Pielou index, lnS stands for the natural logarithm of species richness, S is the number of plant species in the standard area (the species richness index), and pi is the proportion of individuals belonging to the i-th species (ni/n).
The species’ important value was calculated using the formula mentioned in [31]. Species important value (IV) = (RD + RF + RC)/3.
Note: IV = species important value, RD = relative density, RF = relative frequency, and RC = relative cover

2.3. Soil Sample Collection

Soil samples were randomly collected using a corer, and a soil profile was dug at five points per plot in three soil depths (0–10 cm, 10–20 cm, and 20–30 cm) [27]. The number of soil samples collected per plot was 15 (5 random locations × 3 depths), with 90 soil samples collected in the study area. All soil from each layer per plot was kept in sealed plastic bags to form composite soil samples for analysis of pH, Soil Moisture content (SMC), Soil Organic matter (SOM), Bulk Density (BD), Total Nitrogen (TN), Available Nitrogen (AN), Total Potassium (TK), Available Potassium (AK), Total Phosphorus (TP), and Available Phosphorus (AP). The soil samples were air-dried at room temperature and then crushed and passed through sieves of 2 mm and 0.15 mm mesh size for subsequent analyses. Every measurement of both physical and chemical properties was carried out in the College of Forestry’s Silviculture laboratory at Northeast Forestry University in China (Table 2).

2.4. Statistical Analyses

Differences in tree growth parameters, understory biodiversity (Shannon–Wiener, species richness, species evenness, and Simpson’s diversity indexes for shrub and herb layers), and soil physical and chemical properties among the three stand densities were analyzed using one-way ANOVA and LSD (least significant difference) tests (significant at p < 0.05). Analyses were carried out in SPSS 27.0.1 [6,32].

3. Results

3.1. Effects of Stand Density on Tree Growth

The results revealed a significant effect of stand density level on total volume (m3/ha), and there were no differences in the impact of stand density on mean DBH and mean height among the three density levels (Table 1). The mean volume for the low stand density, medium stand density, and high stand density were (14.90 ± 1.72 m3), (26.16 ± 0.27 m3), and (25.92 ± 1.86 m3) per hectare, respectively. Total volume was highest in medium stand density and lowest in low stand density (Figure 2).

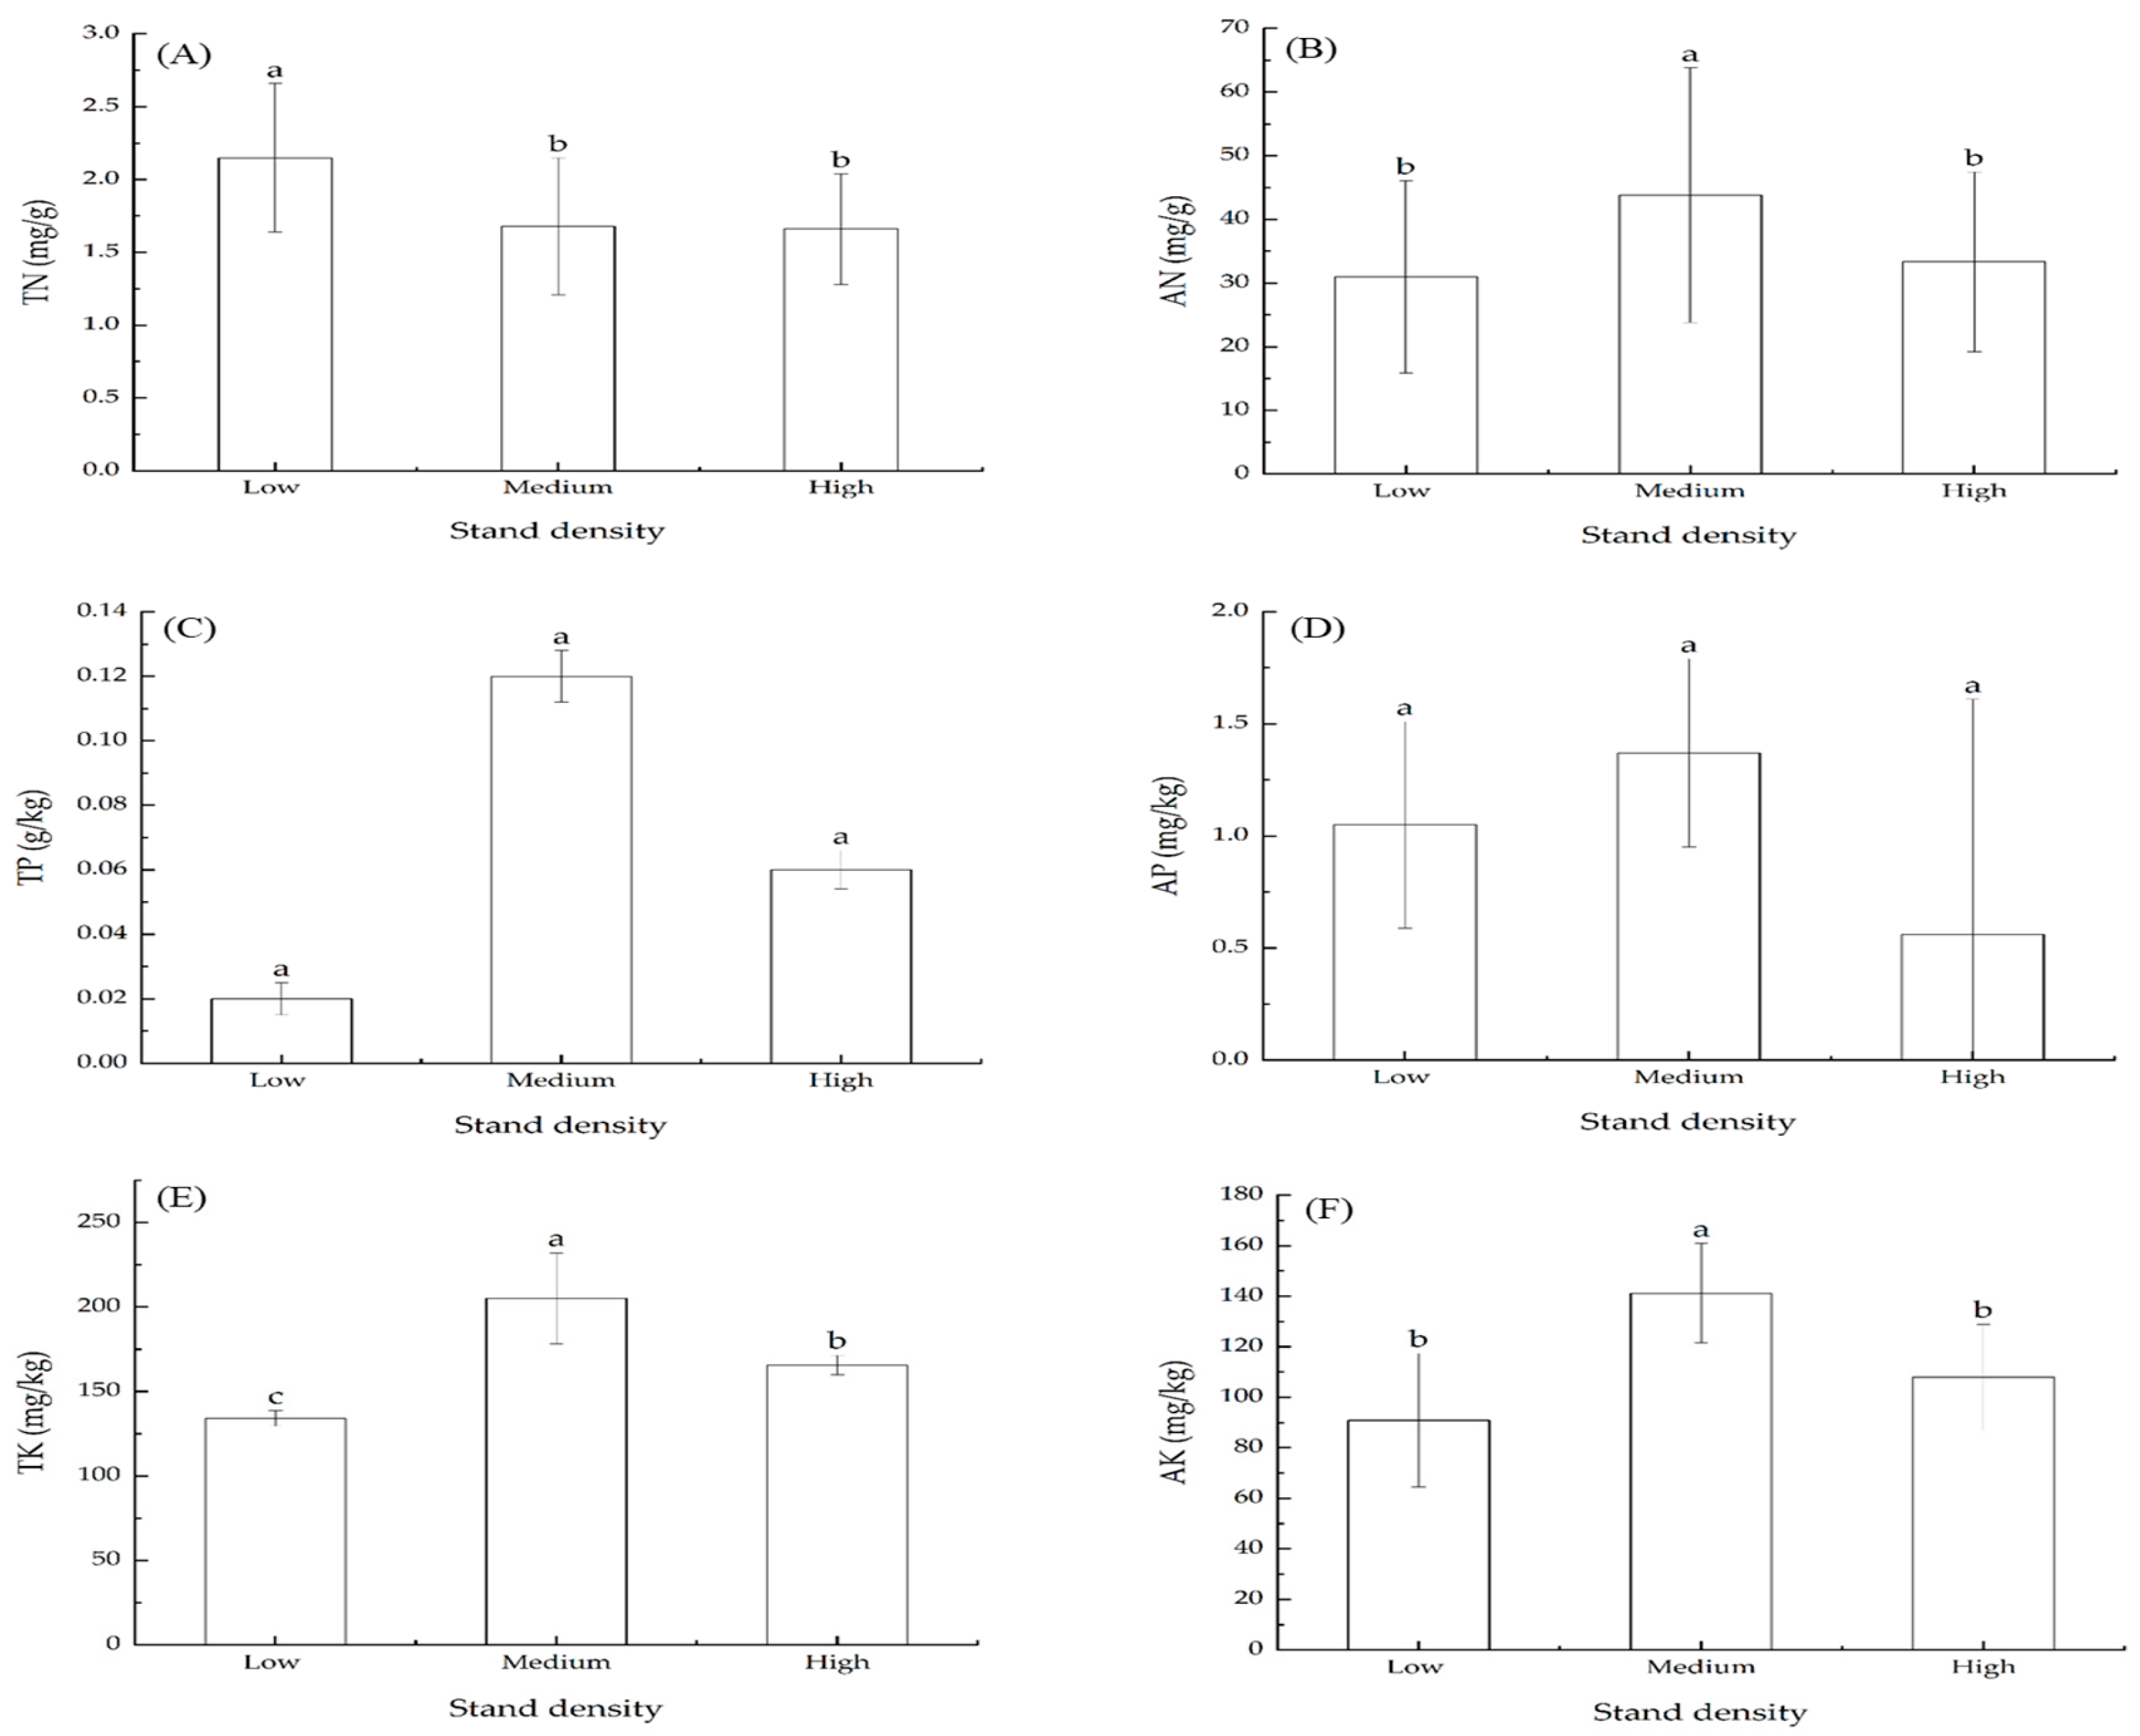
3.2. Effects of Stand Density on Total Nitrogen (TN) and Available Nitrogen (AN)

The results revealed a significant effect of stand density level on the total nitrogen (TN) content at p < 0.05. The mean TN values for each density type were as follows: low stand density (2.15 ± 0.51 mg g−1), medium stand density (1.68 ± 0.47 mg g−1), and high stand density (1.66 ± 0.38 mg g−1). The descriptive statistics indicated a decreasing trend in TN with increasing stand density. Additionally, low stand density differs significantly from medium stand density and high stand density; however, there was no significant difference observed between medium stand density and high stand density. The results indicate that the effect of density level on available N levels was statistically significant at 0–10cm soil layer, in the medium stand density. The mean available N values for each density type were as follows: low stand density (30.96 ± 15.12 mg g−1), medium stand density (43.80 ± 20.01 mg g−1), and high stand density (33.34 ± 14.12 mg g−1) (Figure 3). Both Total N and available N were high on the soil surface (0–10 cm) and decreased along soil depth as soil depth increased (Table 3).

3.3. Effects of Stand Density on Total Phosphorous (TP) and Available Phosphorous (AP)

The results indicated that the effect of density level on total phosphorus (TP) and available phosphorous (AP) levels was not statistically significant. The mean TP values for each density type were as follows: low stand density (0.02 ± 0.13 g/kg), medium stand density (0.12 ± 0.10 g/kg), and high stand density (0.06 ± 0.06 g/kg), respectively. The mean AP values for each density type were as follows: low stand density (1.05 ± 0.46 mg/kg), medium stand density (1.37 ± 0.42 mg/kg), and high stand density (0.56 ± 1.05 mg/kg), (Figure 2). However, the descriptive statistics showed that total P contents in soil depth were higher in the surface layer (0–10 cm) and were consistent as compared to available P contents (Table 3).

3.4. Effects of Stand Density on Total Potassium (TK) and Available Potassium (AK)

This study revealed a significant effect of stand density level on both TK and AK content at 0–10 cm soil depth in the medium stand density level (p < 0.05). The mean TK values for each density type are as follows: low stand density (134.17 ± 4.58 mg/kg), medium stand density (205.24 ± 26.82 mg/kg), and high stand density (165.69 ± 5.70 mg/kg). The mean AK values for each density type are as follows: low stand density (90.94 ± 26.40 mg/kg), medium stand density (141.23 ± 19.70 mg/kg), and high stand density (107.93 ± 20.90 mg/kg) (Figure 3). Meanwhile, both total and available K contents were highest in the medium stand density across all soil layers (Table 3).

3.5. Effect of Stand Density on Physical Soil Properties (pH, SMC, BD, and SOM)

The results revealed a significant difference in soil moisture content (SMC) percentage among stand density levels at the second soil layer at p < 0.05. A significant difference was observed in the low and high stand density levels, with soil moisture being highest in the low stand density at 10–20 cm soil depth. The soil moisture content at the 0–10 cm soil layer was higher in areas with low stand density; however, this difference was not statistically significant. Furthermore, no significant differences among stand densities were found in soil pH, bulk density (BD), and soil organic matter (SOM). Meanwhile, the descriptive statistics indicated SOM was highest in the low stand density and on the soil surface (0–10 cm) and decreased with increasing soil depth (Table 4).

3.6. Correlation Analysis of Selected Soil Chemical and Physical Properties

Correlations between tree growth parameters and soil properties were performed. A negative correlation existed between total volume with total N, total P, total K, available N, and available K. There was a positive correlation between total volume with available P. Average DBH had a positive correlation with total K and stand volume but had a negative correlation with total N, total P, available N, available P, and available K. The study observed no correlation between average height and total K and volume. In addition, no positive correlation was seen between average height and total N, total P, available N, available P, and available K (Table 5).

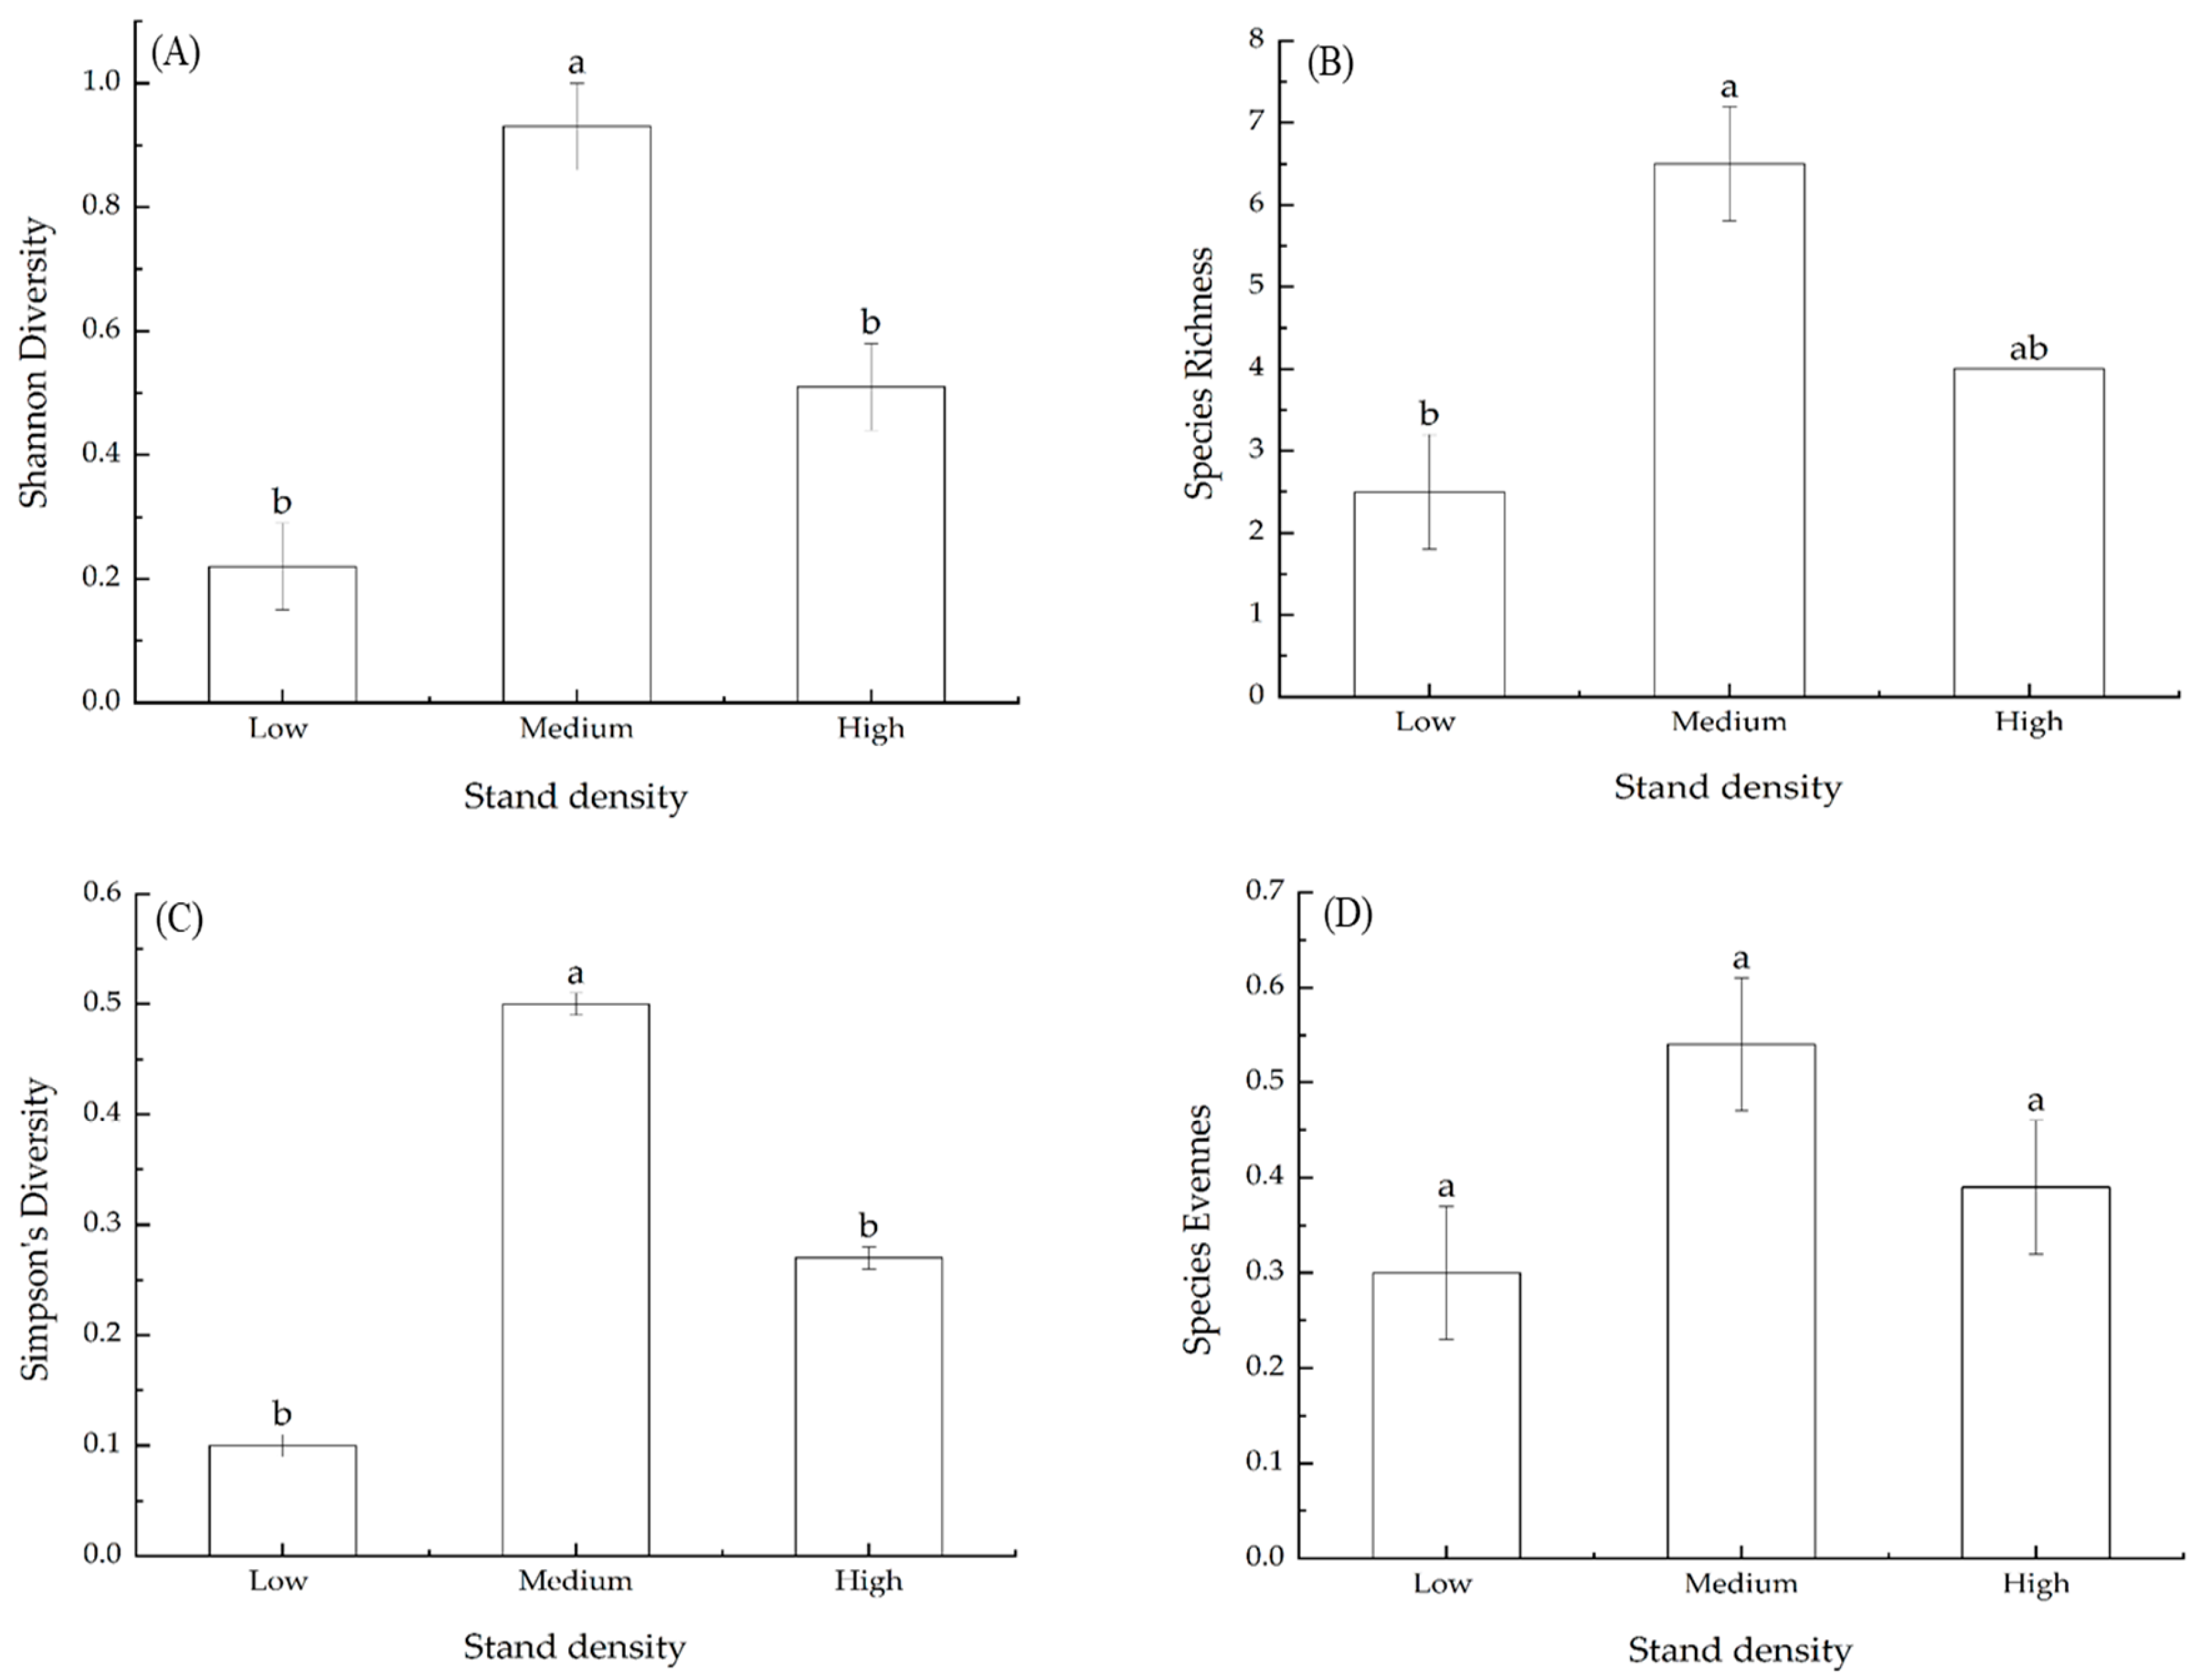
3.7. Effects of Stand Density on Species Diversity Indices of Shrubs

The results revealed a significant effect of stand density on Shannon–Wiener, species richness, and Simpson’s diversity indexes for the shrub layer, which were most significant in the medium stand density. There were no differences in the effect of stand density on Pielou’s equitability indexes for shrubs. Twelve species from five families and eight genera were found in the shrub layer, and the most dominant species (Lespedeza bicolor Turcz.) was observed in medium stand density, and low stand density recorded few species with shallow diversity. The mean Shannon index for low stand density, medium stand density, and high stand density were (0.22 ± 0.07), (0.93 ± 0.07), and (0.51 ± 0.07), respectively. The mean species richness for the low stand density, medium stand density, and high stand density were (2.50 ± 0.70), (6.50 ± 0.70), and (4.00 ± 0.00), respectively, for shrubs. The mean Simpson’s index values for the stand density categories were (0.10 ± 0.01) for low, (0.50 ± 0.01) for medium, and (0.27 ± 0.01) for high for shrubs (Figure 4).

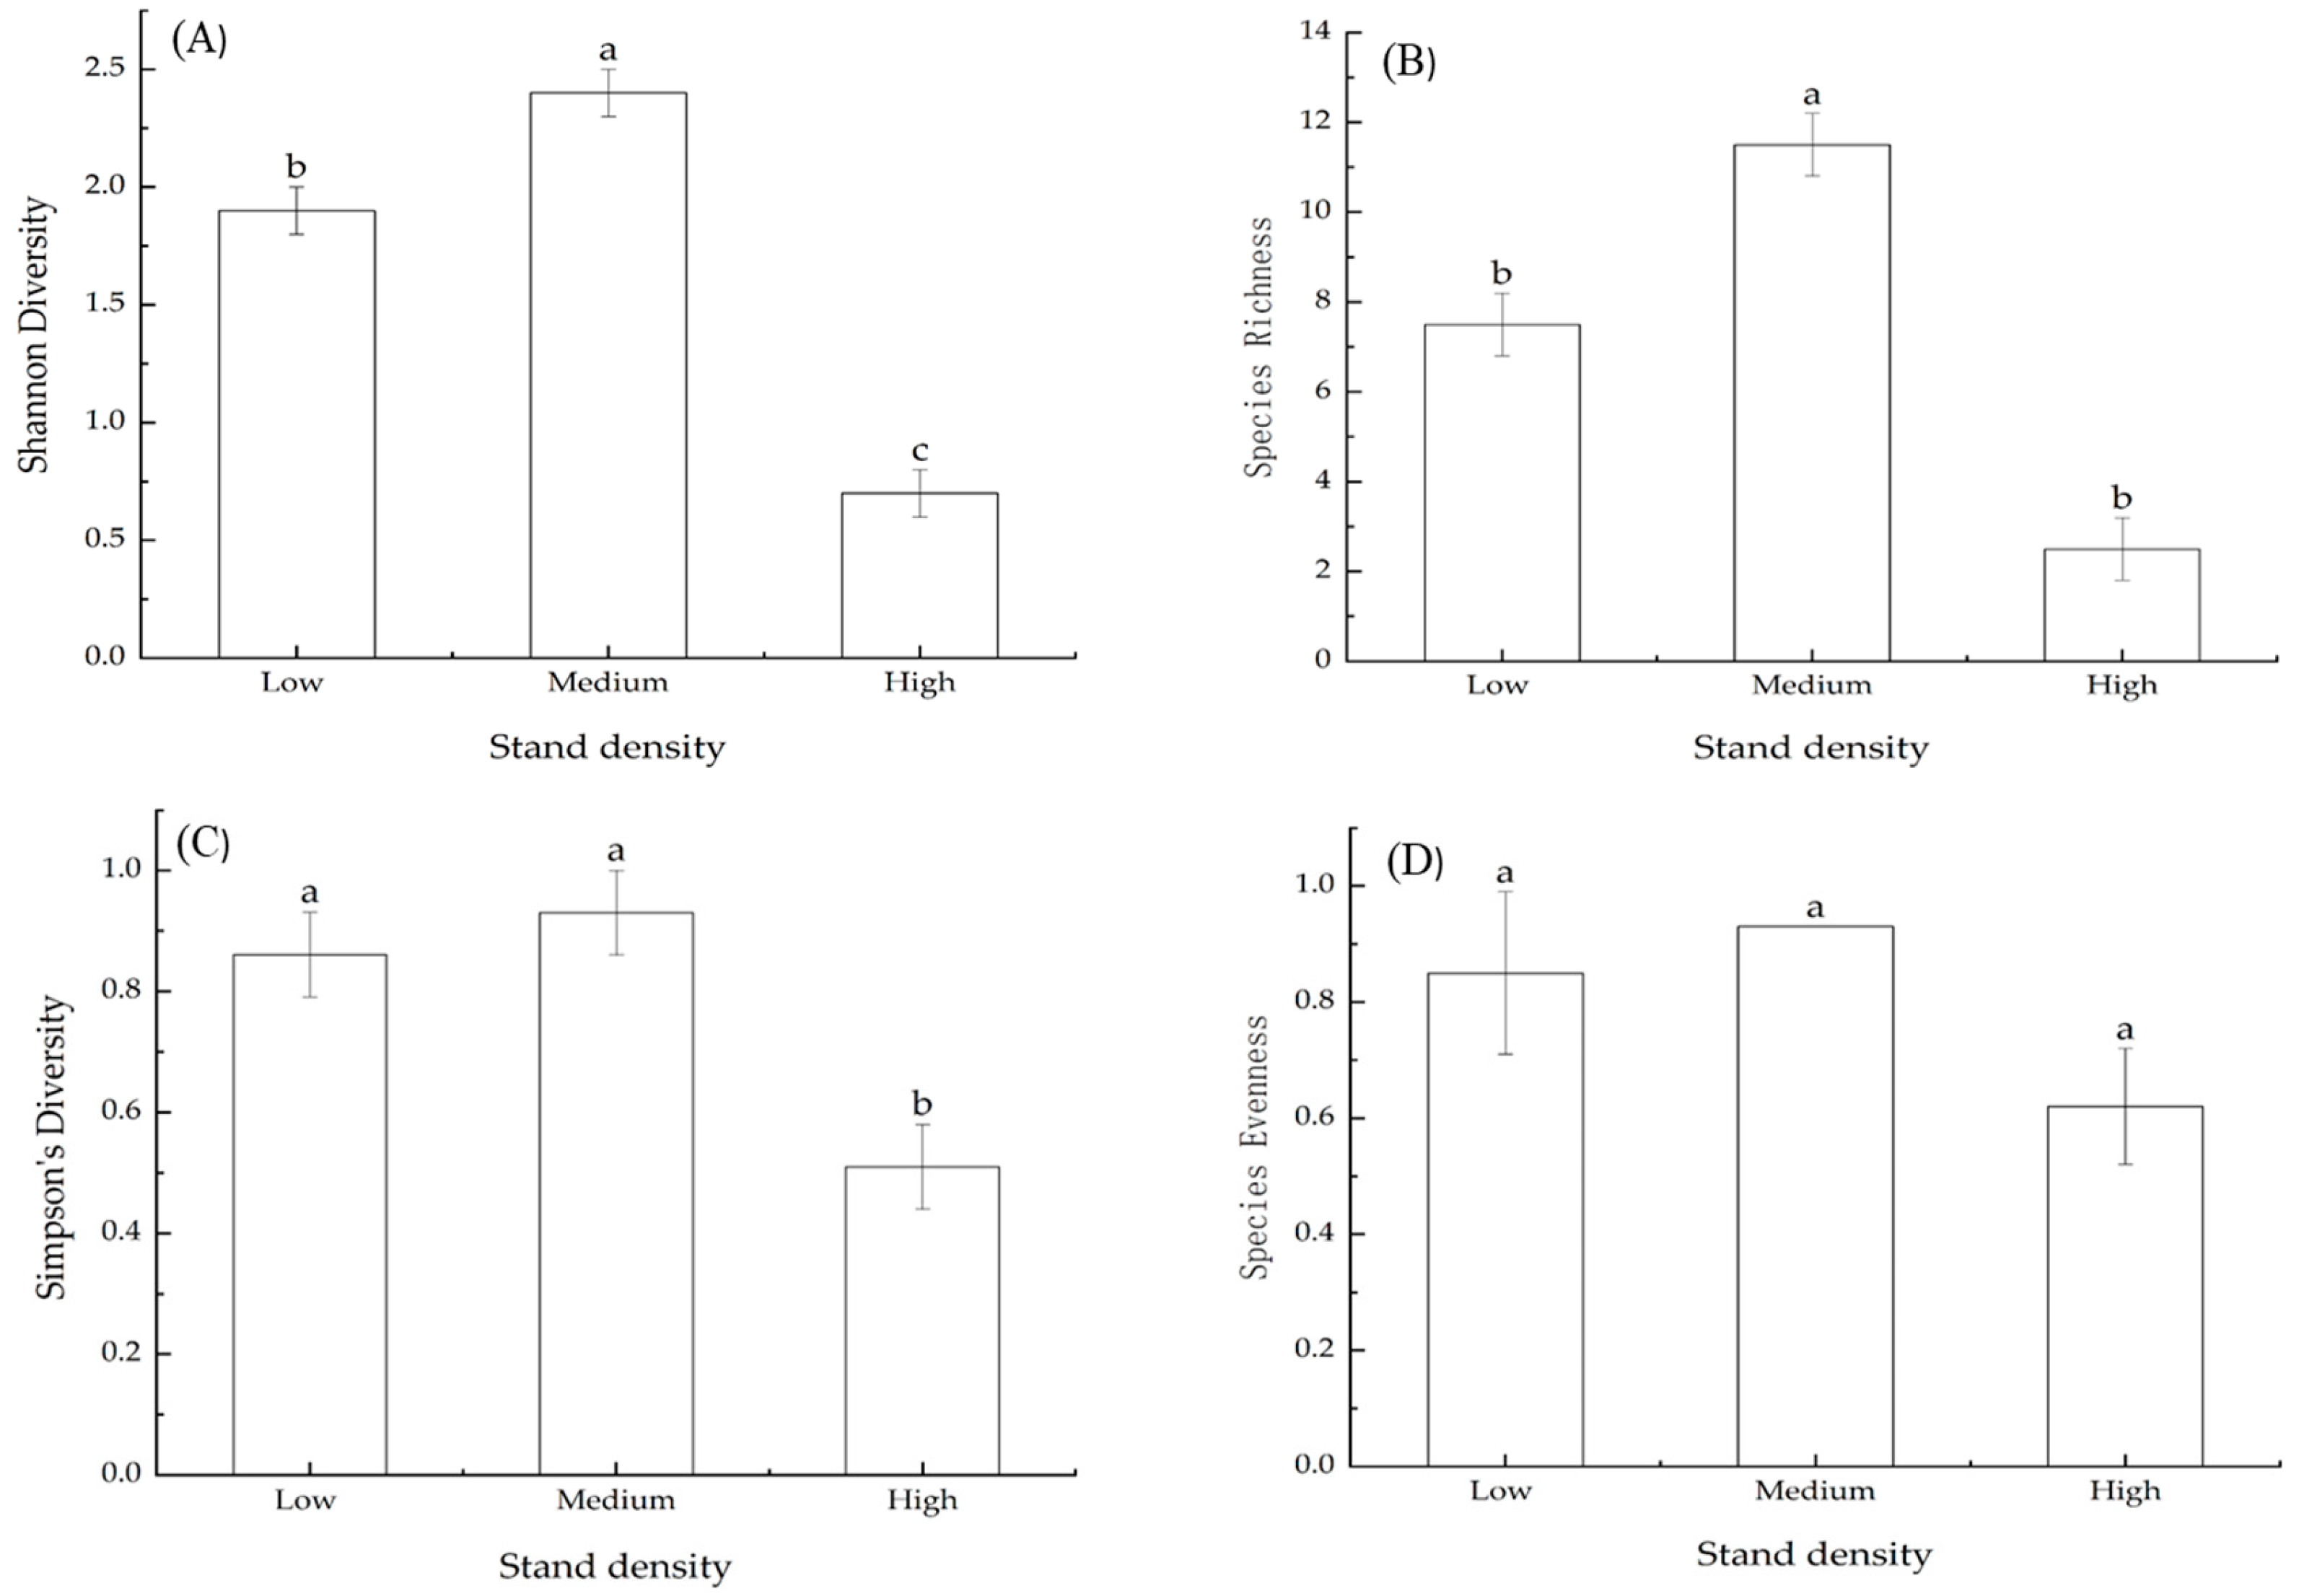
3.8. Effects of Stand Density on Species Diversity Indices of Herbs

The results revealed a significant effect of stand density on Shannon–Wiener, species richness, and Simpson’s diversity indexes for herb layers, which were most significant in the medium stand density. There were no differences in the effect of stand density on Pielou’s equitability indexes. Furthermore, 23 species from 9 families and 13 were found in the herbs layer, and the most dominant species (Festuca rubra L.) was observed in medium stand density. However, species diversity was lowest in the low stand density and highest in the medium stand density. The mean Shannon index values for each density type were as follows: low stand density (1.90 ± 0.10), medium stand density (2.40 ± 0.10), and high stand density (0.70 ± 0.10). The mean species Richness for low stand density, medium stand density, and high stand density were (7.50 ± 0.70), (11.50 ± 0.70), and (2.50 ± 0.70), respectively. Again, the mean Simpson’s index values for the stand density levels were (0.861 ± 0.07) for low stand density, (0.93 ± 0.07) for medium stand density, and (0.51 ± 0.07) for high stand density (Figure 5).

3.9. Species Important Value across Various Stand Density Types

Species importance values (IV) were analyzed for both shrub and herb layers, and are represented by relative density (RD), relative frequency (RF), relative coverage (RC), and species importance value (IV). The most dominant shrub species was Lespedeza bicolor Turcz. with the highest species important value index and this species was found to be dominant across all density types. The species with the highest (IV) under the herb layer were Athyrium brevifrons Nakai ex Kitagawa. (48.9), Athyrium brevifrons Nakai ex Kitagawa (32.27), and Festuca rubra L. (62.2) in low, medium, and high stand density, respectively (Table 6).

4. Discussion

4.1. Effect of Stand Density on Tree Growth

The present study corroborates previous research that demonstrated the impact of thinning on stem volume increments in conifer species by reducing stand density [33]. Again, the findings of Choi et al. indicated that Korean pine species increased in stem volume after a reduction in stand density over a period of time [26]. Our current study revealed a significant effect of stand density type on total volume, the results are consistent with the previous studies on impact stand density. Meanwhile, there were no differences in the effect of stand density on average DBH and average height. Our result did not support the assumption that density reduction improves tree mean diameter [13]. This observation can be related to the low planting distance observed in these stands at the time of this research, as selective thinning was only practiced to remove the worst species and pave the way for desirable species to grow. And it has been suggested by the authors of [11] that tree diameter and stem growth of individual Korean pine trees did well in heavily thinned plots after thinning for an extended time.
Also, other research has mentioned that tree growth response due to stand density reduction might not be conspicuous during the first few years after thinning [29]. The present investigation demonstrated that stand density had no substantial impact on certain crucial plant nutrients, as seen in this study. This finding could potentially be a contributing element. It was reported that pines could only markedly increase diameter growth 2 or 4 years after thinning [13]. This view is not consistent with our results. Again, the literature [29] indicates that to improve the long-term timber output in Korean pine forests, thinning should come after managing the initial planting density. In the meanwhile, other research has the view that numerous additional factors, such as the control of understory vegetation as recommended, influence the growth of other forest tree species [34] and crown and stem characteristics, among others [35]. In light of the above, developing a sensible forest management strategy requires extensive, long-term research on various influencing factors.
Once again, the volume of trees was greatest in stands with a medium density and lowest in stands with a low density. The figures showed an initial upward trend in volume as stand density increased from low to medium, followed by a downward trend as stand density increased from medium to high. This finding is consistent with previous studies showing that planting density positively impacts volume increment in conifer species [10,33]. Studies have revealed a relationship between stand density and tree growth and increased timber production was recorded in lower-density stands [11]. This view is contrary to our findings with the appropriate density being medium density level. The differences could be associated with climate and environmental factors, which were favorable for medium stand density to be optimal for high-volume production in our study.

4.2. Effect of Stand Density on Soil Chemical Properties

Our study supports the findings in [36], which reports that stand density affected soil total N. In the present study, stand density significantly affected total N content at low stand density, which differs significantly between medium and high stand density. The highest amount of total N was found in low stand density, which could be attributed to the low competition for nitrogen nutrients compared with other density levels where competition for such nutrients could be high and may not meet the demands of the high number of trees and biodiversity. Nevertheless, the obtained results contradicted the study’s hypothesis, which anticipated that the medium stand density would have the highest total nitrogen levels.
The research identified total P as a necessary soil property [37] due to its pivotal role in the nutrient cycling of plantation systems and conifer plantations [38]. However, the present study on stand density had no significant effect on total P; our result is not in line with previous research on soil potassium. It was suggested that decreased stand density increases soil K [8]. Furthermore, our study observed a significant difference in total K contents between different stand densities. Total K contents were honored to be highest in the medium stand density, which agrees with the findings in [6]: with an increase in stand density, the total K in the soil showed an upward trend, but increased slowly. The current study supports previous research that stand density has an impact on soil potassium. The soil attributes in this study showed significant variation among different forest stands and soil depths. Variations may be due to the level of disturbance, species composition, and the addition of organic matter through litter fall and biomass, as well as parental soil materials in the study area according to the authors of [39].
Research has shown that in young and middle-aged forests, the levels of nitrate nitrogen and other soil qualities were found to be moderate in stands with a medium density of plants. However, in mature forests, these variables were found to be highest in plantations with a low density of plants [40]. Our investigation revealed that the amount of accessible nitrogen (N) increased in the medium stand density level when compared to other stand density levels. This indicates that the new study aligns with the previous findings. No significant differences between stand densities were found in AP contents and no significant difference was observed in soil layers. Our results did not support previous studies that stand density impacts AP [36]. Meanwhile, significant difference in available K contents between stand densities was observed and were highest in medium-density stand and lowest in low-stand density. Analysis of soil depth observed significant differences in available K contents at various soil depths. It was highest at the 0–10 cm soil layer and was consistent as the soil depth increased. The low amount in higher soil depths can be attributed to the fact that, in soil, potassium mainly participates in plant growth and metabolism in the form of ions; potassium ions are easily lost, which may result in potassium loss from the soil [30]. The present study on potassium among stand density levels was observed in the medium stand density, which is consistent with this research’s hypothesis; hence, an appropriate stand density could promote essential plant nutrients for growth.

4.3. Effect of Stand Density on Physical Soil Properties (pH, SMC, BD, and SOM)

Because of lower litter input and quicker rates of decomposition, thinning as a method for lowering tree density is expected to produce less soil organic matter and fertility [41]. In this study, no significant differences between stand densities were found in soil organic matter (SOM), and this can be associated with forest stand structure and variations in the kind of vegetation that can impact soil biological factors, litter inputs, carbon inputs and losses, and microclimatic conditions [42]. Also, some are of the view that reduced litter input and higher decomposition rates due to altered forest floor microclimate are two reasons why thinning, a technique to reduce tree density, is predicted to lower soil organic matter and soil fertility [41].
Reducing density in Pinus woods may improve soil moisture availability [43]. Additionally, a study suggested that in Korean pine plantations, soil moisture and light availability will likely last beyond four years after thinning [44]. Our study revealed a significant difference in soil moisture content (SMC) percentage among different stand densities; a significant difference was noted in the low and high stand density levels, with soil moisture percentage being highest in the low stand density at 10–20 cm soil depth. This present study is consistent with prior research on (SMC). Plant nutrient availability is influenced by soil pH, which is a crucial determinant of soil quality [45]. The significance of pH as a soil quality indicator for evaluating various land use and forest conservation strategies has been highlighted in earlier research [46]. It was observed that pH was highest on the soil surface (0–10 cm) in the medium stand density and decreased with increasing soil depth. However, pH was not significant at the among stand density level. Our results supported those of the authors of [47], who found that stand density had no significant effect on soil pH. Again, our findings did not support those in [48], which suggested that stand density has a significant effect on soil bulk density (BD). It is widely recognized that the characteristics of soil are affected by its depth, with soil nutrients decreasing as soil depth increases [49]. Shallow soils have higher levels of nutrients, more active microbes, and a quicker rate of organic matter turnover [50,51].

4.4. Effect of Stand Density on Understory Biodiversity

Forest understory herb diversity was most likely encouraged by thinning according to [52]. It is reported that the diversity of species is a sign of the stability and complexity of a community [53]. The literature has documented that reducing tree density can increase the diversity of plants in planted forests, which will help local sustainable forestry development and the shift to natural forests [54]. In line with previous findings, our investigations revealed a significant effect of stand density on Shannon–Wiener, species richness, and Simpson’s diversity indexes for shrub and herb layers, which were most remarkable in the medium stand density. Furthermore, a study reported that the species richness and Shannon Wiener index of thinned plots were significantly higher [55]. Our findings are therefore consistent with previous research on species diversity index. The current findings did not support [31], in which it was reported that stand density had no effect on species diversity in the shrub layer; however, our research on species evenness agrees with findings on the effect of stand density on the Pielou index. The current research saw no differences in the effect of stand density on the species evenness (Pielou’s equitability) indexes for both shrub and herb layers. It was mentioned that the species evenness showed no discernible variations among stand density [54].
Furthermore, findings have confirmed that the Shannon–Wiener index, species richness, and above-ground biomass of herbaceous communities were all considerably elevated at a medium stand density [40]. Many other findings have been consistent with the current investigations on species diversity. Additionally, it was proposed that the presence of understory vegetation was most prominent in areas with a moderate stand density [56]. This can be associated with the fact that light probably is more critical for biodiversity survival than other abiotic variables like water, which determine the makeup of understory species [57]. In addition, research has revealed that stand density was the main factor controlling understory vegetation under similar environmental conditions [58]. Our current study revealed the optimum density as the medium stand density and has agreed with some previous research and this has been consistent with our study’s hypothesis. However, factors such as light conditions, canopy structures of forests, and the density of tree species impact the forest, both above and below ground [59,60].
Consequently, there are sufficient reasons to believe that stand density is a critical factor that affects understory vegetation diversity. Ultimately, an appropriate forest density can improve the species diversity of a community, and, therefore, optimizing forest structure is conducive to the succession of natural forest communities [61].

4.5. Limitations of the Study

We would like to acknowledge that the limited number of plots established by local authorities in the area may influence the outcome of the study. However, we believe that our results are representative of the local conditions and management practices. We are of the opinion that these findings continue to offer a valuable understanding of the local situation and can serve as a fundamental reference point for future research.

5. Conclusions

This study examined the impact of stand density on the growth of trees, soil characteristics, and the diversity of understory species in a middle-aged Pinus koraiensis plantation following a brief period of selective thinning. The results indicated that a stand density of 833–850 trees per hectare is the most favorable for attaining a harmonious combination of optimizing tree development and improving the health of the soil and understory vegetation in the study area. The findings further revealed that the density of Korean pine stands had a notable influence on the overall volume, particularly in stands with medium density. Additionally, stand density had a substantial impact on TN, AN, TK, AK, and SMC. However, TP, AP, pH, SOM, and BD were not shown to be influenced by stand density. The majority of the soil parameters examined were influenced by the depth of the soil and exhibited a declining pattern along the soil profile. Furthermore, our research demonstrated that the density of stands has a significant influence on biodiversity, with the greatest impact detected in stands of medium density. Therefore, the impact of medium stand density may contribute to preserving and improving biodiversity, soil qualities, and sustainable tree growth in middle-aged Korean pine plantations. These findings provide valuable knowledge for forest management, emphasizing the significance of continuous, long-term, and site-specific research.

Author Contributions

Conceptualization, P.Z.; methodology, P.Z., A.-Q.I. and Y.H.; formal analysis, A.-Q.I., A.G. and P.Z.; investigation A.-Q.I., Y.H., A.G., X.Y. and P.Z.; resources, P.Z.; data curation, A.-Q.I., Y.H., X.Y. and N.S.; writing—original draft preparation, A.-Q.I. and P.Z.; writing—review and editing, A.-Q.I., Y.H., H.I., A.G., M.M.A. and P.Z.; supervision, P.Z. project administration, P.Z.; funding acquisition, P.Z. All authors have read and agreed to the published version of the manuscript.

Funding

This work was funded by the National Key Research and Development Program of China (grant No. 2022YFD2201002), the Fundamental Research Funds for the Central Universities (grant No. 2572023CT02), and the Heilongjiang Touyan Innovation Team Program (Technology Development Team for High-efficient Silviculture of Forest Resources).

Data Availability Statement

Data will be made available upon request.

Acknowledgments

The authors are grateful to the reviewers Hamza Issifu and Ambachew Getnet, whose substantiated comments helped to polish the manuscript. We thank Yuanqin Hao and Xiubo Yang for their assistance with the experiments. Thanks to Peng Zhang for acquiring funding and support in all aspects. The usual disclaimer applies, and all mistakes remain the authors’ responsibility.

Conflicts of Interest

The authors declare no conflicts of interests.

References

  1. Burkhart, H.E. Comparison of maximum size–density relationships based on alternate stand attributes for predicting tree numbers and stand growth. For. Ecol. Manag. 2013, 289, 404–408. [Google Scholar] [CrossRef]
  2. Liechty, H.O.; Mroz, G.D.; Reed, D.D. The growth and yield responses of a high site quality red pine plantation to seven thinning treatments and two thinning intervals. Can. J. For. Res. 1986, 16, 513–520. [Google Scholar] [CrossRef]
  3. Baker, F. Stand Density and Growth. 1952. Available online: https://www.cabidigitallibrary.org/doi/full/10.5555/19536602531 (accessed on 31 May 2024).
  4. Qiu, X.; Peng, D.; Wang, H.; Wang, Z.; Cheng, S. Minimum data set for evaluation of stand density effects on soil quality in Larix principis-rupprechtii plantations in North China. Ecol. Indic. 2019, 103, 236–247. [Google Scholar] [CrossRef]
  5. Chen, Y.; Cao, Y. Response of tree regeneration and understory plant species diversity to stand density in mature Pinus tabulaeformis plantations in the hilly area of the Loess Plateau, China. Ecol. Eng. 2014, 73, 238–245. [Google Scholar] [CrossRef]
  6. Lei, J.; Du, H.; Duan, A.; Zhang, J. Effect of stand density and soil layer on soil nutrients of a 37-year-old Cunninghamia lanceolata plantation in Naxi, Sichuan Province, China. Sustainability 2019, 11, 5410. [Google Scholar] [CrossRef]
  7. Moreno-Fernández, D.; Cañellas, I.; Calama, R.; Gordo, J.; Sánchez-González, M. Thinning increases cone production of stone pine (Pinus pinea L.) stands in the Northern Plateau (Spain). Ann. For. Sci. 2013, 70, 761–768. [Google Scholar] [CrossRef]
  8. Zhang, X.; Guan, D.; Li, W.; Sun, D.; Jin, C.; Yuan, F.; Wang, A.; Wu, J. The effects of forest thinning on soil carbon stocks and dynamics: A meta-analysis. For. Ecol. Manag. 2018, 429, 36–43. [Google Scholar] [CrossRef]
  9. Fu, X.; Wang, J.; Di, Y.; Wang, H. Differences in fine-root biomass of trees and understory vegetation among stand types in subtropical forests. PLoS ONE 2015, 10, e0128894. [Google Scholar] [CrossRef]
  10. Liu, K.; He, H.; Xu, W.; Du, H.; Zong, S.; Huang, C.; Wu, M.; Tan, X.; Cong, Y. Responses of korean pine to proactive managements under climate change. Forests 2020, 11, 263. [Google Scholar] [CrossRef]
  11. Choi, J.; Lee, B.; Lee, D.; Choi, I. Growth monitoring of Korean white pine (Pinus koraiensis) plantation by thinning intensity. J. Korean Soc. For. Sci. 2014, 103, 422–430. [Google Scholar] [CrossRef]
  12. Zhang, Y.; Liu, T.; Guo, J.; Tan, Z.; Dong, W.; Wang, H. Changes in the understory diversity of secondary Pinus tabulaeformis forests are the result of stand density and soil properties. Glob. Ecol. Conserv. 2021, 28, e01628. [Google Scholar] [CrossRef]
  13. Ruano, I.; Rodríguez-García, E.; Bravo, F. Effects of pre-commercial thinning on growth and reproduction in post-fire regeneration of Pinus halepensis Mill. Ann. For. Sci. 2013, 70, 357–366. [Google Scholar] [CrossRef]
  14. Ali, A.; Dai, D.; Akhtar, K.; Teng, M.; Yan, Z.; Urbina-Cardona, N.; Mullerova, J.; Zhou, Z. Response of understory vegetation, tree regeneration, and soil quality to manipulated stand density in a Pinus massoniana plantation. Glob. Ecol. Conserv. 2019, 20, e00775. [Google Scholar] [CrossRef]
  15. Tahvonen, O.; Pihlainen, S.; Niinimäki, S. On the economics of optimal timber production in boreal Scots pine stands. Can. J. For. Res. 2013, 43, 719–730. [Google Scholar] [CrossRef]
  16. Schoenholtz, S.H.; Van Miegroet, H.; Burger, J. A review of chemical and physical properties as indicators of forest soil quality: Challenges and opportunities. For. Ecol. Manag. 2000, 138, 335–356. [Google Scholar] [CrossRef]
  17. Schmitt, A.; Trouvé, R.; Seynave, I.; Lebourgeois, F. Decreasing stand density favors resistance, resilience, and recovery of Quercus petraea trees to a severe drought, particularly on dry sites. Ann. For. Sci. 2020, 77, 1–21. [Google Scholar]
  18. Blevins, D.P.; Prescott, C.E.; Allen, H.L.; Newsome, T.A. The effects of nutrition and density on growth, foliage biomass, and growth efficiency of high-density fire-origin lodgepole pine in central British Columbia. Can. J. For. Res. 2005, 35, 2851–2859. [Google Scholar] [CrossRef]
  19. Lal, R.; Shukla, M.K. Principles of Soil Physics; CRC Press: Boca Raton, FL, USA, 2004. [Google Scholar]
  20. Von Lützow, M.; Leifeld, J.; Kainz, M.; Kögel-Knabner, I.; Munch, J. Indications for soil organic matter quality in soils under different management. Geoderma 2002, 105, 243–258. [Google Scholar] [CrossRef]
  21. Gamfeldt, L.; Snäll, T.; Bagchi, R.; Jonsson, M.; Gustafsson, L.; Kjellander, P.; Ruiz-Jaen, M.C.; Fröberg, M.; Stendahl, J.; Philipson, C.D. Higher levels of multiple ecosystem services are found in forests with more tree species. Nat. Commun. 2013, 4, 1340. [Google Scholar] [CrossRef]
  22. Ares, A.; Neill, A.R.; Puettmann, K.J. Understory abundance, species diversity and functional attribute response to thinning in coniferous stands. For. Ecol. Manag. 2010, 260, 1104–1113. [Google Scholar] [CrossRef]
  23. Rota, E.; Caruso, T.; Bargagli, R. Community structure, diversity and spatial organization of enchytraeids in Mediterranean urban holm oak stands. Eur. J. Soil Biol. 2014, 62, 83–91. [Google Scholar] [CrossRef]
  24. Simpson, E.H. Measurement of diversity. Nature 1949, 163, 688. [Google Scholar] [CrossRef]
  25. Pielou, E.C. The measurement of diversity in different types of biological collections. J. Theor. Biol. 1966, 13, 131–144. [Google Scholar] [CrossRef]
  26. Woodruff, D.R.; Bond, B.J.; Ritchie, G.A.; Scott, W. Effects of stand density on the growth of young Douglas-fir trees. Can. J. For. Res. 2002, 32, 420–427. [Google Scholar] [CrossRef]
  27. Noh, N.J.; Son, Y.; Lee, S.K.; Yoon, T.K.; Seo, K.W.; Kim, C.; Lee, W.-K.; Bae, S.W.; Hwang, J. Influence of stand density on soil CO2 efflux for a Pinus densiflora forest in Korea. J. Plant Res. 2010, 123, 411–419. [Google Scholar] [CrossRef]
  28. Xin, S.; Wang, J.; Mahardika, S.B.; Jiang, L. Sensitivity of Stand-Level Biomass to Climate for Three Conifer Plantations in Northeast China. Forests 2022, 13, 2022. [Google Scholar] [CrossRef]
  29. Nguyen, T.T.; Tai, D.T.; Zhang, P.; Razaq, M.; Shen, H.-L. Effect of thinning intensity on tree growth and temporal variation of seed and cone production in a Pinus koraiensis plantation. J. For. Res. 2019, 30, 835–845. [Google Scholar] [CrossRef]
  30. Zhang, Y.; Yin, G.; Yang, J.; Li, S.; Li, R.; Zou, W. Effects of planting densities on production and dynamics of litter of Mytilaria laosensis plantation. Bull. Bot. Res. 2017, 37, 768–777. [Google Scholar]
  31. Chen, B.; Li, Y.; Fan, S.; Peng, C.; Huang, B.; Liu, G. Soil properties and understory species diversity at different stand densities in a tropical rainforest on Hainan Island, China. Austrian J. For. Sci. 2020, 137, 225–246. [Google Scholar]
  32. Wang, C.; Yang, Q.; Chen, J.; Zhang, C.; Liu, K. Variations in Soil Organic Carbon Fractions and Microbial Community in Rice Fields under an Integrated Cropping System. Agronomy 2023, 14, 81. [Google Scholar] [CrossRef]
  33. Navarro, F.B.; Jimenez, M.N.; Canadas, E.M.; Gallego, E.; Terron, L.; Ripoll, M.A. Effects of different intensities of overstory thinning on tree growth and understory plant-species productivity in a semi-arid Pinus halepensis Mill. afforestation. For. Syst. 2010, 19, 410–417. [Google Scholar] [CrossRef]
  34. Zhou, X.; Zhu, H.; Wen, Y.; Goodale, U.M.; Li, X.; You, Y.; Ye, D.; Liang, H. Effects of understory management on trade-offs and synergies between biomass carbon stock, plant diversity and timber production in eucalyptus plantations. For. Ecol. Manag. 2018, 410, 164–173. [Google Scholar] [CrossRef]
  35. Krajnc, L.; Farrelly, N.; Harte, A.M. The influence of crown and stem characteristics on timber quality in softwoods. For. Ecol. Manag. 2019, 435, 8–17. [Google Scholar] [CrossRef]
  36. Farooq, T.; Ma, X.; Rashid, M.; Wu, W.; Xu, J.; Tarin, M.; He, Z.; Wu, P. Impact of stand density on soil quality in Chinese fir (Cunninghamia lanceolata) monoculture. Appl. Ecol. Environ. Res. 2019, 17, 553–3566. [Google Scholar] [CrossRef]
  37. Watt, M.S.; Davis, M.R.; Clinton, P.W.; Coker, G.; Ross, C.; Dando, J.; Parfitt, R.L.; Simcock, R. Identification of key soil indicators influencing plantation productivity and sustainability across a national trial series in New Zealand. For. Ecol. Manag. 2008, 256, 180–190. [Google Scholar] [CrossRef]
  38. Ross, C.W.; Watt, M.S.; Parfitt, R.L.; Simcock, R.; Dando, J.; Coker, G.; Clinton, P.W.; Davis, M.R. Soil quality relationships with tree growth in exotic forests in New Zealand. For. Ecol. Manag. 2009, 258, 2326–2334. [Google Scholar] [CrossRef]
  39. Jhariya, M.; Singh, L. Productivity and carbon accumulation in tropical dry deciduous forest ecosystem. In Tropical Dry Forests: Emerging Features and Ecological Perspectives; Chaturvedi, R.K., Singh, R., Bhadouria, R., Eds.; Nova Science: Hauppauge, NY, USA, 2021; pp. 269–287. [Google Scholar]
  40. Zhao, M.; Liu, S.; Sun, Y.; Chen, Y. Does stand density affect understory vegetation and soil properties of differently aged Robinia pseudoacacia plantations? For. Ecol. Manag. 2023, 548, 121444. [Google Scholar] [CrossRef]
  41. Vesterdal, L.; Dalsgaard, M.; Felby, C.; Raulund-Rasmussen, K.; Jørgensen, B.B. Effects of thinning and soil properties on accumulation of carbon, nitrogen and phosphorus in the forest floor of Norway spruce stands. For. Ecol. Manag. 1995, 77, 1–10. [Google Scholar] [CrossRef]
  42. Zarafshar, M.; Rousta, M.J.; Matinizadeh, M.; Talebi, K.S.; Bordbar, S.K.; Alizadeh, T.; Nouri, E.; Bader, M.K.-F. Scattered wild pistachio trees profoundly modify soil quality in semi-arid woodlands. Catena 2023, 224, 106983. [Google Scholar] [CrossRef]
  43. Powers, M.D.; Pregitzer, K.S.; Palik, B.J.; Webster, C.R. Wood δ13C, δ18O and radial growth responses of residual red pine to variable retention harvesting. Tree Physiol. 2010, 30, 326–334. [Google Scholar] [CrossRef]
  44. Bae, S.-W.; Hwang, J.-H.; Lee, S.-T.; Kim, H.-S.; Jeong, J.-M. Changes in soil temperature, moisture content, light availability and diameter growth after thinning in Korean pine (Pinus koraiensis) plantation. J. Korean Soc. For. Sci. 2010, 99, 397–403. [Google Scholar]
  45. Cheng, J.; Ding, C.; Li, X.; Zhang, T.; Wang, X. Soil quality evaluation for navel orange production systems in central subtropical China. Soil Tillage Res. 2016, 155, 225–232. [Google Scholar] [CrossRef]
  46. Yu, Y.; Yang, J.; Zeng, S.; Wu, D.; Jacobs, D.F.; Sloan, J.L. Soil pH, organic matter, and nutrient content change with the continuous cropping of Cunninghamia lanceolata plantations in South China. J. Soils Sediments 2017, 17, 2230–2238. [Google Scholar] [CrossRef]
  47. Fang, X.-M.; Zhang, X.-L.; Zong, Y.-Y.; Zhang, Y.; Wan, S.-Z.; Bu, W.-S.; Chen, F.-S. Soil phosphorus functional fractions and tree tissue nutrient concentrations influenced by stand density in subtropical Chinese fir plantation forests. PLoS ONE 2017, 12, e0186905. [Google Scholar] [CrossRef]
  48. Chen, L.; Wang, D.; Yu, F.; Wang, Z. Effects of stand density on physical and chemical properties of soil moisture. J. Northeast. For. Univ. 2013, 41, 61–64. [Google Scholar]
  49. López, R.; Gondar, D.; Iglesias, A.; Fiol, S.; Antelo, J.; Arce, F. Acid properties of fulvic and humic acids isolated from two acid forest soils under different vegetation cover and soil depth. Eur. J. Soil Sci. 2008, 59, 892–899. [Google Scholar] [CrossRef]
  50. Matinizadeh, M.; Korori, S.; Teimouri, M.; Praznik, W. Enzyme Activities in Undisturbed and Disturbed Forest Soils under Oak (Quercus brantii var. persica) as Affected by Soil Depth and Seasonal Variation. 2008. Available online: https://www.cabidigitallibrary.org/doi/full/10.5555/20083189779 (accessed on 31 May 2024).
  51. Achat, D.L.; Augusto, L.; Bakker, M.R.; Gallet-Budynek, A.; Morel, C. Microbial processes controlling P availability in forest spodosols as affected by soil depth and soil properties. Soil Biol. Biochem. 2012, 44, 39–48. [Google Scholar] [CrossRef]
  52. Wei, L.; Archaux, F.; Hulin, F.; Bilger, I.; Gosselin, F. Stand attributes or soil micro-environment exert greater influence than management type on understory plant diversity in even-aged oak high forests. For. Ecol. Manag. 2020, 460, 117897. [Google Scholar] [CrossRef]
  53. Hao, J.F.; Wang, D.Y.; Li, Y.; Zhu, Y.H.; Yao, X.L.; Qi, J.Q. Effect of altitude on structure and species diversity of Cunninghamia lanceolata plantation in Jiangyou district, Sichuan Province. Acta Bot. Boreal.-Occident. Sin. 2014, 34, 2544–2552. [Google Scholar] [CrossRef]
  54. Wang, S.S.; Yu, X.X.; Luo, Y.Y.; Zhao, G.L.; Yang, J.; Hai, L. Effects of reforestation on woody plant biodiversity of forest vegetation in Badaling, Beijing. J. Beijing For. Univ. 2008, 30 (Suppl. 2), 155–159. [Google Scholar]
  55. Thysell, D.R. Effects of Forest Management on Understory and Overstory Vegetation: A Retrospective Study; Pacific Northwest Research Station: Portland, OR, USA, 2000; Volume 488. [Google Scholar]
  56. Ding, J.; Zhang, Y.; Guo, Y.; Yang, S.; Ren, D.; He, Z.; Guo, J. Influences of the Density on Understory Species Composition and Diversity of Larix principis-rupprechtii Natural Forest. J. Northwest For. Univ. 2018, 4, 10–16. [Google Scholar]
  57. Alem, S.; Pavlis, J.; Urban, J.; Kucera, J. Pure and mixed plantations of Eucalyptus camaldulensis and Cupressus lusitanica: Their growth interactions and effect on diversity and density of undergrowth woody plants in relation to light. Open J. For. 2015, 5, 375. [Google Scholar] [CrossRef]
  58. Zhang, J.; Oliver, W.W.; Ritchie, M.W.; Neal, D.L. Overstory and understory dynamics in a ponderosa pine plantation vary with stand density in the Sierra Nevada: 40-year results. For. Sci. 2013, 59, 670–680. [Google Scholar] [CrossRef]
  59. Coomes, D.A.; Grubb, P.J. Impacts of root competition in forests and woodlands: A theoretical framework and review of experiments. Ecol. Monogr. 2000, 70, 171–207. [Google Scholar] [CrossRef]
  60. Schenk, H.J. Root competition: Beyond resource depletion. J. Ecol. 2006, 94, 725–739. [Google Scholar] [CrossRef]
  61. Fang, J.; Wang, X.; Shen, Z.; Tang, Z.; He, J.; Yu, D.; Jiang, Y.; Wang, Z.; Zheng, C.; Zhu, J. Methods and protocols for plant community inventory. Biodivers. Sci. 2009, 17, 533. [Google Scholar]
Figure 1. A map of the study area showing the location of Qingping Forest Farm, part of the Dahailin Forestry Bureau, Heilongjiang Province in northeast China.
Forests 15 01149 g001
Figure 2. Variation in total volume among stand density types. Different lowercase letters indicate significant differences at p < 0.05 level.
Forests 15 01149 g002
Figure 3. Variation trends of selected soil properties with stand densities. Different lowercase letters indicate significant differences at p < 0.05 level. (A) = TN—total nitrogen; (B) = AN—available nitrogen, (C) = TP—total phosphorus, (D) = AP—available phosphorous, (E) = TK—total potassium, (F) = AK—available potassium.
Forests 15 01149 g003
Figure 4. Variation of diversity index of shrub among stand densities. Note: different lowercase letters denote significant differences at p < 0.05 level. (A) = Shannon diversity (shrub), (B) = species richness (shrub), (C) = Simpson’ diversity (shrub), (D) = species evenness (shrub).
Forests 15 01149 g004
Figure 5. Variation of diversity index of herb among stand densities. Note: different lowercase letters indicate significant differences at p < 0.05 level. (A) = Shannon diversity (herb), (B) = species richness (herb), (C) = Simpson’ diversity (herb), (D) = species evenness (herb).
Forests 15 01149 g005
Table 1. Information about the number of trees per plot, stand density, mean diameter, height, and mean volume per plot in the study area.
Density LevelStand Density/PlotNo. of Trees/PlotMean Diameter (cm)/PlotMean Height (m)/PlotMean Volume (m3)/Plot
Low708.33 ± 11.7842.50 ± 0.7122.86 ± 4.2819.63 ± 2.410.45 ± 0.18
Medium841.66 ± 11.7850.50 ± 0.7124.58 ± 0.0920.91 ± 0.060.52 ± 0.00
High 900.00 ± 23.5754.00 ± 0.7123.49 ±0.8321.10 ± 0.110.49 ± 0.04
Note: shown is the mean ± SE of figures for tree data in columns across all density types. The mean volume was calculated for individual trees. V = 0000589865D1.966609091H0.904763956 where V is tree volume (stem volume over bark), D is the diameter at breast height, and H is total tree height.
Table 2. Methods and equipment used for soil physical and chemical properties determination in the Key Laboratory of Sustainable Forest Ecosystem Management at the College of Forestry-Northeast Forestry University.
No.Soil PropertiesMethod/Equipment
1pHpH meter
2Bulk density (BD) The core method of the Nanjing Institute of Soil Science (1978)
3Moisture content (SMC %) Calculated based on wet and dry weight
4Soil organic matter (SOM) Wet oxidation method (CN elemental analyzer) and then calculated as SOM
5Total nitrogen CN elemental analyzer
6Total phosphorus AA3 flow analyzer
7Total potassium Flame photometry
8Available nitrogen Diffusion method
9Available phosphorus AA3 flow analyzer
10Available potassium Flame photometry
Table 3. Summary of means and standard deviation of soil chemical properties under various soil depths.
Density LevelSoil Properties
First Layer (0–10 cm)TN (mg g−1)TP (g/kg)TK (mg/kg)AN (mg g−1)AP (mg/kg)AK (mg/kg)
LSD2.78 ± 0.01 a0.15 ± 0.02 a134.23 ± 0.90 c46.13 ± 2.07 b1.01 ± 0.34 a117.04 ± 18.03 b
MSD2.26± 0.04 b0.17 ± 0.09 a223.48 ± 32.23 a61.06 ± 0.15 a0.87 ± 0.01 a159.80 ± 12.18 a
HSD2.11 ± 0.16 b0.10 ± 0.03 a166.26 ± 0.54 b43.28 ± 4.13 b0.56 ± 0.21 a125.69 ± 23.14 b
Second layer (10–20 cm)
LSD2.02 ± 0.12 a0.04 ± 0.12 a133.41 ± 9.57 a25.83 ± 12.12 a1.20 ± 0.66 a79.50 ± 27.39 a
MSD1.48 ± 0.11 a0.06 ± 0.08 a200.80 ± 31.14 a39.17 ± 16.46 a1.60 ± 0.21 a127.04 ± 22.78 a
HSD1.53 ± 0.17 a0.02 ± 0.06 a163.05 ± 3.48 a36.57 ± 1.13 a0.48 ± 1.43 a93.71 ± 13.10 a
Third layer (20–30 cm)
LSD1.66 ± 0.01 a0.05 ± 0.13 a134.86 ± 3.22 a20.91 ± 16.63 a0.93 ± 0.65 a76.27 ± 18.83 a
MSD1.29 ± 0.09 b0.12 ± 0.13 a191.44 ± 22.42 a31.17 ± 27.82 a1.63 ± 0.31 a136.85 ± 11.84 a
HSD1.33 ± 0.09 b0.06 ± 0.09 a167.77 ± 11.25 a20.16 ± 20.30 a0.62 ± 1.84 a104.39 ± 20.3 a
Note: shown as a mean ± SE; different letters indicate significant differences among stand types at various soil depths at p < 0.05. LSD = low stand density, MSD = medium stand density, HSD = high stand density, TN = total nitrogen, TP = total phosphorous, TK = total potassium, AN = available nitrogen, AP = available phosphorous, and AK = available potassium.
Table 4. Summary of means and standard deviation of soil physical properties under various stand densities and soil depths.
Density LevelSoil Properties
First Layer (0–10 cm)pHSMC (%)BD (g/cm3)OM
LSD5.85 ± 0.30 a0.14 ± 0.03 a0.37 ± 0.01 a52.30 ± 3.34 a
MSD6.24 ± 0.03 a0.09 ± 0.01 a0.36 ± 0.00 a48.00 ± 3.13 a
HSD5.94 ± 0.34 a0.11 ± 0.02 a0.37 ± 0.01 a48.09 ± 0.85 a
Second layer (10–20 cm)
LSD5.57 ± 0.04 a0.11 ±0.01 a0.36 ± 0.00 a30.61 ± 6.36 a
MSD5.80 ± 0.03 a0.09 ± 0.00 ab0.36 ± 0.01 a28.54 ± 1.41 a
HSD5.51 ± 0.44 a0.06 ± 0.02 b0.37 ± 0.01 a29.42 ± 6.51 a
Third layer (20–30 cm)
LSD5.42 ± 0.16 a0.10 ± 0.01 a0.36 ± 0.01 a21.90 ± 3.15 a
MSD5.59 ± 0.33 a0.08 ± 0.01 a0.37 ± 0.00 a21.00 ± 1.47 a
HSD5.50 ± 0.44 a0.07 ± 0.02 a0.36 ± 0.02 a19.71 ± 7.75 a
Note: shown is the mean ± SE; different letters indicate significant differences between soil physical properties at stand density level and soil depth at p < 0.05. LSD = low stand density, MSD = medium stand density, HSD = high stand density, SMC = soil moisture content, BD = bulk density, and OM = organic matter.
Table 5. Correlations between tree growth parameters and some selected soil properties.
IndexTNTPTKANAPAKADBHAHTV
TN10.25−0.230.44−0.150.15−0.46−0.62−0.33
TP 10.460.420.280.73 **−0.25−0.59−0.52
TK 10.430.080.80 **0.360.07−0.44
AN 1−0.220.67 **−0.11−0.47−0.43
AP 10.1−0.15−0.210.17
AK 1−0.41−0.73−0.72
ADBH 10.91 *0.43
AH 10.65
TV 1
Note: TN = total nitrogen, TP = total phosphorous, TK = total potassium, AN = available nitrogen, AP = available phosphorous, AK = available potassium, ABH = average diameter at breast height, AH = average height, and TV = total volume. “−” shows negative relationships, and “*” denotes a significant difference at various levels (* p < 0.05; ** p < 0.01).
Table 6. (a) Table showing the importance of species values of shrubs at various stand densities. (b) Table showing importance species values of herbs at various stand densities.
Density LevelSpecies RD (%)RF (%)RC (%)IV
(a)
LowLespedeza bicolor Turcz.95.8363.6481.1380.20
Aralia chinensis L.4.1736.3618.8719.80
MediumLespedeza bicolor Turcz.71.630.7755.0452.50
Prunus padus L.1.237.690.443.10
Corylus heterophylla Fisch.2.4715.384.387.40
Sambucus williamsii Hance1.2315.383.656.80
Vitis amurensis Rupr.3.715.387.38.80
Rubus crataegifolius Bge.19.7515.3829.221.40
HighLespedeza bicolor Turcz.87.9363.6470.3074.00
Sorbaria sorbifolia (L.) A. Braun1.729.093.964.90
Sambucus williamsii Hance8.6218.1821.7816.20
Corylus heterophylla Fisch.1.729.093.964.90
(b)
LowFestuca rubra L.18.217.61.1512.3
Potentilla cryptotaeniae Maxim.9.18.60.035.9
Athyrium brevifrons Nakai ex Kitagawa27.326.193.3148.9
Sedum aizoon L.18.219.21.6913.0
Lamium barbatum Sieb. et Zucc.9.19.01.126.4
Clematis florida Thunb.9.19.40.456.3
Geum aleppicum Jacq.9.110.22.257.2
MediumClematis terniflora DC.7.148.611.675.81
Linnaea borealis L.7.147.500.034.89
Thalictrum aquilegiifolium var. sibiricum Linnaeus14.2914.440.749.82
Deyeuxia pyramidalis7.148.6115.58
Agrimonia pilosa Ldb.14.2914.172.5110.32
Vicia unijuga A. Br.7.148.890.25.41
Lunaria annua L.7.145.831.674.88
Impatiens noli-tangere L.7.146.390.134.55
Crepidiastrum denticulatum (Houtt.) Pak & Kawano7.146.670.134.65
Lamium barbatum Sieb. et Zucc.14.2912.788.3611.81
Athyrium brevifrons Nakai ex Kitagawa7.146.1183.5632.27
HighFestuca rubra L.7555.4756.2562.2
Thalictrum aquilegiifolium var. sibiricum Linnaeus12.541.2012.522.1
Vicia unijuga A. Br.12.53.3331.2515.7
Note: RD = relative density, RF = relative frequency, RC = relative coverage; IV = species important value.
Disclaimer/Publisher’s Note: The statements, opinions and data contained in all publications are solely those of the individual author(s) and contributor(s) and not of MDPI and/or the editor(s). MDPI and/or the editor(s) disclaim responsibility for any injury to people or property resulting from any ideas, methods, instructions or products referred to in the content.

