Article

Climate as a Driver of Aboveground Biomass Density Variation: A Study of Ten Pine Species in Mexico

by
Dioseline Girón-Gutiérrez
1,
Jorge Méndez-González
2,*,
Tamara G. Osorno-Sánchez
3,
Julián Cerano-Paredes
4,
José C. Soto-Correa
1 and
Víctor H. Cambrón-Sandoval
1,*
1
Faculty of Natural Sciences, Juriquilla Campus, Autonomous University of Queretaro, Av. de las Ciencias s/n, Juriquilla 76230, Querétaro, Mexico
2
Department of Forestry, Autonomous Agrarian University Antonio Narro, Calz Antonio Narro 1923, Saltillo 25315, Coahuila, Mexico
3
Faculty of Natural Sciences, Aeropuerto Campus, Autonomous University of Queretaro, Carretera a Chichimequillas s/n, Ejido Bolaños 76140, Querétaro, Mexico
4
National Institute of Forestry, Agricultural and Livestock Research, National Center for Disciplinary Research Water-Soil-Plant-Atmosphere Relation, km 6.5 Margen Derecha Canal Sacramento, Gómez Palacio 35150, Durango, Mexico
*
Authors to whom correspondence should be addressed.
Forests 2024, 15(7), 1160; https://doi.org/10.3390/f15071160
Submission received: 22 May 2024 / Revised: 28 June 2024 / Accepted: 2 July 2024 / Published: 3 July 2024
(This article belongs to the Section Forest Meteorology and Climate Change)

Abstract

:
The native pine species of Mexico, constituting 55% of all pine species, play a crucial economic role for local populations. Climatic factors affected by climate change, such as temperature and precipitation, influence tree physiology and distribution. Our study focused on the aboveground biomass density (AGBd) distribution of ten Mexican pine species and its correlation with bioclimatic variables. Dendrometric data were obtained from National Forest and Soil Inventory (INFyS) (period: 2009 and 2014) while data on bioclimatic variables were obtained from WorldClim2. AGBd distribution maps were generated for the ten species. Spearman and Bayesian correlations were determined between AGBd and the 19 bioclimatic variables. Six species showed a significant correlation (p < 0.05) between AGBd and bioclimatic variables. The results did not show geographical regionalization for AGBd and highlighted the complexity of responses in each species. Temperature variables showed the highest number of correlations with AGBd (76%), which varied between species. Regarding precipitation, correlations were mostly positive. In general, our findings suggest an important link between climate and AGBd, from which relevant strategies can be developed for sustainable forest management of the country’s forests in relation to expected climate change.

1. Introduction

In Mexico, temperate forests composed mainly of pines and oaks are of great economic relevance, as the genus Pinus contributes 70.9% of timber forest production [1]. They have cultural importance because at least 11.87 million people live in forest regions, 3.6 million of whom are indigenous peoples who have developed processes of governance, community organization, and forestry based on social cooperation [2]. They also have ecological importance, since they are present in the five mountainous regions of Mexico and are distributed over a wide range of temperatures, elevations, and precipitation levels, which is why Mexico is considered a center of diversification of the genus Pinus. In total, 55% of the pine species are endemic to Mexico, without taking into account recently described subspecies and varieties [3,4], which emphasizes the importance of conserving this type of vegetation.
In addition, climate change has had significant repercussions on the dynamics of temperate forests [5]. Forest ecosystems play a vital role in addressing climate change by serving as large carbon sinks through photosynthesis. They store carbon in their plant tissues, mainly in the form of biomass in the aerial part (AGB), below ground, or in total, with about 50% of AGB consisting of carbon [6]. AGB refers to the total mass of living organic matter in a specific area [7]. Young, growing plants absorb more carbon in their biomass, while mature forests serve as significant carbon reservoirs [8]. It is estimated that forests globally can absorb approximately 2.4 ± 0.4 Pg C year−1 [9]. In Mexico, the estimated carbon stock in living biomass is 1.69 Gt C ± 1%, with an average carbon density of 21.8 t C ha −1 [10].
In this context, AGB and carbon sequestration in forests depend on plant biomass production, which is influenced by various factors. These factors include distribution, structure [11], stand density [12,13], diversity [14,15] forest type [16], slope and elevation [17,18], soil type [19], and of course climatic variables. For example, a study [12] found that temperature is the main factor affecting diameter and AGB, while precipitation was key for species richness in three types of forests. Another study [15] correlated climatic variables with carbon density in African forests and found that carbon density is positively correlated with mean annual precipitation but negatively correlated with mean annual temperature. Additionally, a global study [20] reported that mean annual temperature has a positive effect on the AGB accumulation rate in young coniferous forests and a negative effect in broadleaf deciduous forests. However, the association with annual precipitation is inconsistent on a global scale. At the individual tree level, significant correlations are also observed between temperature and biomass fractions, such as roots, foliage, and total biomass [21]. These factors collectively contribute to the dynamics of biomass.
In several studies [5,12,13,14,15,16,17,18,19,22], climatic factors such as temperature and precipitation have been identified as key modulators of biomass productivity. On a broader scale, larger studies have revealed that temperature predominantly exerts a negative influence on tree growth and density across boreal, temperate, and tropical forests [23]. Similar findings were reported in Mexico [16], highlighting mean annual temperature as the most strongly (negatively) associated variable with biomass. Minimum temperatures were also found to influence biomass distribution due to seasonality [21].
The CMIP6 (Coupled Model Intercomparison Project) scenarios and the shared socioeconomic pathways (SSP1 to SSP5) utilized by the IPCC have projected a consistent temperature increase trend. These scenarios indicate an average temperature rise of 1.5 °C (SSP1–1.9), while high-warming scenarios (SSP5–8.5) predict a temperature increase of up to 5.0 °C by 2100 [24]. This is expected to worsen issues in temperate forests, such as reduced timber yields, resilience, and biodiversity [25], as well as the spatial and temporal modification of AGB [10,26]. Projections for Mexico suggest a reduction in forest cover, particularly in temperate and cold forests [27]. Additionally, by 2050, projections suggest that approximately 20% of Mexican forests could experience a reduction in their coverage owing to the impacts of climate change. Moreover, a reduction of up to 50% in the natural range of certain commercially valuable species within the genus Pinus is anticipated [28].
Climate uncertainty underscores the necessity of comprehending the climatic patterns influencing or contributing to biomass productivity in each species. However, this specific relationship between climatic variables and aboveground biomass across different regions of Mexico remains poorly documented for pine species [16,28]. Our objective was to identify and quantify, using two approaches (Frequentist and Bayesian), the correlation between bioclimatic variables and aboveground biomass density (AGBd) in ten economically and ecologically important pine species of Mexico. We hypothesized that there is a significant correlation between climate variables (temperature and precipitation) and the AGBd of pine species in Mexico.

2. Materials and Methods

2.1. Characteristics of the Study Area and Species Selection

This study was realized in the forests of Mexico, covering an area of 1,960,189 km2. The country is the 14th largest in the world and its coordinates are between latitudes 14°32′27″ N and 32°43′06″ N and longitudes 86°42′36″ W and 118°27′24″ W [29]. Due to the geographical location of the country, there is a great diversity of pine species found at altitudes ranging from 1500 to 3000 m above sea level, with some populations found as high as 4000 m. Pine species thrive in mean annual temperatures ranging from 6 °C to 28 °C and average annual precipitation ranging from 350 mm to over 2000 mm [4,21]. In other words, these species can adapt to a wide variety of temperature and precipitation conditions.
The species were selected based on the following criteria: (1) abundance, (2) natural establishment (not plantations), (3) different geographical distributions across the country, and (4) economic and ecological importance [30]. In this study, ten pine species were selected, including Pinus leiophylla Schiede ex Schltdl. and Cham; Pinus teocote Schiede ex Schltdl. and Cham; Pinus montezumae Lamb; Pinus pseudostrobus Lindl; and Pinus oocarpa Schiede ex Schltdl; these are resin-rich species that serve as economic sustenance for local populations [4,31,32,33]. Pinus oocarpa, distributed throughout Mexico, has served as a model for assisted migration implementation [34] (Table S1).
Other chosen species included Pinus devoniana Lindl and Pinus cembroides Zucc, which are significant species in restoring severely eroded sites [35,36,37]. Additionally, P. cembroides is renowned for its seed consumption in a wide variety of traditional Mexican dishes and is widely distributed across Mexico [38,39]. Also selected was Pinus arizonica Engelm., as its distribution is restricted to northern Mexico (hence its importance for conservation). The final selections, Pinus ayacahuite Ehrenb. ex Schltdl. and Pinus patula Schltdl. and Cham, are widely used for their timber quality [4,40,41,42] (Table S1).

2.2. Database Acquisition

The data were collected from the National Forest and Soil Inventory (INFyS) platform of Mexico for the years 2009 to 2014; these datasets were published by the National Forestry Commission (CONAFOR) on its official website https://snmf.cnf.gob.mx/infys/ (accessed on 23 September 2023). The data include ecological, health, and dasometric information. Dasometric data provide details such as cluster ID (sites), geographic coordinates (latitude and longitude), altitude (meters above sea level), scientific name of the species, number of trees, total height of each tree (in meters), and diameter at breast height of each tree (in centimeters). To be included in the inventory, individual trees must have a minimum diameter at breast height (DBH) of 7.5 cm, and only trees meeting this criterion have all their information recorded [43].
Additionally, bioclimatic data, comprising 19 variables (BIOS) with a spatial resolution of 1 km2 for each site, were obtained from https://www.worldclim.org/data/worldclim21.htm (accessed on 28 September 2023) [44] (Appendix A). These data were obtained using the coordinates of each site.

2.3. Aboveground Biomass Estimation and Data Cleaning

The aboveground biomass (AGB) was calculated using published equations for each species (refer to Table 1) based on the following criteria for equation selection: (i) the equation with the largest sample size, (ii) including the widest range of tree diameter categories, (iii) developed in natural forests, and (iv) with the highest fit (R2). AGB was calculated at the individual tree level and then extrapolated to density, AGBd (t ha−1), according to the INFyS sampling methodological guidelines [43].
The AGBd data underwent refinement using principal component analysis (PCA). In this process, the bioclimatic variable values obtained in the previous section were extracted for each site or cluster using GIS. A matrix was then created with AGBd, altitude, and 19 bioclimatic variables. The PCA was conducted with standardized variables, resulting in a 95% confidence ellipse. Data outside the ellipse were identified and considered as atypical, and were eliminated from the database. FactoMineR, an R library ver. 2.8 package [45], was utilized for this analysis. The eliminated sites included data entry errors, incorrect geographic locations of the species, and misidentified species [46,47].
Table 1. Equations used to estimate aboveground biomass.
SpeciesEquationR2nAuthor
P. arizónica A G B = 0.0819 D B H 2.4293 0.9766[47]
P. ayacahuite A G B = 0.2893 D B H 2.1569 0.9758[47]
P. cembroides A G B = e x p 0.9173 * D B H 1.0730 0.9830[48]
P. devoniana A G B = 0.182 D B H 1.936 0.9820[49]
P. leiophylla A G B = 0.1751 D B H 2.2629 0.9327[47]
P. montezumae A G B = 0.013 D B H 3.0462 0.9916[50]
P. oocarpa A G B = 0.10012 D B H 2.4589 0.9633[51]
P. patula A G B = 0.0948 D B H 2.4079 0.9925[52]
P. pseudostrobus A G B = 0.003 D B H 3.383 0.9920[49]
P. teocote A G B = 0.2057 D B H 2.2583 0.9956[47]
Note: AGB: total aboveground biomass (kg); DBH: diameter at breast height (cm); n: number of trees.
In addition, cartographic representations were created to visualize the spatial distribution of the species and AGBd quantities. AGBd was divided into two categories: lower AGBd (quantile 1 = 0–20 t ha−1) and higher AGBd (quantile 5 = 80–100 t ha−1), and these categories were then mapped using QGIS software (ver. 3.28, Firenze) [53].

2.4. Statistical Analysis

In this study, we utilized the ‘psych’ library in Rstudio software v.2023.09.1+494 "Desert Sunflower" Release [54,55] to compute descriptive statistics for the variables DBH, H, number of trees, and AGBd per species. Following this, we applied the Kruskal–Wallis non-parametric test (owing to the non-normality of the variables) using the ‘agricolae’ R library [55] to ascertain whether there were significant differences (α = 0.05) in the medians of DBH, H, and AGBd among species. To discern the climatic tolerances and preferences of each species, we generated density plots for the variables BIO1, BIO12, BIO5, and BIO6 (Figure 1) to understand how species are distributed in relation to these climatic variables.
To determine the distribution of the variables of interest, Kolmogorov–Smirnov normality tests with Lilliefors correction were applied to AGBd and the 19 bioclimatic variables, using the ‘rstatix’ library [56]. To assess the influence of climate on the variability of AGBd in pine species in Mexico, we used Spearman’s correlation between AGBd and each of the bioclimatic variables, using the ‘correlation’ library [55]. In addition, we calculated the statistical significance of each relationship and the confidence intervals of “ρ”. From this, a heatmap was derived, showing only statistically significant correlations (p < 0.05) for each species.
To strengthen our findings, we have augmented our analysis with Bayesian correlation (Spearman’s). This approach provides a full probability distribution for the correlation coefficient, offering a detailed and comprehensive representation of the uncertainty associated with our estimations [57,58]. In the context of our correlation, the null hypothesis would be no correlation between the two variables ( h 0 : ρ = 0 ; where ρ stands for Bayesian correlation coefficient), while the alternative hypothesis would be that there is a correlation different than 0—positive or negative ( h 1 :   ρ 0 ).
Finally, using the ‘ggpubr’ library [58], the non-parametric Mann–Whitney U test (95%) was applied exclusively to those significant correlations (p < 0.05) with coefficients greater than ρ = >|0.22| between AGBd and the bioclimatic variables (BIOs). This was done to identify possible statistical differences in the values of the BIOs between quantile 5 and the rest of the quantiles, thus providing an additional way to determine whether the variation of AGBd is influenced by climate.

3. Results

3.1. Basic Comparative Analysis

Pinus cembroides was the species with the most trees recorded (n = 21,494), distributed in 1238 sites, indicating a wide adaptation to a variety of climatic conditions (Appendix A). In contrast, P. montezumae had the fewest records (n = 1475) at 119 sites. In terms of height, P. cembroides (5.30 ± 1.40 m) and P. arizonica (8.52 ± 2.59 m) had the lowest averages, while P. pseudostrobus (14.07 ± 6.20 m) and P. patula (13.92 ± 5.82 m) had the highest averages.
The normality tests revealed that AGBd data and bioclimatic variables did not conform to a normal distribution (p < 0.05), thus necessitating the use of non-parametric statistical tests. According to the above-stated approach, per the Kruskal–Wallis rank test, the species with the highest AGBd were P. pseudostrobus, P. montezumae, P. patula, and P. oocarpa (5.07–9.01 t ha−1), with P. pseudostrobus at up to 99.78 t ha−1, highlighting the capacity of these species to accumulate large amounts of biomass due to their dimensions and the density of trees in the stand. In contrast, P. devoniana and P. ayacahuite averaged 1.16 and 1.14 t ha−1, respectively, which is due to their restricted distribution and low stand tree density (Table 2).

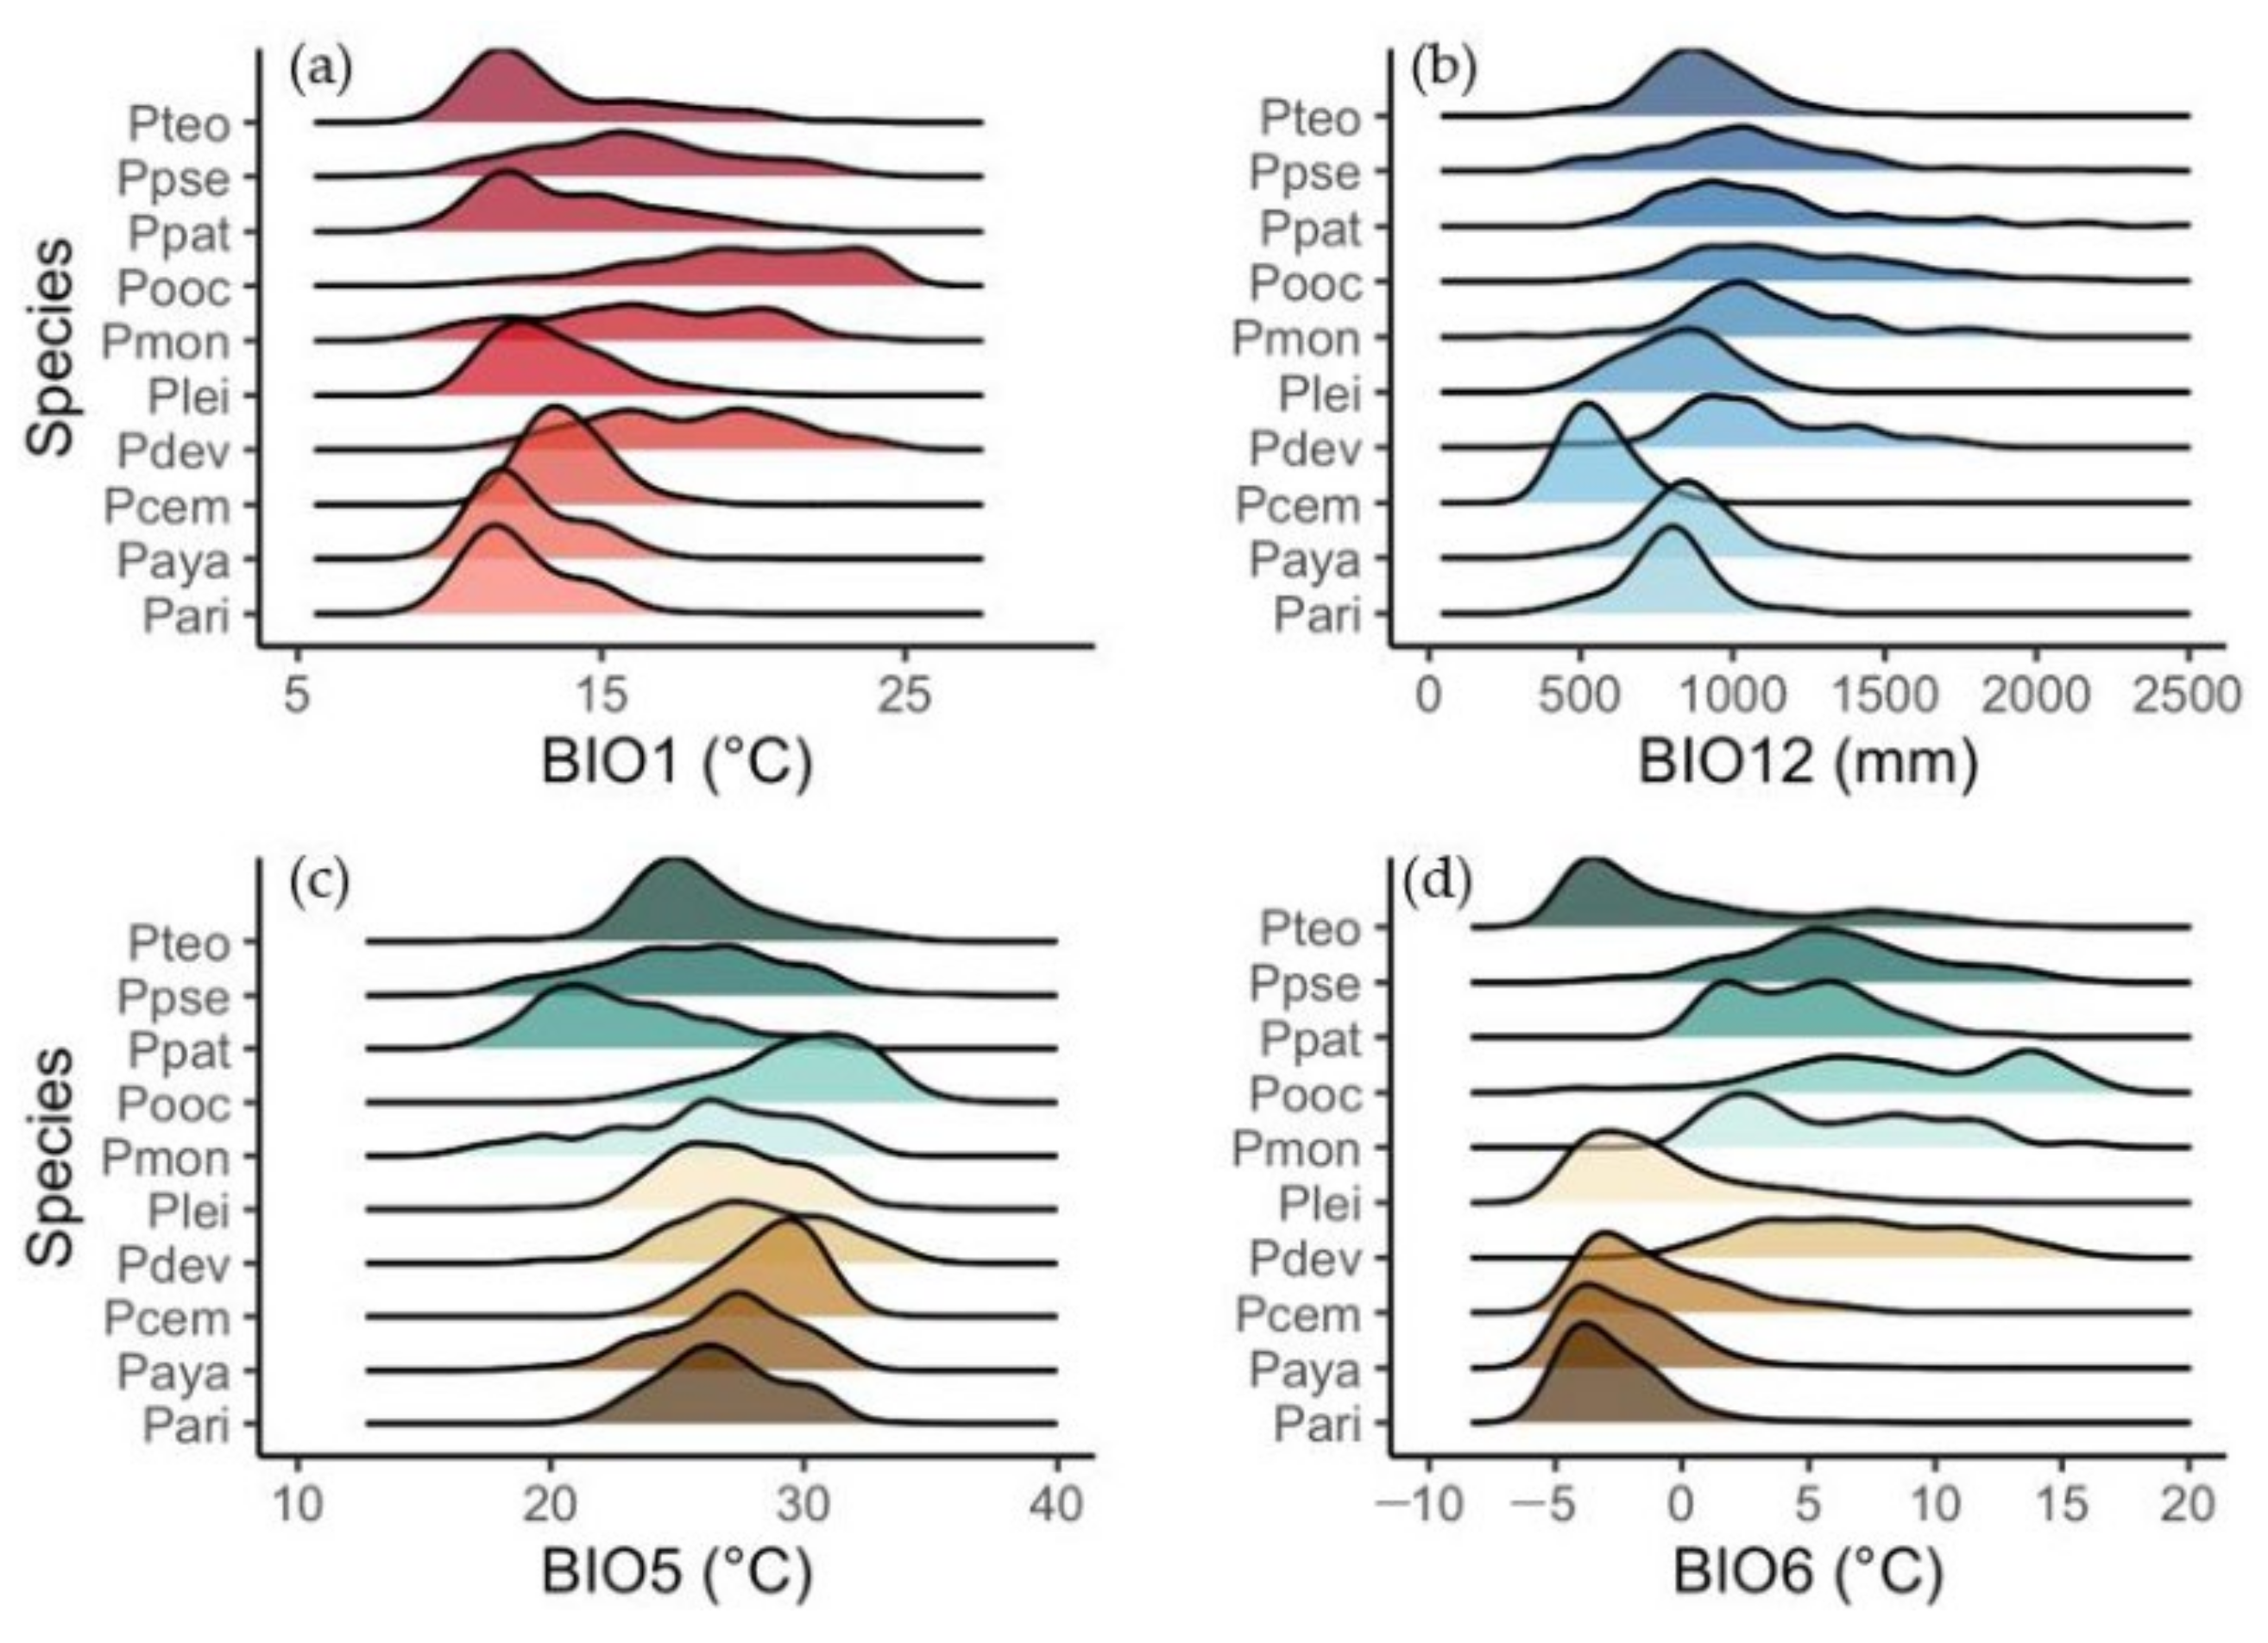
3.2. Distribution Patterns and Climatic Tolerances

Pinus pseudostrobus demonstrated a wider range (16 °C) in mean annual temperature (BIO1), spanning 7 to 24 °C (Figure 1a). In contrast, P. ayacahuite was within a narrower range (10 °C), ranging from 9 to 19 °C. Three groups of species, P. oocarpa, P. pseudostrobus, and P. patula, were distributed in precipitation ranges above 1900 mm, while P. leiophylla P. arizonica, and P. ayacahuite were found in lower precipitation ranges of 875, 932, and 954 mm, respectively (Figure 1b).
Similarly, P. pseudostrobus exhibited a higher tolerance to extreme temperatures (BIO5), ranging from 15.20 °C to 36.20 °C (Figure 1c), contrasting with P. cembroides, which demonstrated a smaller range (11.60 °C) but can withstand temperatures of up to 34.30 °C. P. oocarpa displayed a wide range of minimum temperatures (BIO6), spanning from −4.90 °C to 17.70 °C (a range of 22.60 °C); in contrast, P. patula exhibited a more restricted tolerance, with a range of less than half that of P. oocarpa (12.20 °C), from 0.5 to 12.70 °C (Figure 1d).
It has been observed that the climatic tolerances of species are directly related to AGB productivity [15,22,59,60]. The ability of P. pseudostrobus to withstand a wide range of temperatures allows it to maintain sustained growth and high productivity even under variable climatic conditions [61]. Species like P. ayacahuite, with restricted temperature and precipitation ranges, show lower average AGBd (1.14 t ha−1, Table 2), suggesting that their growth and biomass accumulation are limited to specific climatic conditions.
Overall, we observe that species with greater tolerances to broad and extreme climatic variations, such as P. pseudostrobus and P. oocarpa, are capable of accumulating more biomass due to their adaptability to different environmental conditions, similar to what has been demonstrated by [22,62].
The distribution maps of maximum (quantile 5: 80–100 AGBd t ha−1) and minimum (quantile 1: 0–20 AGBd t ha−1) AGBd did not show any discernible pattern that could indicate an association between AGBd and a specific region, suggesting that the microclimatic conditions of the site play a significant role (Figure 2a–j).

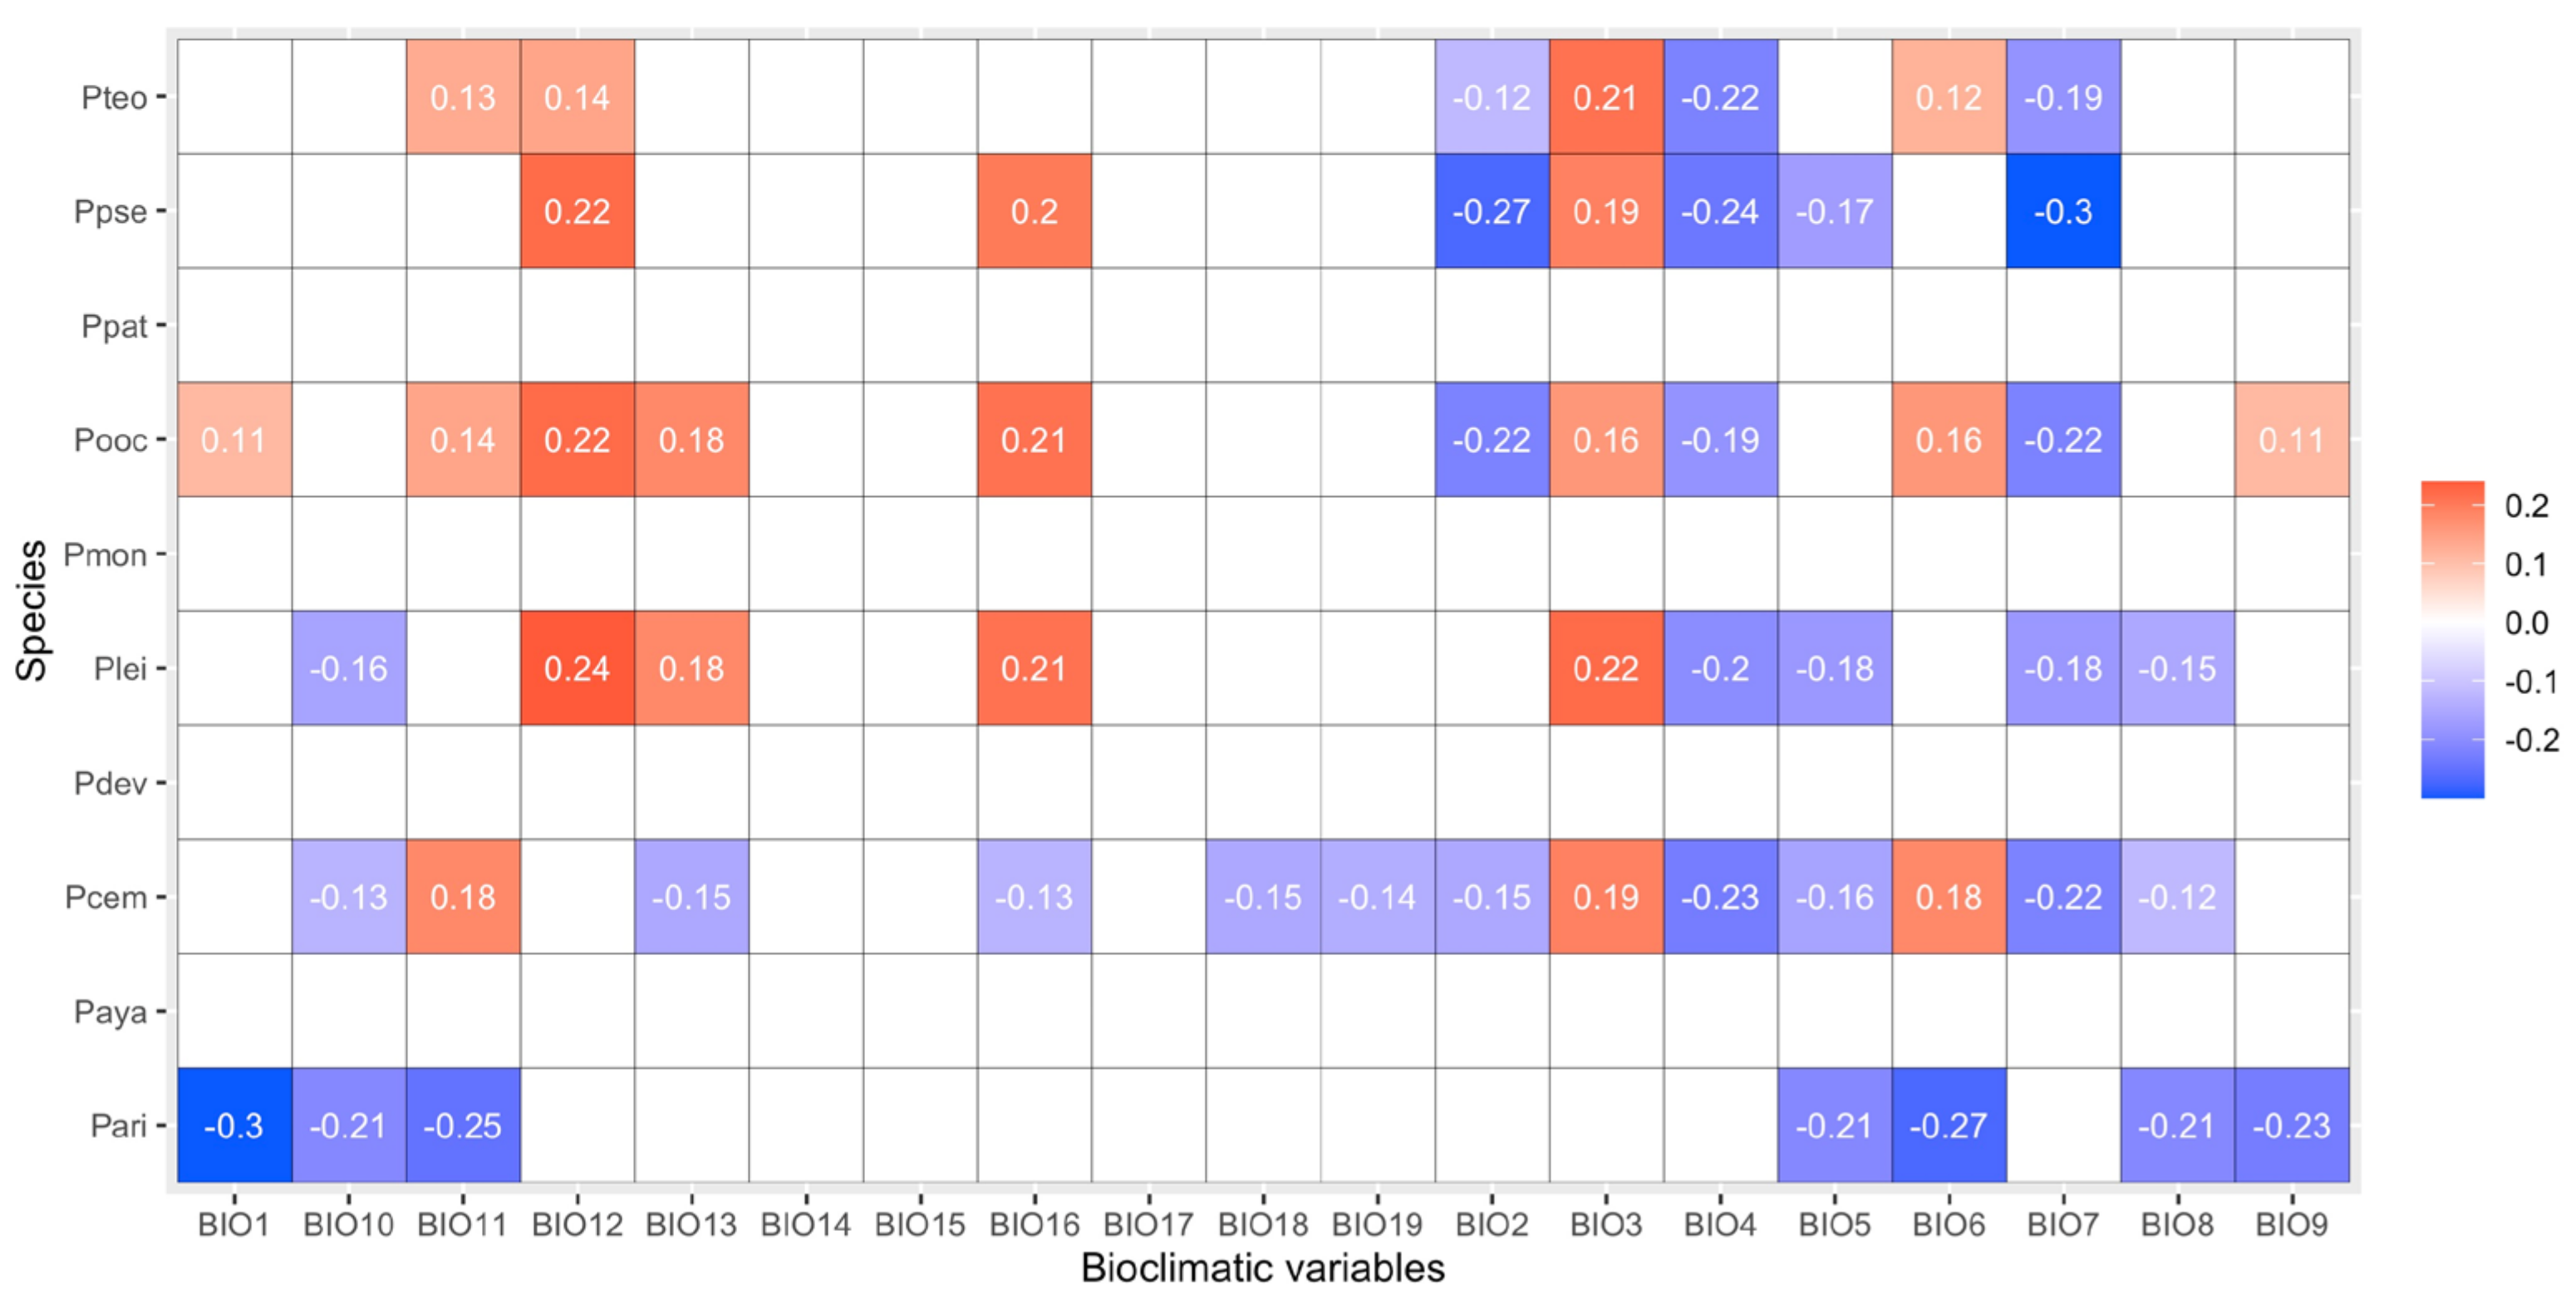
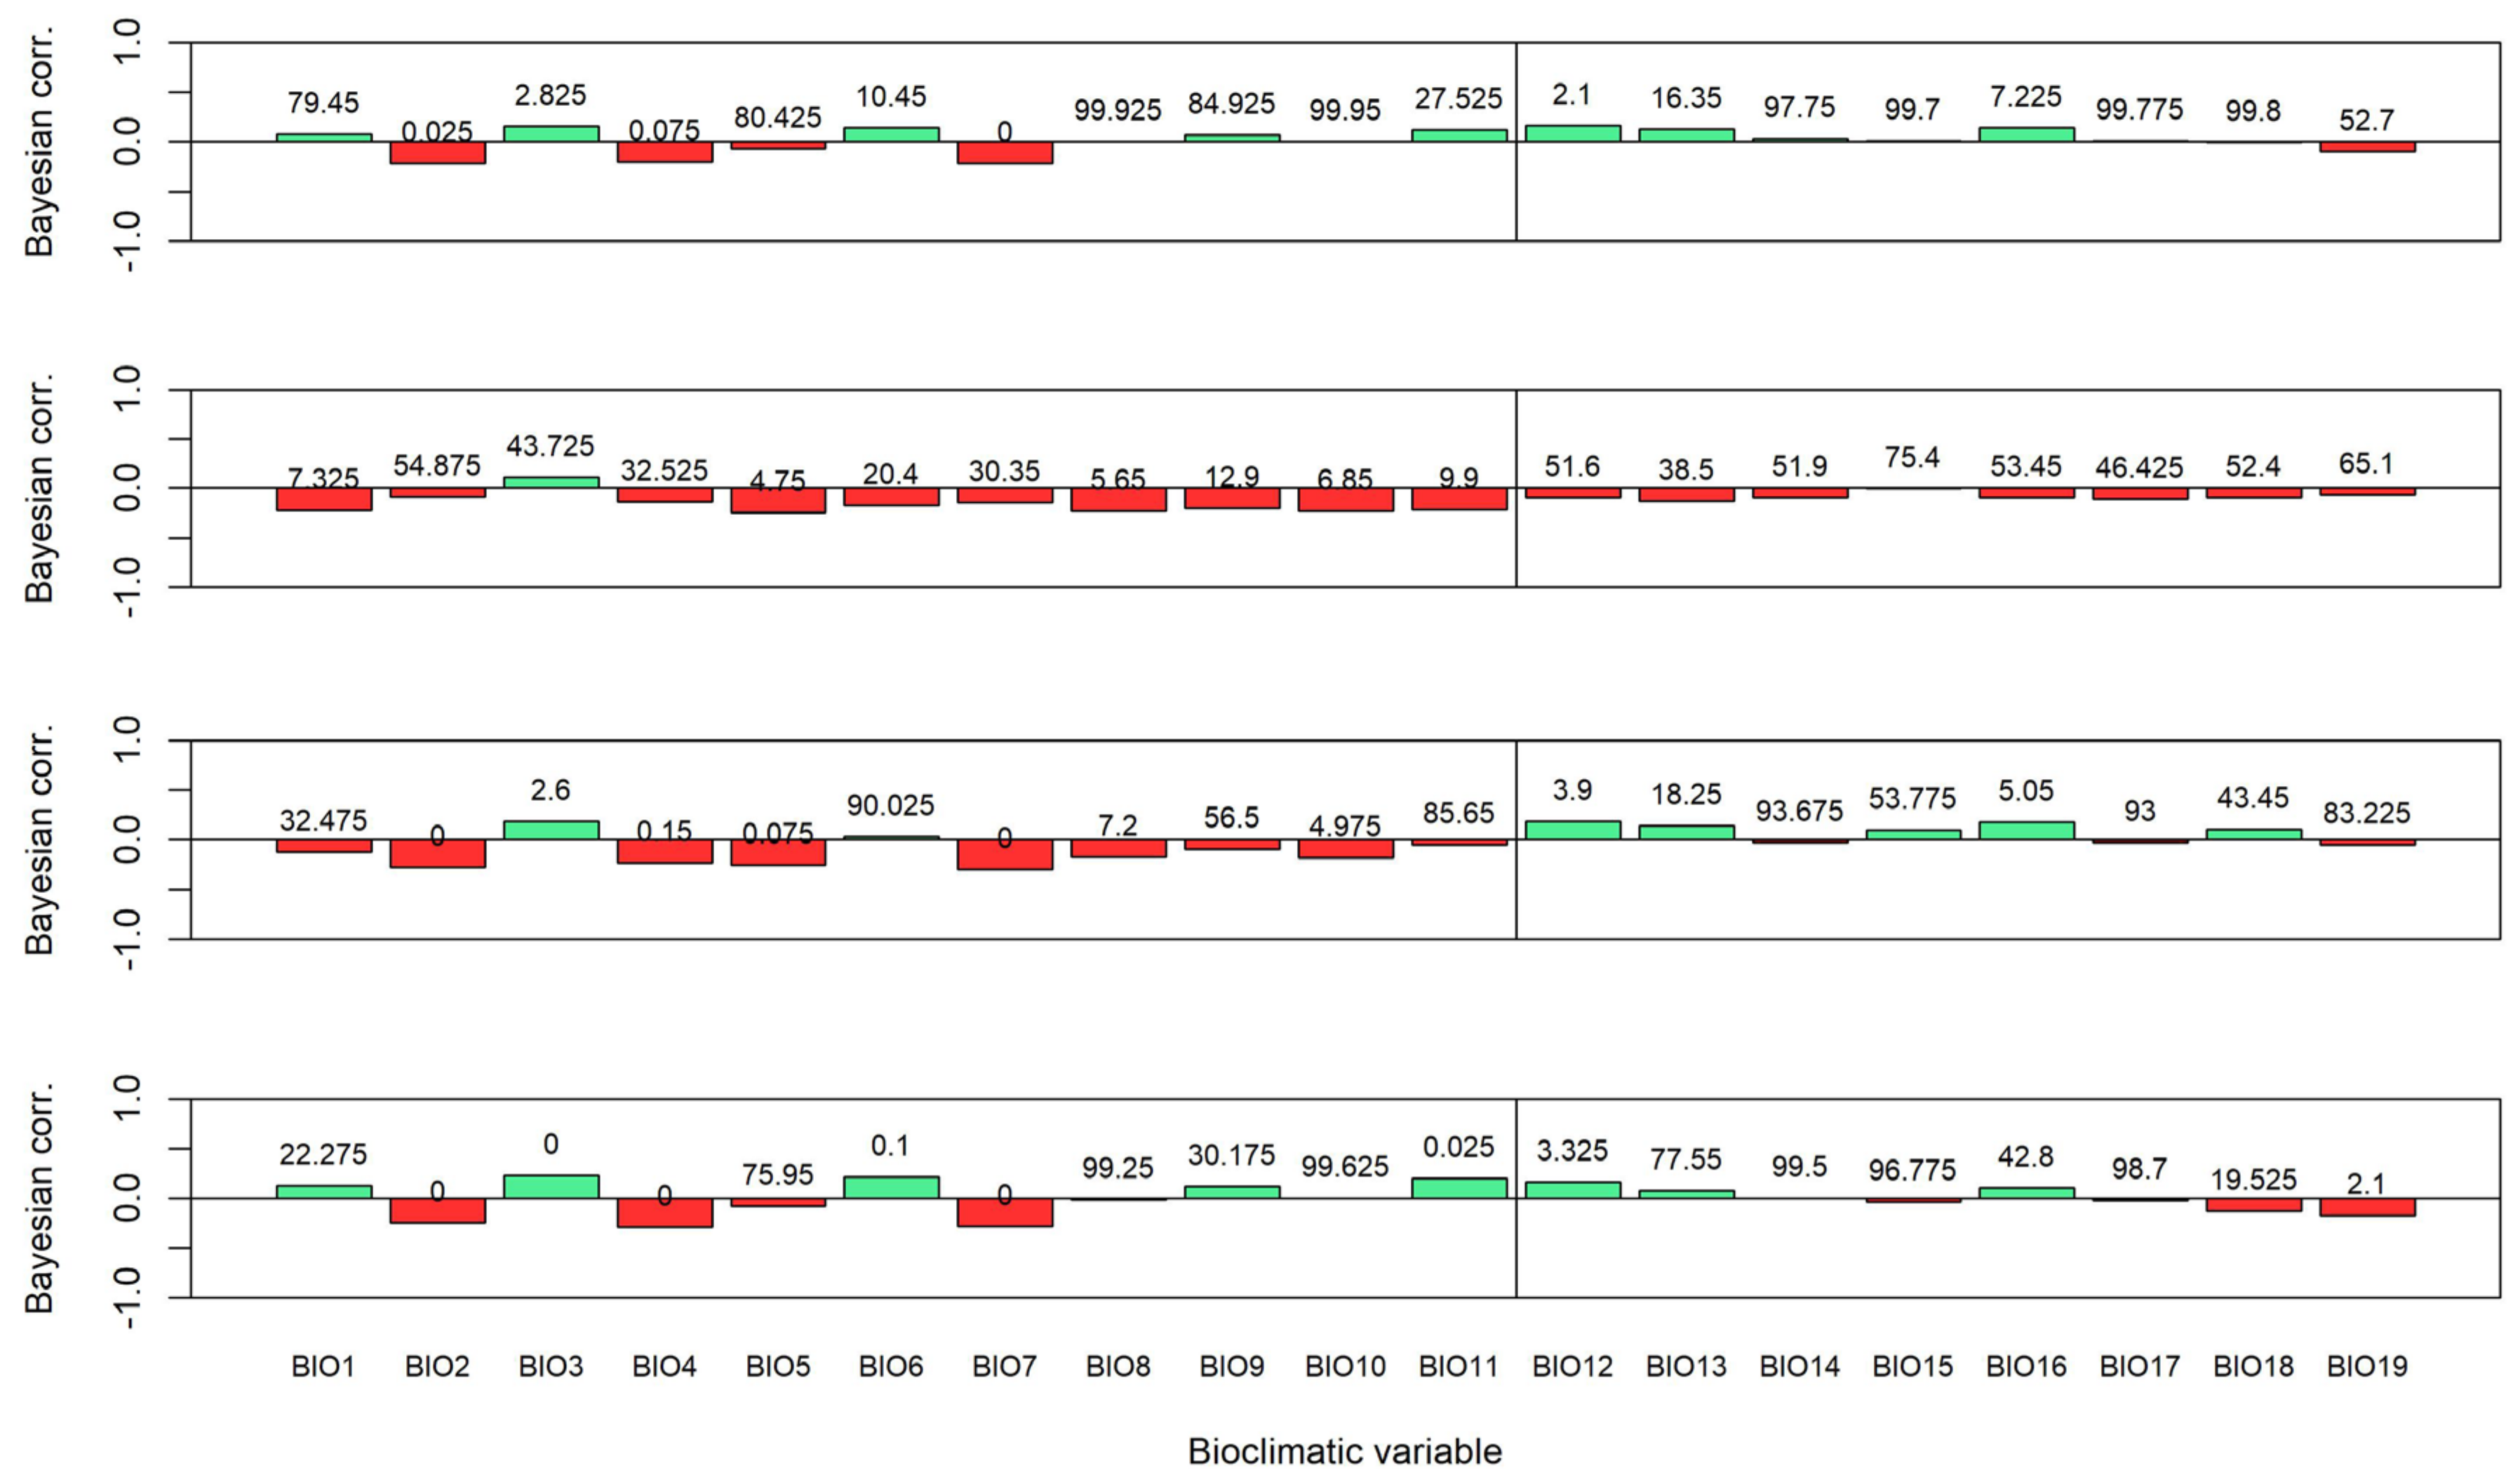
3.3. Influence of Bioclimatic Variables on Aboveground Biomass Density

The analysis revealed the AGBd of six of the ten species (P. arizonica, P. cembroides, P. leiophylla, P. oocarpa, P. pseudostrobus, and P. teocote) studied showed a significant correlation (p < 0.05) with at least one of the bioclimatic variables. Conversely, the AGBd of P. ayacahuite, P. montezumae, P. devoniana, and P. patula did not correlate with any of the 19 bioclimatic variables (Figure 3). The same procedure was performed with the transformed bioclimatic variables [(BIOS)2] to meet a possible inflection point, but the correlation did not improve and followed the same patterns as before.
Out of 54 correlations recorded across the six species, 59.30% (32) were negative with an average of ρ = −0.20, while 40.70% (22) were positive (ρ = 0.18). The strongest negative correlation value, ρ = −0.30, was observed between AGBd and BIO1 in P. arizonica, a similar correlation to that of AGBd and BIO7 in P. pseudostrobus. These negative correlations suggest that an increase in mean annual temperature and its variability in the coming years could lead to a decrease in AGBd in these species.
The highest positive correlation (ρ = 0.24) was observed when relating AGBd to BIO12 in P. leiophylla (Figure 3) (Appendix C). The AGBd of P. cembroides correlated with up to thirteen bioclimatic variables (nine corresponding to temperature and four to precipitation), reflecting its high physiological plasticity, resource use efficiency, and environmental stress tolerance; these characteristics translate into more excellent aboveground biomass production and a broader potential geographic distribution than more specialized species. The AGBd of P. teocote, P. arizonica, and P. pseudostrobus correlated with seven variables, of which 90.47% corresponded to temperature.
Of the 32 negative correlations, 87.5% (twenty-eight) corresponded to variables related to temperature and 12.5% (four) corresponded to variables related to precipitation. Of the 22 positive correlations, 59% (thirteen) corresponded to variables related to temperature, and 41% (nine) corresponded to precipitation. Notably, the AGBd of P. arizonica only displayed negative correlations with variables related to temperature (Figure 3), indicating the sensitivity of this species to high temperatures, adaptation to temperate climates, and limitations in growth and consequently in AGB production.
Moreover, the variables: BIO14 (precipitation of the driest month), BIO15 (seasonality of precipitation), and BIO17 (precipitation of the driest quarter) did not correlate with the AGBd of any of the species studied. These observations indicate that the evaluated pine species possess physiological and ecological strategies that allow them to tolerate and adapt to variable precipitation conditions (Figure 3).
The Bayesian approach to Spearman’s correlation reinforces the results found in the frequentist correlation. Temperature (left, Figure 3) is the main factor driving the variability of AGBd, unlike precipitation (right, Figure 3). The magnitude of the correlation (height of the boxes) is more evident in the temperature BIOS than in the precipitation BIOS. It is confirmed that the correlation of AGBd is negative with temperature and positive with precipitation (Figure 3), although for P. cembroides, P. oocarpa, and P. teocote, the correlation is both positive and negative.
According to the Bayes factor (BF > 1, Table 3), statistical significance (“*”, Table 3), and the proportion within the Region of Practical Equivalence (ROPE, indicated above the boxes in Figure 4), the AGBd of P. cembroides exhibits the highest sensitivity to climatic factors, followed by P. teocote, P. pseudostrobus, and P. oocarpa. This observation is corroborated by frequentist correlation analysis. In contrast, the AGBd of P. ayacahuite and P. devoniana shows no significant response to bioclimatic variables. Variables BIO 5, 10, and 11 exert the greatest influence on AGBd variation across the ten studied conifer species, whereas BIO 14, 15, and 17 (representing drier months) exert minimal influence.

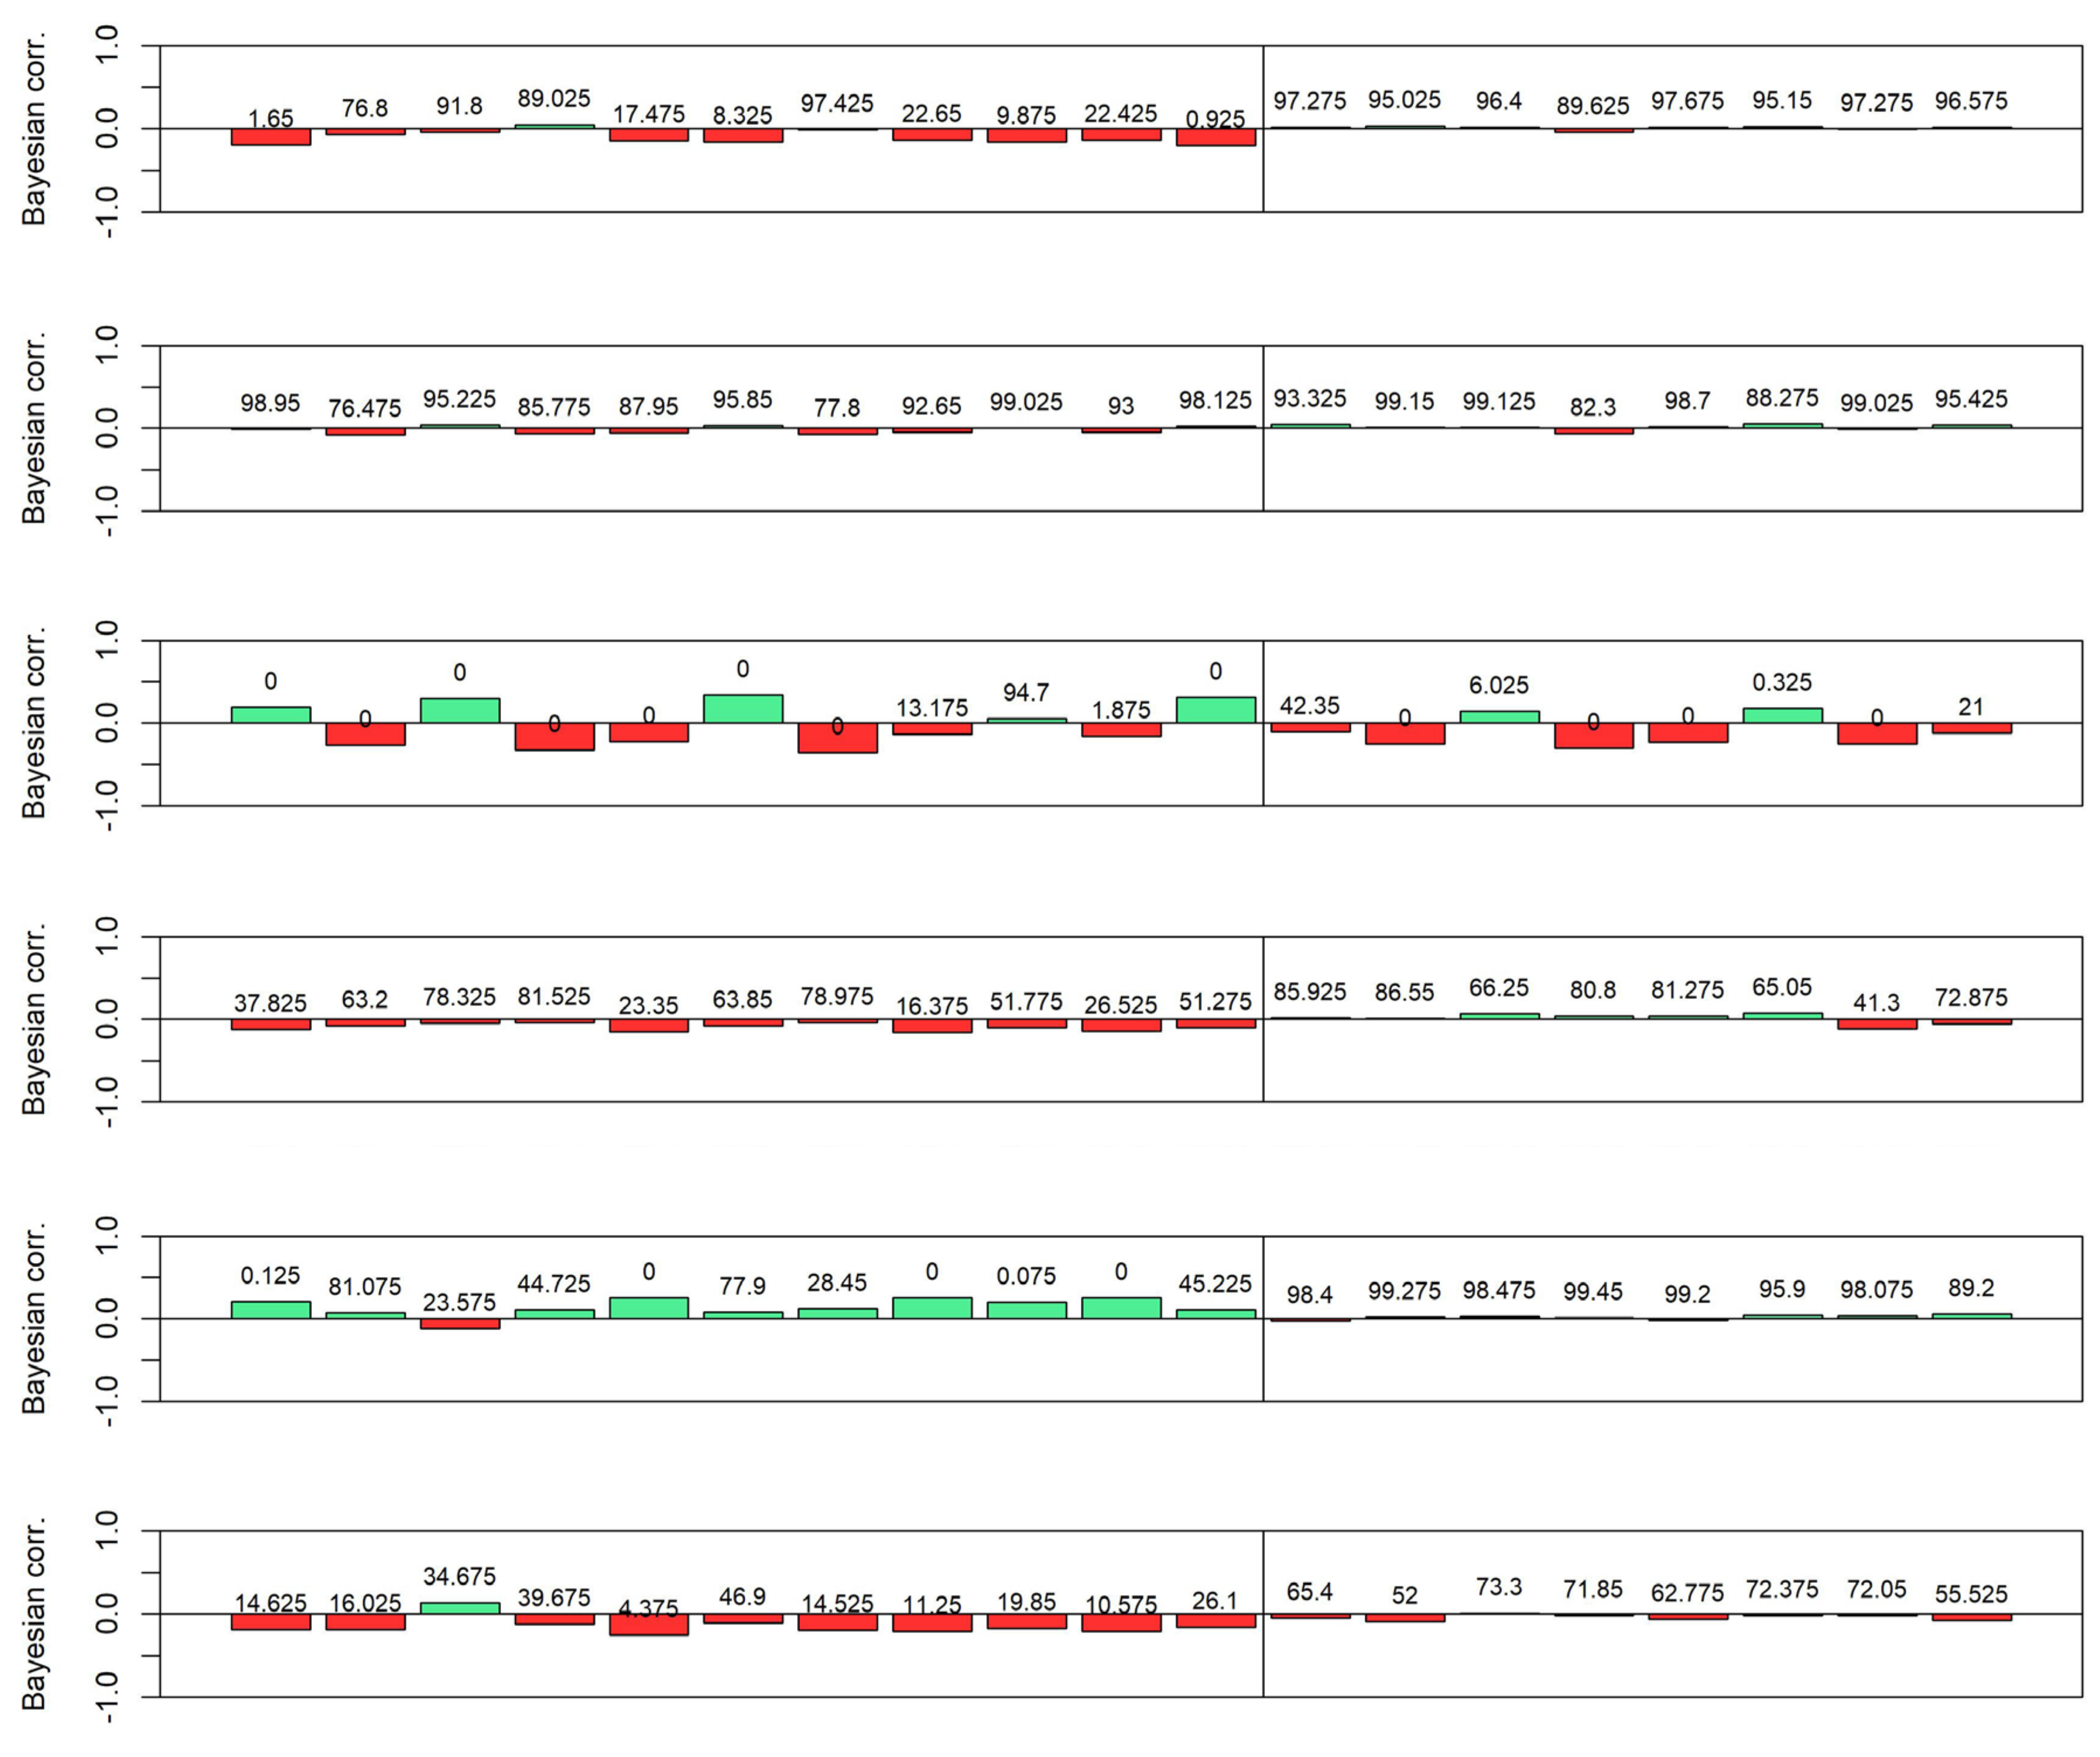
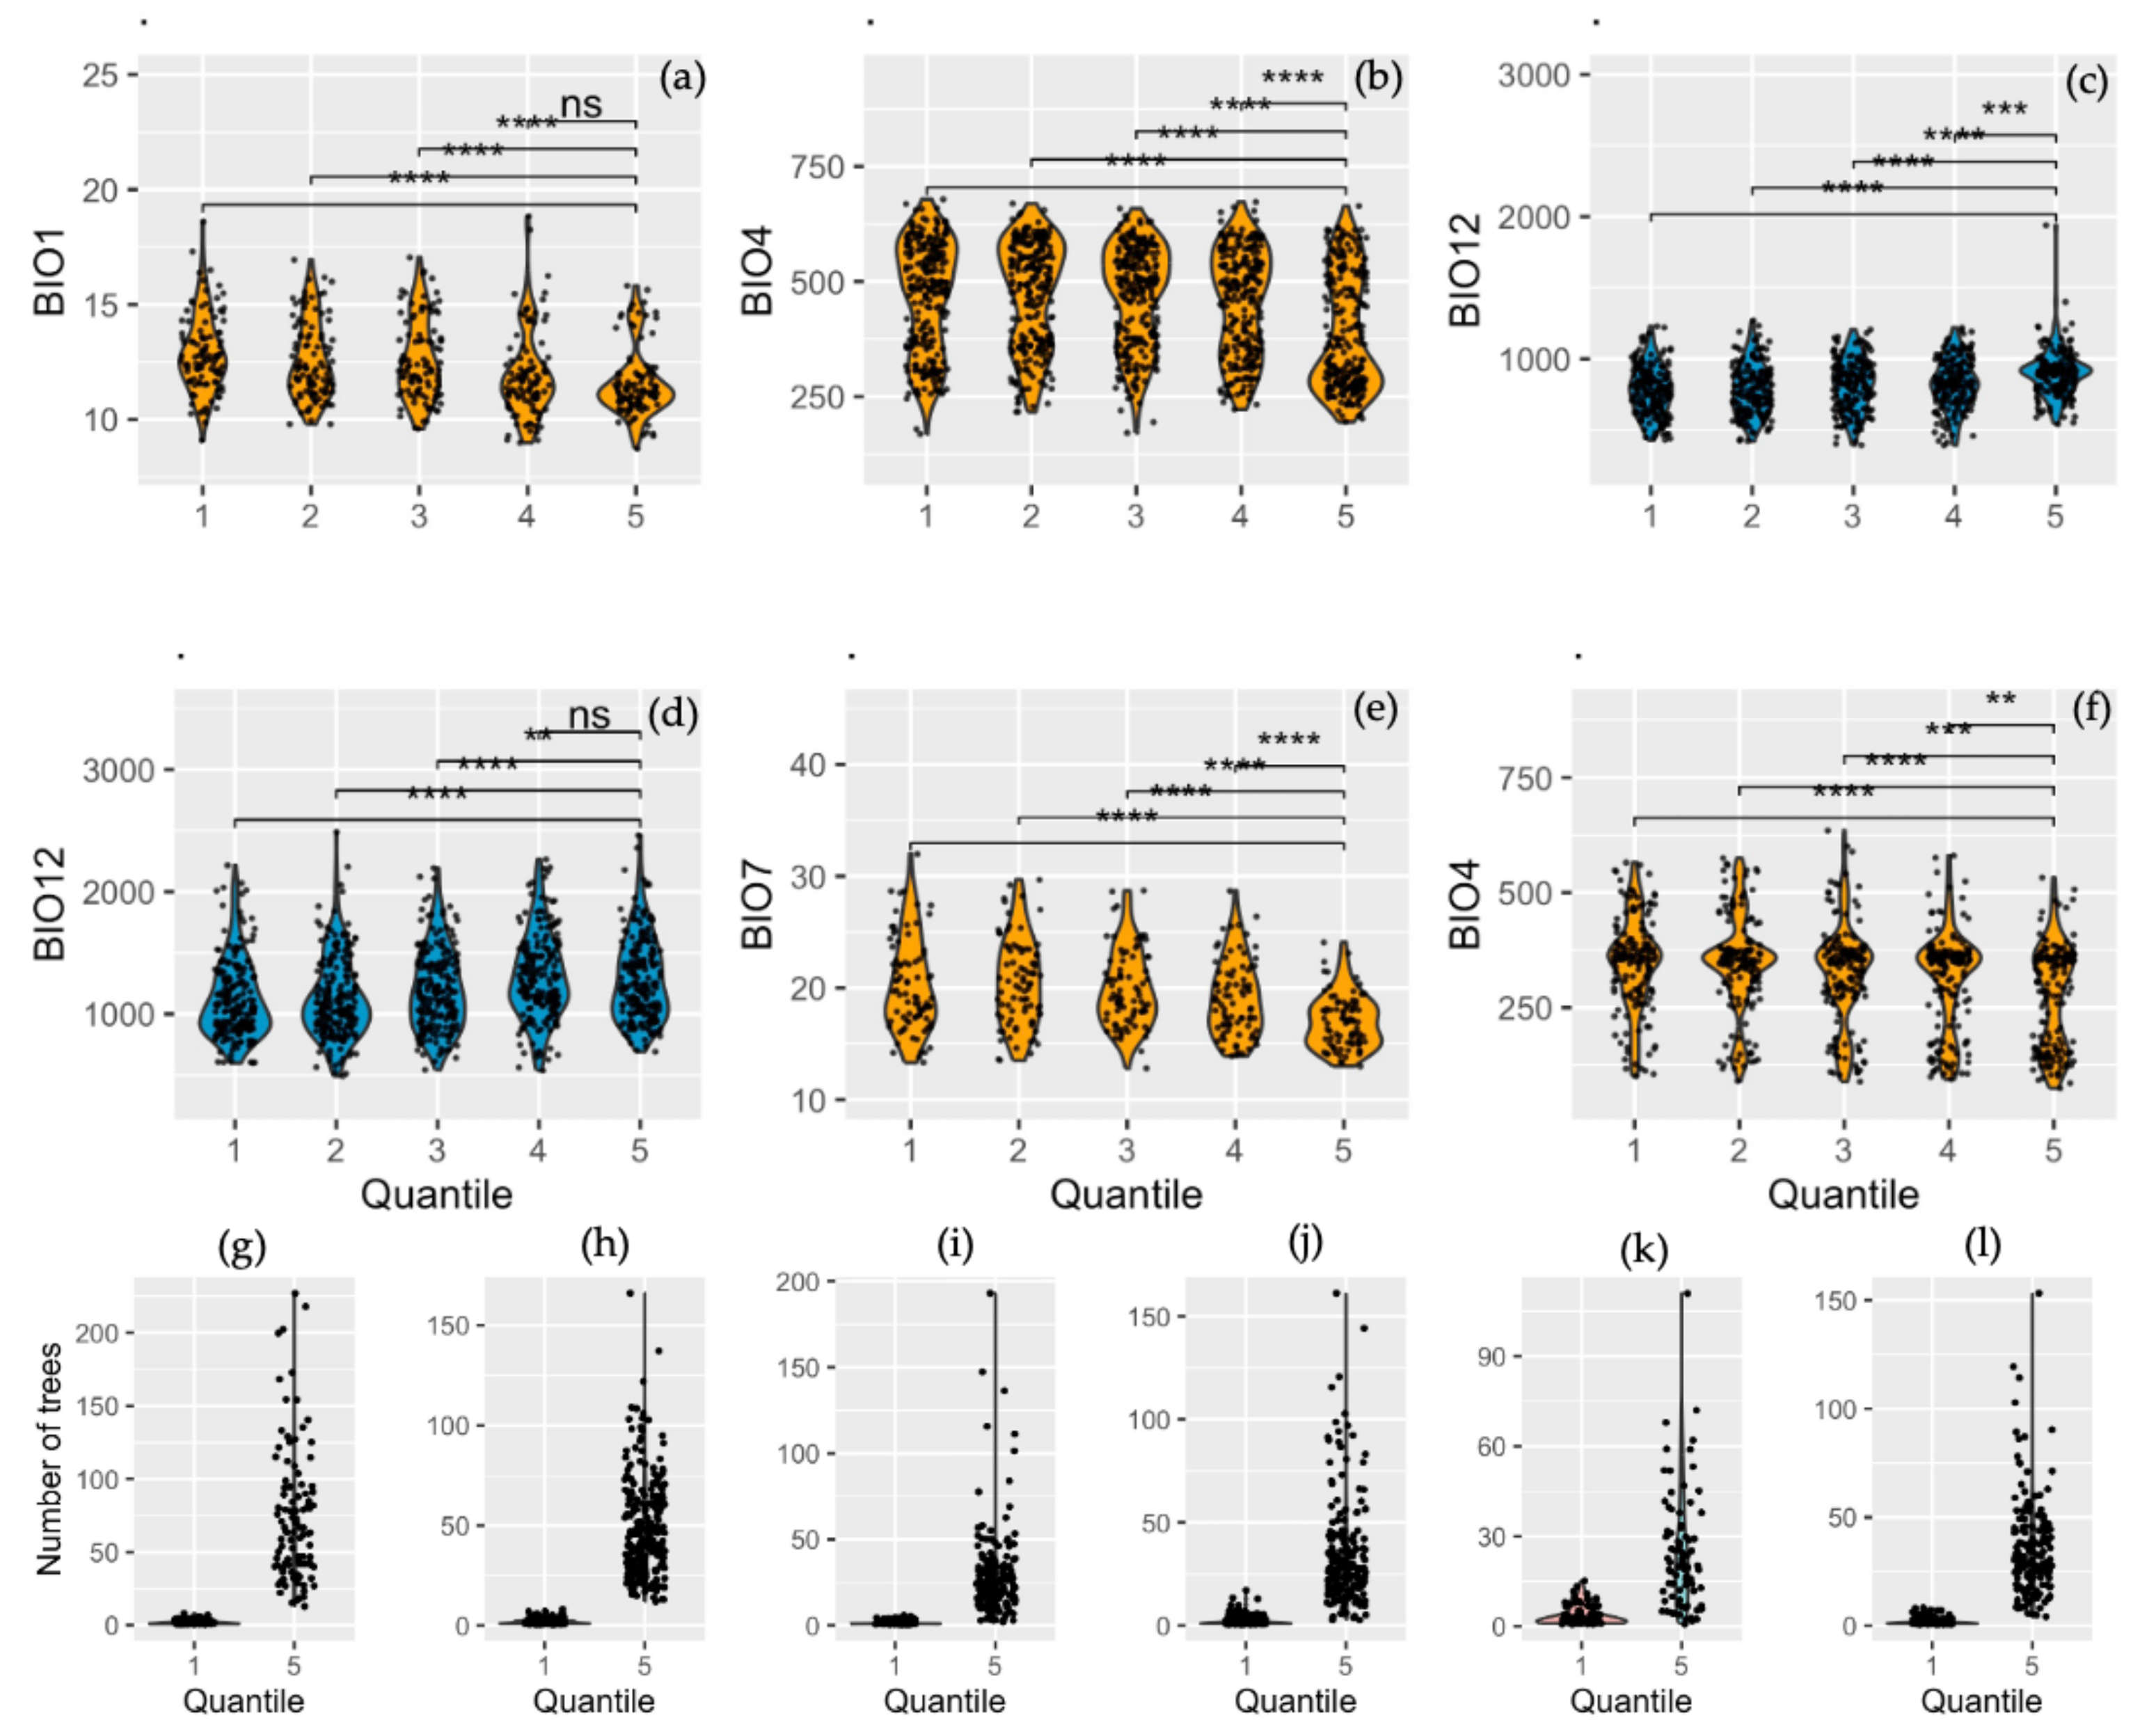
3.4. Quantile-Based Analysis of AGBd Response to Climate Variables

The Mann–Whitney U test results revealed highly significant differences (p < 0.001) in the values of the bioclimatic variables (with the strongest correlation between sites) within quantiles five and those in quantiles 1, 2, 3, and 4 under the following hypothesis: the medians of both groups are different. Specifically, AGBd stores were inversely influenced by temperature (as indicated by the orange violins in Figure 5a,b,e,f). For example, in Pari, the mean BIO1 in quantile 1 was 12.86 °C and 11.57 °C in quantile 5 (Appendix B). The opposite is true of the AGBd and precipitation relationship (blue violins, Figure 5c,d); there was higher AGBd accumulation with higher annual rainfall regimes in BIO12 (Appendix C). In addition, the number of trees significantly influences the amount of AGBd (Figure 5g–l).
The bioclimatic conditions (low temperature) in the quantile 5 sites are different and potentially more favorable for the accumulation of AGBd than in the other quantiles; this shows that high temperatures inhibit the production of AGB. Similarly, the higher precipitation in quantile 5 suggests the availability of the necessary moisture for photosynthesis and growth, thereby favoring biomass accumulation in these species. This observation aligns with the positive relationship observed between AGBd and precipitation. Additionally, the research found a direct correlation between the number of trees and AGBd accumulation (Figure 5g–l), further emphasizing the role of vegetation in AGBd storage.

4. Discussion

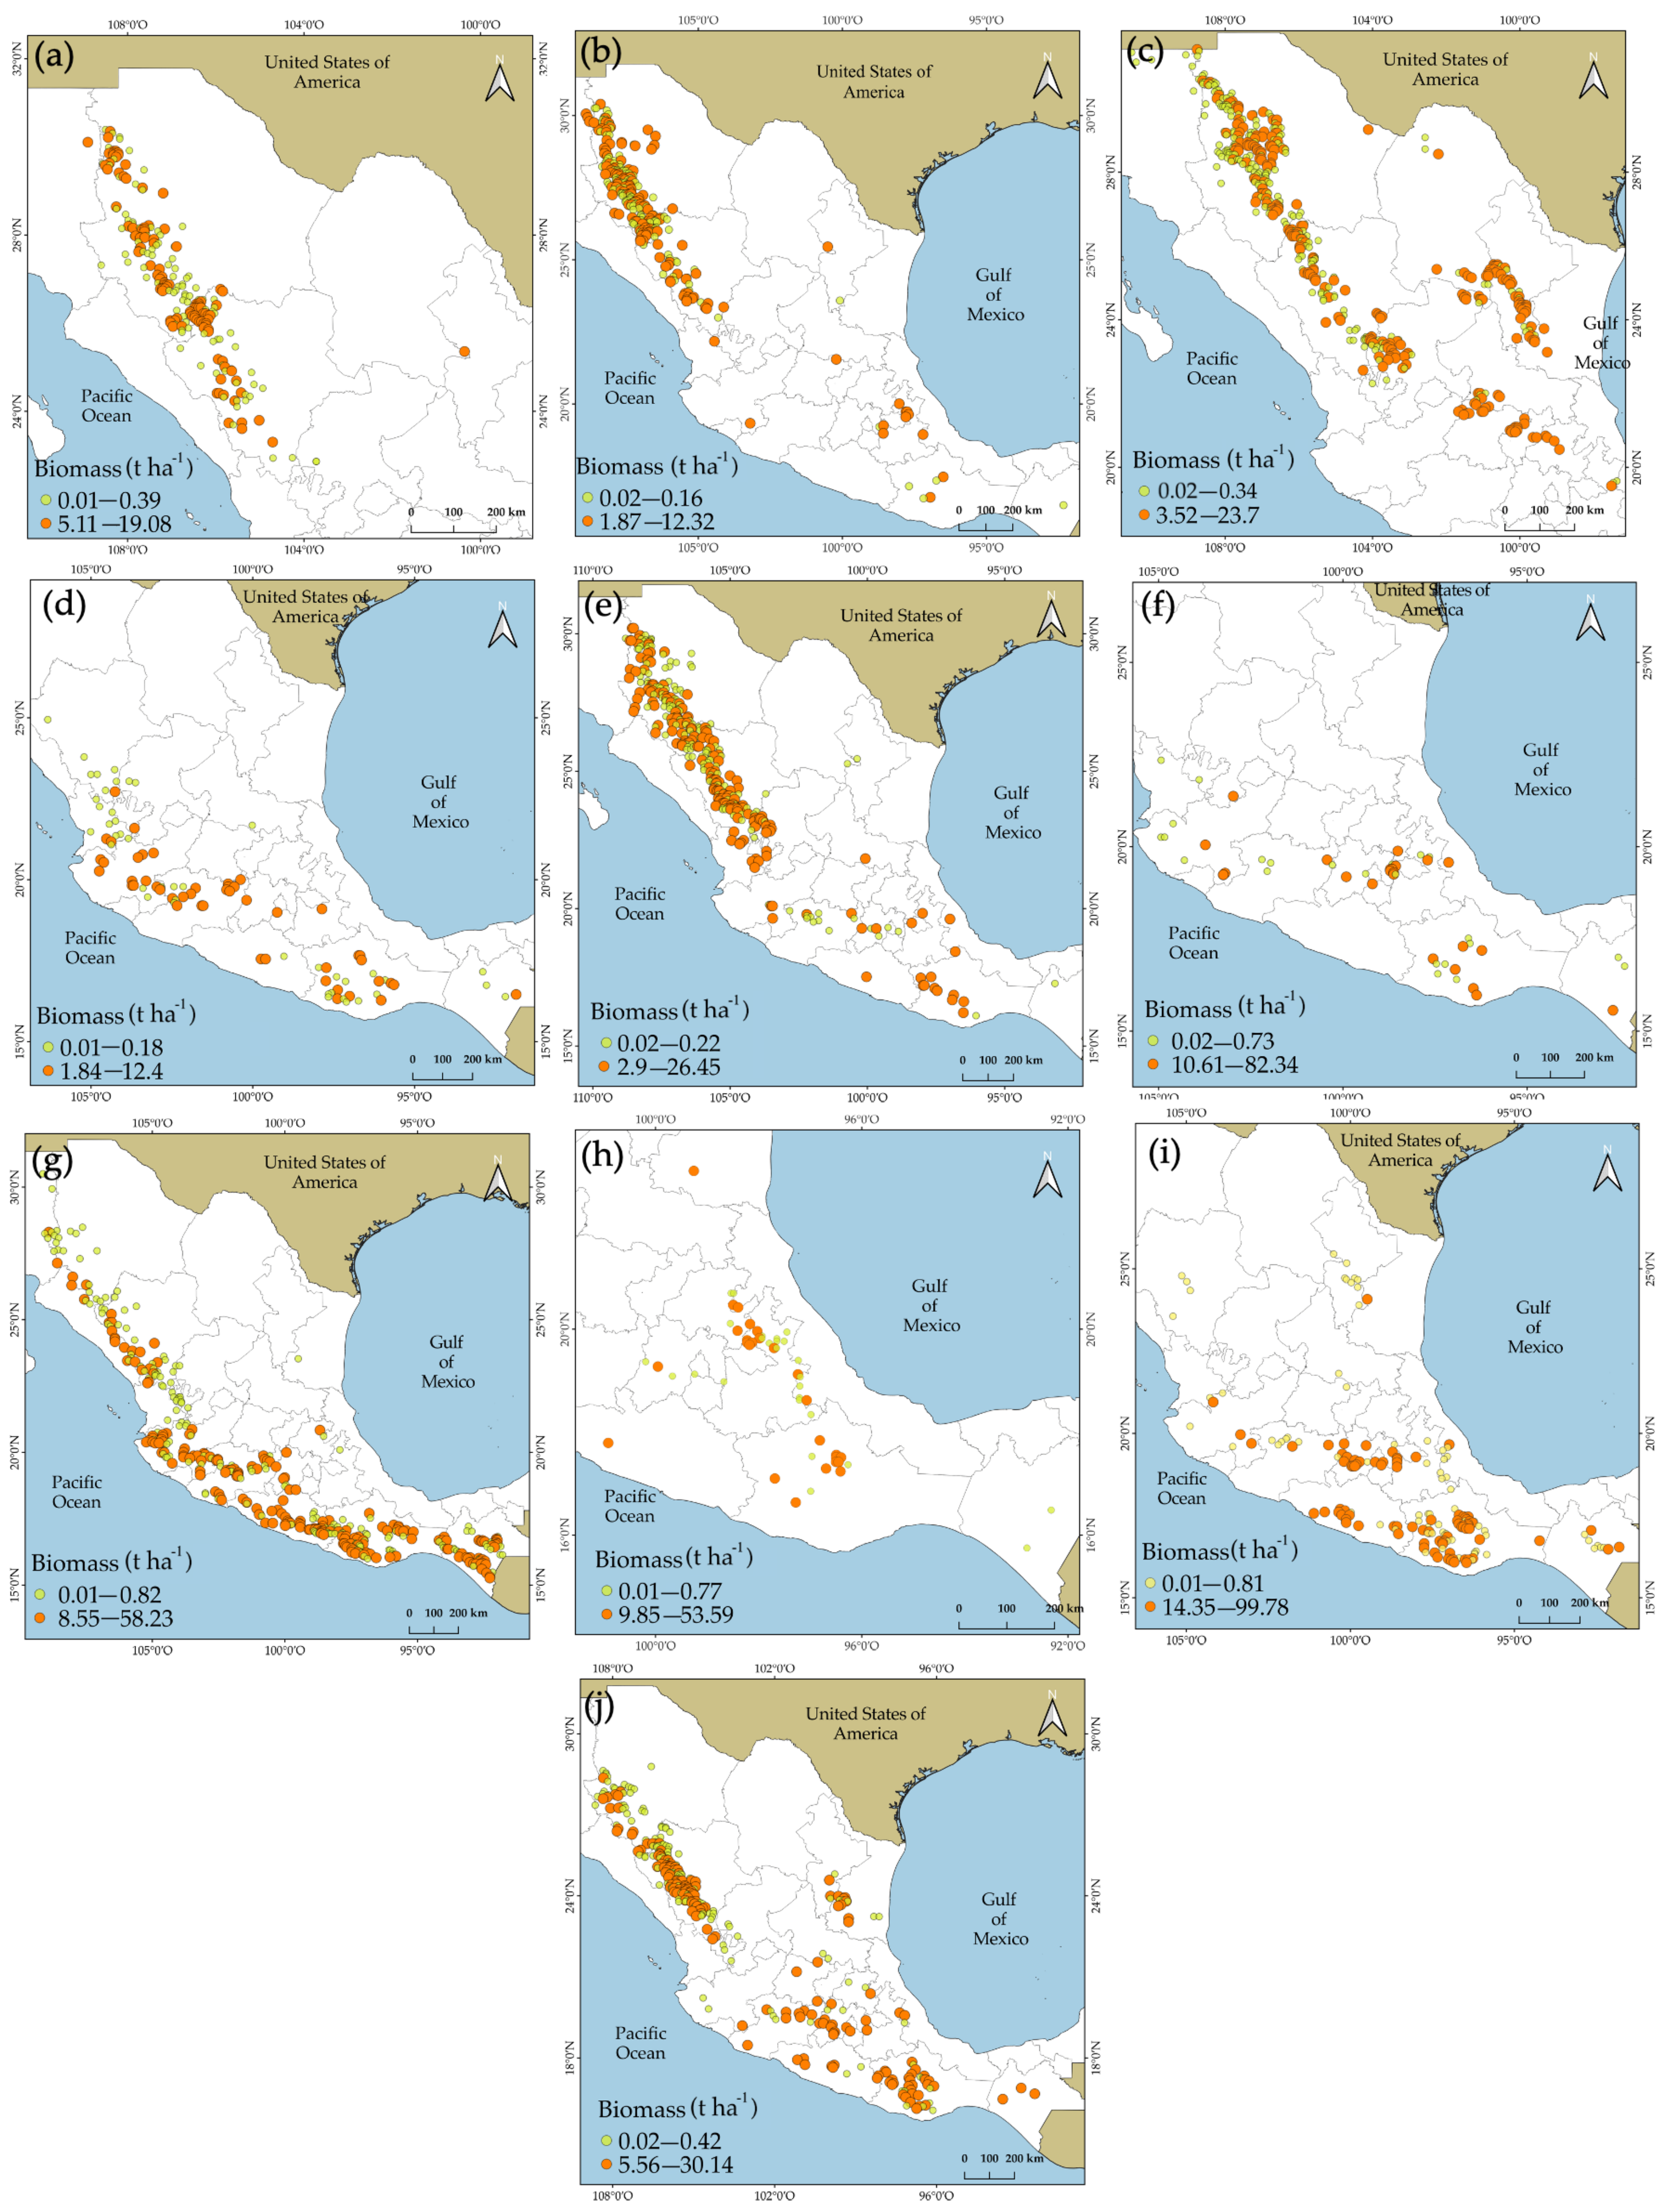
Biomass Distribution

The geographical distribution of AGBd in the present study did not reveal any pattern associated with a specific region in any of the ten species studied, suggesting that the influence of environmental (temperature and precipitation), edaphic (soil structure and pH), topographic (altitude), and biotic (species diversity and forest structure) conditions at the regional level interact and regulate forest dynamics, as already found [12,22,60] in tropical, boreal and temperate forests. The influence of climatic factors such as temperature and precipitation on vegetation is indirect but essential, as it interferes with trees’ metabolic and growth processes, regulating their AGB productivity [12,21,23] and even their geographical distribution [62,63]. In this regard, we agree with the findings of [64], where the lack of a directional trend in the abundance patterns of pines in Mexico reflects a complex mix of forest relationships that different disturbances locally drive.
In the present study, the temperature variable showed more correlations with AGBd (76%), indicating that temperature is the most influential variable in the dynamics of AGBd in the pine species studied; this is contrary to tropical species, where precipitation is the determining factor [65]. On a global scale, it was observed [66] that the biomass of mature forests is greater in mid-latitudes; this relationship is positive when the temperature is below 8 °C, but begins to decline as temperatures exceed 10 °C and approach the equator. Several studies have addressed the relationship between AGB and BIO1 [12,15,22,67,68], but the evidence reveals that these relationships are complex and dependent on many factors, including forest type, scale, geography, species, and others.
Some studies have reported that BIO1 can positively influence pine growth rates. For example, an increase in temperature within the optimal growth range can accelerate photosynthetic processes and evapotranspiration, leading to more significant growth and, consequently, an increase in biomass [23,67,68,69,70]. In the present study, a positive association was found in P. oocarpa, which is a species widely distributed in the subtropical forests of Mexico, where tree density is higher and its temperature tolerance range is better suited to high temperatures (Figure 1). Also observed in forests of Iran [69] found that biomass is influenced by BIO1, specifically in taller trees, trees with larger crowns, and higher DBH values.
Furthermore, in a global study [23] found a strong positive correlation between AGB and BIO1 (r = 0.262, p < 0.01). Similarly, in plantations [71] reported that the biomass growth rates of Pinus massoniana Lamb, in populations distributed in China, responded positively to BIO1. This is important, as it suggests that temperature, particularly BIO1, plays a crucial role in the growth of pine species. However, it is worth noting that cold and humid winters also favor the growth of this species [72], a tendency consistent with the pine species studied in our research (Figure 4).
On the other hand, researchers have determined that extreme temperature variables (minimum and maximum) are ‘limiting’ as they interfere with biomass productivity by influencing tree growth [22]. Studies have observed that maximum temperatures negatively influence the growth of young Pinus cooperi Blanco ex Martinez [73], showing a significant negative correlation (r = −0.31, p < 0.05). Other authors [74] reported that maximum temperatures influence the growth in P. oocarpa (r = −0.7), while [72] again report a negative correlation (p < 0.05) with P. leiophylla (−0.39) and P. teocote (−0.39). These findings align with the present study, where we observed a negative correlation between AGBd and BIO5 in P. arizonica, P. cembroides, P. leiophylla, and P. pseudostrobus (Figure 3).
In the present study, it was observed that BIO2, BIO4, and BIO7 showed negative correlations with the AGBd of the species P. cembroides, P. oocarpa, P. leiophylla, P. pseudostrobus, and P. teocote, demonstrating that temperature variations significantly influence tree growth and, consequently, AGB productivity. The authors [75] identified, in a pantropical study, that tree height decreases with temperature seasonality. Similarly, in a study [76] documented a reduction in tree height correlated with increasing temperatures across three forest types in Madagascar. This occurs because, when significant thermal oscillations are present during the growth period, pine species tend to reduce the duration of their growing seasons and have slower metabolic processes [8,77], highlighting the importance of using these variables in determining the presence of these species in the future, as mentioned in [77]. They reported that 72% of the species present in tropical forests in Bolivia are highly sensitive to temperature variation, concluding that even a minimal change of less than 4 °C could drastically modify distribution patterns and, in turn, affect AGB productivity in tropical species. It has also been observed that in temperate forests, an increase of 2.5 °C can modify biomass distribution in the tree [78].
In the current study, robust correlations were identified between AGBd and precipitation variables (e.g., BIO12) across select species (Table 3). This was also observed by [79], in their continental-scale analysis, noted indistinct direct relationships between AGB and BIO12 at the ecosystem level. We posit that this discrepancy is attributable to the scale of the study, as these correlations are more pronounced at local scales and even at the species level. In subtropical ecosystems in China, the authors [80] reported that BIO12 governs biomass allocation, which is contingent upon precipitation gradients. We advocate for further investigation at multiple scales and species-specific levels to enhance understanding of climate influences on forest productivity.
Conifer forests are in areas with abundant moisture and temperate climates, where trees allocate more aboveground biomass, which promotes rapid growth [81]. In the present study, it was observed that the AGBd of P. leiophylla, P. oocarpa, P. pseudostrobus, and P. teocote showed positive correlation values with BIO12 (Figure 3), suggesting that this variable has a positive association with biomass productivity in these pine species. This is consistent with studies on tropical forests in China [81], rainfall gradient experiments across the United States [82], and Borneo forests [65], all of which found that BIO12 favors tree growth and biotic attributes involved in AGB productivity.
For their part, the authors of [17] reported that precipitation positively affects biomass in Mexico, and this relationship is more significant compared to temperature variables estimated in coniferous forests. Our study also observed this positive relationship with BIO12 in P. leiophylla, P. oocarpa, P. pseudostrobus, and P. teocote. They explained that this relationship might be due to the dominance of the genus Abies, Pseudotsuga, and Picea in coniferous forests, which are distributed in high mountains and receive more precipitation. However, we excluded these species from our study, yet we still observed positive correlations with BIO12 within a precipitation range of 542–2462 mm (Appendix C) in the sites with the highest AGBd.
In previous studies worldwide, a meta-analysis [83] reported that the biomass of some tree species under high temperature conditions was not shown to be influenced by annual precipitation, suggesting that precipitation patterns should be better studied in these species. Periods of precipitation play an important role in forests, as low variability in precipitation has been found to promote large biomass reserves in the forest biomass of the Amazon [84], completely consistent with what was found in this study.
According to [85], global temperature increase trends will remain around 1.5 °C in low scenarios (SSPI-1.9), increasing extreme weather events, which is of great concern. Researchers have found that changes in climatic conditions affect the growth rates and AGB in temperate forests [86]. For example, the authors of [87] reported that there is a strong relationship between tree mortality in nine biome types and climatic anomalies (prolonged droughts and exacerbated high temperatures), as tree mortality increased when climatic factors (BIO1 and BIO12) were exacerbated. They also projected that under climate scenarios that contemplate an increase of +2 °C and +4 °C, the frequencies of climate anomalies related to tree mortality would increase by 22% and 140% per year and decade, respectively.
In México, the authors of [88] reported that the effects of climate change are inconsistent in regions converging in Mexico, where a greater impact is predicted in some regions, such as the eastern Sierra Madre (the region with the world’s richest coniferous tree forests). However, it is important to take into account local conditions and seasonal variations in temperature and precipitation [88,89], as the responses to forest microclimates contrast with those of external ecosystems. This suggests that many studies based on BIO1 do not explain much of the global variation in AGB.
Although for Mexico, studies have been carried out analyzing the potential distribution under future scenarios for at least 20 pine species [26,65,66,90], studies aimed at determining how the productivity of AGBd could be visualized in future scenarios have not yet been explored in Mexico. Thus, studies such as the present one, which prioritize the behavior of these populations through another point of analysis (in this case, AGBd), would help in carrying out conservation and management projects that are well-directed toward species that show disadvantages compared to those that benefit from the effects of climate change.

5. Conclusions

The present study provides significant insights into the geographic distribution of AGBd. No clear geographic pattern of AGBd was observed, indicating complex interactions between bioclimatic variables and each species. Several statistically significant correlations (p < 0.05) were observed with temperature variables and AGBd, suggesting that they play a role in determining the distribution and productivity of these species. In addition, both mean annual temperature and temperature extremes have important effects on tree AGBd, with specific responses depending on the species. Precipitation is positively associated with AGBd in 66% of the species studied. The variables BIO14 (precipitation of the driest month), BIO15 (precipitation seasonality), and BIO17 (precipitation of the driest quarter) do not correlate with AGBd.
Finally, projected temperature increases in the region highlight the importance of future studies exploring how these pine populations will respond to climate change, emphasizing effective communication, adaptive conservation, and sustainable management strategies. Therefore, selecting pine species whose biomass production shows less dependence on specific climatic factors can enhance their ability to thrive amidst climate variability and change. This approach leverages their inherent adaptive capacity and ecological plasticity, providing a more robust strategy for sustainable forestry management in a changing climate context.
With regard to applicability, it is important not only to estimate the carbon stocks of aboveground biomass but also to highlight the production potential of some forest areas in Mexico. In conclusion, climate is an important driver of aboveground biomass density variation in the majority of the species studied.

Supplementary Materials

The following supporting information can be downloaded at https://www.mdpi.com/article/10.3390/f15071160/s1: Table S1: General description of the selected species for the study where; T: range of temperature, °C; PP: range of precipitation annual, mm; N: number of trees; N.sites: number of sites whit register of specie.

Author Contributions

Conceptualization, D.G.-G., J.M.-G., T.G.O.-S., J.C.-P., J.C.S.-C., and V.H.C.-S.; Data curation, D.G.-G. and J.M.-G.; Investigation, D.G.-G. and T.G.O.-S.; Methodology, D.G.-G. and J.M.-G.; Software, D.G.-G. and J.M.-G.; Supervision, T.G.O.-S., J.C.-P., J.C.S.-C., and V.H.C.-S.; Visualization, T.G.O.-S., J.C.-P., J.C.S.-C., and V.H.C.-S.; Writing—original draft, D.G.-G., J.M.-G., and V.H.C.-S.; Writing—review and editing, D.G.-G., J.M.-G., J.C.-P., and V.H.C.-S. All authors have read and agreed to the published version of the manuscript.

Funding

This research received no external funding.

Data Availability Statement

The data presented in this study are available upon reasonable request from the author team.

Acknowledgments

We are grateful to National Council of Humanities, Sciences and Technologies (CONAHCYT) for funding the first author’s doctorate.

Conflicts of Interest

The authors declare no conflicts of interest.

Appendix A

Bioclimatic variables used for correlation analysis with a spatial resolution of 30 s (~1 km2), obtained using Worldclim version 2.
Variable CodeDescription
BIO1Annual Mean Temperature (°C)
BIO2Mean Diurnal Range (Mean of Monthly (°C)
BIO3Isothermality (BIO2/BIO7) (×100)
BIO4Temperature Seasonality (SD ×100)
BIO5Max Temperature of Warmest Month (°C)
BIO6Min Temperature of Coldest Month (°C)
BIO7Temperature Annual Range (BIO5-BIO6)
BIO8Mean Temperature of Wettest Quarter (°C)
BIO9Mean Temperature of Driest Quarter (°C)
BIO10Mean Temperature of Warmest Quarter (°C)
BIO11Mean Temperature of Coldest Quarter (°C)
BIO12Annual Precipitation (mm)
BIO13Precipitation of Wettest Month (mm)
BIO14Precipitation of Driest Month (mm)
BIO15Precipitation Seasonality (Coefficient of Variation)
BIO16Precipitation of Wettest Quarter (mm)
BIO17Precipitation of Driest Quarter (mm)
BIO18Precipitation of Warmest Quarter (mm)
BIO19Precipitation of Coldest Quarter (mm)

Appendix B

Results of the correlations between biomass and the 19 bioclimatic variables in the species that showed correlation.
SpecieBioclimatic VariableRhoSpecieBioclimatic VariableRho
P. arizonica P. oocarpaBIO10.11 *
BIO1−0.3 ***BIO2−0.22 ***
BIO5−0.21 ***BIO30.16 ***
BIO6−0.27 ***BIO4−0.19 ***
BIO8−0.21 ***BIO60.16 ***
BIO9−0.23 ***BIO7−0.22 ***
BIO10−0.21 ***BIO90.11 *
BIO11−0.25 ***BIO110.14 ***
BIO120.22 ***
BIO130.18 ***
BIO160.21 ***
P. cembroidesBIO2−0.15 ***P. pseudostrobus
BIO30.19 ***BIO2−0.27 ***
BIO4−0.23 ***BIO30.19 **
BIO5−0.16 ***BIO4−0.24 ***
BIO60.18 ***BIO5−0.17 *
BIO7−0.22 ***BIO7−0.3 ***
BIO8−0.12 ***BIO120.22 ***
BIO10−0.13 ***BIO160.2 ***
BIO110.18 ***
BIO13−0.15 ***
BIO16−0.13 ***
P. leiophyllaBIO18−0.15 ***P. teocote
BIO19−0.14 ***
BIO30.22 ***
BIO4−0.20 ***BIO2−0.12 *
BIO5−0.18 ***BIO30.21 ***
BIO7−0.18 ***BIO4−0.22 ***
BIO8−0.15 ***BIO7−0.19 ***
BIO10−0.16 ***BIO110.13 **
BIO120.24 ***BIO120.14 **
BIO130.18 ***
BIO160.21 ***
Note: Significance of Spearman’s correlation; * p < 0.05, ** p < 0.01, *** p < 0.001.

Appendix C

Descriptive analysis by quantile of the bioclimatic variables that obtained the highest correlation values with aboveground biomass density in Pinus arizonica, Pinus cembroides, Pinus oocarpa, Pinus leiophylla, and Pinus teocote. BIO1: annual mean temperature (°C); BIO4: temperature seasonality (standard deviation × 100); BIO7: temperature annual range (BIO5–BIO6); BIO12: annual precipitation (mm).
QUANTILE 1
P. arizonicaP. cembroidesP. leiophyllaP. oocarpaP. pseudostrubusP. teocote
Bioclimatic variableBIO1BIO4BIO12BIO12BIO7BIO4
Min9.10168.80431.00600.0013.30101.19
Max18.60678.781230.002216.0032.00564.99
Mean12.86458.46778.011121.3520.22347.51
Mediana12.67490.94774.001050.5019.20358.27
SD1.67120.52171.03317.934.1099.50
QUANTILE 2
P. arizonicaP. cembroidesP. leiophyllaP. oocarpaP. pseudostrubusP. teocote
Bioclimatic variableBIO1BIO4BIO12BIO12BIO7BIO4
Min9.80216.53422.00494.0013.5090.44
Max16.95669.431269.002490.0029.70575.05
Mean12.55472.08784.341130.0520.55345.69
Mediana12.20496.24771.001062.0020.40354.40
SD1.66114.29176.30331.833.85104.14
QUANTILE 3
P. arizonicaP. cembroidesP. leiophyllaP. oocarpaP. pseudostrubusP. teocote
Bioclimatic variableBIO1BIO4BIO12BIO12BIO7BIO4
Min9.60170.86394.00544.0012.8089.06
Max17.05658.561206.002195.0028.70634.82
Mean12.50468.18814.921195.2419.86323.20
Mediana12.17494.95829.001165.0019.10347.05
SD1.72108.17178.56329.963.37106.57
QUANTILE 4
P. arizonicaP. cembroidesP. leiophyllaP. oocarpaP. pseudostrubusP. teocote
Bioclimatic variableBIO1BIO4BIO12BIO12BIO7BIO4
Min8.99222.35394.00538.0013.9094.44
Max18.84672.841219.002265.0028.70579.92
Mean11.93454.05830.281300.0019.06311.09
Mediana11.65476.88828.001273.0018.70349.60
SD1.84113.42171.85344.913.35106.51
QUANTILE 5
P. arizonicaP. cembroidesP. leiophyllaP. oocarpaP. pseudostrubusP. teocote
Bioclimatic variableBIO1BIO4BIO12BIO12BIO7BIO4
Min8.74195.01542.00692.0013.0074.84
Max15.82664.211940.002462.0024.10532.58
Mean11.57387.17898.221288.2716.97272.41
Mediana11.23350.06904.501235.0016.90303.20
SD1.47124.36162.16338.902.36110.99

References

  1. SEMARNAT. Anuario Estadístico de la Producción Forestal 2017–2018; SEMARNAT: Mexico City, Mexico, 2021. [Google Scholar]
  2. Galicia, L.; Chávez-Vergara, B.M.; Kolb, M.; Jasso-Flores, R.I.; Rodríguez-Bustos, L.A.; Solís, L.E.; de la Cruz, V.G.; Pérez-Campuzano, E.; Villanueva, Y.A. Perspectives of the socioecological approach in the preservation, utilization and the payment of environmental services of the temperate forests of Mexico. Madera Bosques 2018, 24, e2421443. [Google Scholar] [CrossRef]
  3. Perry, J. The Pines of Mexico and Central America; Timber Press: Portland, OR, USA, 1991. [Google Scholar]
  4. Sánchez-González, A. Una visión actual de la diversidad y distribución actual de los pinos de México. Madera Bosques 2008, 14, 107–120. [Google Scholar] [CrossRef]
  5. Pan, Y.; Birdsey, R.A.; Phillips, O.L.; Jackson, R.B. The structure, Distribution, and Biomass of the World’s forests. Annu. Rev. Ecol. Syst. 2013, 44, 593–622. [Google Scholar] [CrossRef]
  6. Martin, A.R.; Doraisami, M.; Thomas, S.C. Global patterns in wood carbon concentration across the world’s trees and forests. Nat. Geosci. 2018, 11, 915–920. [Google Scholar] [CrossRef]
  7. IPCC. Uso de la tierra, cambio de uso de la tierra y silvicultura. In Resumen para Responsables de Políticas; IPCC: Valencia, Spain, 2000; Volume 24. [Google Scholar]
  8. Ullah, F.; Gilani, H.; Sanaei, A.; Hussain, K.; Ali, A. Stand structure determines aboveground biomass across temperate forest types and species mixture along a local-scale elevational gradient. For. Ecol. Manag. 2021, 486, 118984. [Google Scholar] [CrossRef]
  9. Pan, Y.; Birdsey, R.A.; Fang, J.; Houghton, R.; Kauppi, P.E.; Kurz, W.A.; Phillips, O.L.; Shvidenko, A.; Lewis, S.L.; Canadell, J.G.; et al. A large and persistent carbon sink in the world’s forests. Science 2011, 333, 988–993. [Google Scholar] [CrossRef] [PubMed]
  10. Rodríguez-Veiga, P.; Saatchi, S.; Tansey, K.; Balzter, H. Magnitude, spatial distribution and uncertainty of forest biomass stocks in Mexico. Remote Sens. Environ. 2016, 183, 265–281. [Google Scholar] [CrossRef]
  11. Coomes, D.; Simonson, W.; Burslem, D. Forests and Global Change; Cambridge University Press: Cambridge, UK, 2014; ISBN 9781107041851. [Google Scholar]
  12. Ali, A.; Lin, S.L.; He, J.K.; Kong, F.M.; Yu, J.H.; Jiang, H.S. Climatic water availability is the main limiting factor of biotic attributes across large-scale elevational gradients in tropical forests. Sci. Total Environ. 2019, 647, 1211–1221. [Google Scholar] [CrossRef] [PubMed]
  13. Li, Q.; Liu, Z.; Jin, G. Impacts of stand density on tree crown structure and biomass: A global meta-analysis. Agric. For. Meteorol. 2022, 326, 109181. [Google Scholar] [CrossRef]
  14. Fotis, A.T.; Murphy, S.J.; Ricart, R.D.; Krishnadas, M.; Whitacre, J.; Wenzel, J.W.; Queenborough, S.A.; Comita, L.S. Above-ground biomass is driven by mass-ratio effects and stand structural attributes in a temperate deciduous forest. J. Ecol. 2018, 106, 561–570. [Google Scholar] [CrossRef]
  15. Balima, L.H.; Kouamé, F.N.G.; Bayen, P.; Ganamé, M.; Nacoulma, B.M.I.; Thiombiano, A.; Soro, D. Influence of climate and forest attributes on aboveground carbon storage in Burkina Faso, West Africa. Environ. Chall. 2021, 4, 100123. [Google Scholar] [CrossRef]
  16. Arasa-Gisbert, R.; Vayreda, J.; Román-Cuesta, R.M.; Villela, S.A.; Mayorga, R.; Retana, J. Forest diversity plays a key role in determining the stand carbon stocks of Mexican forests. For. Ecol. Manag. 2018, 415–416, 160–171. [Google Scholar] [CrossRef]
  17. Álvarez-Dávila, E.; Cayuela, L.; González-Caro, S.; Aldana, A.M.; Stevenson, P.R.; Phillips, O.; Cogollo, Á.; Peñuela, M.C.; Von Hildebrand, P.; Jiménez, E.; et al. Forest biomass density across large climate gradients in northern South America is related to water availability but not with temperature. PLoS ONE 2017, 12, e0171072. [Google Scholar] [CrossRef]
  18. Jia, B.; Guo, W.; He, J.; Sun, M.; Chai, L.; Liu, J.; Wang, X. Topography, Diversity, and Forest Structure Attributes Drive Aboveground Carbon Storage in Different Forest Types in Northeast China. Forests 2022, 13, 455. [Google Scholar] [CrossRef]
  19. Usuga, J.C.L.; Toro, J.A.R.; Alzate, M.V.R.; de Jesús Lema Tapias, Á. Estimation of biomass and carbon stocks in plants, soil and forest floor in different tropical forests. For. Ecol. Manag. 2010, 260, 1906–1913. [Google Scholar] [CrossRef]
  20. Chen, X.; Luo, M.; Larjavaara, M. Effects of climate and plant functional types on forest above-ground biomass accumulation. Carbon Balance Manag. 2023, 18, 5. [Google Scholar] [CrossRef] [PubMed]
  21. Reich, P.B.; Luo, Y.; Bradford, J.B.; Poorter, H.; Perry, C.H.; Oleksyn, J. Temperature drives global patterns in forest biomass distribution in leaves, stems, and roots. Proc. Natl. Acad. Sci. USA 2014, 111, 13721–13726. [Google Scholar] [CrossRef] [PubMed]
  22. Bennett, A.C.; Penman, T.D.; Arndt, S.K.; Roxburgh, S.H.; Bennett, L.T. Climate more important than soils for predicting forest biomass at the continental scale. Ecography 2020, 43, 1692–1705. [Google Scholar] [CrossRef]
  23. Ma, Y.; Eziz, A.; Halik, Ü.; Abliz, A.; Kurban, A. Precipitation and Temperature Influence the Relationship between Stand Structural Characteristics and Aboveground Biomass of Forests—A Meta-Analysis. Forests 2023, 14, 896. [Google Scholar] [CrossRef]
  24. IPCC. Summary for Policy Markers:Climate Change 2023: Synthesis Report; IPCC: Geneva, Switzerland, 2023. [Google Scholar]
  25. Harvey, J.E.; Smiljanić, M.; Scharnweber, T.; Buras, A.; Cedro, A.; Cruz-García, R.; Drobyshev, I.; Janecka, K.; Jansons, Ā.; Kaczka, R.; et al. Tree growth influenced by warming winter climate and summer moisture availability in northern temperate forests. Glob. Change Biol. 2020, 26, 2505–2518. [Google Scholar] [CrossRef]
  26. Alfaro-Ramírez, U.; Ramírez-Albores, E.; Vargas-Hernández, J.; Franco-Maass, S.; Pérez-Suárez, M. Potential reduction of Hartweg´s Pine (Pinus hartwegii Lindl.) geographic distribution. PLoS ONE 2020, 15, e0229178. [Google Scholar] [CrossRef] [PubMed]
  27. Villers-Ruiz, L.; Trejo-Vázquez, I. Assessment of the vulnerability of forest ecosystems to climate change in Mexico. Clim. Res. 1997, 9, 87–93. [Google Scholar] [CrossRef]
  28. Rodríguez-Zúñiga, J.; Flores-Ortiz, C.M.; González-Guillén, M.D.J.; Lira-Saade, R.; Rodríguez-Arévalo, N.I.; Dávila-Aranda, P.D.; Ulian, T. Cost Analysis of Seed Conservation of Commercial Pine Species Vulnerable to Climate Change in Mexico. Forests 2022, 13, 539. [Google Scholar] [CrossRef]
  29. INEGI. México en Cifras. Available online: https://www.inegi.org.mx/app/areasgeograficas/#collapse-Res (accessed on 13 March 2024).
  30. DOF. NORMA Oficial Mexicana de Emergencia NOM, EM 001-SARH3-1994; Diario Oficial de la Federación: Mexico City, Mexico, 1994; pp. 5–7. [Google Scholar]
  31. SEMARNAT; CONAFOR. La Producción de Resina de Pino en México; Comisión Nacional Forestal: Zapopan, Mexico, 2012. [Google Scholar]
  32. CONAFOR; CONABIO. Pinus montezumae Lamb. Available online: http://www.conafor.gob.mx:8080/documentos/docs/13/971Pinus%20montezumae.pdf (accessed on 21 June 2024).
  33. CONAFOR; CONABIO. Pinus oocarpa Shiede. Available online: http://www.conafor.gob.mx:8080/documentos/docs/13/974Pinus%20oocarpa.pdf (accessed on 21 June 2024).
  34. Sáenz-Romero, C.; Guzmán-Reyna, R.R.; Rehfeldt, G.E. Altitudinal genetic variation among Pinus oocarpa populations in Michoacán, Mexico. Implications for seed zoning, conservation, tree breeding and global warming. For. Ecol. Manag. 2006, 229, 340–350. [Google Scholar] [CrossRef]
  35. CONAFOR; CONABIO. Pinus devoniana Lindley. Available online: http://www.conafor.gob.mx:8080/documentos/docs/13/957Pinus%20devoniana.pdf (accessed on 21 June 2024).
  36. Gómez-Romero, M.; Soto–Correa, J.; Blanco-García, J.A.; Sáenz–Romero, C.; Villegas, J.; Linding-Cisneros, R. Estudio de especies de pino para restauración de sitios degradados. Agrociencia 2012, 46, 795–807. [Google Scholar]
  37. CONAFOR; CONABIO. Pinus cembroides Zucc. Available online: http://www.conafor.gob.mx:8080/documentos/docs/13/955Pinus%20cembroides.pdf (accessed on 21 June 2024).
  38. SEMARNAT; CONAFOR; CONACYT. Catálogo de Recursos Forestales Maderables y no Maderables Árido, Tropical y Templado; CONAFOR: Zapopan, Mexico, 2008. [Google Scholar]
  39. Constante García, V.; Villanueva Díaz, J.; Cerano Paredes, J.; Cornejo Oviedo, E.H.; Valencia Manzo, S. Dendrocronología de Pinus cembroides Zucc. y reconstrucción de precipitación estacional para el Sureste de Coahuila. Cienc. For. México 2009, 34, 17–39. [Google Scholar]
  40. CONAFOR; CONABIO. Pinus patula Schl. et Cham. Available online: http://www.conafor.gob.mx:8080/documentos/docs/13/975Pinus%20patula.pdf (accessed on 21 June 2024).
  41. CONAFOR; CONABIO. Pinus ayacahuite Ehren. Available online: http://www.conafor.gob.mx:8080/documentos/docs/13/953Pinus%20ayacahuite.pdf (accessed on 21 June 2024).
  42. CONAFOR; CONABIO. Pinus arizonica Engelm. Available online: http://www.conafor.gob.mx:8080/documentos/docs/13/952Pinus%20arizonica.pdf (accessed on 21 June 2024).
  43. CONAFOR. Procedimientos de Muestreo Version 19.0; SEMARNAT-CONAFOR: Guadalajara, Mexico, 2017. [Google Scholar]
  44. Fick, S.E.; Hijmans, R.J. WorldClim 2: New 1-km spatial resolution climate surfaces for global land areas. Int. J. Climatol. 2017, 37, 4302–4315. [Google Scholar] [CrossRef]
  45. Lê, S.; Josse, J.; Husson, F. FactoMineR: An R Package for Multivariate Analysis. J. Stat. Softw. 2008, 25, 1–18. [Google Scholar] [CrossRef]
  46. Rzedowski, J. Vegetación de México; Edición Digital; Comisión Nacional para el Conocimiento y Uso de la Biodiversidad: Mexico City, Mexico, 2006. [Google Scholar]
  47. Návar, J. Allometric equations for tree species and carbon stocks for forests of northwestern Mexico. For. Ecol. Manag. 2009, 257, 427–434. [Google Scholar] [CrossRef]
  48. Guerrero, L. Cuantificación de Biomasa, Carbono y Producción de Oxígeno de Pinus cembroides Zucc. Bachelor’s Thesis, Universidad Autónoma Agraria Antonio Narro, En Mazapil, Zacatecas, Mexico, 2013. [Google Scholar]
  49. Méndez-González, J.; Luckie-Navarrete, S.L.; Capó-Arteaga, M.A.; Nájera-Luna, J.A. Ecuaciones alométricas y estimación de incrementos en biomasa aérea y carbono en una plantación mixta de Pinus devoniana Lindl. y Pinus pseudostrobus Lindl., En Guanajuato, México. Agrociencia 2011, 45, 479–491. [Google Scholar]
  50. Carrillo-Anzúres, F.; Acosta-Mireles, M.; Flores-Ayala, E.; Juárez-Bravo, J.E.; Bonilla-Padilla, E. Estimación de biomasa y carbono en dos especies arboreas en La Sierra Nevada, México. Rev. Mex. Cienc. Agrícolas 2018, 5, 779–793. [Google Scholar] [CrossRef]
  51. Navarro-Martínez, J.; Godínez-Jaimes, F.; López-López, M.Á.; Rosas-Acevedo, J.L.; Juárez-López, A.L.; Reyes-Umaña, M. Ajuste de ecuaciones alométricas para estimar biomasa aérea en Pinus oocarpa y Quercus resinosa en Guerrero, México. Madera Bosques 2020, 26, e2611964. [Google Scholar] [CrossRef]
  52. Díaz-Franco, R.; Acosta-Mireles, M.; Carrillo-Anzures, F.; Buendía-Rodríguez, E.; Flores-Ayala, E.; Etchevers-Barra, J.D. Determinación de ecuaciones alométricas para estimar biomasa y carbono en Pinus patula Schl. et Cham. Madera Bosques 2007, 13, 25–34. [Google Scholar] [CrossRef]
  53. Moyroud, N.; Portet, F. Introduction to QGIS. In QGIS and Generic Tools; John Wiley & Sons Ltd.: Hoboken, NJ, USA, 2018; Chapter 1; pp. 1–17. [Google Scholar]
  54. Revelle, W. Psych: Procedures for Psychological, Psychometric, and Personality Research; R Core Team: Vienna, Austria, 2023. [Google Scholar]
  55. De Mendiburo, F. Una Herramienta de Análisis Estadístico para la Investigación Agrícola; Universidad Nacional de Ingenieria: Rímac, Peru, 2009. [Google Scholar]
  56. Kassambara, A. rstatix:Pipe-Friendly Framework for Basic Statical Tests; R Core Team: Vienna, Austria, 2023. [Google Scholar]
  57. Makowski, D.; Ben-Shachar, M.S.; Lüdecke, D. bayestestR: Describing Effects and their Uncertainty, Existence and Significance within the Bayesian Framework. J. Open Source Softw. 2019, 4, 1541. [Google Scholar] [CrossRef]
  58. Kassambara, A. ggpubr: “ggplot2” Based Publication Ready Plots; R Core Team: Vienna, Austria, 2023. [Google Scholar]
  59. Wang, L.Q.; Ali, A. Climate regulates the functional traits—Aboveground biomass relationships at a community-level in forests: A global meta-analysis. Sci. Total Environ. 2021, 761, 143238. [Google Scholar] [CrossRef]
  60. Wang, L.-Q.; Ali, A.; Wang, L.-Q.; Ali, A. Functional identity regulates aboveground biomass better than trait diversity along abiotic conditions in global forest metacommunities. Ecography 2021, 2022, e05854. [Google Scholar] [CrossRef]
  61. Cañas, R.A.; Canales, J.; Muñoz-Hernández, C.; Granados, J.M.; Ávila, C.; García-Martín, M.L.; Cánovas, F.M. Understanding developmental and adaptive cues in pine through metabolite profiling and co-expression network analysis. J. Exp. Bot. 2015, 66, 3113. [Google Scholar] [CrossRef]
  62. Gómez-Mendoza, L.G.; Arriaga, L. Modeling the Effect of Climate Change on the Distribution of Oak and Pine Species of Mexico. Conserv. Biol. 2007, 21, 1545–1555. [Google Scholar] [CrossRef]
  63. Aceves-Rangel, L.; Méndez-González, J.; García-Aranda, M.A.; Nájera-Luna, J.A. Distribución potencial de 20 especies de pinos en México. Agrociencia 2018, 52, 1043–1057. [Google Scholar]
  64. Alfaro-Reyna, T.; Retana, J.; Arasa-Gisbert, R.; Vayreda, J.; Martínez-Vilalta, J. Recent dynamics of pine and oak forests in Mexico. Eur. J. For. Res. 2020, 139, 179–187. [Google Scholar] [CrossRef]
  65. Slik, J.W.F.; Aiba, S.I.; Brearley, F.Q.; Cannon, C.H.; Forshed, O.; Kitayama, K.; Nagamasu, H.; Nilus, R.; Payne, J.; Paoli, G.; et al. Environmental correlates of tree biomass, basal area, wood specific gravity and stem density gradients in Borneo’s tropical forests. Glob. Ecol. Biogeogr. 2010, 19, 50–60. [Google Scholar] [CrossRef]
  66. Liu, Y.; Yu, G.; Wang, Q.; Zhang, Y. How temperature, precipitation and stand age control the biomass carbon density of global mature forests. Glob. Ecol. Biogeogr. 2014, 23, 323–333. [Google Scholar] [CrossRef]
  67. Escobar-Alonso, S.; Rodríguez-Trejo, D.A.; Escobar-Alonso, S.; Rodríguez Trejo, D.A. Estado del arte en la investigación sobre calidad de planta del género Pinus en México. Rev. Mex. Cienc. For. 2019, 10, 4–38. [Google Scholar] [CrossRef]
  68. De Frenne, P.; Lenoir, J.; Luoto, M.; Scheffers, B.R.; Zellweger, F.; Aalto, J.; Ashcroft, M.B.; Christiansen, D.M.; Decocq, G.; De Pauw, K.; et al. Forest microclimates and climate change: Importance, drivers and future research agenda. Glob. Change Biol. 2021, 27, 2279–2297. [Google Scholar] [CrossRef]
  69. Ali, A.; Sanaei, A.; Li, M.; Nalivan, O.A.; Ahmadaali, K.; Pour, M.J.; Valipour, A.; Karami, J.; Aminpour, M.; Kaboli, H.; et al. Impacts of climatic and edaphic factors on the diversity, structure and biomass of species-poor and structurally-complex forests. Sci. Total Environ. 2020, 706, 135719. [Google Scholar] [CrossRef] [PubMed]
  70. Bar-On, Y.M.; Phillips, R.; Milo, R. The biomass distribution on Earth. Proc. Natl. Acad. Sci. USA 2018, 115, 6506–6511. [Google Scholar] [CrossRef]
  71. Ni, Y.; Jian, Z.; Zeng, L.; Liu, J.; Lei, L.; Zhu, J.; Xu, J.; Xiao, W. Climate, soil nutrients, and stand characteristics jointly determine large-scale patterns of biomass growth rates and allocation in Pinus massoniana plantations. For. Ecol. Manag. 2022, 504, 119839. [Google Scholar] [CrossRef]
  72. González-Cásares, M.; Acosta-Hernández, A.C.; Zúñiga-Vazquez, J.M.; Herrera-Soto, G.; Camarero, J.J. Responses of Growth to Climate and Drought in Two Sympatric Mexican Pine Species Marcos. In Latin American Dendroecology; Pompa-García, M., Camarero, J.J., Eds.; Springer Nature: Cham, Switzerland, 2020; pp. 61–77. ISBN 9783030369293. [Google Scholar]
  73. Pompa-García, M.; Hadad, M.A. Sensitivity of pines in Mexico to temperature varies with age. Atmósfera 2016, 29, 209–219. [Google Scholar] [CrossRef]
  74. Vivar-Vivar, E.D.; Pompa-García, M.; Camarero, J.J. Tree Rings Elucidate Differential Drought Responses in Stands of Three Mexican Pines. Forests 2024, 15, 994. [Google Scholar] [CrossRef]
  75. Chave, J.; Réjou-Méchain, M.; Búrquez, A.; Chidumayo, E.; Colgan, M.S.; Delitti, W.B.C.; Duque, A.; Eid, T.; Fearnside, P.M.; Goodman, R.C.; et al. Improved allometric models to estimate the aboveground biomass of tropical trees. Glob. Change Biol. 2014, 20, 3177–3190. [Google Scholar] [CrossRef]
  76. Vieilledent, G.; Gardi, O.; Grinand, C.; Burren, C.; Andriamanjato, M.; Camara, C.; Gardner, C.J.; Glass, L.; Rasolohery, A.; Rakoto Ratsimba, H.; et al. Bioclimatic envelope models predict a decrease in tropical forest carbon stocks with climate change in Madagascar. J. Ecol. 2016, 104, 703–715. [Google Scholar] [CrossRef]
  77. Rosas-Chavoya, M.; López-Serrano, P.M.; Vega-Nieva, D.J.; Hernández-Díaz, J.C.; Wehenkel, C.; Corral-Rivas, J.J. Estimating Above-Ground Biomass from Land Surface Temperature and Evapotranspiration Data at the Temperate Forests of Durango, Mexico. Forests 2023, 14, 299. [Google Scholar] [CrossRef]
  78. Toledo, M.; Peña-Claros, M.; Bongers, F.; Alarcón, A.; Balcázar, J.; Chuviña, J.; Leaño, C.; Licona, J.C.; Poorter, L. Distribution patterns of tropical woody species in response to climatic and edaphic gradients. J. Ecol. 2012, 100, 253–263. [Google Scholar] [CrossRef]
  79. Zhang, X.; Zhou, Y.; Ji, Y.; Yu, M.; Li, X.; Duan, J.; Wang, Y.; Gao, J.; Guo, X. Climate Factors Affect Above–Belowground Biomass Allocation in Broad-Leaved and Coniferous Forests by Regulating Soil Nutrients. Plants 2023, 12, 3926. [Google Scholar] [CrossRef] [PubMed]
  80. Stegen, J.C.; Swenson, N.G.; Enquist, B.J.; White, E.P.; Phillips, O.L.; Jørgensen, P.M.; Weiser, M.D.; Monteagudo Mendoza, A.; Núñez Vargas, P. Variation in above-ground forest biomass across broad climatic gradients. Glob. Ecol. Biogeogr. 2011, 20, 744–754. [Google Scholar] [CrossRef]
  81. Lie, Z.; Xue, L.; Jacobs, D.F. Allocation of forest biomass across broad precipitation gradients in China’s forests. Sci. Rep. 2018, 8, 10536. [Google Scholar] [CrossRef] [PubMed]
  82. Sandel, B.; Goldstein, L.J.; Kraft, N.J.B.; Okie, J.G.; Shuldman, M.I.; Ackerly, D.D.; Cleland, E.E.; Suding, K.N. Contrasting trait responses in plant communities to experimental and geographic variation in precipitation. New Phytol. 2010, 188, 565–575. [Google Scholar] [CrossRef]
  83. Lin, D.; Xia, J.; Wan, S. Climate warming and biomass accumulation of terrestrial plants: A meta-analysis. New Phytol. 2010, 188, 187–198. [Google Scholar] [CrossRef]
  84. Saatchi, S.; Houghton, R.A.; Dos Santos Alvalá, R.C.; Soares, J.V.; Yu, Y. Distribution of aboveground live biomass in the Amazon basin. Glob. Change Biol. 2007, 13, 816–837. [Google Scholar] [CrossRef]
  85. IPCC. Synthesis Report, Contribution of Working Groups I, II and III to the Sixth Assessment Report of the Intergovernmental Panel on Climate Change. In Climate Change 2023; Lee, H., Romero, J., Eds.; IPCC: Geneva, Switzerland, 2023; pp. 35–115. [Google Scholar]
  86. McKenney, D.W.; Pedlar, J.H.; Lawrence, K.; Campbell, K.; Hutchinson, M.F. Potential Impacts of Climate Change on the Distribution of North American Trees. Bioscience 2007, 57, 939–948. [Google Scholar] [CrossRef]
  87. Hammond, W.M.; Williams, A.P.; Abatzoglou, J.T.; Adams, H.D.; Klein, T.; López, R.; Sáenz-Romero, C.; Hartmann, H.; Breshears, D.D.; Allen, C.D. Global field observations of tree die-off reveal hotter-drought fingerprint for Earth’s forests. Nat. Commun. 2022, 13, 1761. [Google Scholar] [CrossRef] [PubMed]
  88. Cuervo-Robayo, A.P.; Ureta, C.; Gómez-Albores, M.A.; Meneses-Mosquera, A.K.; Téllez-Valdés, O.; Martínez-Meyer, E. One hundred years of climate change in Mexico. PLoS ONE 2020, 15, e0209808. [Google Scholar] [CrossRef] [PubMed]
  89. Larjavaara, M.; Lu, X.; Chen, X.; Vastaranta, M. Impact of rising temperatures on the biomass of humid old-growth forests of the world. Carbon Balance Manag. 2021, 16, 31. [Google Scholar] [CrossRef] [PubMed]
  90. Gutiérrez, E.; Trejo, I. Efecto del cambio climático en la distribución potencial de cinco especies arbóreas de bosque templado en México. Rev. Mex. Biodivers. 2014, 85, 179–188. [Google Scholar] [CrossRef]
Figure 1. Climatic tolerances of 10 Mexican conifer species—BIO1: mean annual temperature (a); BIO12: mean annual precipitation (b); BIO5: maximum temperature of the warmest month (c); BIO6: minimum temperature of the coldest month (d). Pari: Pinus arizonica Engelm; Paya: Pinus ayacahuite Ehrenb. ex Schltdl.; Pcem: Pinus cembroides Zucc; Pdev: Pinus devoniana Lindl; Plei: Pinus leiophylla Schiede ex Schltdl. and Cham; Pmon: Pinus montezumae Lamb; Pooc: Pinus oocarpa Schiede ex Schltdl.; Ppat: Pinus patula Schiede and Cham; Ppse: Pinus pseudostrobus Lindl; Pteo: Pinus teocote Schiede ex Schltdl.
Forests 15 01160 g001
Figure 2. Geographic distribution of maximum (quantiles 80–100, orange dots) and minimum (quantiles 0–20, yellow dots) aboveground biomass density of 10 conifer species in Mexico. Pinus arizonica Engelm. (a); Pinus ayacahuite Ehrenb. ex Schltdl. (b); Pinus cembroides Zucc (c); Pinus devoniana Lindl (d); Pinus leiophylla Schiede ex Schltdl. and Cham (e); Pinus montezumae Lamb (f); Pinus oocarpa Schiede ex Schltdl. (g); P. patula Schiede and Cham (h); Pinus pseudostrobus Lindl (i); P. teocote Schiede ex Schltdl. (j).
Forests 15 01160 g002
Figure 3. Correlations between the aboveground biomass density of 10 species studied with 19 bioclimatic variables. Pari: Pinus arizonica Engelm; Paya: Pinus ayacahuite Ehrenb. ex Schltdl.; Pcem: Pinus cembroides Zucc; Pdev: Pinus devoniana Lindl; Plei: Pinus leiophylla Schiede ex Schltdl. and Cham; Pmon: Pinus montezumae Lamb; Pooc: Pinus oocarpa Schiede ex Schltdl.; Ppat: Pinus patula Schiede and Cham; Ppse: Pinus pseudostrobus Lindl; Pteo: Pinus teocote Schiede ex Schltdl; BIO1: Annual Mean Temperature; BIO2: Mean Diurnal Range; BIO3: Isothermality; BIO4: Temperature Seasonality; BIO5: Max Temperature of Warmest Month; BIO6: Min Temperature of Coldest Month; BIO7: Temperature Annual Range; BIO8: Mean Temperature of Wettest Quarter; BIO9: Mean Temperature of Driest Quarter; BIO10:Mean Temperature of Warmest Quarter; BIO11: Mean Temperature of Coldest Quarter; BIO12: Annual Precipitation; BIO13: Precipitation of Wettest Month; BIO14: Precipitation of Driest Month; BIO15: Precipitation Seasonality; BIO16: Precipitation of Wettest Quarter; BIO17: Precipitation of Driest Quarter; BIO18: Precipitation of Warmest Quarter; BIO19: Precipitation of Coldest Quarter.
Forests 15 01160 g003
Figure 4. Bayesian correlation between aboveground biomass density of 10 conifer species in Mexico and 19 bioclimatic variables. The vertical line separates temperature BIOS on the left and precipitation BIOS on the right. Red boxes represent negative correlation, while green boxes represent positive correlation. The value above each box indicates the % in ROPE (Region of Practical Equivalence). This is the percentage of the correlation distribution that falls within a region of practical equivalence, where the effects are considered practically negligible. Top to bottom: Pinus arizonica Engelm; Pinus ayacahuite Ehrenb. ex Schltdl; Pinus cembroides Zucc; Pinus devoniana Lind; Pinus leiophylla Schiede ex Schltdl. and Cham; Pinus montezumae Lamb; Pinus oocarpa Schiede ex Schltdl; P. patula Schiede and Cham; Pinus pseudostrobus Lindl; P. teocote Schiede ex Schltdl.
Forests 15 01160 g004aForests 15 01160 g004b
Figure 5. Comparison of the bioclimatic variable values that showed the highest correlation coefficients between sites corresponding to quantile 5 (80 to 100) of the aboveground biomass density and quantiles 1, 2, 3, and 4 using the Mann–Whitney U test. (a) Pinus arizonica Engelm (BIO1, °C); (b) Pinus cembroides Zucc (BIO4, standard deviation × 100); (c) Pinus leiophylla Schiede ex Schldtl (BIO12, mm); (d) Pinus oocarpa Schiede ex Schldtl (BIO12, mm); (e) Pinus pseudostrobus Lindl (BIO7 (BIO5–BIO6); (f) Pinus teocote Schiede ex Schldtdl (BIO4, standard deviation × 100). Comparison of the number of trees in quantiles one and five: (g) Pinus arizonica Engelm; (h) Pinus cembroides Zucc; (i) Pinus leiophylla Schiede ex Schltdl; (j) Pinus oocarpa Schiede ex Schltdl; (k) Pinus pseudostrobus Lindl; (l) Pinus teocote Schiede ex Schltdl. Significance of the comparisons; ns: no significant, ** p < 0.01, *** p < 0.001, **** p < 0.0001.
Forests 15 01160 g005
Table 2. Descriptive and inferential analyses of dasometric variables and aboveground biomass density in the species studied.
SpeciesH (m)DBH (cm)AGBd (t ha−1)
MinMaxMeanMinMaxMeanMinMaxMean
P. arizonica0.2029.508.57 e7.5061.5016.62 f0.01319.073.11 c
P. ayacahuite0.2030.008.89 d7.5062.4015.77 f0.02212.321.14 f
P. cembroides0.2016.205.52 f7.5060.5014.82 g0.00214.302.33 d
P. devoniana0.2041.5012.31 ab7.5085.1024.55 a0.01012.401.16 f
P. leiophylla0.2035.009.60 d7.5067.8018.39 e0.02026.451.92 e
P. montezumae0.2035.7012.32 ab7.5097.0024.76 ab0.02082.338.08 a
P. oocarpa0.2036.7011.67 b7.5089.0022.61 b0.01458.235.07 a
P. patula0.2036.7013.37 a7.5084.9020.88 c0.01053.596.66 a
P. pseudostrobus0.2044.4013.27 a7.50101.025.54 a0.01099.789.01 a
P. teocote0.2033.0010.28 c7.5071.1019.21 d0.02230.143.48 b
Note: Different letters in columns represent different groups according to the Kruskal–Wallis test (α = 0.05); DBH: diameter at breast height; H: Total height; AGBd: aboveground biomass density.
Table 3. Bayes factor values calculated between aboveground biomass density and 19 bioclimatic variables across 10 conifer species from Mexico.
ParameterPariPayaPcemPdevPleiPmonPoocPpatPpsePteo
BIO12.11 e × 103 ***0.0941.46 e × 109 ***0.8572.17 e × 107 ***1.891.156.75 *2.8450.51 ***
BIO20.3530.6082.04 e × 1018 ***0.3130.6962.051.46 e × 109 ***0.3381.09 e × 106 ***2.97 e × 109 ***
BIO30.1530.1479.59 e × 1022 ***0.19872.00 ***0.6372.69 e × 104 ***0.456239.75 ***3.32 e × 108 ***
BIO40.1830.3075.84 e × 1028 ***0.17811.35 **0.5367.69 e × 107 ***0.7421.13 e × 104 ***8.87 e × 1013 ***
BIO519.88 **0.2788.23 e × 1012 ***2.034.46 e × 1011 ***11.61 **1.1210.94 **1.12 e × 105 ***0.91
BIO6115.62 ***0.1428.54 e × 1031 ***0.310.9220.4241.47 e × 103 ***1.390.152.27 e × 107 ***
BIO70.1060.5421.17 e × 1035 ***0.1942.36 ***2.389.90 e × 108 ***0.8122.19 e × 107 ***2.72 e × 1013 ***
BIO810.05 **0.1864.15 e × 103 ***3.34 *4.11 e × 1011 ***2.940.0747.46 *62.22 ***0.089
BIO966.21 ***0.0890.4050.441.20 e × 107 ***1.330.7373.12 *0.64822.90 **
BIO1012.52 **0.183.50 e × 105 ***1.644.39 e × 1011 ***3.29 *0.0757.65 *141.23 ***0.082
BIO114.99 e × 103 ***0.1053.74 e × 1025 ***0.46510.14 **0.94899.08 ***4.50 *0.1941.46 e × 106 ***
BIO120.1170.18576.19 ***0.1580.1080.2417.30 e × 104 ***0.36156.21 ***5.38 e × 103 ***
BIO130.1280.097.41 e × 1016 ***0.1540.090.359393.53 ***0.5658.92*0.749
BIO140.1130.0932.82 e × 104 ***0.2760.1040.2120.1380.3620.130.083
BIO150.1730.3812.29 e × 1025 ***0.190.0840.2150.0770.2050.7490.138
BIO160.110.0993.14 e × 1013 ***0.1790.0920.2722.87 e × 103 ***0.352102.24 ***10.02 **
BIO170.1250.2623.77 e × 107 ***0.2870.1820.2150.0790.4220.1360.094
BIO180.1030.0913.75 e × 1016 ***0.7190.1250.2160.0740.3611.2690.19 ***
BIO190.1120.138977.44 ***0.2280.370.3139.29 *0.2620.2021.15 e × 104 ***
Note: Bayes factors are continuous measures of relative evidence. These Bayes factors provide evidence in favor of the alternative hypothesis over the null hypothesis. Pari: Pinus arizonica Engelm; Paya: Pinus ayacahuite Ehrenb. ex Schltdl.; Pcem: Pinus cembroides Zucc; Pdev: Pinus devoniana Lindl; Plei: Pinus leiophylla Schiede ex Schltdl. and Cham; Pmon: Pinus montezumae Lamb; Pooc: Pinus oocarpa Schiede ex Schltdl.; Ppat: Pinus patula Schiede and Cham; Ppse: Pinus pseudostrobus Lindl; Pteo: Pinus teocote Schiede ex Schltdl. BIO1: Annual Mean Temperature; BIO2: Mean Diurnal Range; BIO3: Isothermality; BIO4: Temperature Seasonality; BIO5: Max Temperature of Warmest Month; BIO6: Min Temperature of Coldest Month; BIO7: Temperature Annual Range; BIO8: Mean Temperature of Wettest Quarter; BIO9: Mean Temperature of Driest Quarter; BIO10: Mean Temperature of Warmest Quarter; BIO11: Mean Temperature of Coldest Quarter; BIO12: Annual Precipitation; BIO13: Precipitation of Wettest Month; BIO14: Precipitation of Driest Month; BIO15: Precipitation Seasonality; BIO16: Precipitation of Wettest Quarter; BIO17: Precipitation of Driest Quarter; BIO18: Precipitation of Warmest Quarter; BIO19: Precipitation of Coldest Quarter. Significance of Bayes correlation: * p < 0.05, ** p < 0.01, *** p < 0.001.
Disclaimer/Publisher’s Note: The statements, opinions and data contained in all publications are solely those of the individual author(s) and contributor(s) and not of MDPI and/or the editor(s). MDPI and/or the editor(s) disclaim responsibility for any injury to people or property resulting from any ideas, methods, instructions or products referred to in the content.

