Abstract
Laurel (Laurus nobilis L.) is a valuable non-wood forest product (NWFP) in the global export market, with Turkey being the largest supplier. Laurel harvesting is crucial for achieving long-term goals in the NWFP industry. This study assessed the effectiveness of a hybrid framework for prioritizing management strategies for laurel harvesting to boost the forest-based bioeconomy in Turkey. The existing literature highlights the use of multi-criteria decision-making methods when dealing with multiple conflicting criteria. This study proposes a systematic and comprehensive framework to analyze the current situation and develop effective laurel harvesting strategies. An integrated SWOT-fuzzy Pivot Pairwise Relative Criteria Importance Assessment (F-PIPRECIA) and TOWS Matrix approach was used. Data from ten decision makers evaluated four separate SWOT criteria against thirty-two sub-criteria. The most critical strategy identified was Maxi S2 × Maxi O1 (0.0803). Sensitivity analyses validated the results. This study found that the most effective strategies in Turkey include improving environmental and forest planning tools through circular management methods, promoting investment in forest infrastructure, supporting training and entrepreneurship programs in laurel harvesting, and strengthening innovative forest-based value chains. The hybrid framework aims for sustainable laurel resource management while maximizing economic returns. Implementing this methodology will help conserve biodiversity and enhance local communities’ well-being.
1. Introduction
In recent years, the concept of sustainable forest management has shifted towards an ecosystem-based approach and redefined the forestry sector’s understanding of sustainability. This new approach considers the importance of biodiversity and considers a broader set of management objectives simultaneously [1]. Adopting a human-centered perspective, using the full range of forest ecosystem services for the benefit of humanity is expected to have many positive impacts on contemporary global challenges, such as climate change mitigation and adaptation, poverty reduction, or improved food security [2]. Therefore, the forest-based sector is revitalizing its diversity and opening towards a circular biologically based economy based on a more holistic economic system. This approach focuses on new ways of income generation along various forest value chains. Furthermore, ecosystem-based forest management supports the socio-economic functions of forests to develop rural areas and promote a bioeconomy based on non-wood forest products (NWFPs) within the limits of sustainability [3].
NWFPs from forests are defined as “products of biological origin other than wood derived from forests, other wooded land and trees outside forests” according to the FAO’s definition [4] and are receiving increasing attention in rural development [5]. From the point of view of both planners and environmentalists, while NWFPs serve a variety of functions, the continuity of these species has been jeopardized due to excessive and unconscious collection and utilization [6,7,8]. Laurel, which belongs to the category of medicinal and aromatic plants (MAPs), is an example of a NWFP that protects human and animal health, prevents disease, and has curative effects [9]. Interest in NWFPs and MAPs is increasing due to the orientation towards nature and natural resources, and activities such as cultivation and collection positively affect the welfare of rural populations. Increasing demand has led to the growth of the trade volume of NWFPs and a significant increase in the collection rates of these plants from nature [10,11,12].
Turkey’s forestry sector plays an important role in its transition to an integrated and bioeconomy-based circular economy. Beyond timber supply, forest ecosystems provide a wide range of products and services that benefit human well-being. NWFPs play an important role in the provision of forest ecosystem services. The multiple value chains of NWFPs provide benefits to actors at all stages of the supply chain. Forest management in Turkey has not yet paid full attention to the economic returns of NWFPs, as timber production remains the main management objective. The lack of public knowledge on the socio-economic importance of NWFPs in rural development further complicates forestry multipurpose decision making [13,14].
Economic growth through urbanization helps capital accumulation in urban areas [15]. However, the rapid urbanization that urban systems face today has negative impacts on the ecosystem health and on the physical and psychological health of humans, whose existence is based on a nature-centered life, by damaging the unifying boundaries between nature and humans. With the increase in the urban population in Turkey, the amount of NWFP production in general increased by 464% between 1990 and 2010. There was a 1710% increase in bay leaf production. It is noteworthy that the varieties of NWFPs that showed a high increase are the ones that are intensively used as raw materials in industry and meet the needs of urban society. The increase in NWFP production is an indication of the importance of the functions of forests other than wood raw material production [16]. According to Janse and Ottitsch (2005), demographic factors such as population density and urbanization affect NWFPs and their services. Turkey’s forests are rich in biodiversity, which increases the diversity of NWFPs. The amount of production increases in line with the demand of society for these products [17].
In fact, the demand for laurel (Laurus nobilis L.) products in the world and in Turkey in recent years is an important problem for the continuity of the laurel species. Perhaps the most important of these problems is the rapid increase in demand for laurel products in the world and the unsustainable irregular collecting activities due to economic necessity. In this study, the current situation of laurel collecting as a rural development tool was analyzed and strategies were developed to contribute to sustainable laurel harvesting. In this study, the status of laurel harvesting for diversifying the forest-based bioeconomy is investigated through a multi-criteria analysis method involving the participation of expert decision makers. Prioritizing management strategies for laurel harvesting plays an important role in developing a forest-based bioeconomy to maintain ecological balance and support rural development. Prioritization of strategies for laurel harvesting plays a central role in the development of the forest-based bioeconomy and ensures that ecological and economic benefits are maximized.
Sustainable management and conservation of NWFPs are important to maintain their ecosystem and economic value. Prioritizing management strategies for laurel harvesting to enhance forest-based bioeconomy plays an important role in maintaining ecological balance and supporting rural development. Sustainable harvesting methods and responsible use strategies need to be developed in collaboration with various stakeholders using hybrid frameworks. Education and awareness programs can help local communities to adopt sustainable collection methods.
There is great potential in NWFPs, and in this study in laurel harvesting, to strengthen the economic sustainability of rural areas. The results show the opportunities offered to sustainable rural development and bioeconomy if the focus is on laurel harvesting. Therefore, this study aims to uncover knowledge perspectives on laurel harvesting as one of the important NWFPs for Turkey. Laurel harvesters can be identified as key stakeholders in a forest bioeconomy.
The implementation of sustainable harvesting and management strategies of NWFPs will ensure the conservation of natural resources and the benefit of future generations. Prioritizing strategies for laurel harvesting is central to developing a forest-based bioeconomy and ensures that ecological and economic benefits are maximized.
Sustainable laurel harvesting methods and responsible use strategies should be developed in collaboration with various stakeholders and hybrid frameworks should be used. Many studies in the literature have been solved with the MCDM (Multi-Criteria Decision-Making) method [18,19,20,21]. On the other hand, due to its flexibility and high efficiency in analyzing decision problems, MCDM methods have been used in many forestry studies [22,23,24,25].
Although MCDM is often associated with the selection of one alternative from a set of alternatives, it can also be used for ranking alternatives [26,27]. Until now, several MCDM methods have been proposed, such as SAW [28], AHP [29], TOPSIS [30], PROMETHEE [31], ELECTRE [32], VIKOR [33], and so forth.
After Zadeh [34] and his work on fuzzy set theory, significant progress has been made in solving real-world complex decision-making problems. As an integral part of fuzzy set theory, fuzzy numbers, usually characterized as triangular or trapezoidal, were introduced, making them much more suitable for modeling and solving many complex decision-making problems. To solve various complex MCDM problems, some extensions to fuzzy set theory have been proposed, including intuitionistic fuzzy sets [35], interval-valued fuzzy sets [36], bipolar fuzzy sets [37], etc.
MCDM methods are tools that enable decision makers (DMs) to make appropriate choices in complex decision problems with many conflicting criteria [38]. On the other hand, human decisions can often be uncertain and ambiguous [39]. Therefore, MCDM methods are often adapted to fuzzy set theory to address subjective and qualitative decisions under uncertainty [40]. SWOT analysis for laurel harvesting is an MCDM problem involving many subjective criteria in criteria prioritization, and this study aims to propose a systematic and comprehensive framework for the regional bay industry. Another specific objective of this study is to examine the applicability of the proposed framework in the context of the Turkish bay industry. For this purpose, an integrated SWOT, Fuzzy PIvot Pairwise RElative Criteria Importance Assessment (F-PIPRECIA), and a TOWS approach are used.
There are several objectives in carrying out this study. First, given the increasing demand for laurel [18] and the need for regional laurel production in the next 10 years [41], the regional laurel trade will show great development. Therefore, the problem of identifying strategies for laurel harvesting, which is of strategic importance for regional laurel production, is worth investigating. However, very few studies in the literature specifically investigate the problems related to laurel harvesting [42]. Secondly, the laurel industry in Turkey has grown significantly in the last two decades and Turkey is a leader in the laurel market [43,44,45].
Research on NWFPs using MCDM methods has been used in various fields. However, there is a research gap in the literature on the situation analysis of the laurel harvest and the evaluation of alternative management strategies using hybrid MCDM methods such as SWOT, Fuzzy PIPRECIA, and TOWS. Filling this gap is the motivation behind this research. Therefore, this study focuses on the development of effective strategies for laurel harvesting. To develop a forest-based bioeconomy, it is important to achieve sustainability goals. Therefore, this study was conducted in Bartın, which has important laurel harvesting areas in Turkey. This study aims to select the best laurel harvesting strategy to enhance bioeconomic activities in the region. SWOT, Fuzzy PIPRECIA, and TOWS methods were applied together to achieve the study objective. Thus, DMs were able to objectively evaluate both the weights of SWOT criteria and strategy priorities.
The main objectives of this paper can be summarized as follows:
- Development of an integrated SWOT-Fuzzy PIPRECIA -TOWS hybrid method for laurel harvesting strategy selection. This method is referred to as the “Criteria Weighting and Strategy Prioritization (CWSP) framework”.
- Determination of weights and ranking of importance of main and sub-criteria in the selection of SWOT criteria for laurel harvesting.
- Conducting a case study in NWFP areas to demonstrate the applicability of this method.
- Create a resource to assist decision makers with similar problems using the proposed method.
- Raise awareness on the use of MCDM methods in NWFP strategy selection problems to improve the forest-based bioeconomy.
The United Nations adopted Agenda 2030 with its core element, the 17 Sustainable Development Goals (SDGs), in September 2015. The NWFP sector is broadly linked to the Sustainable Development Goals (SDGs) [46]. The sector itself can be grouped with SDG 15 “Sustainable Living”. SDG 15 is also directly linked to other SDGs such as SDG 12 “Responsible Consumption and Production” and SDG 13 “Climate Change”. In fact, actions for NWFPs are linked to SDGs 12–13 and 15. To achieve these goals, a situation analysis and subsequent strategy development for the laurel harvest are the starting point for this research. To meet the world demand for laurel, more and more land is being harvested for laurel. This increases the use of land for laurel harvesting and jeopardizes the sustainability of the laurel plant. To achieve the SDG targets, several background questions need to be answered. First, in what way is the laurel harvest sustainable, and to what extent is sustainable living (SDG 15) affected by the laurel harvest? Second, what is the contribution of responsible production (SDG 12) of reorienting policies towards laurel harvesting in the current context? Third, does unsustainable laurel harvesting affect the environment and climate change (SDG 13)? These three questions form the rationale behind the present study, and it becomes imperative to analyze each of them appropriately through empirical means.
This study analyzes the interrelationships among the four SWOT factors using a hybrid model and supports the hybrid model with empirical research. Thus, this study contributes to the following areas. Firstly, since SWOT factors for laurel harvesting are analyzed through a hybrid framework in this study, it allows for integrated calculations. Secondly, the weights of the SWOT factors for the topic have not been tested with a hybrid approach so far. Likewise, there is little information on this subject in the literature. Therefore, this study tests a new methodology using a hybrid approach. Third, instead of focusing on a specific policy, the hybrid framework focuses on effective strategies that are developed using a combination of multi-criteria decision-making methods. In this way, this study develops recommendations that will contribute to the achievement of SDGs 12–13 and 15.
In this regard, it is anticipated that this study will provide valuable insights into the sustainable management of laurel harvesting in Turkey. This study makes several contributions to the existing literature: (a) a systematic and comprehensive framework for strategy selection for regional laurel harvesting is proposed, (b) this is one of the pioneering studies analyzing regional laurel harvesting in Turkey, and (c) the robustness of the application is ensured through a rigorous three-stage sensitivity analysis. The rest of the paper is structured as follows. Section 2 provides more information on the existing literature on SWOT criteria for laurel harvesting. Then, Section 3 details the empirical procedures of the proposed methodology. Section 4 starts by explaining the proposed framework and then presents an empirical study with sensitivity analysis. Finally, Section 5 summarizes the conclusions and recommendations for future research.
2. NWFPs and Laurel
Laurel (Laurus nobilis L.) is an important NWFP for Turkey and has high economic value and popularity worldwide [47]. Laurel, which naturally grows in Mediterranean countries, is one of the two species belonging to the genus Laurus in the Lauraceae family: Laurus nobilis L. and Laurus canariensis Willd [48,49]. Laurus nobilis L. is widespread in Mediterranean coastline countries such as Turkey, Greece, France, Spain, and Portugal, and in the Western Mediterranean Basin countries (Romania, Albania, etc.) [50,51,52]; the Southern United States are the commercial production centers of laurel leaves [53,54]. Turkey is the major producer of L. nobilis and exports it to 64 countries [53,55]. Almost 97% of the world’s total production comes from Turkey [9]. The amount of annual production ranges between 7000 and 7500 tons [56]. Approximately 90% of the world’s need for laurel (around 300 thousand tons) is met in an area of 150 thousand hectares in Turkey. These areas are in the lowlands of the Mediterranean and Aegean regions and the coastline of the Black Sea region [57,58,59].
In Turkey, laurel leaves can be harvested throughout the year because the plant is evergreen. However, leaves are typically collected when the plants are in bloom. The berries are harvested at approximately 40% moisture when they reach physiological maturity. For the highest yield and best quality of dried leaves, one or two harvests per year are generally recommended. Weather conditions such as dew, high humidity, and rain are avoided during harvesting to prevent deterioration and discoloration. The collection of leaves is usually done by hand or with small farming tools such as rakes. Occasionally, plant stems are cut, and the leaves or fruits are removed after harvesting. Laurel leaves are classified according to shape, size, color, and aroma before packaging. According to various quality standards and consumer preferences, the leaves are packaged and stored in a cool, dry place [58,60,61].
Laurel has long been a neglected species in Turkey. Since it is not considered one of the primary tree species in forest ecosystems, it has often been damaged as a result of interventions in favor of red pine. However, with the increasing interest in non-wood products in recent years, the importance and value of laurel have started to be better understood. With the increase in inventory studies, the real potential of laurel in Turkey has been revealed and the rehabilitation and restoration of laurel areas has come to the agenda. Conservation, recording, and restoration of natural populations of species such as laurel are of great importance for the sustainability of forest ecosystems [62,63].
Laurel is of great importance in the Turkish economy today and is harvested both for the domestic market and for export. It is used in many areas such as spices, soaps, perfumes, tinctures, teas, and aromatherapy [48,64,65]. The increasing interest in natural products after the 1990s has increased the volume and market share of the use of NWFPs, including laurel [66]. The market value of laurel products in the world market is approximately USD 14 billion [43,44]. World demand for laurel has tripled in the post-2010 period, reaching 30 thousand tons in 2017 [42]. This increase has brought new entrepreneurs to Turkey’s NWFP sector. Turkey’s laurel exports more than tripled from 2005 to 2017, from USD 12 million to USD 40 million [67]. Since 2019, Turkey’s laurel export revenue has increased to USD 40 million, with most exports going to Vietnam [23,68]. Including by-products, Turkey’s laurel economic volume is over USD 100 million [69].
In Turkey, laurel production is largely carried out by natural harvesting. The harvesters are usually forest villagers and private landowners. Laurel is harvested by cutting branches. Laurel production and harvesting in Turkey provide important economic contributions to forest villagers. Worldwide and in Turkey, studies on laurel harvesting and production often focus on the problems faced by laurel harvesters and producers, while others focus on the role and importance of laurel products in the world and the Turkish economy. In developing countries, forest ecosystems are an important source of livelihood for rural populations. Some studies show that, especially in countries such as India and Pakistan, NWFPs are an important source of income for local people [70,71]. In Turkey, there are several studies on the economic value of laurel and other NWFP species [72,73]. These studies address the economic dynamics of laurel exploitation and harvesting and the gaps in the sector. Some studies have emphasized the economic and ecological importance of non-wood forest products [74,75,76,77,78,79,80,81,82,83,84].
3. Methodology
3.1. Study Area
This research was conducted in Bartın Province (Figure 1). Bartın is in the Western Black Sea Region and is one of the regions with the richest forest cover in Turkey. The climate and geological structure in the region offer favorable conditions for the growth of laurel species. Summers are generally hot, and winters are mild. In 2023, the average temperature in the region was 25 °C, with a high of 41 °C in July and a low of −24 °C in January. The annual rainfall in the region is 393 mm [85].
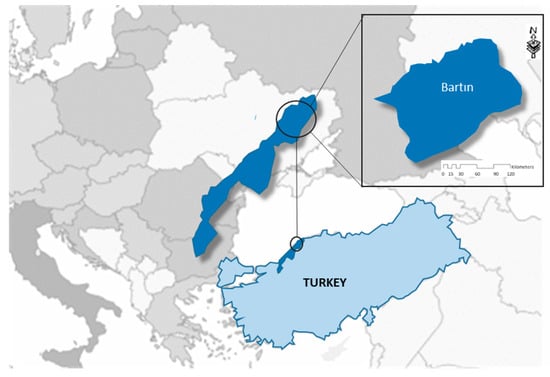
Figure 1.
Bartın Province (case study area).
Bartın is a rich region in terms of laurel harvest. In 2012, 140 tons of laurel was harvested in Bartın, while in 2019 this value was over 10 thousand tons. Today, about one-third of the laurel sold in Turkey is supplied from Bartın [86]. According to these data, Bartın, which has a very small portion of the amount of laurel in Turkey, has an important place in the country’s sales figure with the presence of facilities with the largest laurel processing and packaging unit in the country. On the other hand, Bartın is also among the first ranks in Turkey in terms of laurel harvest. Bartın, which has a 59 km long coastline, has more than 50 villages with laurel harvesting areas [18,85].
In Bartın, most of the laurel is harvested from forest lands by forest villagers and very little is harvested from private lands by landowners. Permission is required from the General Directorate of Forestry to harvest laurel. Whichever village the forest land belongs to, the villagers of that village are given priority to harvest the laurel [42].
Increasing demand for laurel worldwide and uncontrolled or untrained laurel harvesting in Turkey, and in Bartın in particular, lead to overexploitation and unsustainable, harmful practices (e.g., damage to vegetation during the collection of immature laurel shoots). These threats are often linked to illegal or informal trade, but the lack of a well-trained workforce in legal operations is also an important factor. For example, untrained or unprofessional laurel harvesting in the region damages the laurel plant and negatively affects the quality and quantity of the product for the rest of the plant life. The abandonment of rural areas, loss of traditional knowledge, low profitability, seasonality, and the remote location of the workplace are additional barriers to the professionalization of NWFP collectors in the Bartın region. Implementation of good practices for most wild-collected crops requires knowledge and training. Therefore, this study analyzes the situation of laurel harvesting in the Bartın region.
3.2. CWSP Framework
Many important initiatives are underway at the local, regional, and international levels to develop appropriate strategies for balancing various land and resource uses. For strategies for NWFPs to be successful, an approach that goes beyond the traditional methods of science must be developed. In this context, hybrid frameworks are needed to analyze the current situation of the NWFPs, where a variety of logical, robust, and reliable information is considered. Frameworks that combine SWOT and multiple methods and techniques can be used to develop and prioritize effective strategies for NWFPs.
In this study, the Criteria Weighting and Strategy Prioritization (CWSP) Framework was developed for laurel harvesting. The aim of the CWSP framework is to weight the SWOT criteria for laurel harvesting and prioritize the strategies in a hierarchical structure. This objective is placed at the first level of the hierarchy. At the second level, SWOT criteria were developed. AT the third level, F-PIPRECIA was used to weight each SWOT sub-criteria. AT the fourth level, strategies were prioritized with the TOWS Matrix (Figure 2). The process was carried out in a hierarchical order.
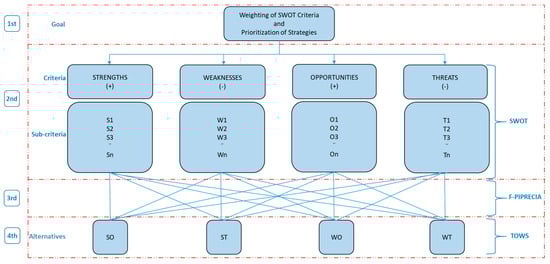
Figure 2.
Hierarchical structure of CWSP.
3.3. A Hybrid SWOT-Fuzzy PIPRECIA-TOWS Method Integrated into CWSP Framework
By examining the analysis methods, this study decided to apply the SWOT-F PIPRECIA-TOWS framework, considering the characteristics of the laurel harvesting industry and the current situation. This study utilized an Excel program on AHP analysis and SPSS statistics 26.
The problem was solved with an integrated SWOT-Fuzzy PIPRECIA-TOWS hybrid approach developed within the CWSP framework. F-PIPRECIA was preferred for weighting SWOT criteria and the TOWS Matrix was preferred for prioritizing strategies. In this context, the SWOT-Fuzzy PIPRECIA-TOWS hybrid approach was preferred due to its short time and simplicity of calculations. With a sample application realized in this way, this study has been differentiated from other studies and has a unique structure.
The overall procedure of this study consisted of five stages. DMs select the best alternative under many criteria. MCDM techniques have been developed using iterative numerical techniques to assist the DM [87]. Evaluation criteria often try to achieve conflicting objectives simultaneously. On the other hand, many hybrid methods such as F PIPRECIA-TOPSIS, F-PIPRECIA-VIKOR, F-PIPRECIA-COPRAS, F-PIPRECIA-PROMETHEE, and F-PIPRECIA-MOORA are suitable to be used together [88,89,90].
The study methodology is shown in Figure 3. In Stage 1, the objective of the study and the analysis of previous studies are presented. The research on laurel harvesting (i.e., literature review) and the data collected are detailed in Section 3.4. Then, Stage 2 is where the SWOT Analysis is defined. For this stage, a questionnaire was prepared and presented to the DMs to select the SWOT factors. Internal (Strengths and Weaknesses) and external (Opportunities and Threats) criteria were identified based on DMs’ perceptions. According to the CWSP framework, the relative weight of the criteria was formulated according to the SWOT-Fuzzy PIPRECIA model (Section 3.5). In Stage 3, based on the selected SWOT criteria, the criteria weights were calculated with F-PIPRECIA (Section 3.6), and the global priority of each SWOT criterion was calculated. In Stage 4, the strategies developed for laurel harvesting were prioritized using the TOWS Matrix (Section 3.7). In Stage 5, the results are presented and interpreted (Section 4).
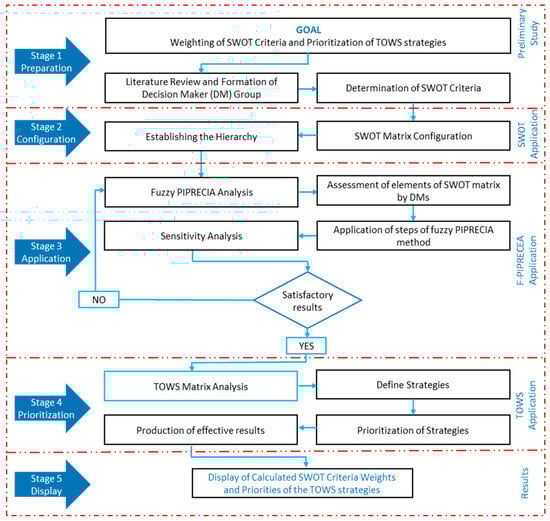
Figure 3.
CWSP framework (hybrid SWOT- F PIPRECIA- TOWS analysis).
3.4. Preparation and Data Collection—Stage 1
3.4.1. Identification of Decision Makers
The research targeted the views of experts (decision makers) in forestry and non-wood forest products in Turkey on the sustainable management of laurel harvesting. Considering the rapid growth of the world NWFP sector, it is difficult to determine which internal and external environmental factors influence the laurel harvesting sector. Therefore, it is important to include expert opinion before determining the attributes of SWOT criteria and sub-criteria [91,92]. Before deciding on these criteria, candidates were selected for this study by considering previous research findings and current practices. Ten DMs were included in the study to determine the weights of SWOT criteria for laurel harvesting. It is recommended to have three or more DMs in group studies [77]. The selection process of DMs was based on their expertise, practical experience, and general knowledge of research. Of the ten DMs selected, two represent educational institutions, two represent public institutions, three represent the private sector, and two represent NGOs. Since this study adopted an approach based on expert opinions, local people who do not have sufficient knowledge on the subject could not be utilized as DMs. Likewise, in sensitivity analyses, only the opinions of experts should be included to ensure a high success rate. Explanatory information for decision makers is given in Table 1.

Table 1.
DMs Identification.
3.4.2. Data Collection
To determine the criteria, the opinions of authors who had published their work in relevant academic journals on laurel harvesting were collected via e-mail and telephone interviews. The authors commented on which criteria should be used or omitted and which items should be added to each SWOT factor of interest. On the other hand, in this study, ideas for SWOT criteria were gathered in a regional workshop of DMs. The workshop was held in the fall of 2023 in Bartın. In the workshop, the 6-3-5 method was applied to identify SWOT criteria for laurel harvesting. In this method, the perspectives of DMs are considered in a broad perspective. The 6-3-5 method is an effective brainstorming technique that involves a group of people [93,94]. In the ideal version of the method, there is an average of six participants in each group. In this study, ten DMs were divided into two groups of five. Each group first generates three sub-criteria for each SWOT criterion on a worksheet within 5 min. After that, the sheets are passed on to the next participant within 5 min for the new three sub-criteria. These cycles are repeated five times. In this way, within 30 min each group had identified 75 SWOT criteria. In total, approximately 150 sub-criteria were identified. However, the number of SWOT sub-criteria should be limited for F-PIPRECIA calculations within the CWSP Framework. Otherwise, the desired results cannot be achieved in the sensitivity analysis of the study. For this reason, the obtained SWOT sub-criteria were re-evaluated by the DMs at the final stage, and, in line with the opinions of the decision makers, it was deemed appropriate to carry out this study with 32 sub-criteria, 8 in each of the 4 sub-SWOT headings.
3.5. SWOT Analysis—Stage 2
The simplest method for the analysis of the environment is SWOT analysis which represents a qualitative analytical method that throughout four factors attempts to present strengths, weaknesses, opportunities, and threats of a certain phenomenon or situation in a subject of analysis. The basic idea of SWOT analysis according to the authors of [1,2,3,4,5,18,19,20,21,22,23] is to determine internal strengths and weaknesses, as well as external threats and opportunities. In this way, continuous progress and development are achieved and thus competitive advantage too. It can be used when it comes to creating a company’s development strategy or analyzing competitors and market positions.
It is desirable for SWOT analysis to be performed by organization managers who are well acquainted with it but in cooperation with external consultants (who have special analytical skills and independent viewpoints) for objectivity. Analyzing the environment through a detailed list of favorable and unfavorable factors stimulates the research effort and provides reality in defining strategies. SWOT analysis is quick and simple, and according to the authors of [18,77], it can be adapted as a factor identification tool that influences an organization’s activities and provides solutions for the development of a future strategy.
SWOT analysis is a strategic tool used by management to gather relevant information about an organization and its current and future operating environment. The goal is to understand the internal strengths and weaknesses of the organization while identifying strategic opportunities and threats in the external environment. This analysis helps management use its internal strengths to assess external opportunities, while at the same time developing strategies to help it deal with internal weaknesses and external threats. The basic idea of SWOT analysis is that an organization can achieve the best strategic success by maximizing its strengths and opportunities while minimizing weaknesses and threats. This approach requires understanding the strategic implications by assessing the alignment of internal and external factors. Thus, internal strengths and weaknesses should be assessed in the context of external opportunities and threats, and vice versa.
3.6. Fuzzy PIPRECIA Analysis—Stage 3
Fuzzy logic is a mathematical method used to model imprecise information derived from human thinking. When making decisions, it takes into account human subjectivity and not only the objective probabilities of event occurrences. Since complete information is often unavailable, fuzzy logic allows for descriptions and reasoning about phenomena to be imprecise, akin to natural language expressions. This flexible and human-like approach avoids rigidly specifying descriptions and instead embraces the inherent vagueness in our understanding of complex problems [34].
Fuzzy PIvot Pairwise RElative Criteria Importance Assessment (F-PIPRECIA) was developed by Stević et al. [95] and used in different fields [96]. The fuzzy PIPRECIA method is based on the earlier developed PIPRECIA method [97]. Furthermore, Stanujkic et al. [98] also proposed a simplified PIPRECIA method (PIPRECIA-S).
The PIPRECIA method differs from the SWARA method in that it allows the evaluation of criteria without prioritization. Today, most multi-criteria decision-making problems are solved by applying group decision making. In such cases, PIPRECIA shows its advantages, especially when the number of decision makers in the fuzzy model increases.
The fuzzy PIPRECIA method consisting of 11 steps is explained below [95,99]:
3.6.1. Operations on Fuzzy Numbers
A fuzzy number on to be a TFN if its membership function is equal to following Equation (1):
From Equation (1), and mean the lower and upper bounds of the fuzzy number and is the modal value for . The TFN can be denoted by . See Stević et al. [95] for a detailed review of the operational laws of the TFN.
3.6.2. Fuzzy PIPRECIA Method
The fuzzy PIPRECIA method consisting of 11 steps is explained below [95,99]:
Step 1. Determination of the set of the evaluation criteria.
Step 2. Starting from the second criterion, it is necessary to determine the relative importance of the criterion in relation to the previous criterion (Equation (2)):
denotes the assessment of criteria by a decision-maker . To obtain a matrix it is necessary to perform the averaging of matrix using a geometric mean. Decision makers evaluate criteria by applying new defined scales in Table 2 and Table 3. When a criterion is more important than the previous one, evaluations are made using the scale in Table 2 to make it easier for decision makers to evaluate the criteria; the table shows the determinate fuzzy value (DFV) for each comparison. If the criteria are less important compared to the previous one, evaluations are made using the scale in Table 3.
Table 2.
Scale 1–2 for the assessment of criteria.
Table 3.
Scale 0–1 for the assessment of criteria.
The second and third steps of the developed method are closely interdependent and new fuzzy scales are defined to meet the requirements of the fuzzy PIPRECIA method of the second and third steps. These scales need to be defined when fuzzy number operations are considered and the values are subtracted from the number in the third step. By defining these scales, the appearance of the number two, which can cause computational difficulties and incorrect results, is avoided (e.g., in the case of the appearance of the number two. The lower, middle, or upper value of the fuzzy number for may be zero, which prevents us from proceeding further). It is therefore important to note that other previously developed fuzzy scales cannot be used, as they may not have addressed this problem [95].
Step 3. Data collection and ranking of alternatives. Determining the coefficient .
Step 4. Calculation of the recalculated weight as follows:
Step 5. Determining the relative weight of the criterion where represents the relative weight of the criterion .
In the following steps, the inverse methodology of the fuzzy PIPRECIA method needs to be applied.
Step 6. Performing the assessment of the above defined scale but this time starting from a penultimate criterion. denotes the assessment of criteria by a DM . It is again necessary to perform the averaging of matrix by applying a geometric mean.
Step 7. Determining the coefficient . n denotes a total number of criteria. In this case, it means that the value of the last criterion is equal to the fuzzy number one.
Step 8. Determining the fuzzy weight .
Step 9. Determining the relative weight of the criterion , where is the inverse weight of the criterion .
Step 10. In order to determine the final weights of criteria, it is first necessary to perform the defuzzification of the fuzzy values and , where represents the final weight of the criterion .
Step 11. Sensitivity Analysis. The results obtained are checked by applying Spearman’s rank correlation coefficient (SCC) and Pearson correlation coefficients (PCC) [100,101]. Verification of the reliability of the obtained results by using the Spearman’s rank correlation coefficient:
where represents the correlation coefficient, is a distance between the ranks for every , denotes the number of elements in each data series, and .
When the decision process is performed in a group environment, then the final weights of the criteria are obtained in the following manner:
where denotes the weight of criterion j obtained from respondent . is the number of the respondents. is the group weight of criterion before adjustment to fulfill the condition and is the final group weight of criterion .
3.7. TOWS Matrix Analysis—Stage 4
TOWS analysis is an enhanced method to derive strategies using the results of the SWOT analysis. In TOWS, SWOT can be written in reverse, which was originally introduced in [102] for the formation of company strategies [103]. For a TOWS analysis, threats and opportunities are examined first, then weaknesses and strengths. After creating a list of threats, opportunity, weakness, and strength strategies are formulated to find out how advantages of opportunities and minimization of threats can be developed by exploiting strengths and overcoming weaknesses [103]. TOWS analysis can produce four sets of strategies with combinations of SWOT sub-criteria in a matrix (Table 4) [104,105,106].
Table 4.
TOWS matrix.
The TOWS analysis can be summarized in four strategy types:
- The SO (maximum strength and maximum opportunity) strategy is an appropriate strategy that aims to make the most of the external opportunity by using the available internal strength.
- The ST (maximum strength and minimum threat) strategy represents the strategy that aims to reduce the impact of the threat by using strength.
- The WO (minimum weakness and maximum opportunity) strategy aims to minimize the impact of weakness by taking advantage of the external opportunity.
- The WT (minimum weakness and minimum threat) strategy is considered the most difficult strategy to implement. This strategy requires avoiding the threat as much as possible while minimizing the weaknesses.
Despite the advantages of a systematic approach to strategy formulation, TOWS analysis has some drawbacks like those of SWOT. This is because TOWS is based on a qualitative assessment in conjunction with the results of SWOT analysis. Thus, the results of TOWS analysis cannot show the degree of each priority among alternatives; it only presents a matrix of expert opinions [106].
To overcome this challenge in TOWS analysis, the CWSP framework (Hybrid SWOT-F PIPRECIA-TOWS analysis) was developed as an extension of the SWOT-F PIPRECIA analysis model. The CWSP framework combines three methods. First, SWOT criteria are analyzed with F PIPRECIA. In this process, SWOT criteria and sub-criteria are compared with each other, and their relative importance is calculated by the F PIPRECIA method. Then, TOWS analysis is applied. This gives more depth to the results of the SWOT analysis and allows for a better identification of strategic priorities.
Currently, the combination of SWOT-F PIPRECIA-TOWS is being used in many sectors [39,99,107]. However, the application of SWOT-F PIPRECIA-TOWS in the NWFPs sector is still limited. In this study, TOWS results are organized in tables and graphs are created based on the analysis results. TOWS strategies were developed in accordance with the weights of the eight sub-criteria within each SWOT. However, for ease of processing, it is recommended that the criteria weight should be greater than 0.050 (Citation) [108]. In this way, the CWSP framework enabled the development of strong strategies.
After the calculations for each criterion in the SWOT categories were performed with F-PIPRECIA, the final weights of each criterion were calculated using the weighted average of the SWOT category. In a typical SWOT-F PIPRECIA analysis, the total weight (TW) of each strategy was calculated according to Equations (14) and (15):
4. Results and Discussion
4.1. Evaluation of Laurel Harvesting Using Integrated SWOT-Fuzzy PIPRECIA Model
The assessment of the laurel harvest by using an integrated SWOT-Fuzzy PIPRECIA model is an important tool to identify the strengths, weaknesses, opportunities, and threats of the sector. This model helps to make strategic decisions related to the laurel harvest while addressing uncertainties with fuzzy PIPRECIA elements. The analysis can contribute to the development of strategies that will ensure sustainability and a competitive advantage in the sector. Thus, it provides critical guidance to identify the potential of the laurel industry and take important steps.
Determination of SWOT Criteria for Laurel Harvesting
The first step in the research is to create a set of 32 sub-criteria and apply the CWSP framework to determine their weights. The criteria are ranked in the SWOT matrix without considering their importance. In addition, in this step, the information of ten DMs was consulted. In the second step, each DM evaluates the criteria individually. In this way, the four basic dimensions of SWOT analysis are identified (Table 5).
Table 5.
Determination of SWOT criteria for laurel harvesting.
The main criteria of the SWOT Analysis are explained below.
- -
- Strengths: Laurel, as a strategic NWFP, holds significant promise within the realm of the forest-based bioeconomy. The presence of qualified laurel processing facilities in the region underscores its economic significance. Bartın, distinguished for its leadership in laurel harvesting in Turkey, stands out as a key driver of rural development. This is further reinforced by the eagerness of entrepreneurs to invest in laurel processing facilities and is indicative of the sector’s growth potential. The adaptability of laurel to diverse climates and soil conditions enhances its resilience as a valuable resource. Moreover. ongoing bioeconomy-focused research and development endeavors are dedicated to exploring avenues to produce value-added laurel products promising increased economic returns. The adoption of non-chemical natural methods in laurel harvesting not only ensures environmental sustainability but also aligns with growing consumer preferences for organic and eco-friendly products. Additionally, the cultivation of laurel presents an opportunity to mobilize and empower the rural labor force, contributing to inclusive economic growth and community development. In summary, the amalgamation of these factors positions laurel as a cornerstone of sustainable economic development and environmental stewardship within the context of a forest-based bioeconomy.
- -
- Weaknesses: The laurel harvesting industry faces a host of challenges, impeding its sustainable development and economic viability. Inadequate knowledge and inefficient practices in laurel harvesting contribute to reduced yields and compromised product quality. Furthermore, ineffective marketing strategies and a weak regulatory framework hamper the sector’s growth and competitiveness. Unfair revenue distribution exacerbates economic disparities among stakeholders, discouraging further investment. The ineffectiveness of laurel production cooperatives, coupled with low membership rates, hinders collective bargaining power and collaborative problem solving. Additionally, market price monopolization by a few dominant actors distorts market dynamics, disadvantaging smaller producers and stifling competition. The perception of laurel harvesting as a secondary occupation diminishes its value, exacerbating labor shortages. Insufficient investments in afforestation initiatives constrain laurel cultivation expansion, perpetuating supply shortages. Moreover, the lack of a certification system undermines consumer confidence in product quality and sustainability, hindering market development and potential export opportunities. Addressing these multifaceted challenges requires a comprehensive approach involving stakeholder collaboration and targeted policy interventions to enhance knowledge, governance, and market transparency in the laurel harvesting sector.
- -
- Opportunities: The laurel industry benefits from the presence of supportive mechanisms, institutions, and organizations facilitating investments in processing plants, amplifying its economic significance. Additionally, there is a burgeoning interest in rural areas, rural innovation, and entrepreneurship, providing fertile ground for laurel-related ventures and bolstering local economies. Effective maintenance methods offer the potential to optimize laurel field productivity, enhancing sustainability and yield. Turkey’s unparalleled position in the global laurel trade, dominating in quality, price, and quantity, underscores its pivotal role in shaping international market dynamics, with a staggering 90% market share. Laurel harvesting emerges as a linchpin in the formulation of place-based development strategies, contributing to regional economic growth and vitality. Furthermore, the advancement of digitalization efforts in marketing Non-Timber Forest Products (NTFPs) promises to revolutionize market access and efficiency, fostering broader market reach. Concurrently, increasing technological investments present local enterprises with opportunities to innovate and develop high-value derivative products from laurel, tapping into its multifaceted potential. Moreover, positive trends in bioeconomic policies, both globally and within Turkey, create an enabling environment for the sustainable development of the laurel industry, promoting innovation, resilience, and long-term viability.
- -
- Threats: Climate change is negatively impacting the availability of NWFPs by affecting the vitality, structure, and functioning of forests and other wooded ecosystems. In the Mediterranean basin in particular, continued rainfall reduction, drought cycles, and increasing aridification are reducing the availability and quality of NWFPs, increasing seasonality, and putting supply chains and regional marketing strategies at risk [109]. Climate change presents a formidable threat to laurel production and harvesting by disrupting crucial ecosystems. Ineffective conservation and utilization policies further exacerbate these risks, leaving laurel resources vulnerable to degradation. Additionally, the region experiences an increase in out-migration and an aging rural population, leading to labor shortages and a decline in traditional knowledge essential for sustainable harvesting practices. Despite efforts to promote rural development, especially within the laurel sector, existing plans often fall short due to limited resources and ineffective implementation strategies. Furthermore, increasing global competition intensifies market pressures, impacting profitability, while problems in laurel marketing channels constrain revenue opportunities. The prevalence of unrecorded income in laurel harvesting undermines regulatory efforts and exacerbates income disparities within the industry. Moreover, public disinterest in climate change and bioeconomic product discourse hinders awareness and action towards mitigating environmental threats. Addressing these multifaceted challenges requires comprehensive strategies integrating climate adaptation measures, sustainable resource management practices, targeted rural development initiatives, and enhanced market access and governance mechanisms to ensure the resilience and longevity of the laurel industry amidst evolving environmental and economic landscapes.
4.2. Assessment of Laurel Harvesting Matrix by Fuzzy PIPRECIA Method
In the SWOT matrix consisting of 32 sub-criteria, the weight of each one was calculated by applying the fuzzy PIPRECIA method. In this step, in a team of ten decision makers, each decision maker individually evaluated the criteria that represent the identification of the four key dimensions of the SWOT analysis.
4.2.1. Assessment of the Main Criteria of SWOT Matrix
The main dimensions of the SWOT matrix were evaluated by ten DMs using fuzzy PIPRECIA and inverse fuzzy PIPRECIA methods (Table A1 and Table A2). The geometric mean (GM) value obtained because of the evaluations was used in the further calculations of this study.
Based on the assessment of criteria and a geometric mean (GM) (Equation (2)), a matrix is formed. Applying Equation (3), those values are subtracted from the number two. Respecting the rules of operations on fuzzy numbers, the matrix is obtained in the following way:
According to Equation (9), the values of are obtained in the following way:
Applying Equation (10), the relative weights are calculated as follows:
The results of the fuzzy PIPRECIA methods are presented in Table 6.
Table 6.
Fuzzy PIPRECIA results for SWOT main criteria.
In order to determine the final weights of the criteria, it is necessary to apply Equations (11)–(15), that is, the methodology of the inverse fuzzy PIPRECIA method. Based on the assessment carried out by decision makers and applying a geometric mean, a matrix is obtained.
Applying Equation (12), the following values are obtained:
Applying Equation (13), the following values are obtained:
Then, it is required to apply Equation (14) to obtain relative weights for the fuzzy Inverse PIPRECIA method.
The results of the inverse fuzzy PIPRECIA methods are presented in Table 7.
Table 7.
Inverse fuzzy PIPRECIA results for SWOT main criteria.
Applying Equation (15), the final weights of the criteria are obtained. Before applying this equation, it is necessary to perform the defuzzification of the values of criteria obtained using Equations (7)–(15).
4.2.2. Assessment of the Sub-Criteria of Strength Dimension
The calculation of the sub-criteria of all SWOT matrix dimensions was carried out in the same way. Table A3, Table A4, Table A5, Table A6, Table A7, Table A8, Table A9 and Table A10 shows the calculations and results for all sub-criteria of the SWOT matrix. A summary of calculations the SWOT sub-criteria weight values is given in Table 8.
Table 8.
Assessment SWOT sub-criteria weight values.
4.2.3. Sensitivity Analysis
The sensitivity analysis includes the calculation of the Spearman coefficient correlation for the rankings obtained by the fuzzy PIPRECIA method and its inverse fuzzy version. Also, the Pearson correlation coefficient is calculated for the weights of the SWOT matrix sub-criteria obtained from both versions of the developed method. Table 9 and Table 10 show the rankings and correlation coefficients.
Table 9.
Ranks and weight values of main criteria of SWOT matrix.
Table 10.
Ranks and weight values of sub-criteria of SWOT matrix.
In Table 9, the most important dimension of the SWOT analysis is Strength (0.396). The research identified eight criteria from each SWOT factor. The least important SWOT factor is Threat (0.141). In addition, the PIPRECIA results are also presented separately in columns eight and nine of Table 9. The application of fuzzy PIPRECIA and inverse fuzzy PI-PRECIA methods, i.e., the rankings, are in full correlation (SCC = 1.000). The high reliability of the obtained results is also evidenced by the Pearson correlation coefficient (PCC = 0.967).
Considering a full sensitivity analysis, it can be concluded that the results obtained by the developed model are stable and the values of the rankings and weighting elements within the developed method tend to be fully correlated (Table 9 and Table 10). The most important reason for this correlation is that the DMs consulted in the study were informed on how to apply the new fuzzy scales defined in this study.
4.2.4. Results of SWOT-Fuzzy PIPRECIA Analysis
Table 11 and Figure 4 and Figure 5 show complete unified results of the hybrid SWOT-Fuzzy PIPRECIA method that relate to local and global values of sub-criteria for each dimension individually and global ranks of sub-criteria. In Table 11, the 10 strategies with the highest rank values in columns 1-5 are underlined.
Table 11.
Results of Hybrid SWOT-Fuzzy PIPRECIA.
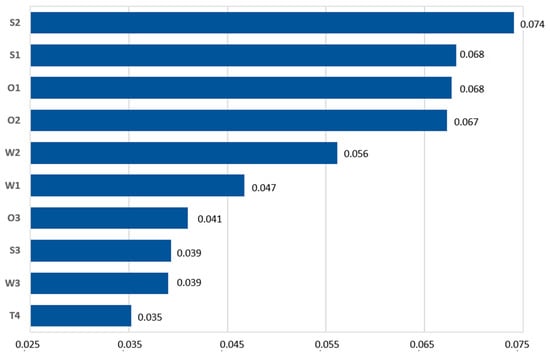
Figure 4.
Presentation of Hybrid SWOT-Fuzzy PIPRECIA results.
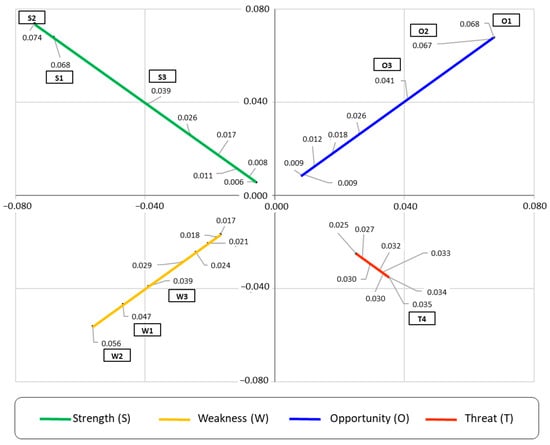
Figure 5.
Quadrant of Hybrid SWOT-Fuzzy PIPRECIA results.
4.3. Defining and Prioritization Strategies for Laurel Harvesting with TOWS Matrix Analysis
TOWS calculations were made on the SWOT-F PIPRECIA results and strategic alternatives were created. In this process, Strengths–Opportunities (SO), Strengths–Threats (ST), Weaknesses–Opportunities (WO), and Weaknesses–Threats (WT) strategies were identified. The value of each TOWS alternative was determined by multiplying the global priorities of the respective sub-factors. As a result, a total of 256 different management strategies were generated, 64 for each of the SO, ST, WO, and WT groups. However, it was not easy to identify the most effective one from such a wide range of strategies, nor was it necessary for decision makers to examine such many strategies. Therefore, strategies with TW (Total Weight) values greater than 0.05 were selected for use in TOWS calculations (Table A11). In addition, literature reviews show that the top 10 strategies with a TW value greater than 0.05 were used in the TOWS calculation [108,110,111]. A general representation of TOWS strategies for laurel harvesting is given in Table 12.
Table 12.
Top 10 TOWS strategies for laurel harvesting (SO-ST-WT-WO).
In the TOWS matrix, ten alternative management strategies were placed, six in the SO cell and four in the WO cell. No strategy was placed in the ST and WT cells (Table 12). On the other hand, the top priority in the TOWS matrix is the SO strategy combination (0.35). WO comes second with 0.28. In third place is ST with 0.21. WT comes last (0.16) (Figure 6). Based on Table 10 and Figure 6, “Threat” is the least important SWOT factor in TOWS strategies. According to these results, DMs considered management strategies that emphasize strengths, exploit opportunities, and eliminate weaknesses of the firm to be important for laurel harvesting.
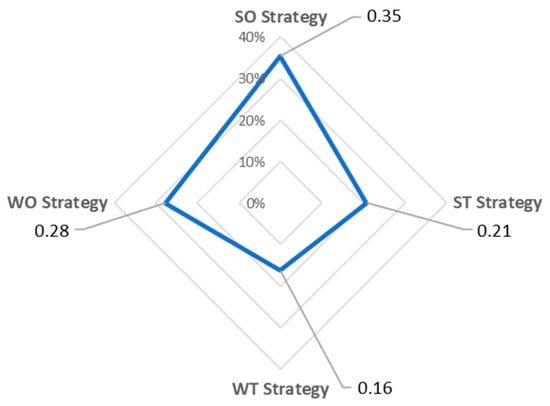
Figure 6.
Strategic quadrilateral of hybrid SWOT- F PIPRECIA-TOWS results.
On the other hand, the order of importance of each management strategy developed is given in Figure 7.
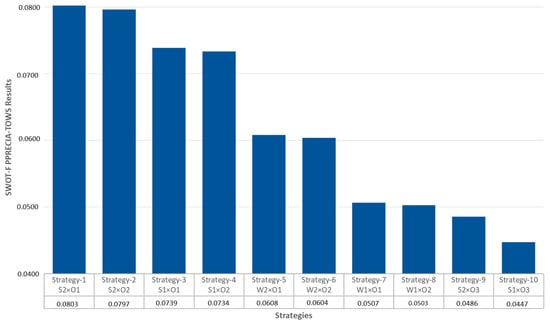
Figure 7.
TOWS Strategy Matrix Developed for Laurel Harvesting.
In this study, 10 priority management strategies for laurel harvesting were proposed. However, which of these 10 strategies should be implemented should be decided by considering the available resources and the situation of NWFPs in the world and in Turkey. First, “Maxi S2 × O1” of the SO with a value of 0.0803 was identified as the most important strategy in the four sector strategies. Basically, it proposes action to avoid the impact of the threats while taking advantage of the strengths. This strategy provides effective investment support for the development of forest-based bioeconomic products. Sustainable economic growth is supported through government incentives, low-interest loans, and training services.
General Strategy (Maxi S × Maxi O): A comprehensive strategy for the development and dissemination of forest-based bioeconomic products has been defined in order to strengthen Turkey’s strategic position to meet 90% of the world’s need for laurel. This strategy targets the establishment of qualified laurel processing facilities and the modernization of existing facilities. Product quality and productivity will be improved by using advanced technology and innovative processing methods. At the same time, the development of bioeconomic products derived from laurel as well as other forest resources will be promoted. The interest of entrepreneurs and investors in this area will be increased by ensuring the effective use of investment support mechanisms such as government incentives, tax reductions, low-interest loans, and infrastructure support. The implementation of positive bioeconomic policies will promote environmental sustainability and support economic growth. In addition, training and consultancy programs will be developed to increase the adaptability and knowledge level of workers in laurel processing and production of forest-based bioeconomic products. To implement this strategy, R&D studies will be carried out to develop new processing technologies and bioeconomic products, financing will be provided through public and private sector cooperation, training programs and information campaigns will be organized for enterprises, and sustainable bioeconomic policies will be developed and implemented. This strategy aims to increase Turkey’s competitiveness in forest-based bioeconomic products and ensure sustainable economic development. The modernization of laurel processing facilities and the encouragement of new investments will consolidate Turkey’s leading position in the global market.
General Strategy (Mini W × Maxi O): This general strategy aims to address problems such as ineffective marketing, inadequate harvest information, and unfair revenue sharing. Through the effective use of investment support mechanisms, government incentives, tax breaks, and low-interest loans will be provided to increase the interest of entrepreneurs and investors in the sector. First, modern marketing strategies will be developed to increase the awareness and demand for laurel products in international markets. In addition, farmers will be provided with modern technologies and training programs to increase harvesting knowledge and productivity, thus improving production processes. By establishing fair revenue-sharing mechanisms, producers will be compensated for their labor and motivation in the sector will be increased. This strategy will not only consolidate Turkey’s leading position in laurel production but will also promote sustainable growth and development in the sector. Training programs and modernization efforts will raise the level of knowledge and technology in the sector, thus optimizing harvesting and production efficiency. As a result, these strategic steps will enable Turkey to become more competitive, efficient, and sustainable in the laurel sector.
In recent years, the demand for laurel products has increased in the world and in Turkey, but this increase in demand may lead to unsustainable harvesting activities [112,113,114]. Some studies have shown that non-wood forest products are both economically and ecologically important in the world’s economies. In these studies, it has been emphasized that with climate change, NWFPs will gain more place and value in local, regional, national, and international forest-based bioeconomies. In addition, it has been stated that environmentally conscious groups prefer ecological products, and certification studies for NWFPs have gained importance. In this context, it is even stated that there are three major organizations (FSC, IFOAM, and FLO) directly related to NWFP certification [109,115]. In fact, the demand for laurel products in the world and in Turkey in recent years is an important problem for the continuity of the laurel species. Perhaps the most important of these problems is the rapid increase in demand for laurel products in the world and the unsustainable irregular collecting activities due to the economic return. In this study, the current situation of laurel collecting as a rural development tool was analyzed and strategies were developed to contribute to sustainable laurel collecting.
4.4. Comparison to Other NWFP Strategies
When studies on laurel harvesting are examined, these publications generally focus on the problems faced by laurel harvesters and the constraints faced by laurel processing and packaging enterprises and selling firms. In addition, some studies address issues related to the place and importance of laurel products in the world economy. Laurel is an important NWFP for rural areas in many Mediterranean and African countries. Especially in developing countries, NWFP crops are seen as a forest-based bioeconomic crop among the main livelihoods of the rural population. For African countries, NWFPs also form an important part of their economies. It is therefore important to develop strategies for the sustainable management of NWFPs in these countries [116,117]. Although botanical, zoological, and anthropological studies have addressed the use of NWFPs, sustainable harvesting and its implications for management and livelihoods have only been studied in recent decades. Today, many studies have shown that forest-based bioeconomic resources are important in a wide range of systems and are incorporated into the livelihood strategies of most rural people. In the last decade, many developing countries have developed forest-basket bioeconomic strategies for NWFP resource valuation studies, resource utilization, and the identification of inventories to understand the context of livelihoods. Some research has suggested that if countries promote NWFPs, this can have positive benefits for the whole society. These benefits have been summarized as strategies to reduce migration to urban areas, reduce pressure on the resource base on communal lands, and stimulate employment and economic activity. In fact, NWFPs have argued that rather than supporting a livelihood, resources are a strategy for meaningful development through increased income-generating opportunities or employment that will result in increased cash flows within local communities [118,119,120,121,122,123,124,125].
Turkey is one of the countries where laurel is intensively harvested. Therefore, studies examining the economic value of laurel harvesting are more common in Turkey. In a study aiming to maximize the yield of laurel leaves, it was examined how yield-enhancing practices can be evaluated economically [72]. In another study, the value added by NWFP crops to the economy of Bartin was calculated and it was stated that a significant part of this return (more than 90%) was obtained from laurel harvest [73]. Studies examining the socio-economic characteristics of laurel producers reveal important dynamics in the sector. According to the findings of these studies, laurel management is becoming more widespread in the villages where production is carried out, but there are deficiencies among producers regarding the laurel processing and packaging process. Deforestation of laurel ecosystems continues, and this raises concerns for the sustainability of natural resources.
In developing countries, laurel leaf is often sold to middlemen by local buyers, while direct cooperative purchases are limited. In addition, studies have shown that laurel harvesting is often seen as an additional source of income and not the main source of livelihood. In rural areas, laurel harvesting is generally carried out by low-income groups. However, a significant proportion of laurel producers and harvesters have a positive view of laurel culture management. These findings provide an important knowledge base to assess the complexity and sustainability of the laurel sector in Turkey [74,75,76,77,78,79,80,81,82,83,84]. Some studies have shown that non-wood forest products are both economically and ecologically important. In these studies, it has been emphasized that with climate change, NWFPs will gain more place and value in local, regional, national, and international economies. In addition, it has been stated that environmentally sensitive groups prefer ecological products, and certification studies for NWFP plants have gained importance [112,113,114].
4.5. Comparison to Other MCDM Studies
Within the scope of the research, a hybrid MCDM approach such as SWOT-Fuzzy PIPRECIA-TOWS was applied, and the opinions of decision makers were analyzed. F-PIPRECIA is a suitable method for the selection of SWOT criteria in decision making problems. In fact, SWOT criteria can be prioritized using AHP only. However, since eight criteria are considered under each SWOT factor in this research, it is not easy to compare 32 criteria one by one using AHP. When seven or more criteria are compared, AHP consistency ratios are usually not at the desired levels. Therefore, AHP alone remains an inadequate solution for problems involving seven or more variables [39,99].
The reason for applying the PIPRECIA method for determining the weights is that it is simple and convenient to use when there are many decision makers in a complex evaluation process. The advantage of the PIPRECIA method over the widely used AHP method is reflected in a simpler calculation procedure that does not reduce the reliability and relevance of the results. Also, the process of evaluating responses from respondents who are not familiar with MCDM methods and the process of evaluating weights using the PIPRECIA method are much more understandable to respondents, in contrast to the AHP method. Comparing the PIPRECIA method with the SWARA method (from which PIPRECIA was developed), it can be concluded that it has certain advantages. In particular, the SWARA method requires the ranking of evaluation criteria according to their intended importance, which complicates its application in group decision-making situations. In such cases, the ranking method should be preferred to comparisons in determining criteria weights. For this purpose, methods such as PIPRECIA, SWARA, TOPSIS, and VIKOR are preferred over AHP [39,99,126]. Stanujkic et al. (2017) [97].
Introduced as an extension of the SWARA method proposed by Keršuliene et al. (2010) [127], the PIPRECIA method offers significant advantages, especially its applicability in group decision-making processes [39]. This method can be used as an important tool for MCDM. Stević et al. (2018) [39] determined weights using fuzzy PIPRECIA in combination with SWOT analysis to determine the conditions for the implementation of barcode technology. Similarly, Blagojević et al. (2020) [128] used the fuzzy PIPRECIA method to calculate the weights of subjective criteria in the assessment of railway safety and complemented their methodology with DEA and Entropy. Đalić et al. (2020) [99] used the same fuzzy method to determine the weights of green supplier selection criteria.
4.6. Limitations and Future Improvements
In this study, only the views of experts in the field were considered in developing a strategy for laurel harvesting, and the views of local people were not included. Likewise, including the views of local people in laurel harvesting efforts is not an easy task, especially when they have little technical expertise or experience. In fact, a more formal way to encourage local participation would be to provide them with the opportunity to acquire some knowledge and skills through non-professional training workshops and exercises. Such training could introduce them to ecological field techniques, mapping, regeneration, yield, and harvesting [129].
On the other hand, in this study, findings were obtained on laurel harvesting in the Bartın region, which is in the north of Turkey. Moreover, in obtaining these findings, 32 SWOT sub-criteria were taken into consideration depending on the DMs’ preferences. Therefore, in the empirical approach to calculations, inferences for strategies were developed based on limited data. In future research, the number of DMs should be revised, and region-specific SWOT sub-criteria should be considered in the application of the hybrid approach in various regions of Turkey and even the world.
On the other hand, in this study, findings on laurel harvesting in Bartın region in the north of Turkey were obtained. In addition, 32 SWOT sub-criteria were taken into account in obtaining these findings depending on the preferences of DMs. Therefore, in the empirical calculations, inferences for strategies were developed based on limited data. In future research, the number of DMs should be reviewed and region-specific SWOT sub-criteria should be taken into account when applying the hybrid approach in various regions of Turkey and even the world.
Translated with www.DeepL.com/Translator (free version)
The SWOT-Fuzzy PIPRECIA-TOWS hybrid approach stands out as a suitable tool for selecting strategies for laurel harvesting or addressing other multi-criteria decision-making challenges. However, this approach comes with some limitations and disadvantages, as described below. In this approach, DMs are asked to make an assessment based only on the criteria identified in this context. The DM must indicate the relative importance of one criterion over another or prefer one alternative to another. However, as the number of alternatives and criteria increases, the pairwise comparison process becomes complex, and the risk of inconsistency arises. For example, there are 8 criteria under the SWOT factor and 32 criteria in total. As the number of criteria under each SWOT factor increases, the ranking process becomes more difficult. For this reason, the Fuzzy PIPRECIA method was preferred in this study instead of AHP or PIPRECIA because it gives more accurate results. In addition, TOWS matrix calculations for prioritization of strategies were also performed with F-PIPRECIA. F-PIPRECIA is seen as one of the most reliable methods in terms of consistency. Therefore, instead of using a single method, there is a need for fuzzy hybrid approaches where more than one method is evaluated together. In this context, many fuzzy MCDM methods such as fuzzy AHP, fuzzy ANP, fuzzy TOPSIS, fuzzy TODIM, fuzzy EDAS, and fuzzy VIKOR are suitable for use with both SWOT and TOWS [99,100,101].
5. Conclusions
Over the last few decades, Turkey’s forests have been providing a broad and multifaceted portfolio of ecosystem services, ranging from supply services such as wood, lignocellulosic biomass, and non-wood products, to regulatory services such as soil erosion prevention, and cultural and non-material services such as recreation, mental health and cultural identity. All these forest services will play an important role in the bioeconomy. In this study, the ecological, economic, and social characteristics of laurel harvesting in the Bartın region of northern Turkey are considered in the context of forest-based bioeconomy. In this way, the current situation of laurel harvesting was analyzed as a whole, and strategies were developed and prioritized.
This study assessed the effectiveness of a hybrid framework for prioritizing management strategies for laurel harvesting to enhance the forest-based bioeconomy. The research revealed that the strategic management of laurel harvesting in Turkey plays a critical role in achieving sustainable development goals. With the hybrid framework, strategic priorities were identified to maximize economic returns while ensuring sustainable management of laurel resources in the Bartın region. If implemented, the “Maxi S2 × Maxi O1” and “Maxi S2 × Maxi O2” strategies, which are highlighted as high priority by DMs within the scope of this study, will make significant contributions to the development of the forest-based bioeconomy, increasing investments in laurel harvesting, maintaining Turkey’s superiority in laurel trade, enhancing the economic welfare of local people through laurel harvesting, and providing protection of biodiversity. Therefore, this study emphasizes that the direct contribution of laurel harvest to local economies and the sustainable use of natural resources support rural development. The hybrid framework presents comprehensive management strategies that consider economic, environmental, and social dimensions. These strategies include key measures such as the implementation of controlled harvesting methods in sensitive areas, awareness raisingm and capacity building of local communities to minimize the impacts of laurel harvesting on the ecosystem. On the other hand, taking DMs’ views into account in developing strategies for the NWFPs provides a solid basis for partnership development, launching new operations, and conflict resolution. This process should be considered as a mechanism that promotes benefit sharing, improves people’s socio-economic lives, and provides opportunities for accountability for sustainable and acceptable rural development in the long term.
Multi-criteria decision-making approaches, especially hybrid methods such as SWOT-Fuzzy PIPRECIA-TOWS, are recognized as appropriate methods for prioritizing management strategies for laurel harvesting to enhance the forest-based bioeconomy. The CWSP framework developed in this study contributed to rational decision making in the MCDM process. On the other hand, this framework effectively reflects the experience of DMs. The weighting of SWOT criteria and prioritization of management strategies were carried out to enhance the bioeconomic-based economy in the region.
For further research, the use and development of analytical methodologies such as the CWSP framework integrated into decision support systems will provide the following advantages:
- The developed CWSP framework can be easily applied to the development and prioritization of other NWFP management strategies.
- The preferences of DMs will be seamlessly integrated into the hybrid MCDM approach.
- The mathematical operations within the CWSP framework will be designed in a hierarchical structure to provide a better understanding of the various features. This structure will enable easier prioritization of strategies to be developed for bioeconomic products and support comprehensive and accurate decision making in the CWSP process. Furthermore, the findings will be supported by sensitivity analysis.
- Strategy results will be presented to all stakeholders in an understandable algorithm, the data used in the CWSP framework will be accessible, and the analyses and calculations will be open to audit.
- In this study, it is emphasized that, with climate change, NWFPs will gain more place and value in local, regional, national, and international economies. Bioeconomy can manifest in different ways in each region. Further research should consider innovative combinations of biotechnological approaches, bi-mass processing capacities, and agro-ecological developments when developing strategies for bioeconomic products. These strategies should include local supply chains. Strategies should focus on forestland goods and services rather than traditional forestry. In forest-based bioeconomic product studies to be carried out at the regional scale, it is necessary to create industrial ecosystems and establish appropriate economic scales. In every regional bioecological product strategy development study, existing natural resources should be utilized in the best way, regional competitive advantages should be evaluated, and international policies and social preferences should be considered. In addition, such studies should address the profound social and economic transformations triggered by urbanization and the shift of the economy towards the service sector. In these transformations, the center of gravity of strategies should be linked to shifts from rural to urban areas and from goods to products and services. Regional-based bioeconomy strategies should be consistent with existing policies. In this way, future studies will be able to relate more concretely to the next generation of rural development plans and regional smart specialization strategies.
In conclusion, sustainable management of forest-based bioeconomic activities such as laurel harvesting can contribute significantly to both the conservation of ecosystem services and the promotion of rural development. In this context, this study provides valuable guidance for policy makers and practitioners in Turkey. The proposed strategies for the sustainable management of laurel harvesting consider the objectives of biodiversity and ecosystem services conservation while enhancing local community participation and benefits. This study provides an important reference source for the further research of bioeconomy strategies (S2 × O1 and S2 × O2) for different NWFPs and offers important insights into how focus activities such as laurel harvesting can be considered within a broader sustainable development framework around the world. These results can form the basis for broader research and policy development on the feasibility and impact of sustainable bioeconomy strategies.
Funding
This research received no external funding.
Data Availability Statement
Data is contained within the article.
Conflicts of Interest
The author declares no conflicts of interest.
Abbreviations
The following abbreviations are used in this manuscript:
| CWSP | Criteria Weighting and Strategy Prioritization |
| MCDM | Multi-Criteria Decision Making |
| DMs | Decision Makers |
| PIPRECIA | Pivot Pairwise Relative Criteria Importance Assessment |
| F-PIPRECIA | Fuzzy PIPRECIA |
| PIPRECIA-I | PIPRECIA Inverse |
| SCC | Spearman’s rank correlation coefficient |
| PCC | Pearson correlation coefficients |
Appendix A
Table A1.
Assessment of the main criteria of SWOT by ten DMs for the fuzzy PIPRECIA.
Table A1.
Assessment of the main criteria of SWOT by ten DMs for the fuzzy PIPRECIA.
| PIPR. | C1 | C2 | C3 | C4 | ||||||
|---|---|---|---|---|---|---|---|---|---|---|
| DM1 | 0.667 | 1.000 | 1.000 | 0.400 | 0.500 | 0.667 | 0.222 | 0.250 | 0.286 | |
| DM2 | 0.400 | 0.500 | 0.667 | 0.333 | 0.400 | 0.500 | 0.222 | 0.250 | 0.286 | |
| DM3 | 0.667 | 1.000 | 1.000 | 0.333 | 0.400 | 0.500 | 0.222 | 0.250 | 0.286 | |
| DM4 | 0.667 | 1.000 | 1.000 | 0.333 | 0.400 | 0.500 | 0.400 | 0.500 | 0.667 | |
| DM5 | 0.667 | 1.000 | 1.000 | 0.333 | 0.400 | 0.500 | 0.222 | 0.250 | 0.286 | |
| DM6 | 0.400 | 0.500 | 0.667 | 0.400 | 0.500 | 0.667 | 0.222 | 0.250 | 0.286 | |
| DM7 | 0.400 | 0.500 | 0.667 | 0.333 | 0.400 | 0.500 | 0.222 | 0.250 | 0.286 | |
| DM8 | 0.400 | 0.500 | 0.667 | 0.333 | 0.400 | 0.500 | 0.222 | 0.250 | 0.286 | |
| DM9 | 0.667 | 1.000 | 1.000 | 0.333 | 0.400 | 0.500 | 0.400 | 0.500 | 0.667 | |
| DM10 | 0.400 | 0.500 | 0.667 | 0.400 | 0.500 | 0.667 | 0.222 | 0.250 | 0.286 | |
| GM | 0.534 | 0.750 | 0.834 | 0.353 | 0.430 | 0.550 | 0.258 | 0.300 | 0.362 | |
Table A2.
Assessment of the main criteria of SWOT by ten DMs for the Inverse fuzzy PIPRECIA.
Table A2.
Assessment of the main criteria of SWOT by ten DMs for the Inverse fuzzy PIPRECIA.
| PIPR.-I | C4 | C3 | C2 | C1 | ||||||
|---|---|---|---|---|---|---|---|---|---|---|
| DM1 | 1.000 | 1.000 | 1.050 | 1.200 | 1.300 | 1.350 | 1.200 | 1.300 | 1.350 | |
| DM2 | 1.000 | 1.000 | 1.050 | 1.100 | 1.150 | 1.200 | 1.200 | 1.300 | 1.350 | |
| DM3 | 1.000 | 1.000 | 1.050 | 1.200 | 1.300 | 1.350 | 1.300 | 1.450 | 1.500 | |
| DM4 | 1.100 | 1.150 | 1.200 | 1.300 | 1.450 | 1.500 | 1.500 | 1.750 | 1.800 | |
| DM5 | 1.100 | 1.150 | 1.200 | 1.100 | 1.150 | 1.200 | 1.200 | 1.300 | 1.350 | |
| DM6 | 1.100 | 1.150 | 1.200 | 1.100 | 1.150 | 1.200 | 1.300 | 1.450 | 1.500 | |
| DM7 | 1.200 | 1.300 | 1.350 | 1.300 | 1.450 | 1.500 | 1.200 | 1.300 | 1.350 | |
| DM8 | 1.000 | 1.000 | 1.050 | 1.300 | 1.450 | 1.500 | 1.200 | 1.300 | 1.350 | |
| DM9 | 1.000 | 1.000 | 1.050 | 1.100 | 1.150 | 1.200 | 1.300 | 1.450 | 1.500 | |
| DM10 | 1.000 | 1.000 | 1.050 | 1.100 | 1.150 | 1.200 | 1.300 | 1.450 | 1.500 | |
| GM | 1.050 | 1.075 | 1.125 | 1.180 | 1.270 | 1.320 | 1.270 | 1.405 | 1.455 | |
Table A3.
Assessment of the Strength Sub-criteria by DMs (F PIPRECIA- Inv. F PIPRECIA).
Table A3.
Assessment of the Strength Sub-criteria by DMs (F PIPRECIA- Inv. F PIPRECIA).
| PIPR. | C1 | C2 | C3 | C4 | C5 | C6 | C7 | C8 | ||||||||||||||
| DM1 | 1.000 | 1.000 | 1.050 | 0.667 | 1.000 | 1.000 | 0.500 | 0.667 | 1.000 | 0.400 | 0.500 | 0.667 | 0.333 | 0.400 | 0.500 | 0.286 | 0.333 | 0.400 | 0.250 | 0.286 | 0.333 | |
| DM2 | 1.000 | 1.000 | 1.050 | 0.667 | 1.000 | 1.000 | 0.500 | 0.667 | 1.000 | 0.400 | 0.500 | 0.667 | 0.333 | 0.400 | 0.500 | 0.286 | 0.333 | 0.400 | 0.250 | 0.286 | 0.333 | |
| DM3 | 1.000 | 1.000 | 1.050 | 0.667 | 1.000 | 1.000 | 0.500 | 0.667 | 1.000 | 0.400 | 0.500 | 0.667 | 0.333 | 0.400 | 0.500 | 0.286 | 0.333 | 0.400 | 0.250 | 0.286 | 0.333 | |
| DM4 | 1.000 | 1.000 | 1.050 | 0.667 | 1.000 | 1.000 | 0.500 | 0.667 | 1.000 | 0.400 | 0.500 | 0.667 | 0.333 | 0.400 | 0.500 | 0.286 | 0.333 | 0.400 | 0.250 | 0.286 | 0.333 | |
| DM5 | 1.000 | 1.000 | 1.050 | 0.667 | 1.000 | 1.000 | 0.500 | 0.667 | 1.000 | 0.400 | 0.500 | 0.667 | 0.333 | 0.400 | 0.500 | 0.286 | 0.333 | 0.400 | 0.250 | 0.286 | 0.333 | |
| DM6 | 1.000 | 1.000 | 1.050 | 0.667 | 1.000 | 1.000 | 0.500 | 0.667 | 1.000 | 0.400 | 0.500 | 0.667 | 0.333 | 0.400 | 0.500 | 0.286 | 0.333 | 0.400 | 0.250 | 0.286 | 0.333 | |
| DM7 | 1.000 | 1.000 | 1.050 | 0.667 | 1.000 | 1.000 | 0.500 | 0.667 | 1.000 | 0.400 | 0.500 | 0.667 | 0.333 | 0.400 | 0.500 | 0.286 | 0.333 | 0.400 | 0.250 | 0.286 | 0.333 | |
| DM8 | 1.000 | 1.000 | 1.050 | 0.667 | 1.000 | 1.000 | 0.500 | 0.667 | 1.000 | 0.400 | 0.500 | 0.667 | 0.333 | 0.400 | 0.500 | 0.286 | 0.333 | 0.400 | 0.250 | 0.286 | 0.333 | |
| DM9 | 1.000 | 1.000 | 1.050 | 0.667 | 1.000 | 1.000 | 0.500 | 0.667 | 1.000 | 0.400 | 0.500 | 0.667 | 0.333 | 0.400 | 0.500 | 0.286 | 0.333 | 0.400 | 0.250 | 0.286 | 0.333 | |
| DM10 | 1.000 | 1.000 | 1.050 | 0.667 | 1.000 | 1.000 | 0.500 | 0.667 | 1.000 | 0.400 | 0.500 | 0.667 | 0.333 | 0.400 | 0.500 | 0.286 | 0.333 | 0.400 | 0.250 | 0.286 | 0.333 | |
| GM | 1.000 | 1.000 | 1.050 | 0.667 | 1.000 | 1.000 | 0.500 | 0.667 | 1.000 | 0.400 | 0.500 | 0.667 | 0.333 | 0.400 | 0.500 | 0.286 | 0.333 | 0.400 | 0.250 | 0.286 | 0.333 | |
| PIPR.-I | C8 | C7 | C6 | C5 | C4 | C3 | C2 | C1 | ||||||||||||||
| DM1 | 1.000 | 1.000 | 1.050 | 1.100 | 1.150 | 1.200 | 1.200 | 1.300 | 1.350 | 1.300 | 1.450 | 1.500 | 1.400 | 1.600 | 1.650 | 1.500 | 1.750 | 1.800 | 0.500 | 0.667 | 1.000 | |
| DM2 | 1.000 | 1.000 | 1.050 | 1.100 | 1.150 | 1.200 | 1.200 | 1.300 | 1.350 | 1.300 | 1.450 | 1.500 | 1.300 | 1.450 | 1.500 | 1.500 | 1.750 | 1.800 | 0.500 | 0.667 | 1.000 | |
| DM3 | 1.000 | 1.000 | 1.050 | 1.100 | 1.150 | 1.200 | 1.200 | 1.300 | 1.350 | 1.300 | 1.450 | 1.500 | 1.400 | 1.600 | 1.650 | 1.500 | 1.750 | 1.800 | 0.667 | 1.000 | 1.000 | |
| DM4 | 1.100 | 1.150 | 1.200 | 1.100 | 1.150 | 1.200 | 1.200 | 1.300 | 1.350 | 1.200 | 1.300 | 1.350 | 1.300 | 1.450 | 1.500 | 1.400 | 1.600 | 1.650 | 0.667 | 1.000 | 1.000 | |
| DM5 | 1.100 | 1.150 | 1.200 | 1.000 | 1.000 | 1.050 | 1.200 | 1.300 | 1.350 | 1.200 | 1.300 | 1.350 | 1.300 | 1.450 | 1.500 | 1.500 | 1.750 | 1.800 | 0.667 | 1.000 | 1.000 | |
| DM6 | 1.100 | 1.150 | 1.200 | 1.000 | 1.000 | 1.050 | 1.100 | 1.150 | 1.200 | 1.300 | 1.450 | 1.500 | 1.400 | 1.600 | 1.650 | 1.500 | 1.750 | 1.800 | 0.667 | 1.000 | 1.000 | |
| DM7 | 1.000 | 1.000 | 1.050 | 1.000 | 1.000 | 1.050 | 1.100 | 1.150 | 1.200 | 1.300 | 1.450 | 1.500 | 1.400 | 1.600 | 1.650 | 1.500 | 1.750 | 1.800 | 0.667 | 1.000 | 1.000 | |
| DM8 | 1.000 | 1.000 | 1.050 | 1.200 | 1.300 | 1.350 | 1.100 | 1.150 | 1.200 | 1.300 | 1.450 | 1.500 | 1.400 | 1.600 | 1.650 | 1.500 | 1.750 | 1.800 | 0.500 | 0.667 | 1.000 | |
| DM9 | 1.000 | 1.000 | 1.050 | 1.100 | 1.150 | 1.200 | 1.200 | 1.300 | 1.350 | 1.200 | 1.300 | 1.350 | 1.400 | 1.600 | 1.650 | 1.500 | 1.750 | 1.800 | 0.500 | 0.667 | 1.000 | |
| DM10 | 1.000 | 1.000 | 1.050 | 1.100 | 1.150 | 1.200 | 1.200 | 1.300 | 1.350 | 1.300 | 1.450 | 1.500 | 1.400 | 1.600 | 1.650 | 1.400 | 1.600 | 1.650 | 0.667 | 1.000 | 1.000 | |
| GM | 1.030 | 1.045 | 1.095 | 1.080 | 1.120 | 1.170 | 1.170 | 1.255 | 1.305 | 1.270 | 1.405 | 1.455 | 1.370 | 1.555 | 1.605 | 1.480 | 1.720 | 1.770 | 0.600 | 0.867 | 1.000 | |
Table A4.
Calculation and results of the Strength Sub-criteria (F PIPRECIA- Inv. F PIPRECIA).
Table A4.
Calculation and results of the Strength Sub-criteria (F PIPRECIA- Inv. F PIPRECIA).
| PIPR. | DF | ||||||||||||
| C1 | 1.000 | 1.000 | 1.000 | 1.000 | 1.000 | 1.000 | 0.255 | 0.206 | 0.167 | 0.207 | |||
| C2 | 1.000 | 1.000 | 1.050 | 1.000 | 1.000 | 0.950 | 1.000 | 1.000 | 1.053 | 0.255 | 0.206 | 0.175 | 0.209 |
| C3 | 0.667 | 1.000 | 1.000 | 1.333 | 1.000 | 1.000 | 0.750 | 1.000 | 1.053 | 0.191 | 0.206 | 0.175 | 0.198 |
| C4 | 0.500 | 0.667 | 1.000 | 1.500 | 1.333 | 1.000 | 0.500 | 0.750 | 1.053 | 0.128 | 0.154 | 0.175 | 0.153 |
| C5 | 0.400 | 0.500 | 0.667 | 1.600 | 1.500 | 1.333 | 0.313 | 0.500 | 0.790 | 0.080 | 0.103 | 0.132 | 0.104 |
| C6 | 0.333 | 0.400 | 0.500 | 1.667 | 1.600 | 1.500 | 0.188 | 0.313 | 0.526 | 0.048 | 0.064 | 0.088 | 0.065 |
| C7 | 0.286 | 0.333 | 0.400 | 1.714 | 1.667 | 1.600 | 0.109 | 0.188 | 0.329 | 0.028 | 0.039 | 0.055 | 0.040 |
| C8 | 0.250 | 0.286 | 0.333 | 1.750 | 1.714 | 1.667 | 0.063 | 0.109 | 0.197 | 0.016 | 0.023 | 0.033 | 0.023 |
| SUM | 3.922 | 4.860 | 6.000 | ||||||||||
| PIPR.-I | DF | ||||||||||||
| C1 | 0.600 | 0.867 | 1.000 | 1.400 | 1.133 | 1.000 | 4.033 | 19.011 | 49.335 | 0.213 | 0.351 | 0.410 | 0.338 |
| C2 | 1.480 | 1.720 | 1.770 | 0.520 | 0.280 | 0.230 | 5.645 | 21.544 | 49.335 | 0.298 | 0.398 | 0.410 | 0.383 |
| C3 | 1.370 | 1.555 | 1.605 | 0.630 | 0.445 | 0.395 | 2.936 | 6.032 | 11.347 | 0.155 | 0.111 | 0.094 | 0.116 |
| C4 | 1.270 | 1.405 | 1.455 | 0.730 | 0.595 | 0.545 | 1.849 | 2.684 | 4.482 | 0.098 | 0.050 | 0.037 | 0.056 |
| C5 | 1.170 | 1.255 | 1.305 | 0.830 | 0.745 | 0.695 | 1.350 | 1.597 | 2.443 | 0.071 | 0.030 | 0.020 | 0.035 |
| C6 | 1.080 | 1.120 | 1.170 | 0.920 | 0.880 | 0.830 | 1.121 | 1.190 | 1.331 | 0.059 | 0.022 | 0.011 | 0.026 |
| C7 | 1.030 | 1.045 | 1.095 | 0.970 | 0.955 | 0.905 | 1.031 | 1.047 | 1.105 | 0.054 | 0.019 | 0.009 | 0.023 |
| C8 | 1.000 | 1.000 | 1.000 | 1.000 | 1.000 | 1.000 | 0.053 | 0.018 | 0.008 | 0.022 | |||
| SUM | 18.965 | 54.106 | 120.378 | ||||||||||
Table A5.
Assessment of the Weakness Sub-criteria by DMs (F PIPRECIA- Inv. F PIPRECIA).
Table A5.
Assessment of the Weakness Sub-criteria by DMs (F PIPRECIA- Inv. F PIPRECIA).
| PIPR. | C1 | C2 | C3 | C4 | C5 | C6 | C7 | C8 | ||||||||||||||
| DM1 | 1.200 | 1.300 | 1.350 | 0.222 | 0.250 | 0.286 | 0.222 | 0.222 | 0.222 | 1.200 | 1.300 | 1.350 | 0.222 | 0.250 | 0.286 | 0.667 | 1.000 | 1.000 | 0.667 | 1.000 | 1.000 | |
| DM2 | 1.100 | 1.150 | 1.200 | 0.222 | 0.250 | 0.286 | 0.222 | 0.250 | 0.286 | 1.100 | 1.150 | 1.200 | 0.222 | 0.250 | 0.286 | 0.667 | 1.000 | 1.000 | 0.667 | 1.000 | 1.000 | |
| DM3 | 1.200 | 1.300 | 1.350 | 0.250 | 0.286 | 0.333 | 0.250 | 0.286 | 0.333 | 1.200 | 1.300 | 1.350 | 0.250 | 0.286 | 0.333 | 0.667 | 1.000 | 1.000 | 0.667 | 1.000 | 1.000 | |
| DM4 | 1.200 | 1.300 | 1.350 | 0.222 | 0.250 | 0.286 | 0.222 | 0.250 | 0.286 | 1.200 | 1.300 | 1.350 | 0.222 | 0.250 | 0.286 | 0.667 | 1.000 | 1.000 | 0.667 | 1.000 | 1.000 | |
| DM5 | 1.100 | 1.150 | 1.200 | 0.250 | 0.286 | 0.333 | 0.222 | 0.250 | 0.286 | 1.100 | 1.150 | 1.200 | 0.250 | 0.286 | 0.333 | 0.667 | 1.000 | 1.000 | 1.200 | 1.300 | 1.350 | |
| DM6 | 1.200 | 1.300 | 1.350 | 0.222 | 0.250 | 0.286 | 0.250 | 0.286 | 0.333 | 1.200 | 1.300 | 1.350 | 0.222 | 0.250 | 0.286 | 0.667 | 1.000 | 1.000 | 1.100 | 1.150 | 1.200 | |
| DM7 | 1.200 | 1.300 | 1.350 | 0.222 | 0.250 | 0.286 | 0.222 | 0.250 | 0.286 | 1.200 | 1.300 | 1.350 | 0.222 | 0.250 | 0.286 | 0.667 | 1.000 | 1.000 | 1.200 | 1.300 | 1.350 | |
| DM8 | 1.100 | 1.150 | 1.200 | 0.250 | 0.286 | 0.333 | 0.250 | 0.286 | 0.333 | 1.100 | 1.150 | 1.200 | 0.250 | 0.286 | 0.333 | 0.667 | 1.000 | 1.000 | 1.200 | 1.300 | 1.350 | |
| DM9 | 1.200 | 1.300 | 1.350 | 0.250 | 0.286 | 0.333 | 0.250 | 0.286 | 0.333 | 1.100 | 1.150 | 1.200 | 0.250 | 0.286 | 0.333 | 0.667 | 1.000 | 1.000 | 0.667 | 1.000 | 1.000 | |
| DM10 | 1.100 | 1.150 | 1.200 | 0.250 | 0.286 | 0.333 | 0.250 | 0.286 | 0.333 | 1.100 | 1.150 | 1.200 | 0.250 | 0.286 | 0.333 | 0.667 | 1.000 | 1.000 | 0.667 | 1.000 | 1.000 | |
| GM | 1.160 | 1.240 | 1.290 | 0.236 | 0.268 | 0.310 | 0.236 | 0.265 | 0.303 | 1.150 | 1.225 | 1.275 | 0.236 | 0.268 | 0.310 | 0.667 | 1.000 | 1.000 | 0.870 | 1.105 | 1.125 | |
| PIPR.-I | C8 | C7 | C6 | C5 | C4 | C3 | C2 | C1 | ||||||||||||||
| DM1 | 0.667 | 1.000 | 1.000 | 1.200 | 1.300 | 1.350 | 1.450 | 1.500 | 0.667 | 1.300 | 1.450 | 1.500 | 0.333 | 0.400 | 0.500 | 1.300 | 1.450 | 1.500 | 0.500 | 0.667 | 1.000 | |
| DM2 | 0.667 | 1.000 | 1.000 | 1.200 | 1.300 | 1.350 | 1.450 | 1.500 | 0.667 | 1.200 | 1.300 | 1.350 | 1.400 | 1.600 | 1.650 | 1.200 | 1.300 | 1.350 | 0.667 | 1.000 | 1.000 | |
| DM3 | 0.667 | 1.000 | 1.000 | 1.200 | 1.300 | 1.350 | 0.333 | 0.400 | 0.500 | 0.333 | 0.400 | 0.500 | 1.400 | 1.600 | 1.650 | 1.400 | 1.600 | 1.650 | 0.667 | 1.000 | 1.000 | |
| DM4 | 0.667 | 1.000 | 1.000 | 1.200 | 1.300 | 1.350 | 1.450 | 1.500 | 0.667 | 0.333 | 0.400 | 0.500 | 0.222 | 0.250 | 0.286 | 1.200 | 1.300 | 1.350 | 0.667 | 1.000 | 1.000 | |
| DM5 | 0.667 | 1.000 | 1.000 | 1.200 | 1.300 | 1.350 | 1.450 | 1.500 | 0.667 | 0.333 | 0.400 | 0.500 | 1.400 | 1.600 | 1.650 | 1.200 | 1.300 | 1.350 | 0.667 | 1.000 | 1.000 | |
| DM6 | 0.667 | 1.000 | 1.000 | 1.200 | 1.300 | 1.350 | 1.450 | 1.500 | 0.667 | 1.400 | 1.600 | 1.650 | 1.400 | 1.600 | 1.650 | 0.667 | 1.000 | 1.000 | 0.667 | 1.000 | 1.000 | |
| DM7 | 0.667 | 1.000 | 1.000 | 1.200 | 1.300 | 1.350 | 1.450 | 1.500 | 0.667 | 1.300 | 1.450 | 1.500 | 1.400 | 1.600 | 1.650 | 0.500 | 0.667 | 1.000 | 0.500 | 0.667 | 1.000 | |
| DM8 | 0.667 | 1.000 | 1.000 | 1.200 | 1.300 | 1.350 | 0.400 | 0.500 | 0.667 | 0.333 | 0.400 | 0.500 | 1.400 | 1.600 | 1.650 | 0.667 | 1.000 | 1.000 | 0.667 | 1.000 | 1.000 | |
| DM9 | 0.667 | 1.000 | 1.000 | 1.200 | 1.300 | 1.350 | 1.450 | 1.500 | 0.667 | 0.333 | 0.400 | 0.500 | 1.400 | 1.600 | 1.650 | 0.667 | 1.000 | 1.000 | 0.667 | 1.000 | 1.000 | |
| DM10 | 0.667 | 1.000 | 1.000 | 1.200 | 1.300 | 1.350 | 0.400 | 0.500 | 0.667 | 1.300 | 1.450 | 1.500 | 1.400 | 1.600 | 1.650 | 0.667 | 1.000 | 1.000 | 0.667 | 1.000 | 1.000 | |
| GM | 0.667 | 1.000 | 1.000 | 1.200 | 1.300 | 1.350 | 1.128 | 1.190 | 0.650 | 0.817 | 0.925 | 1.000 | 1.176 | 1.345 | 1.399 | 0.947 | 1.162 | 1.220 | 0.634 | 0.933 | 1.000 | |
Table A6.
Calculation and results of the Weakness Sub-criteria (F PIPRECIA- Inv. F PIPRECIA).
Table A6.
Calculation and results of the Weakness Sub-criteria (F PIPRECIA- Inv. F PIPRECIA).
| PIPR. | DF | ||||||||||||
| C1 | 1.000 | 1.000 | 1.000 | 1.000 | 1.000 | 1.000 | 0.232 | 0.196 | 0.176 | 0.199 | |||
| C2 | 1.160 | 1.240 | 1.290 | 0.840 | 0.760 | 0.710 | 1.190 | 1.316 | 1.408 | 0.276 | 0.258 | 0.248 | 0.260 |
| C3 | 0.236 | 0.268 | 0.310 | 1.764 | 1.732 | 1.691 | 0.675 | 0.760 | 0.833 | 0.156 | 0.149 | 0.147 | 0.150 |
| C4 | 0.236 | 0.265 | 0.303 | 1.764 | 1.735 | 1.697 | 0.383 | 0.438 | 0.491 | 0.089 | 0.086 | 0.087 | 0.087 |
| C5 | 1.150 | 1.225 | 1.275 | 0.850 | 0.775 | 0.725 | 0.450 | 0.565 | 0.677 | 0.104 | 0.111 | 0.119 | 0.111 |
| C6 | 0.236 | 0.268 | 0.310 | 1.764 | 1.732 | 1.691 | 0.255 | 0.326 | 0.401 | 0.059 | 0.064 | 0.071 | 0.064 |
| C7 | 0.667 | 1.000 | 1.000 | 1.333 | 1.000 | 1.000 | 0.191 | 0.326 | 0.401 | 0.044 | 0.064 | 0.071 | 0.062 |
| C8 | 0.870 | 1.105 | 1.125 | 1.130 | 0.895 | 0.875 | 0.169 | 0.365 | 0.458 | 0.039 | 0.072 | 0.081 | 0.068 |
| SUM | 4.314 | 5.095 | 5.669 | 1.000 | 1.000 | 1.000 | 1.000 | ||||||
| PIPR.-I | DF | ||||||||||||
| C1 | 0.634 | 0.933 | 1.000 | 1.366 | 1.067 | 1.000 | 0.766 | 2.801 | 3.280 | 0.101 | 0.185 | 0.208 | 0.175 |
| C2 | 0.947 | 1.162 | 1.220 | 1.053 | 0.838 | 0.780 | 1.047 | 2.988 | 3.280 | 0.138 | 0.198 | 0.208 | 0.189 |
| C3 | 1.176 | 1.345 | 1.399 | 0.825 | 0.655 | 0.601 | 1.102 | 2.505 | 2.558 | 0.145 | 0.166 | 0.163 | 0.162 |
| C4 | 0.817 | 0.925 | 1.000 | 1.184 | 1.075 | 1.000 | 0.909 | 1.641 | 1.538 | 0.120 | 0.108 | 0.098 | 0.109 |
| C5 | 1.128 | 1.190 | 0.650 | 0.872 | 0.810 | 1.350 | 1.076 | 1.764 | 1.538 | 0.142 | 0.117 | 0.098 | 0.118 |
| C6 | 1.200 | 1.300 | 1.350 | 0.800 | 0.700 | 0.650 | 0.938 | 1.429 | 1.538 | 0.124 | 0.094 | 0.098 | 0.100 |
| C7 | 0.667 | 1.000 | 1.000 | 1.333 | 1.000 | 1.000 | 0.750 | 1.000 | 1.000 | 0.099 | 0.066 | 0.064 | 0.071 |
| C8 | 1.000 | 1.000 | 1.000 | 1.000 | 1.000 | 1.000 | 0.132 | 0.066 | 0.064 | 0.077 | |||
| SUM | 7.588 | 15.127 | 15.733 | ||||||||||
Table A7.
Assessment of the Opportunity Sub-criteria by DMs (F PIPRECIA- Inv. F PIPRECIA).
Table A7.
Assessment of the Opportunity Sub-criteria by DMs (F PIPRECIA- Inv. F PIPRECIA).
| PIPR | C1 | C2 | C3 | C4 | C5 | C6 | C7 | C8 | ||||||||||||||
| DM1 | 0.667 | 1.000 | 1.000 | 0.500 | 0.667 | 1.000 | 0.400 | 0.500 | 0.667 | 0.333 | 0.400 | 0.500 | 0.286 | 0.333 | 0.400 | 0.250 | 0.286 | 0.333 | 1.000 | 1.000 | 1.050 | |
| DM2 | 0.667 | 1.000 | 1.000 | 0.500 | 0.667 | 1.000 | 0.400 | 0.500 | 0.667 | 0.333 | 0.400 | 0.500 | 0.286 | 0.333 | 0.400 | 0.250 | 0.286 | 0.333 | 1.000 | 1.000 | 1.050 | |
| DM3 | 0.667 | 1.000 | 1.000 | 0.500 | 0.667 | 1.000 | 0.400 | 0.500 | 0.667 | 0.333 | 0.400 | 0.500 | 0.286 | 0.333 | 0.400 | 0.250 | 0.286 | 0.333 | 1.000 | 1.000 | 1.050 | |
| DM4 | 0.667 | 1.000 | 1.000 | 0.500 | 0.667 | 1.000 | 0.400 | 0.500 | 0.667 | 0.333 | 0.400 | 0.500 | 0.286 | 0.333 | 0.400 | 0.250 | 0.286 | 0.333 | 1.000 | 1.000 | 1.050 | |
| DM5 | 0.667 | 1.000 | 1.000 | 0.500 | 0.667 | 1.000 | 0.400 | 0.500 | 0.667 | 0.333 | 0.400 | 0.500 | 0.286 | 0.333 | 0.400 | 0.250 | 0.286 | 0.333 | 1.000 | 1.000 | 1.050 | |
| DM6 | 0.667 | 1.000 | 1.000 | 0.500 | 0.667 | 1.000 | 0.400 | 0.500 | 0.667 | 0.333 | 0.400 | 0.500 | 0.286 | 0.333 | 0.400 | 0.250 | 0.286 | 0.333 | 1.000 | 1.000 | 1.050 | |
| DM7 | 0.667 | 1.000 | 1.000 | 0.500 | 0.667 | 1.000 | 0.400 | 0.500 | 0.667 | 0.333 | 0.400 | 0.500 | 0.286 | 0.333 | 0.400 | 0.250 | 0.286 | 0.333 | 1.000 | 1.000 | 1.050 | |
| DM8 | 0.667 | 1.000 | 1.000 | 0.500 | 0.667 | 1.000 | 0.400 | 0.500 | 0.667 | 0.333 | 0.400 | 0.500 | 0.286 | 0.333 | 0.400 | 0.250 | 0.286 | 0.333 | 1.000 | 1.000 | 1.050 | |
| DM9 | 0.667 | 1.000 | 1.000 | 0.500 | 0.667 | 1.000 | 0.400 | 0.500 | 0.667 | 0.333 | 0.400 | 0.500 | 0.286 | 0.333 | 0.400 | 0.250 | 0.286 | 0.333 | 1.000 | 1.000 | 1.050 | |
| DM10 | 0.667 | 1.000 | 1.000 | 0.500 | 0.667 | 1.000 | 0.400 | 0.500 | 0.667 | 0.333 | 0.400 | 0.500 | 0.286 | 0.333 | 0.400 | 0.250 | 0.286 | 0.333 | 1.000 | 1.000 | 1.050 | |
| GM | 0.667 | 1.000 | 1.000 | 0.500 | 0.667 | 1.000 | 0.400 | 0.500 | 0.667 | 0.333 | 0.400 | 0.500 | 0.286 | 0.333 | 0.400 | 0.250 | 0.286 | 0.333 | 1.000 | 1.000 | 1.050 | |
| PIPR.-I | C8 | C7 | C6 | C5 | C4 | C3 | C2 | C1 | ||||||||||||||
| DM1 | 0.667 | 1.000 | 1.000 | 1.100 | 1.150 | 1.200 | 1.100 | 1.150 | 1.200 | 1.200 | 1.300 | 1.350 | 1.300 | 1.450 | 1.500 | 1.400 | 1.600 | 1.650 | 0.667 | 1.000 | 1.000 | |
| DM2 | 0.667 | 1.000 | 1.000 | 1.100 | 1.150 | 1.200 | 1.100 | 1.150 | 1.200 | 1.200 | 1.300 | 1.350 | 1.300 | 1.450 | 1.500 | 1.400 | 1.600 | 1.650 | 0.667 | 1.000 | 1.000 | |
| DM3 | 0.667 | 1.000 | 1.000 | 1.100 | 1.150 | 1.200 | 1.100 | 1.300 | 1.450 | 1.500 | 1.300 | 1.350 | 1.300 | 1.450 | 1.500 | 1.300 | 1.450 | 1.500 | 0.667 | 1.000 | 1.000 | |
| DM4 | 0.667 | 1.000 | 1.000 | 1.200 | 1.300 | 1.350 | 1.100 | 1.150 | 1.200 | 1.200 | 1.300 | 1.350 | 1.300 | 1.450 | 1.500 | 1.100 | 1.150 | 1.200 | 0.667 | 1.000 | 1.000 | |
| DM5 | 0.667 | 1.000 | 1.000 | 1.300 | 1.450 | 1.500 | 1.100 | 1.150 | 1.200 | 1.200 | 1.300 | 1.350 | 1.300 | 1.450 | 1.500 | 1.400 | 1.600 | 1.650 | 0.667 | 1.000 | 1.000 | |
| DM6 | 0.667 | 1.000 | 1.000 | 1.100 | 1.150 | 1.200 | 1.200 | 1.300 | 1.350 | 1.200 | 1.300 | 1.350 | 1.100 | 1.150 | 1.200 | 1.400 | 1.600 | 1.650 | 0.667 | 1.000 | 1.000 | |
| DM7 | 0.667 | 1.000 | 1.000 | 1.100 | 1.150 | 1.200 | 1.100 | 1.150 | 1.200 | 1.100 | 1.150 | 1.200 | 1.300 | 1.450 | 1.500 | 1.400 | 1.600 | 1.650 | 0.667 | 1.000 | 1.000 | |
| DM8 | 0.667 | 1.000 | 1.000 | 1.200 | 1.300 | 1.350 | 1.100 | 1.150 | 1.200 | 1.200 | 1.300 | 1.350 | 1.300 | 1.450 | 1.500 | 1.400 | 1.600 | 1.650 | 0.667 | 1.000 | 1.000 | |
| DM9 | 0.667 | 1.000 | 1.000 | 1.100 | 1.150 | 1.200 | 1.100 | 1.150 | 1.200 | 1.200 | 1.300 | 1.350 | 1.300 | 1.450 | 1.500 | 1.400 | 1.600 | 1.650 | 0.667 | 1.000 | 1.000 | |
| DM10 | 0.667 | 1.000 | 1.000 | 1.100 | 1.150 | 1.200 | 1.100 | 1.150 | 1.200 | 1.100 | 1.150 | 1.200 | 1.300 | 1.450 | 1.500 | 1.400 | 1.600 | 1.650 | 0.667 | 1.000 | 1.000 | |
| GM | 0.667 | 1.000 | 1.000 | 1.140 | 1.210 | 1.260 | 1.110 | 1.180 | 1.240 | 1.210 | 1.270 | 1.320 | 1.280 | 1.420 | 1.470 | 1.360 | 1.540 | 1.590 | 0.667 | 1.000 | 1.000 | |
Table A8.
Calculation and results of the Opportunity Sub-criteria (F PIPRECIA- Inv. F PIPRECIA).
Table A8.
Calculation and results of the Opportunity Sub-criteria (F PIPRECIA- Inv. F PIPRECIA).
| PIPR. | DF | ||||||||||||
| C1 | 1.000 | 1.000 | 1.000 | 1.000 | 1.000 | 1.000 | 0.335 | 0.252 | 0.202 | 0.257 | |||
| C2 | 0.667 | 1.000 | 1.000 | 1.333 | 1.000 | 1.000 | 0.750 | 1.000 | 1.000 | 0.251 | 0.252 | 0.202 | 0.244 |
| C3 | 0.500 | 0.667 | 1.000 | 1.500 | 1.333 | 1.000 | 0.500 | 0.750 | 1.000 | 0.168 | 0.189 | 0.202 | 0.188 |
| C4 | 0.400 | 0.500 | 0.667 | 1.600 | 1.500 | 1.333 | 0.313 | 0.500 | 0.750 | 0.105 | 0.126 | 0.152 | 0.127 |
| C5 | 0.333 | 0.400 | 0.500 | 1.667 | 1.600 | 1.500 | 0.188 | 0.313 | 0.500 | 0.063 | 0.079 | 0.101 | 0.080 |
| C6 | 0.286 | 0.333 | 0.400 | 1.714 | 1.667 | 1.600 | 0.109 | 0.188 | 0.313 | 0.037 | 0.047 | 0.063 | 0.048 |
| C7 | 0.250 | 0.286 | 0.333 | 1.750 | 1.714 | 1.667 | 0.063 | 0.109 | 0.188 | 0.021 | 0.028 | 0.038 | 0.028 |
| C8 | 1.000 | 1.000 | 1.050 | 1.000 | 1.000 | 0.950 | 0.063 | 0.109 | 0.197 | 0.021 | 0.028 | 0.040 | 0.029 |
| SUM | 2.985 | 3.969 | 4.948 | ||||||||||
| PIPR.-I | DF | ||||||||||||
| C1 | 0.667 | 1.000 | 1.000 | 1.333 | 1.000 | 1.000 | 2.020 | 7.926 | 13.449 | 0.179 | 0.300 | 0.331 | 0.285 |
| C2 | 1.360 | 1.540 | 1.590 | 0.640 | 0.460 | 0.410 | 2.692 | 7.926 | 13.449 | 0.239 | 0.300 | 0.331 | 0.295 |
| C3 | 1.280 | 1.420 | 1.470 | 0.720 | 0.580 | 0.530 | 1.723 | 3.646 | 5.514 | 0.153 | 0.138 | 0.136 | 0.140 |
| C4 | 1.210 | 1.270 | 1.320 | 0.790 | 0.730 | 0.680 | 1.241 | 2.115 | 2.922 | 0.110 | 0.080 | 0.072 | 0.084 |
| C5 | 1.110 | 1.180 | 1.240 | 0.890 | 0.820 | 0.760 | 0.980 | 1.544 | 1.987 | 0.087 | 0.058 | 0.049 | 0.062 |
| C6 | 1.140 | 1.210 | 1.260 | 0.860 | 0.790 | 0.740 | 0.872 | 1.266 | 1.351 | 0.077 | 0.048 | 0.033 | 0.050 |
| C7 | 0.667 | 1.000 | 1.000 | 1.333 | 1.000 | 1.000 | 0.750 | 1.000 | 1.000 | 0.067 | 0.038 | 0.025 | 0.040 |
| C8 | 1.000 | 1.000 | 1.000 | 1.000 | 1.000 | 1.000 | 0.089 | 0.038 | 0.025 | 0.044 | |||
| SUM | 11.279 | 26.422 | 40.673 | ||||||||||
Table A9.
Assessment of the Threat Sub-criteria by DMs (F PIPRECIA- Inv. F PIPRECIA).
Table A9.
Assessment of the Threat Sub-criteria by DMs (F PIPRECIA- Inv. F PIPRECIA).
| PIPR | C1 | C2 | C3 | C4 | C5 | C6 | C7 | C8 | ||||||||||||||
| DM1 | 1.000 | 1.000 | 1.050 | 1.000 | 1.000 | 1.050 | 1.000 | 1.000 | 1.050 | 0.667 | 1.000 | 1.000 | 0.667 | 1.000 | 1.000 | 0.667 | 1.000 | 1.000 | 0.667 | 1.000 | 1.000 | |
| DM2 | 1.000 | 1.000 | 1.050 | 1.000 | 1.000 | 1.050 | 1.000 | 1.000 | 1.050 | 0.667 | 1.000 | 1.000 | 0.667 | 1.000 | 1.000 | 0.667 | 1.000 | 1.000 | 0.667 | 1.000 | 1.000 | |
| DM3 | 1.000 | 1.000 | 1.050 | 1.000 | 1.000 | 1.050 | 1.000 | 1.000 | 1.050 | 0.667 | 1.000 | 1.000 | 0.667 | 1.000 | 1.000 | 0.667 | 1.000 | 1.000 | 0.667 | 1.000 | 1.000 | |
| DM4 | 1.000 | 1.000 | 1.050 | 1.000 | 1.000 | 1.050 | 1.000 | 1.000 | 1.050 | 0.667 | 1.000 | 1.000 | 0.667 | 1.000 | 1.000 | 0.667 | 1.000 | 1.000 | 0.667 | 1.000 | 1.000 | |
| DM5 | 1.000 | 1.000 | 1.050 | 1.000 | 1.000 | 1.050 | 1.000 | 1.000 | 1.050 | 0.667 | 1.000 | 1.000 | 0.667 | 1.000 | 1.000 | 0.667 | 1.000 | 1.000 | 0.667 | 1.000 | 1.000 | |
| DM6 | 1.000 | 1.000 | 1.050 | 1.000 | 1.000 | 1.050 | 1.000 | 1.000 | 1.050 | 0.667 | 1.000 | 1.000 | 0.667 | 1.000 | 1.000 | 0.667 | 1.000 | 1.000 | 0.667 | 1.000 | 1.000 | |
| DM7 | 1.000 | 1.000 | 1.050 | 1.000 | 1.000 | 1.050 | 1.000 | 1.000 | 1.050 | 0.667 | 1.000 | 1.000 | 0.667 | 1.000 | 1.000 | 0.667 | 1.000 | 1.000 | 0.667 | 1.000 | 1.000 | |
| DM8 | 1.000 | 1.000 | 1.050 | 1.000 | 1.000 | 1.050 | 1.000 | 1.000 | 1.050 | 0.667 | 1.000 | 1.000 | 0.667 | 1.000 | 1.000 | 0.667 | 1.000 | 1.000 | 0.667 | 1.000 | 1.000 | |
| DM9 | 1.000 | 1.000 | 1.050 | 1.000 | 1.000 | 1.050 | 1.000 | 1.000 | 1.050 | 0.667 | 1.000 | 1.000 | 0.667 | 1.000 | 1.000 | 0.667 | 1.000 | 1.000 | 0.667 | 1.000 | 1.000 | |
| DM10 | 1.000 | 1.000 | 1.050 | 1.000 | 1.000 | 1.050 | 1.000 | 1.000 | 1.050 | 0.667 | 1.000 | 1.000 | 0.667 | 1.000 | 1.000 | 0.667 | 1.000 | 1.000 | 0.667 | 1.000 | 1.000 | |
| GM | 1.000 | 1.000 | 1.050 | 1.000 | 1.000 | 1.050 | 1.000 | 1.000 | 1.050 | 0.667 | 1.000 | 1.000 | 0.667 | 1.000 | 1.000 | 0.667 | 1.000 | 1.000 | 0.667 | 1.000 | 1.000 | |
| PIPR.-I | C8 | C7 | C6 | C5 | C4 | C3 | C2 | C1 | ||||||||||||||
| DM1 | 1.000 | 1.000 | 1.050 | 1.100 | 1.150 | 1.200 | 1.100 | 1.150 | 1.200 | 1.100 | 1.150 | 1.200 | 0.667 | 1.000 | 1.000 | 1.000 | 1.000 | 1.050 | 0.667 | 1.000 | 1.000 | |
| DM2 | 1.100 | 1.150 | 1.200 | 1.100 | 1.150 | 1.200 | 1.100 | 1.150 | 1.200 | 1.100 | 1.150 | 1.200 | 1.000 | 1.000 | 1.050 | 0.667 | 1.000 | 1.000 | 0.667 | 1.000 | 1.000 | |
| DM3 | 1.100 | 1.150 | 1.200 | 1.100 | 1.150 | 1.200 | 1.100 | 1.150 | 1.200 | 1.100 | 1.150 | 1.200 | 0.667 | 1.000 | 1.000 | 0.667 | 1.000 | 1.000 | 0.667 | 1.000 | 1.000 | |
| DM4 | 1.100 | 1.150 | 1.200 | 1.000 | 1.000 | 1.050 | 1.100 | 1.150 | 1.200 | 0.667 | 1.000 | 1.000 | 0.667 | 1.000 | 1.000 | 0.667 | 1.000 | 1.000 | 0.667 | 1.000 | 1.000 | |
| DM5 | 1.100 | 1.150 | 1.200 | 1.100 | 1.150 | 1.200 | 1.100 | 1.150 | 1.200 | 1.100 | 1.150 | 1.200 | 0.667 | 1.000 | 1.000 | 0.667 | 1.000 | 1.000 | 1.000 | 1.000 | 1.050 | |
| DM6 | 1.100 | 1.150 | 1.200 | 1.100 | 1.150 | 1.200 | 1.100 | 1.150 | 1.200 | 1.100 | 1.150 | 1.200 | 0.667 | 1.000 | 1.000 | 0.667 | 1.000 | 1.000 | 0.667 | 1.000 | 1.000 | |
| DM7 | 1.100 | 1.150 | 1.200 | 1.100 | 1.150 | 1.200 | 1.000 | 1.000 | 1.050 | 1.100 | 1.150 | 1.200 | 0.667 | 1.000 | 1.000 | 0.667 | 1.000 | 1.000 | 0.667 | 1.000 | 1.000 | |
| DM8 | 1.100 | 1.150 | 1.200 | 1.100 | 1.150 | 1.200 | 1.100 | 1.150 | 1.200 | 0.667 | 1.000 | 1.000 | 0.667 | 1.000 | 1.000 | 0.667 | 1.000 | 1.000 | 0.667 | 1.000 | 1.000 | |
| DM9 | 1.100 | 1.150 | 1.200 | 1.100 | 1.150 | 1.200 | 1.100 | 1.150 | 1.200 | 1.100 | 1.150 | 1.200 | 0.667 | 1.000 | 1.000 | 0.667 | 1.000 | 1.000 | 0.667 | 1.000 | 1.000 | |
| DM10 | 1.100 | 1.150 | 1.200 | 1.100 | 1.150 | 1.200 | 1.100 | 1.150 | 1.200 | 1.100 | 1.150 | 1.200 | 0.667 | 1.000 | 1.000 | 0.667 | 1.000 | 1.000 | 0.667 | 1.000 | 1.000 | |
| GM | 1.090 | 1.135 | 1.185 | 1.090 | 1.135 | 1.185 | 1.090 | 1.135 | 1.185 | 1.013 | 1.120 | 1.160 | 0.700 | 1.000 | 1.005 | 0.700 | 1.000 | 1.005 | 0.700 | 1.000 | 1.005 | |
Table A10.
Calculation and results of the Threat Sub-criteria (F PIPRECIA- Inv. F PIPRECIA).
Table A10.
Calculation and results of the Threat Sub-criteria (F PIPRECIA- Inv. F PIPRECIA).
| PIPR. | DF | ||||||||||||
| C1 | 1.000 | 1.000 | 1.000 | 1.000 | 1.000 | 1.000 | 0.165 | 0.125 | 0.111 | 0.129 | |||
| C2 | 1.000 | 1.000 | 1.050 | 1.000 | 1.000 | 0.950 | 1.000 | 1.000 | 1.053 | 0.165 | 0.125 | 0.117 | 0.130 |
| C3 | 1.000 | 1.000 | 1.050 | 1.000 | 1.000 | 0.950 | 1.000 | 1.000 | 1.108 | 0.165 | 0.125 | 0.123 | 0.131 |
| C4 | 1.000 | 1.000 | 1.050 | 1.000 | 1.000 | 0.950 | 1.000 | 1.000 | 1.166 | 0.165 | 0.125 | 0.130 | 0.132 |
| C5 | 0.667 | 1.000 | 1.000 | 1.333 | 1.000 | 1.000 | 0.750 | 1.000 | 1.166 | 0.124 | 0.125 | 0.130 | 0.126 |
| C6 | 0.667 | 1.000 | 1.000 | 1.333 | 1.000 | 1.000 | 0.563 | 1.000 | 1.166 | 0.093 | 0.125 | 0.130 | 0.120 |
| C7 | 0.667 | 1.000 | 1.000 | 1.333 | 1.000 | 1.000 | 0.422 | 1.000 | 1.166 | 0.070 | 0.125 | 0.130 | 0.117 |
| C8 | 0.667 | 1.000 | 1.000 | 1.333 | 1.000 | 1.000 | 0.317 | 1.000 | 1.166 | 0.052 | 0.125 | 0.130 | 0.114 |
| SUM | 6.052 | 8.000 | 8.992 | ||||||||||
| PIPR.-I | DF | ||||||||||||
| C1 | 0.700 | 1.000 | 1.005 | 1.300 | 1.000 | 0.995 | 0.613 | 1.756 | 2.166 | 0.073 | 0.146 | 0.153 | 0.135 |
| C2 | 0.700 | 1.000 | 1.005 | 1.300 | 1.000 | 0.995 | 0.796 | 1.756 | 2.155 | 0.095 | 0.146 | 0.153 | 0.138 |
| C3 | 0.700 | 1.000 | 1.005 | 1.300 | 1.000 | 0.995 | 1.035 | 1.756 | 2.144 | 0.123 | 0.146 | 0.152 | 0.143 |
| C4 | 1.013 | 1.120 | 1.160 | 0.987 | 0.880 | 0.840 | 1.345 | 1.756 | 2.134 | 0.160 | 0.146 | 0.151 | 0.149 |
| C5 | 1.090 | 1.135 | 1.185 | 0.910 | 0.865 | 0.815 | 1.327 | 1.545 | 1.792 | 0.158 | 0.128 | 0.127 | 0.133 |
| C6 | 1.090 | 1.135 | 1.185 | 0.910 | 0.865 | 0.815 | 1.208 | 1.336 | 1.506 | 0.143 | 0.111 | 0.107 | 0.116 |
| C7 | 1.090 | 1.135 | 1.185 | 0.910 | 0.865 | 0.815 | 1.099 | 1.156 | 1.227 | 0.130 | 0.096 | 0.087 | 0.100 |
| C8 | 1.000 | 1.000 | 1.000 | 1.000 | 1.000 | 1.000 | 0.119 | 0.083 | 0.071 | 0.087 | |||
| SUM | 8.422 | 12.061 | 14.124 | 1.000 | 1.000 | 1.000 | 1.000 | ||||||
Source: the authors.
Table A11.
Top 10 TOWS Strategies for laurel harvesting (Total Weight > 0.05).
Table A11.
Top 10 TOWS Strategies for laurel harvesting (Total Weight > 0.05).
| Internal Factors | External Factors | Alternatives | |||||
|---|---|---|---|---|---|---|---|
| Strength & Weakness | Weight ) | Opportunity & Threat | Weight ) | Combination | Total Weight | Strategy Rank | Described |
| S2 | 0.296 | O1 | 0.271 | S2 × O1 | 0.08 | 1 | Strategy-1 |
| S2 | 0.296 | O2 | 0.269 | S2 × O2 | 0.08 | 2 | Strategy-2 |
| S1 | 0.273 | O1 | 0.271 | S1 × O1 | 0.07 | 3 | Strategy-3 |
| S1 | 0.273 | O2 | 0.269 | S1 × O2 | 0.07 | 4 | Strategy-4 |
| W2 | 0.224 | O1 | 0.271 | W2 × O1 | 0.06 | 5 | Strategy-5 |
| W2 | 0.224 | O2 | 0.269 | W2 × O2 | 0.06 | 6 | Strategy-6 |
| W1 | 0.187 | O1 | 0.271 | W1 × O1 | 0.05 | 7 | Strategy-7 |
| W1 | 0.187 | O2 | 0.269 | W1 × O2 | 0.05 | 8 | Strategy-8 |
| S2 | 0.296 | O3 | 0.164 | S2 × O3 | 0.05 | 9 | Strategy-9 |
| S1 | 0.296 | O3 | 0.167 | S1 × O3 | 0.05 | 10 | Strategy-10 |
| S2 | 0.296 | O1 | 0.271 | S3 × O1 | 0.04 | 11 | - |
| S3 | 0.157 | O1 | 0.271 | S3 × O2 | 0.04 | 12 | - |
| S3 | 0.157 | O2 | 0.269 | W3 × O1 | 0.04 | 13 | - |
| W3 | 0.156 | O1 | 0.271 | W3 × O2 | 0.04 | 14 | - |
| W3 | 0.156 | O2 | 0.269 | S2 × T4 | 0.04 | 15 | - |
| S2 | 0.296 | T4 | 0.141 | S2 × T3 | 0.04 | 16 | - |
| S2 | 0.296 | T3 | 0.137 | S2 × T2 | 0.04 | 17 | - |
| S2 | 0.296 | T2 | 0.134 | S1 × T4 | 0.04 | 18 | - |
| S1 | 0.296 | T4 | 0.141 | S1 × T3 | 0.04 | 19 | - |
| S1 | 0.296 | T3 | 0.137 | W2 × O3 | 0.04 | 20 | - |
| W2 | 0.187 | O3 | 0.167 | S1 × T2 | 0.04 | 21 | - |
| S1 | 0.296 | T2 | 0.134 | W2 × T4 | 0.03 | 22 | - |
| W2 | 0.224 | T4 | 0.141 | W2 × T3 | 0.03 | 23 | - |
| W2 | 0.224 | T3 | 0.137 | W1 × O3 | 0.03 | 24 | - |
| W1 | 0.187 | O3 | 0.167 | W2 × T2 | 0.03 | 25 | - |
| W2 | 0.224 | T2 | 0.134 | W1 × T4 | 0.03 | 26 | - |
| W1 | 0.187 | T4 | 0.141 | S3 × O3 | 0.03 | 27 | - |
| S3 | 0.157 | O3 | 0.167 | W1 × T3 | 0.03 | 28 | - |
| W1 | 0.187 | T3 | 0.137 | W3 × O3 | 0.03 | 29 | - |
| W3 | 0.156 | O3 | 0.167 | W1 × T2 | 0.03 | 30 | - |
| W1 | 0.187 | T2 | 0.134 | S3 × T4 | 0.02 | 31 | - |
| S3 | 0.157 | T4 | 0.141 | W3 × T4 | 0.02 | 32 | - |
| W3 | 0.156 | T4 | 0.141 | S3 × T3 | 0.02 | 33 | - |
| S3 | 0.157 | T3 | 0.137 | W3 × T3 | 0.02 | 34 | - |
| W3 | 0.156 | T3 | 0.137 | S3 × T2 | 0.02 | 35 | - |
| S3 | 0.157 | T2 | 0.134 | W3 × T2 | 0.02 | 36 | - |
Source: the authors.
References
- EC. New EU Forest Strategy for 2030 Communication from the Commission to the European Parliament, the Council, the European Economic and Social Committee and the Committee of the Regions; COM/2021/572 Final. 2021. Available online: https://eur-lex.europa.eu/legal-content/EN/TXT/?uri=CELEX:52021DC0572 (accessed on 10 January 2024).
- Weiss, G.; Emery, M.R.; Corradini, G.; Zivojinovic, I. New Values of Non-Wood Forest Products. Forests 2020, 11, 165. [Google Scholar] [CrossRef]
- Forest Europe. State of Europe’s Forests 2020; Ministerial Conference on the Protection of Forests in Europe, 2020. FOREST EUROPE Liaison Unit Madrid. Available online: https://foresteurope.org/state-of-europes-forests/ (accessed on 3 February 2023).
- FAO. Towards a Harmonized Definition of Non-Wood Forest Products. 1999. Available online: https://www.fao.org/4/XII/0365-A2.htm (accessed on 22 January 2024).
- DPT. Eighth Five-Year Development Plan, Rural Development Specialization Commission Report. 2000. Available online: https://www.sbb.gov.tr/wp-content/uploads/2022/07/Long-term_Strategy_and_Eight_Five_Year_Development_Plan_2001-2005.pdf (accessed on 17 February 2023).
- Dhar, U.; Manjkhola, S.; Joshi, M.; Bhatt, A.; Bisht, A.K.; Joshi, M. Current status and future strategy for development of medicinal plants sector in Uttaranchal, India. Curr. Sci. 2002, 83, 956–964. [Google Scholar]
- Karki, M.B. The organic production of medicinal and aromatic plants: A strategy for improved value addition and marketing of products from the Himalayas. In Proceedings of the Regional Workshop on Wise Practices and Experiential Learning in Conservation and Management of Himalayan Medicinal Plants, Kathmandu, Nepal, 15–20 December 2005; Ministry of Forests and Soil Conservation: Kathmandu, Nepal, 2005; pp. 56–69. [Google Scholar]
- Blanco, J.A.; Zavala, M.A.; Imbert, J.B.; Castillo, F.J. Sustainability of forest management practices: Evaluation through a simulation model of nutrient cycling. For. Ecol. Manag. 2005, 213, 209–228. [Google Scholar] [CrossRef]
- FAO. Report of the International Expert Consultation on Non-Wood Forest Products. 1995. Available online: https://openknowledge.fao.org/server/api/core/bitstreams/e66ff8c4-a376-4f36-b767-7134e8c6fb39/content (accessed on 24 February 2023).
- Leakey, R.B.; Temu, A.B.; Melynk, M.; Vantomme, P. Domestication and Commercialization of Non-Timber Forest Products. Non-Wood For. Prod. Ser. 1996, 9, Rome. 92-5-103935-6. [Google Scholar]
- Okigbo, R.N.; Eme, U.E.; Ogbogu, S. Biodiversity and conservation of medicinal and aromatic plants in Africa. Biotechnol. Mol. Biol. Rev. 2008, 3, 127–134. [Google Scholar]
- Acıbuca, V.; Budak, D.B. Place and Importance of Medicinal and Aromatic Plants in the World and Turkey. J. Agric. Food Sci. 2018, 33, 37–44. [Google Scholar]
- Forest Europe; UNECE; FAO. State of Europe’s Forests 2011; Status and Trends in Sustainable Forest Management in Europe; UNECE: Geneva, Switzerland, 2011. [Google Scholar]
- European Forest Institute. Implementing Criteria and Indicators for Sustainable Forest Management in Europe; European Forest Institute: Joensuu, Finland, 2013. [Google Scholar]
- Das, R.C.; Chatterjee, T.; Ivaldi, E. Co-movements of income and urbanization through energy use and pollution: An investigation for world’s leading polluting countries. Ecol. Indic. 2023, 153, 110381. [Google Scholar] [CrossRef]
- Atmış, E.; Günşen, H.B. Effect of urbanization on transformation of forestry in Turkey (Period of 1990–2010). J. Fac. For. Istanb. Univ. 2016, 66, 16–29. [Google Scholar] [CrossRef]
- Janse, G.; Ottitsch, A. Factors influencing the role of non-wood forest products and services. For. Policy Econ. 2005, 7, 309–319. [Google Scholar] [CrossRef]
- Güngör, E.; Çoban, M. Analysis of Laurel Harvesting as a Rural Development Tool. J. Bartin Fac. For. 2024, 26, 119–136. [Google Scholar] [CrossRef]
- Yang, X.; Skidmore, A.K.; Melick, D.R.; Zhou, Z.; Xu, J. Mapping non-wood forest product (matsutake mushrooms) using logistic regression and a GIS expert system. Ecol. Model. 2006, 198, 208–218. [Google Scholar] [CrossRef]
- Seeland, K.; Kilchling, P.; Hansmann, R. Urban consumers’ attitudes towards nonwood forest products and services in Switzerland and an assessment of their market potential. Small-Scale For. 2007, 6, 443–452. [Google Scholar] [CrossRef]
- Heubach, K.; Wittig, R.; Nuppenau, E.A.; Hahn, K. The economic importance of non-timber forest products (NTFPs) for livelihood maintenance of rural west African communities: A case study from northern Benin. Ecol. Econ. 2011, 70, 1991–2001. [Google Scholar] [CrossRef]
- Korkmaz, M.; Dündar, N. Factors affecting consumers’ purchasing preferences for non-wood forest products. Turkish J. For. 2009, 20, 213–220. [Google Scholar] [CrossRef]
- Kurt, R.; Karayılmazlar, S.; Imren, E.; Cabuk, Y. Non-wood forest products in Turkey’s forestry sector: Export analysis. J. Bartın For. Fac. 2016, 18, 158–167. [Google Scholar] [CrossRef]
- Huber, P.; Hujala, T.; Kurttila, M.; Wolfslehner, B.; Vacik, H. Application of multi criteria analysis methods for a participatory assessment of non-wood forest products in two European case studies. For. Policy Econ. 2019, 103, 103–111. [Google Scholar] [CrossRef]
- Muttilainen, H.; Vilko, J. Heterogenising forestry value production—Drivers and barriers of entering the non-wood forest products sector. Curr. Res. Environ. Sustain. 2022, 4, 100141. [Google Scholar] [CrossRef]
- Karabasevic, D.; Popovic, G.; Stanujkic, D.; Maksimovic, M.; Sava, C. An approach for hotel type selection based on the Single-Valued Intuitionistic Fuzzy Numbers. Int. Rev. 2019, 1–2, 7–14. [Google Scholar] [CrossRef]
- Subotić, M.; Stević, B.; Ristić, B.; Simić, S. The selection of a location for potential roundabout construction—A case study of Doboj. Oper. Res. Eng. Sci. Theory Appl. 2020, 3, 41–56. [Google Scholar] [CrossRef]
- MacCrimmon, K.R. Decision Marking among Multiple-Attribute Alternatives: A Survey and Consolidated Approach; RAND Memorandum, RM-4823-ARPA; Rand Corporation: Santa Monica, CA, USA, 1968. [Google Scholar]
- Saaty, T.L. The Analytic Hierarchy Process for Decision in a Complex World; RWS Publications: Pittsburgh, PA, USA, 1980. [Google Scholar]
- Hwang, C.L.; Yoon, K. Multiple Attribute Decision Making: Methods and Applications; Springer: Berlin/Heidelberg, Germany, 1981. [Google Scholar]
- Brans, J.P.; Vincke, P. A preference ranking organization method: The PROMETHEE method for MCDM. Manag. Sci. 1985, 31, 647–656. [Google Scholar] [CrossRef]
- Roy, B. The outranking approach and the foundations of electre methods. Theory Decis. 1991, 31, 49–73. [Google Scholar] [CrossRef]
- Opricovic, S. Multicriteria Optimization of Civil Engineering Systems; Faculty of Civil Engineering: Belgrade, Serbia, 1998. (In Serbian) [Google Scholar]
- Zadeh, L. Fuzzy sets. Inf. Control 1965, 8, 338–353. [Google Scholar] [CrossRef]
- Atanassov, K.T. Intuitionistic fuzzy sets. Fuzzy Sets Syst. 1986, 20, 87–96. [Google Scholar] [CrossRef]
- Wang, G.; Li, X. Correlation and information energy of interval-valued fuzzy numbers. Fuzzy Sets Syst. 1999, 103, 169–175. [Google Scholar] [CrossRef]
- Lee, K.M. Bipolar-valued fuzzy sets and their basic operations. In Proceedings of the International Conference on Intelligent Technologies, Bangkok, Thailand, 12–14 December 2000; pp. 307–317. [Google Scholar]
- Puška, A.; Pamucar, D.; Stojanović, I.; Cavallaro, F.; Kaklauskas, A.; Mardani, A. Examination of the sustainable rural tourism potential of the brčko district of bosnia and herzegovina using a fuzzy approach based on group decision making. Sustainability 2021, 13, 583. [Google Scholar] [CrossRef]
- Stević, Ž.; Stjepanović, Ž.; Božičković, Z.; Das, D.K.; Stanujkić, D. Assessment of conditions for implementing information technology in a warehouse system: A novel fuzzy PIPRECIA method. Symmetry 2018, 10, 586. [Google Scholar] [CrossRef]
- Boral, S.; Howard, I.; Chaturvedi, S.K.; McKee, K.; Naikan, V.N.A. An integrated approach for fuzzy failure modes and effects analysis using fuzzy AHP and fuzzy MAIRCA. Eng. Fail. Anal. 2020, 108, 104195. [Google Scholar] [CrossRef]
- OGM. Laurel Action Plan 2016–2020. General Directorate of Forestry Publication. 2016. Available online: https://www.ogm.gov.tr/tr/e-kutuphane-sitesi/Yayinlar/Defne_Eylem_Plani.pdf (accessed on 9 February 2023).
- UNDP. Non-Wood Forest Products Production Laurel Value Chain Analysis. 2008. Available online: https://www.undp.org/sites/g/files/zskgke326/files/migration/tr/defne_hq.pdf (accessed on 3 February 2023).
- Chamberlain, J.; Bush, R.; Hammett, A.L. Non-Timber Forest Products. The Other Forest Products. For. Prod. J. 1998, 48, 10–18. [Google Scholar]
- CBD. Sustainable Management of Non-Timber Forest Resources; Technical Series No:6; CBD: Montreal, QC, Canada, 2001. [Google Scholar]
- Sharrock, S.; Oldfield, S.; Wilson, O. Plant Conservation Report 2014: A Review of Progress in Implementation of the Global Strategy for Plant Conservation 2011–2020; Technical Series No. 81. ss.56; Secretariat of the Convention on Biological Diversity, Montréal, Canada and Botanic Gardens Conservation International: Richmond, UK, 2014. [Google Scholar]
- United Nations, General Assembly. The Road to Dignity by 2030: Ending Poverty, Transforming All Lives and Protecting the Planet (Synthesis Report of the Secretary-General on the Post-2015 Sustainable Development Agenda). A/69/700; Rio de Janeiro, Brazil. 2014. Available online: https://undocs.org/A/69/700 (accessed on 15 January 2024).
- Bayan, A.A. Mediterranean Laurel Of Investigation The Seed Production With The Natural Ways. International Engineering. In Proceedings of the Science and Education Conference, Diyarbakir, Turkey, 1–3 December 2016; pp. 22–26. [Google Scholar]
- Baytop, A. Pharmaceutical Botany; Istanbul University Faculty of Pharmacy Textbook: İstanbul, Turkey, 1991. [Google Scholar]
- Parlak, S. Research on Propagation Methods of Bay Laurel (Laurus nobilis L.) from Seed and Cuttings. Ph.D. Thesis, Karadeniz Technical University Graduate School of Natural and Applied Sciences, Department of Forest Engineering, Trabzon, Turkey, 2007. [Google Scholar]
- Ayanoğlu, F.; Kaya, D.A.; Mert, A.; Köse, E. Determination of Quality Aspects and Selection of Natıve Grown Laurel (Laurus nobilis L.) in Hatay Province of Turkey. Mesmap, Hatay. In Proceedings of the 1st Mediterranean Symposium on Medicinal and Aromatic Plants (MESMAP-2013), Gazimagosa, Cyprus, 17–20 April 2013; p. 58. [Google Scholar]
- Davis, P.H. Flora of Turkey; Edinburg University Press: Edinburg, TX, USA, 1982; Volume 7, p. 947. [Google Scholar]
- Şafak, İ.; Okan, T. Production and marketing of thyme, laurel and pine nuts, Eastern Mediterranean Forestry Research Directorate. DOA Mag. 2004, 10, 101–129. [Google Scholar]
- Anzano, A.; de Falco, B.; Grauso, L.; Motti, R.; Lanzotti, V. Laurel, Laurus nobilis L.: A review of its botany, traditional uses, phytochemistry and pharmacology. Phytochem. Rev. 2022, 1–51. [Google Scholar] [CrossRef]
- Singletary, K. Bay leaf: Potential health benefits. Nutr. Today. 2021, 56, 202–208. [Google Scholar] [CrossRef]
- Yılmaz, B.; Deniz, İ. The effects of cultivation area and altitude variation on the composition of essential oil of Laurus nobilis L. grown in eastern, Western and Central Karadeniz Region. Int. J. Second. Metab. 2017, 4, 187–194. [Google Scholar] [CrossRef][Green Version]
- Sekeroglu, N.; Koca, U. Current status of medicinal and aromatic plants production and trade in Turkey. Biomed 2010, 5, 65–73. [Google Scholar]
- Al Gabbiesh, A.H.; Ghabeish, M.; Kleinwächter, M.; Selmar, D. Plant regeneration through somatic embryogenesis from calli derived from leaf bases of Laurus nobilis L. (Lauraceae). Plant Tissue Cult. Biotechnol. 2014, 24, 213–221. [Google Scholar] [CrossRef]
- Raghavan, S. Handbook of Spices, Seasonings, and Flavorings; CRC: Boca Raton, FL, USA, 2007. [Google Scholar]
- Nadeem, M.A.; Aasim, M.; Kırıcı, S.; Karık, Ü.; Nawaz, M.A.; Yılmaz, A.; Maral, H.; Khawar, K.M.; Baloch, F.S. Biotechnological Approaches for Medicinal and Aromatic Plants. In Laurel (Laurus nobilis L.): A Less-Known Medicinal Plant to the World with Diffusion, Genomics, Phenomics, and Metabolomics for Genetic Improvement; Springer: Berlin/Heidelberg, Germany, 2018; pp. 631–653. [Google Scholar]
- Weiss, E.A. Spice Crops; CABI: London, UK, 2002. [Google Scholar]
- Akgül, A. Spice Science and Technology; Turkish Association of Food Technologists Publisher: Ankara, Turkey, 1993; Volume 15, pp. 106–115. [Google Scholar]
- Kaya, Z. Conservation, Management and Utilization of Our Forest Genetic Resources; 1st Forestry Council. T.C. Ministry of Forestry Publications: Ankara, Turkey, 1993; Volume 1, pp. 488–504.
- Yılmaz, M.; Eker, Ö.; ve Köse, İ. Laurel (Laurus nobilis L.) Gene Resources in Hatay and Kahramanmaraş Regions and Their Evaluation. III. In Proceedings of the International Symposium on Non-wood Forest Products, Kahramanmaraş, Turkey, 8–10 May 2014. [Google Scholar]
- Bayramoğlu, M.M. A research on the economic evaluation of non-wood forest products in Turkish forestry (The case of Eastern Black Sea Region). In Proceedings of the 2023 2nd Nature and Forestry Symposium, Book of Proceedings, Antalya, Turkey, 31 October–3 November 2013; pp. 317–330. [Google Scholar]
- Akyol, A. An Assessment of Turkey’s Non-wood Forest Products Resources in terms of Criteria and Indicators of Sustainable Forest Management. In Proceedings of the 2023 2nd Nature and Forestry Symposium, Book of Proceedings, Antalya, Turkey, 31 October–3 November 2013; pp. 303–315. [Google Scholar]
- Bayram, E.; Kırıcı, S.; Tansı, S.; Yılmaz, G.; Arabacı, O.; Kızıl, S.; Telci, İ. Possibilities of Increasing the Production of Medicinal Plants. VII. In Turkey Agricultural Engineering Technical Congress Proceedings-I; 2018 XIX CIGR World Congress: Ankara, Turkey, 2010; pp. 437–456. [Google Scholar]
- OGM. Ministry of Forestry and Water Affairs; No:302; Inventory and Planning of Non-Forest Forest Products and Production and Sales Principles; General Directorate of Forestry, Department of Non-wood Products and Services: Antalya, Turkey, 2016; 119p. [Google Scholar]
- Kurt, R.; Karayılmazlar, S.; Çabuk, Y. Important non-wood forest products in Turkey: An econometric analysis. Eng. Technol. Appl. Sci. Res. 2016, 6, 1245–1248. [Google Scholar] [CrossRef]
- OGM. General Directorate of Forestry, Official Statistics on Non-Wood Forest Products. 2017. Available online: https://www.ogm.gov.tr/tr/e-kutuphane-sitesi/FaaliyetRaporu/Orman%20Genel%20M.pdf (accessed on 22 January 2024).
- Chopra, K. The Valuation and Pricing of Non-Timber Forest Products: Conceptual Issues and a Case Study from India; Institute of Economic Growth: Delhi, India, 1997. [Google Scholar]
- Sher, H.; Aldosari, A.; Ali, A.; Boer, H.J. Economic benefits of high value medicinal plants to Pakistani communities: An analysis of current practice and potential. J. Ethnobiol. Ethnomedicine 2014, 10, 101–116. [Google Scholar] [CrossRef] [PubMed]
- Polat, S.; Gülbaba, A.G.; Tüfekçi, S.; Özkurt, A. Determination of the Most Appropriate Leaf Management Type and Costs in Laurel (Laurus Nobilis L.) Areas (Tarsus Example); Republic of Turkey Environment and Forestry Ministry of Forestry: Tarsus, Turkey, 2009; Eastern Mediterranean Forestry Research Institute Publications, Technical Bulletin Series, No: 34, Ministry of Environment and Forestry Publication No: 391; DOA Publication No: 56; ISBN 978-605-393-053-2. [Google Scholar]
- Çakmaklı, T. Socioeconomic Analysis of Non-wood Forest Products in Bartın Province. Master’s Thesis, Bartin University, Institute of Science and Technology, Bartin, Turkey, 2019. [Google Scholar]
- Bilgin, F.; Şafak, İ.; Kiracıoğlu, Ö. Socioeconomic Importance of Laurel (Laurus Nobilis L.) Production in the Aegean Region and Determination of Producer Profile; Aegean Forestry Research Directorate Publications; Ministry Publication: Ankara, Turkey, 2005. [Google Scholar]
- Altunel, T. Socioeconomic Importance of Non-wood Forest Products in terms of Collector/Producer. J. Istanb. Univ. Fac. For. 2012, 62. [Google Scholar]
- Gül, A.; Çelik, A.D. Medicinal and Aromatic Plant Cultivation and Foreign Trade: The Case of Hatay Province. J. Mustafa Kemal Univ. Fac. Agric. 2016, 21, 227–235. [Google Scholar]
- Güngör, E.; Şen, G. Sustainable Afforestation Strategies: Hybrid Multi-Criteria Decision-Making Model in Post-Mining Rehabilitation. Forests 2024, 15, 783. [Google Scholar] [CrossRef]
- Geray, A.U.; Şafak, İ. Problems and Solution Proposals in the Management of Non-wood Vegetable Forest Products in the Aegean Region. In Proceedings of the Symposium on Bottlenecks, Solution Proposals and Priorities within the Scope of Functions of Forest Resources in the 150th Anniversary of Forestry Education, İstanbul, Turkey, 17–19 October 2007; pp. 467–482. [Google Scholar]
- Güngör, E. Integrated Functional Management Planning of Forest Resources. Ph.D. Thesis, Bartin University, Institute of Science and Technology, Bartin, Turkey, 2011. [Google Scholar]
- Güngör, E.; Şen, G. Selecting suitable forest areas for honey production using the ahp: A case study in Turkey. Cerne 2018, 24, 67–79. [Google Scholar] [CrossRef]
- Karik, Ü.; Öztürk, M. Medicinal and Aromatic Plants in Turkey’s Foreign Trade. Bahçe 2009, 38, 21–31. [Google Scholar]
- Başar, H.; Bilgin, F.; Arslan, M. Current status of non-wood forest products industry in the Aegean Region. J. For. Res. 2021, 8, 69–79. [Google Scholar] [CrossRef]
- Korkmaz, M.; Duman, E.A. Assessments on foreign trade of some non-wood forest products in Turkey. Turk. J. For. 2019, 20, 401–410. [Google Scholar] [CrossRef]
- Okan, T.; Köse, C. Possibilities of utilizing intellectual property rights for forest products. Forests and Forestry in Turkey in the Axis of Ecology and Economy. Sonçağ Acad. 2021, 273–304. [Google Scholar]
- ZOMB. Determination of Chemo type Characteristics and Geographical Indication Certification Potential of Zonguldak-Bartın Laurel Populations. 2021. Available online: https://marmaraarastirma.ogm.gov.tr/Documents/ResimlerDiger/Poster%20(%20Defne).pdf (accessed on 21 January 2024).
- BAKKA. Evaluation of Non-Wood Forest Products in Bartın, Western Black Sea Development Agency. 2020. Available online: https://bakkakutuphane.org/upload/dokumandosya/bartin--odun-disi-ormanurunleri_td.pdf (accessed on 8 January 2024).
- Fu, C.; Chang, W.; Liu, W.; Yang, S. Data-Driven Selection of Multi-Criteria Decision-Making Methods and its Application to Diagnosis of Thyroid Nodules. Comput. Ind. Eng. 2020, 145, 106490. [Google Scholar] [CrossRef]
- Prajapati, H.; Kant, R.; Shankar, R. Prioritizing the Solutions of Reverse Logistics Implementation to Mitigate its Barriers: A Hybrid Modified SWARA and WASPAS Approach. J. Clean. Prod. 2019, 240, 118219. [Google Scholar] [CrossRef]
- Kumar, V.; Kalita, K.; Zavadskas, E.K.; Chakraborty, S. A SWARA- CoCoSo-Based Approach for Spray Painting Robot Selection. Informatica 2022, 33, 35–54. [Google Scholar] [CrossRef]
- Lee, H.C.; Chang, C.T. Comparative analysis of MCDM methods for ranking renewable energy sources in Taiwan. Renew. Sustain. Energy Rev. 2018, 92, 883–896. [Google Scholar]
- Crouch, G.I.; Ritchie, J.R.B. Tourism, competitiveness, and societal prosperity. J. Bus. Res. 1999, 44, 137–152. [Google Scholar] [CrossRef]
- Dwyer, L.; Forsyth, P.; Rao, P. The price competitiveness of travel and tourism: A comparison of 19 destinations. Tour. Manag. 2000, 21, 9–22. [Google Scholar] [CrossRef]
- Rohrbach, B. Kreativ nach Regeln. Methode 635, eine neue Technik zumLösen von Problemen. Creative by rules Method 635, a new technique forsolving problems. Absatzwirtschaft 1969, 12, 73–75. [Google Scholar]
- Honkakoski, P.; Fuchs, D. Methods manual. Selected methods forcollaborative planning. In Copack. Toolkit for Training Collaborative Planning; Online Toolbox; Oulu University of Applied Sciences: Oulu, Finland, 2012; Available online: http://copack.oamk.fi/docs/methods/methodsmanual.pdf (accessed on 11 July 2023).
- Stevic, Z.; Pamucar, D.; Subotic, M.; Antucheviciene, J.; Zavadskas, E.K. The Location Selection for Roundabout Construction Using Rough BWM-Rough WASPAS Approach Based on a New Rough Hamy Aggregator. Sustainability 2018, 10, 2817. [Google Scholar] [CrossRef]
- Memiş, S.; Demir, E.; Karamaşa, Ç.; Korucuk, S. Prioritization of Road Transportation Risks: An Application in Giresun Province. Operational Research in Engineering Sciences. Theory Appl. 2020, 3, 111–126. [Google Scholar]
- Stanujkic, D.; Zavadskas, E.K.; Karabasevic, D.; Smarandache, F.; Turskis, Z. The use of the pivot pairwise relative criteria importance assessment method for determining the weights of criteria. Rom. J. Econ. Forecast. 2017, 20, 116–133. [Google Scholar]
- Stanujkic, D.; Popovic, G.; Karabasevic, D.; MeiduteKavaliauskiene, I.; Ulutaş, A. An Integrated Simple Weighted Sum Product Method—WISP. IEEE Trans. Eng. Manag. 2021, 70, 1933–1944. [Google Scholar]
- Đalić, I.; Stević, Ž.; Karamasa, C.; Puška, A. A novel integrated fuzzy PIPRECIA–interval rough SAW model: Green supplier selection. Decision Making. Appl. Manag. Eng. 2020, 3, 126–145. [Google Scholar] [CrossRef]
- Pamučar, D.; Savin, L. Multiple-criteria model for optimal off-road vehicle selection for passenger transportation: BWM-COPRAS model. Vojnoteh. Glas. 2020, 68, 28–64. [Google Scholar] [CrossRef]
- Bobar, Z.; Božanić, D.; Djurić, K.; Pamučar, D. Ranking and Assessment of the Efficiency of social media using the Fuzzy AHP-Z Number Model—Fuzzy MABAC. Acta Polytech. Hung. 2020, 17, 43–70. [Google Scholar] [CrossRef]
- Weihrich, H. The TOWS matrix: Tool for situational analysis. Long Range Plan. 1982, 15, 54–66. [Google Scholar] [CrossRef]
- Weihrich, H. Analysing the competitive advantages and disadvantages of Germany with the TOWS matrix ± an alternative to Porter. Eur. Bus. Rev. 1999, 99, 9–22. [Google Scholar] [CrossRef]
- Sevkli, M.; Oztekin, A.; Uysal, O.; Torlak, G.; Turkyilmaz, A.; Delen, D. Development of a fuzzy ANP based SWOT analysis for the airline industry in Turkey. Expert Syst. Appl. 2021, 39, 14–24. [Google Scholar] [CrossRef]
- Tahernejad, M.M.; Ataei, M.; Khalokakaie, R. Selection of the best strategy for Iran’s quarries: SWOT-FAHP method. J. Min. Environ. 2012, 3, 1–13. [Google Scholar]
- Wickramasinghe, V.; Takano, S. Application of combined SWORT and Analytic Hierarchy Process (AHP) for tourism revival strategic marketing planning: A case of Sri Lanka tourism. J. East. Asia Soc. Transp. Stud. 2010, 7, 954–969. [Google Scholar]
- Štěrbová, M.; Loučanová, E.; Paluš, H.; Ivan, Ľ.; Šálka, J. Innovation strategy in Slovak forest contractor firms—A SWOT analysis. Forests 2016, 7, 118. [Google Scholar] [CrossRef]
- Gago, D.; Mendes, P.; Murta, P.; Cabrita, N.; Teixeira, M.R. Stakeholders’ Perceptions of New Digital Energy Management Platform in Municipality of Loulé, Southern Portugal: A SWOT-AHP Analysis. Sustainability 2022, 14, 1445. [Google Scholar] [CrossRef]
- EFI. European Forest Institute, Certification Information Service, Forest Products Certification. 2008. Available online: http://efi.fi/cis/english/background/faq.html (accessed on 14 January 2024).
- Tahernejad, M.M.; Khalokakaie, R.; Ataei, M. Determining proper strategies for Iran’s dimensional stone mines: A SWOT–AHP analysis. Arab. J. Geosci. 2013, 6, 129–139. [Google Scholar] [CrossRef]
- Shahabi, R.S.; Basiri, M.H.; Kahag, M.R.; Zonouzi, S.A. An ANP–SWOT approach for interdependency analysis and prioritizing the Iran’s steel scrap industry strategies. Resour. Policy 2014, 42, 18–26. [Google Scholar] [CrossRef]
- Bārdule, A.; Jūrmalis, E.; Lībiete, Z.; Pauliņa, I.; Donis, J.; Treimane, A. Use of retail market data to assess prices and flows of non-wood forest products in Latvia. Silva Fenn. 2020, 54, 10341. [Google Scholar] [CrossRef]
- Floris, I.; Pusceddu, M.; Raccimolo, E.; Casula, A.; Patteri, G.; Satta, A. The use of cork in the thermoregulation of the hive: An innovation attempt to enhance non-wood products and beekeeping in Mediterranean forests. Ann. Silvic. Res. 2020, 45, 99–104. [Google Scholar]
- Hammett, A.L.; Chamberlain, J.L. Sustainable Use of Non-Traditional Forest Products: Alternative Forest-Based Income Opportunities; Department of Wood Science and Forest Products: Viriginia Tech, VA, USA, 1999. [Google Scholar]
- Ervin, J.B.; Mallet, P. The Rise of Certification, the Current State of the Playing Field for NTFP Certification Programs and Future Prospects. In Tapping the Green Market: Certification & Management of Non-Timber Forest Products; Routledge: London, UK, 2002; pp. 7–20. [Google Scholar]
- Godoy, R.A.; Bawa, K.S. The economic value and sustainable harvest of plants and animals from the tropical forest: Assumptions, hypotheses and methods. Econ. Bot. 1993, 47, 215–219. [Google Scholar] [CrossRef]
- Hammett, A.L.; Chamberlain, J.L. Sustainable use of non-timber forest products: Alternative forest-based income opportunities. In Proceedings of the Conference Proceedings: Natural Resources Income Opportunities on Private Lands University of Maryland Co-Operative Extension Service, Hagerstown, MD, USA, 5–7 April 1998; Kay, J.S., Goff, G.R., Smallidge, P.J., Grafton, W.N., Eds.; pp. 141–147. [Google Scholar]
- Scoones, I.C.; Melnyk, M.; Pretty, J. (Eds.) The Hidden Harvest: Wild Foods and Agricultural Systems. A Literature Review and Annotated Bibliography; 111.1; The Sustainable Agriculture Programme; International Institute for Environment and Development 3 Endsleigh Street, London WCIH ODD: London, UK, 1992; ISBN 0 905347 93 5. [Google Scholar]
- Chihongo, A.W. Non-wood forest products of Tanzania. In Information Acquisition for Sustainable Natural Forest Resources of Eastern, Central and Southern Africa; Malimbwi, R.E., Luoga, E.J., Eds.; Workshop proceedings Arusha: Arusha, Tanzania, 1994. [Google Scholar]
- Emerton, L. Valuing the Subsistence Use of Forest Products in Oldonyo Orok Forest, Kenya; Rural Development Forestry Network. Summer; ODI: London, UK, 1996. [Google Scholar]
- Statz, J. Non-Timber Forest Products: A key to sustainable tropical forest management? GATE Technol. Dev. 1997, 2, 4–11. [Google Scholar]
- Campbell, B.M. The use of wild fruits in Zimbabwe. Econ. Bot. 1997, 41, 375–385. [Google Scholar] [CrossRef]
- Cunningham, A.B. Review of ethnobotanical literature from eastern and southern Africa. Bull. Afr. Ethnobatany Netw. 1997, 1, 23–88. [Google Scholar]
- Shackleton, C.M.; Shackleton, S.E. The Importance of Non-Timber Forest Products in Rural Livelihood Security and as Safety-Nets: A Review of Evidence from South Africa. South Afr. J. Sci. 2004, 100, 658–664. [Google Scholar]
- FAO. Domestication and Commercialization of Non-Timber Forest Products in Agroforestry System; FAO: Rome, Italy, 1996. [Google Scholar]
- Saaty, T.L.; Vargas, L.G. Decision Making in Economic, Political, Social, and Technological Environments with the Analytic Hierarchy Process; RWS Publications: Pittsburgh, PA, USA, 1994; Volume 1, 217p. [Google Scholar]
- Keršuliene, V.; Zavadskas, E.K.; Turskis, Z. Selection of rational dispute resolution method by applying new stepwise weight assessment ratio analysis (SWARA). J. Bus. Econ. Manag. 2010, 11, 243–258. [Google Scholar] [CrossRef]
- Blagojević, A.; Stević, Ž.; Marinković, D.; Kasalica, S.; Rajilić, S. A novel entropy-fuzzy PIPRECIA-DEA model for safety evaluation of railway traffic. Symmetry 2020, 12, 1479. [Google Scholar] [CrossRef]
- Dovie, B.D.K.; Witkowski, E.T.F.; Shackleton, C.M. Direct-use value of smallholder crop production in a semi-arid rural South African village. Agric. Syst. 2003, 76, 337–357. [Google Scholar] [CrossRef]


Disclaimer/Publisher’s Note: The statements, opinions and data contained in all publications are solely those of the individual author(s) and contributor(s) and not of MDPI and/or the editor(s). MDPI and/or the editor(s) disclaim responsibility for any injury to people or property resulting from any ideas, methods, instructions or products referred to in the content. |
© 2024 by the author. Licensee MDPI, Basel, Switzerland. This article is an open access article distributed under the terms and conditions of the Creative Commons Attribution (CC BY) license (https://creativecommons.org/licenses/by/4.0/).