Article

Soil Microbial Communities Responses to Multiple Generations’ Successive Planting of Eucalyptus Trees

1
College of Forestry, Guangxi University, Nanning 530007, China
2
Guangxi Colleges and Universities Key Laboratory for Cultivation and Utilization of Subtropical Forest Plantation, Guangxi Key Laboratory of Forest Ecology and Conservation, College of Forestry, Guangxi University, Nanning 530004, China
*
Author to whom correspondence should be addressed.
Forests 2024, 15(7), 1166; https://doi.org/10.3390/f15071166
Submission received: 4 June 2024 / Revised: 29 June 2024 / Accepted: 2 July 2024 / Published: 4 July 2024
(This article belongs to the Section Forest Soil)

Abstract

:
The impacts of the successive planting of Eucalyptus on soil microbial communities and their underlying mechanisms remain unknown, limiting our understanding of its long-term effects on soil ecosystems. This study examined the 0–20 cm and 20–40 cm soil layers, investigating changes in soil bacterial and fungal communities after multiple plantings of Eucalyptus grandis × urophylla using high-throughput sequencing. Furthermore, we used the structural equation model (SEM) to analyze the relationships among soil active organic carbon (SAOC), enzyme activity, and microbial diversity. The study showed that the multigeneration successive planting of Eucalyptus significantly increased the soil bulk density and decreased the soil physicochemical properties and soil enzyme activities (p < 0.05). The soil’s dominant microbial compositions were unchanged in the two soil horizons, but the relative abundances of some dominant phyla (e.g., Crenarchaeota, Basidiomycota and Actinobacteriota) were affected by successive planting. The variability in the microbial community structure was influenced primarily by the soil water content (SWC) and organic carbon (p < 0.05). The microbial community diversity in the 20–40 cm horizon was significantly affected by multigeneration succession (p < 0.05). SWC was the core factor driving microbial community diversity. SEM results showed that multigeneration successive planting obviously limits SAOC fractions and enzyme activities, negatively affecting soil microbial diversity. Our study highlights the impact of the multigeneration successive planting of Eucalyptus on soil microbial community structure and suggests adjustments in forestry practices to mitigate soil degradation.

1. Introduction

As a tree species planted at a large scale in southern China, Eucalyptus spp. has the advantages of being fast-growing, productive, adaptable, and versatile in timber use [1]. Eucalyptus plays a great role in mitigating climate change issues [2]. Moreover, because of their strong germination and regeneration ability, Eucalyptus plantation forests are often managed with short rotation periods of 4–6 years or even shorter via multigenerational planting [3]. While the intensive plantation management model ensures timber supply and economic growth, it is also prone to problems such as the loss of soil nutrients [4], loss of biodiversity, and declines in stand productivity [5], which make the sustainable management of Eucalyptus plantation forests more challenging. Therefore, it is crucial to maintain soil fertility and ecological multifunctionality in Eucalyptus plantations.
Microorganisms are an essential and critical part of forest ecosystems. Microbial community composition and diversity are thought to be related to ecosystem versatility [6]; thus, these organisms are frequently used to predict the impacts of environmental perturbations on ecosystems. Several scholars have shown that decreases in forest nutrient cycling and climate regulation are likely associated with a decrease in bacterial [7] and fungal [8] diversity. A growing body of research suggests that the global and regional patterns of the soil microbial community structure are significantly impacted by management patterns, soil physicochemical properties (SPPs), and enzyme activities [9,10,11]. Hence, it is necessary to clarify the patterns of microbial community management, soil properties, and enzyme activities to reveal microbial adaptive strategies to environmental changes and better maintain the sustainable management of Eucalyptus plantations.
The soil organic carbon (SOC) content is a crucial component of SPPs; to some extent, this can explain why the diversity and composition of microbiota change [12]. As a main source of energy for soil microorganisms, soil active organic carbon (SAOC) is more readily utilized by microorganisms and largely influences microbial activity [13]. A reduction in SAOC is thought to be one of the reasons for the decline in microbial biomass [14]. One study demonstrated that the correlation between the structure of the microbiota and SAOC was significant and included readily oxidizable organic carbon and microbial biomass carbon [15]. In addition, soil enzyme activities are highly correlated with the microbial structure, and as catalysts of complex biochemical processes in soil, enzymes are essential for the biochemical reactions of carbon, nitrogen, and phosphorus, and are closely related to soil nutrients, which in turn influence the structure and diversity of microbiota [16,17]. It is well documented that there is a significant positive correlation between soil enzyme activity and microbial community diversity [11]. In one sense, the gene abundance of enzymes is strongly linked to the soil microbial community structure; on the other hand, the abundance of functional genes in the microbiota predicts changes in enzyme activity related to carbon degradation [18,19]. These findings demonstrate that SAOC and enzyme activities play crucial roles in impacting the structure and diversity of microbial communities. Therefore, identifying the drivers of SAOC and soil enzyme activities is indispensable for predicting changes in microbial communities. Significant reductions in enzyme activities and the SAOC content due to the successive planting of Eucalyptus have attracted increased amounts of attention [20]; however, research investigating whether soil microbial communities respond similarly to successive Eucalyptus planting is still limited.
Forest management practices are closely related to the community composition and diversity of soil bacteria and fungi [21]. The silvicultural patterns of monocultures and long-term cultivation have significantly impacted the metabolic activities of soil microbes in Eucalyptus plantation forests [22], which has resulted in reductions in the diversity and relative abundance of microbial communities [23]. Continuous cultivation over multiple generations may impact the microbiota composition and diversity by modifying the stand biomass and carbon dynamics [24]. For instance, a prior research study showed that soil microbial richness and diversity have decreased due to continuous cropping in subtropical areas of southern China [25]. However, other studies have shown that the soil bacterial and fungal diversity in Eucalyptus plantations increases from one generation to the next [26]. The reason for this difference may be that the influence of multigenerational succession on soil microbial diversity varies significantly across climatic conditions, possibly due to differences in temperature and precipitation [27,28]. Multigenerational planting results in changes in the content of SAOC, enzyme activities, and soil microbial characteristics in Eucalyptus plantations, but it is not clear whether succession directly or indirectly affects changes in microbiological structure through cascading reactions that affect soil properties. Therefore, there is a need to further explore the direct or indirect effects of multiple generations of Eucalyptus plantations on the microbial structure and diversity mediated by soil organic carbon and enzyme activities, and filling this important knowledge gap will help to unravel the intrinsic mechanisms of land degradation induced by multiple generations of Eucalyptus plantations.
To this end, we selected three pure Eucalyptus grandis × Eucalyptus urophylla plantation forests with different successive planting generations for the study. We identified alterations in SPPs and enzyme activities. We also used next-generation sequencing technology to investigate alterations in the structure and diversity of the soil bacterial and fungal communities. A structural equation model (SEM) was constructed to reveal the mechanism of action of SPPs, active organic carbon pools, enzyme activities, and microbial diversity in response to multiple generations of planting. The purpose of our study was to clarify the following three areas: (1) whether multigenerational planting of Eucalyptus reduces SPPs, enzyme activities, and microbial community structure and diversity; (2) the relationship between the SPPs and the microbial communities and the environmental factors most likely to influence the structure of the microbiota; (3) the response of soil microorganisms in relation to physicochemical properties, active organic carbon pools, and enzyme activities under multiple generations of continuously planted Eucalyptus plantations. We made the following assumptions: (a) the multigeneration successive planting of Eucalyptus reduces SPPs, enzyme activity, and the community diversity of microorganisms; (b) the soil microbial community structure is affected by many environmental factors; (c) the content of active organic carbon fractions is a key factor affecting the changes in soil microbial community structure. This study helps to clarify how soil microbiota respond to environmental factors, optimize management measures in Eucalyptus plantation forests, and reduce problems such as land degradation due to multiple generations of planting to promote the appropriate long-term management of Eucalyptus plantation forests.

2. Materials and Methods

2.1. Overview of the Research Area

The experimental site was set up at the Guangxi State-owned Bobai Forest Farm (109°38′~110°17′ E, 21°39′~22°30′ N), southeastern Guangxi, China (Figure 1). The experimental site was in the transition zone between the northern and southern subtropics. The region has a subtropical monsoon climate, abundant heat, and abundant rainfall. The average annual temperature is 21.9 °C, the annual cumulative temperature is 8819 °C, the average annual precipitation is 1756 mm, the average annual sunshine duration is 1778 h, and the water and heat conditions are favorable and suitable for the growth of various fast-growing trees. The soil is dominated by reddish red loam, with mountain reddish loam in a vertical distribution, and mostly medium and thick soil layers. The humus layer is generally less than 5 cm, the soil texture is basically medium loam or light clay loam, and the parent rock is dominated by sandstone.
In order to reduce the spatial differences of soil, we selected three kinds of artificial pure Eucalyptus grandis × Eucalyptus urophylla forests with a similar stand age, elevation, slope and orientation, stand density, and fertilization methods. The three selected Eucalyptus artificial pure forests were located in hilly areas at an altitude of 100–200 m. Among them, the first-generation forest (G1) was planted in March 2016, and the stand was a pure artificial forest of Pinus massoniana Lamb. before afforestation. The second-generation forest (G2) and third-generation forest (G3) were planted in March 2017, and the stand was a pure artificial E. grandis × E. urophylla forest before afforestation. All three stands were planted with seedlings after hole preparation. Planting hole depth was 30 cm and spacing was 3 m × 1.5 m, with 2222 seedlings per hectare. A total of 0.5 kg of basal fertilizer was used in each pit (N:P:K = 15:6:9); thereafter, 0.5 kg fertilizer was used for each plant per year (N:P:K = 15:6:9). All three stands have not suffered from major pests, diseases, and natural disasters and are growing well; other basic conditions are shown in Table 1.

2.2. Experimental Design and Soil Sample Collection

We implemented a completely randomized design for three forest stands in October 2022, with five pure E. grandis × E. urophylla stand sampling plots set up for each stand type, for a total of 15 sampling plots (3 stand types × 5 replications). To avoid pseudoreplication and to reduce spatial autocorrelation, every two Eucalyptus forest subsampled plots were separated by more than 800 m. A sample plot of 400 m2 (20 m × 20 m) was randomly selected as the sample plot in each eucalypt forest subsample plot at a location more than 50 m from the edge.
In each sample plot, five sampling sites were randomly established, from which soil was collected. After the aboveground litter and humus layer were removed, approximately 500 g of soil was collected from the 0–20 cm and 20–40 cm horizon. Subsequently, five soil samples were mixed by the soil layer to obtain 30 soil samples (3 stand types × 5 replicates × 2 soil depths). At the same time, soil samples from different soil layers were collected by the cutting rings. The soil samples were naturally dried (28 °C) and ground after debris such as gravel and plant residue were removed; subsequently, the samples were passed through a 2 mm aperture sieve for use. This part of the soil sample was used to determine basic physicochemical properties such as the soil bulk density (SBD), soil pH, soil water content (SWC), soil organic carbon (SOC), total nitrogen (TN), and total phosphorus (TP) content. In addition, approximately 200 g of the soil sample was taken from each layer and stored in an autoclaved Tupperware box, which was temporarily stored in an insulated box containing liquid nitrogen. This was taken back to the lab and stored in an ultra-low-temperature refrigerator (−80 °C). This part of the soil was used to determine the microbial biomass carbon (MBC), readily oxidizable organic carbon (ROC), dissolved organic carbon (DOC), carbon cycle-related enzyme activities, while DNA extraction and high-throughput sequencing were used to determine the soil microbial community’s structure and diversity.

2.3. Methods for the Determination of Soil Physicochemical Properties

We collected soil samples with cutting rings, weighed them immediately, placed them in an air-blast-drying oven (105 °C) to dry them until they reached a constant weight, weighed them again after cooling, and calculated the SBD. The SWC was calculated via weight analysis [29]. Pure water (100 mL) was added to 25 g of soil, the mixture was stirred, and a pH meter was used to determine the soil pH [30]. The potassium dichromate–sulfate colorimetric method was used to measure SOC [31]. The soil TN was determined via the Kjeldahl method [32]. The determination of TP was performed via digestion with sulfuric acid–perchloric acid [33]. The determination of soil DOC was performed via leaching with distilled water [34]. The soil ROC was measured via the potassium permanganate oxidation method [35]. The soil MBC was determined via the chloroform fumigation–potassium sulfate extraction method [36,37].

2.4. Measurement of Enzyme Activity

The soil β-xylosidase (BX), cellobiose hydrolase (CBH), β-glucosidase (BG), β-acetylglucosaminoglycosidase (NAG), leucine aminopeptidase (LAP), and acid phosphatase (ACP) activities were determined via microtiter plate fluorescence assays [38,39]. One gram of fresh soil sample was added to 100 mL of acetate buffer at a concentration of 50 mmol/L, after which the mixture was stirred for 1 min at pH = 5.0 with a stirrer. There were eight replicates for each sample, together with a quench standard, reference standard, blank, and negative control. 4-Methylumbelliferone (MUB) and 7-amino-4-methylcoumarin (MUC) were used as standards. Two hundred microliters of soil suspension and 50 μL of substrate were added to the sample wells, 200 μL of soil suspension and 50 μL of standard solution were added to the quench standard wells, 200 μL of buffer and 50 μL of standard solution were added to the reference standard wells, 200 μL of soil suspension and 50 μL of buffer were added to the soil control wells, and 200 μL of buffer and 50 μL of substrate were added to the negative control wells. The microtiter plates were incubated in a constant-temperature incubator at 25 °C for 4 h and protected from light. At the end of the incubation, to terminate the enzyme reaction, 10 μL of 1 mol·L−1 NaOH solution was quickly added to each well. A multifunctional enzyme marker was used for excitation at 365 nm, and fluorescence was detected at 450 nm. Enzyme activities were calculated using the soil fluorescence quenching, single-point, corrected SinQ assay [40] with the following formula:
A = f h f b × f r / f 0 f b × 100   mL f 0 / 0.5   nmol × 0.2   mL × 1.0   g × 4   h
where A denotes enzyme activity (nmol·h−1g−1); fh indicates the sample fluorescence value; fb indicates the soil control fluorescence value; fr indicates the reference standard fluorescence value; fa indicates the negative control fluorescence value; f0 indicates the quench standard fluorescence value; 100 mL is the volume of soil suspension; 0.5 nmol is the amount of substrate added; 0.2 mL is the volume of buffer or soil suspension added; 1.0 g is the weight of the soil sample; 4 h is the incubation time.

2.5. DNA Extraction and Sequencing of Soil Bacteria and Fungi

We prepared 0.5 g of each soil sample, and DNA was extracted using a Magnetic Soil And Stool DNA Kit (TianGen, Beijing, China, Catalog#: DP712). The extracted DNA was electrophoresed on a 1% agarose gel to check purity and concentration. The highly variable region (V3–V4) of the bacterial 16S rRNA gene was amplified using the primers 341F (5′-CCTAYGGGRBGCASCAG-3′) and 806R (5′-GGACTACHVGGGTWTCTAAT-3′). The highly variable region of the fungal ITS rRNA gene (ITS1) was amplified using the primers ITS1F (5′-CTTGGTCATTTAGAGGAAGTAA-3′) and ITS2 (5′-GCTGCGTTCTTCATCGATGC-3′). The PCR products were placed in an electrophoresis apparatus and detected via electrophoresis on an agarose gel at a concentration of 2%. The PCR products that passed the assay were purified by magnetic beads. Library construction was performed using the NEBNext® Ultra™ II FS DNA PCR-free Library Prep Kit (New England Biolabs, Ipswich, MA, USA) and the constructed libraries were quantified by Qubit and Q-PCR and subsequently sequenced using an Illumina NovaSeq 6000 (Illumina, Santiago, CA, USA) with PE 250 on-board sequencing with the addition of index codes. After the barcode and primer sequences were truncated, the reads of each sample were spliced using FLASH (version 1.2.11) [41] to obtain the raw tag data (raw tags). Fmp software (version 0.23.1) was used to process the raw tags to obtain high-quality tag data (clean tags) [42]. The tag sequences were compared with the Silva database [16S/18S] [43] and United database [ITS] [44] to detect chimeric sequences and obtain effective data (effective tags) [45]. The effective tags were denoised using the DADA2 [46] module in QIIME2 (version 2-202006) software to obtain the final ASVs (amplicon sequence variants) [47].

2.6. Data Processing and Statistical Analysis

Variance homogeneity tests were performed on all data sets to ensure that the assumptions of statistical analysis were satisfied. One-way ANOVA and Tukey’s HSD post hoc tests were performed using SPSS software (version 22.0, SPSS, Inc., Chicago, IL, USA). The α-diversity indices of the bacterial and fungal communities were represented by the Chao1 and Shannon indices. QIIME 2 software (version QIIME2-202006, University of Colorado, USA) was used to calculate the two indices. ORIGINPRO software (version 2023b, Northampton, MA, USA) was used to plot the bar charts of the SPPs, enzyme activities, and alpha diversity indices. The chord charts of the phyla associated with the dominant bacteria and fungi in the soil were also constructed using this software. Based on the Pearson correlation coefficient, the relationship between the SPPs and enzyme activity were determined. A redundancy analysis (RDA) was performed using Canoco (version 5.0; Biometris, Wageningen, The Netherlands); this approach helped us to explore the relationship between SPPs and microbial communities.
As a modern and diversified statistical analysis technique, structural equation modeling (SEM) is an important tool for multivariate data analysis [48]. A model of soil microorganisms affected by the successive planting of Eucalyptus trees was fitted using SEM. For SEM, SmartPLS software was used (version 3.0; SmartPLS GmbH, Oststeibek, Germany). The partial least squares method was used for the calculations. To make this model more fitting and aesthetically pleasing, those paths that were not significant were removed. We tested construct reliability and validity (Cronbach’s α > 0.7, AVE > 0.5) and standardized path coefficients (p < 0.05) [49].

3. Results

3.1. Soil Physical and Chemical Properties

The SPPs differed significantly between successive planting generations (Table 2). Compared to those in G1, the SBD in G2 and G3 increased and the SWC decreased, with no significant change in pH (p > 0.05). In the upper soil horizon (0–20 cm), compared with those in G2 and G3, the soil SOC, TN, and TP contents in G1 were significantly greater (p < 0.05). The soil ROC contents in G1 and G2 were significantly greater than that in G3. The trends in the DOC and MBC contents were G1 > G3 > G2 and G1 > G2 > G3, respectively. In the deeper soil (20–40 cm), the SBD, SOC, and TP contents exhibited the same trends as those in the upper soil. The trend in SWC was G1 > G3 > G2, and the difference was significant. The soil pH of G1 and G2 was significantly greater than that of G3. The decrease in the TN content was significant as the number of successive planting generations increased. The soil ROC contents in G2 and G3 were significantly greater than that in G1. In the G1 stand, the DOC content was significantly greater than that in G2 and G3.

3.2. Soil Enzyme Activity

Differences in soil enzyme activities were found between different successive generations of E. grandis × E. urophylla plantations (Figure 2). In the 0–20 cm soil horizon, the soil NAG, LAP, ACP, BG, and CBH activities in the G1 forest stand were significantly greater than those in the G2 and G3 forest stands, and nonsignificant differences in BX activity were found between the stands. In the deeper horizon (20–40 cm), the soil LAP, ACP, and CBH activities were greatest in the G1 stand, and the soil BG activity in G3 was significantly less than that in G1 and G2. We did not find marked differences in NAG or BX activity among the three stands. Pearson’s correlation analysis showed that the soil enzyme activity in Eucalyptus plantation was related to SPPs (Figure 3). The enzyme activities in the surface soils (except BX) exhibited strong positive correlations with the SOC, TN, TP, and SWC. In the lower soil horizon (20–40 cm), soil enzyme activities (except BX and NAG) were correlated with SOC, TN, and TP. The DOC and SWC contents were significantly correlated with the CBH and ACP. ROC had no significant influence on enzyme activity.

3.3. The Composition of the Soil Microbiota

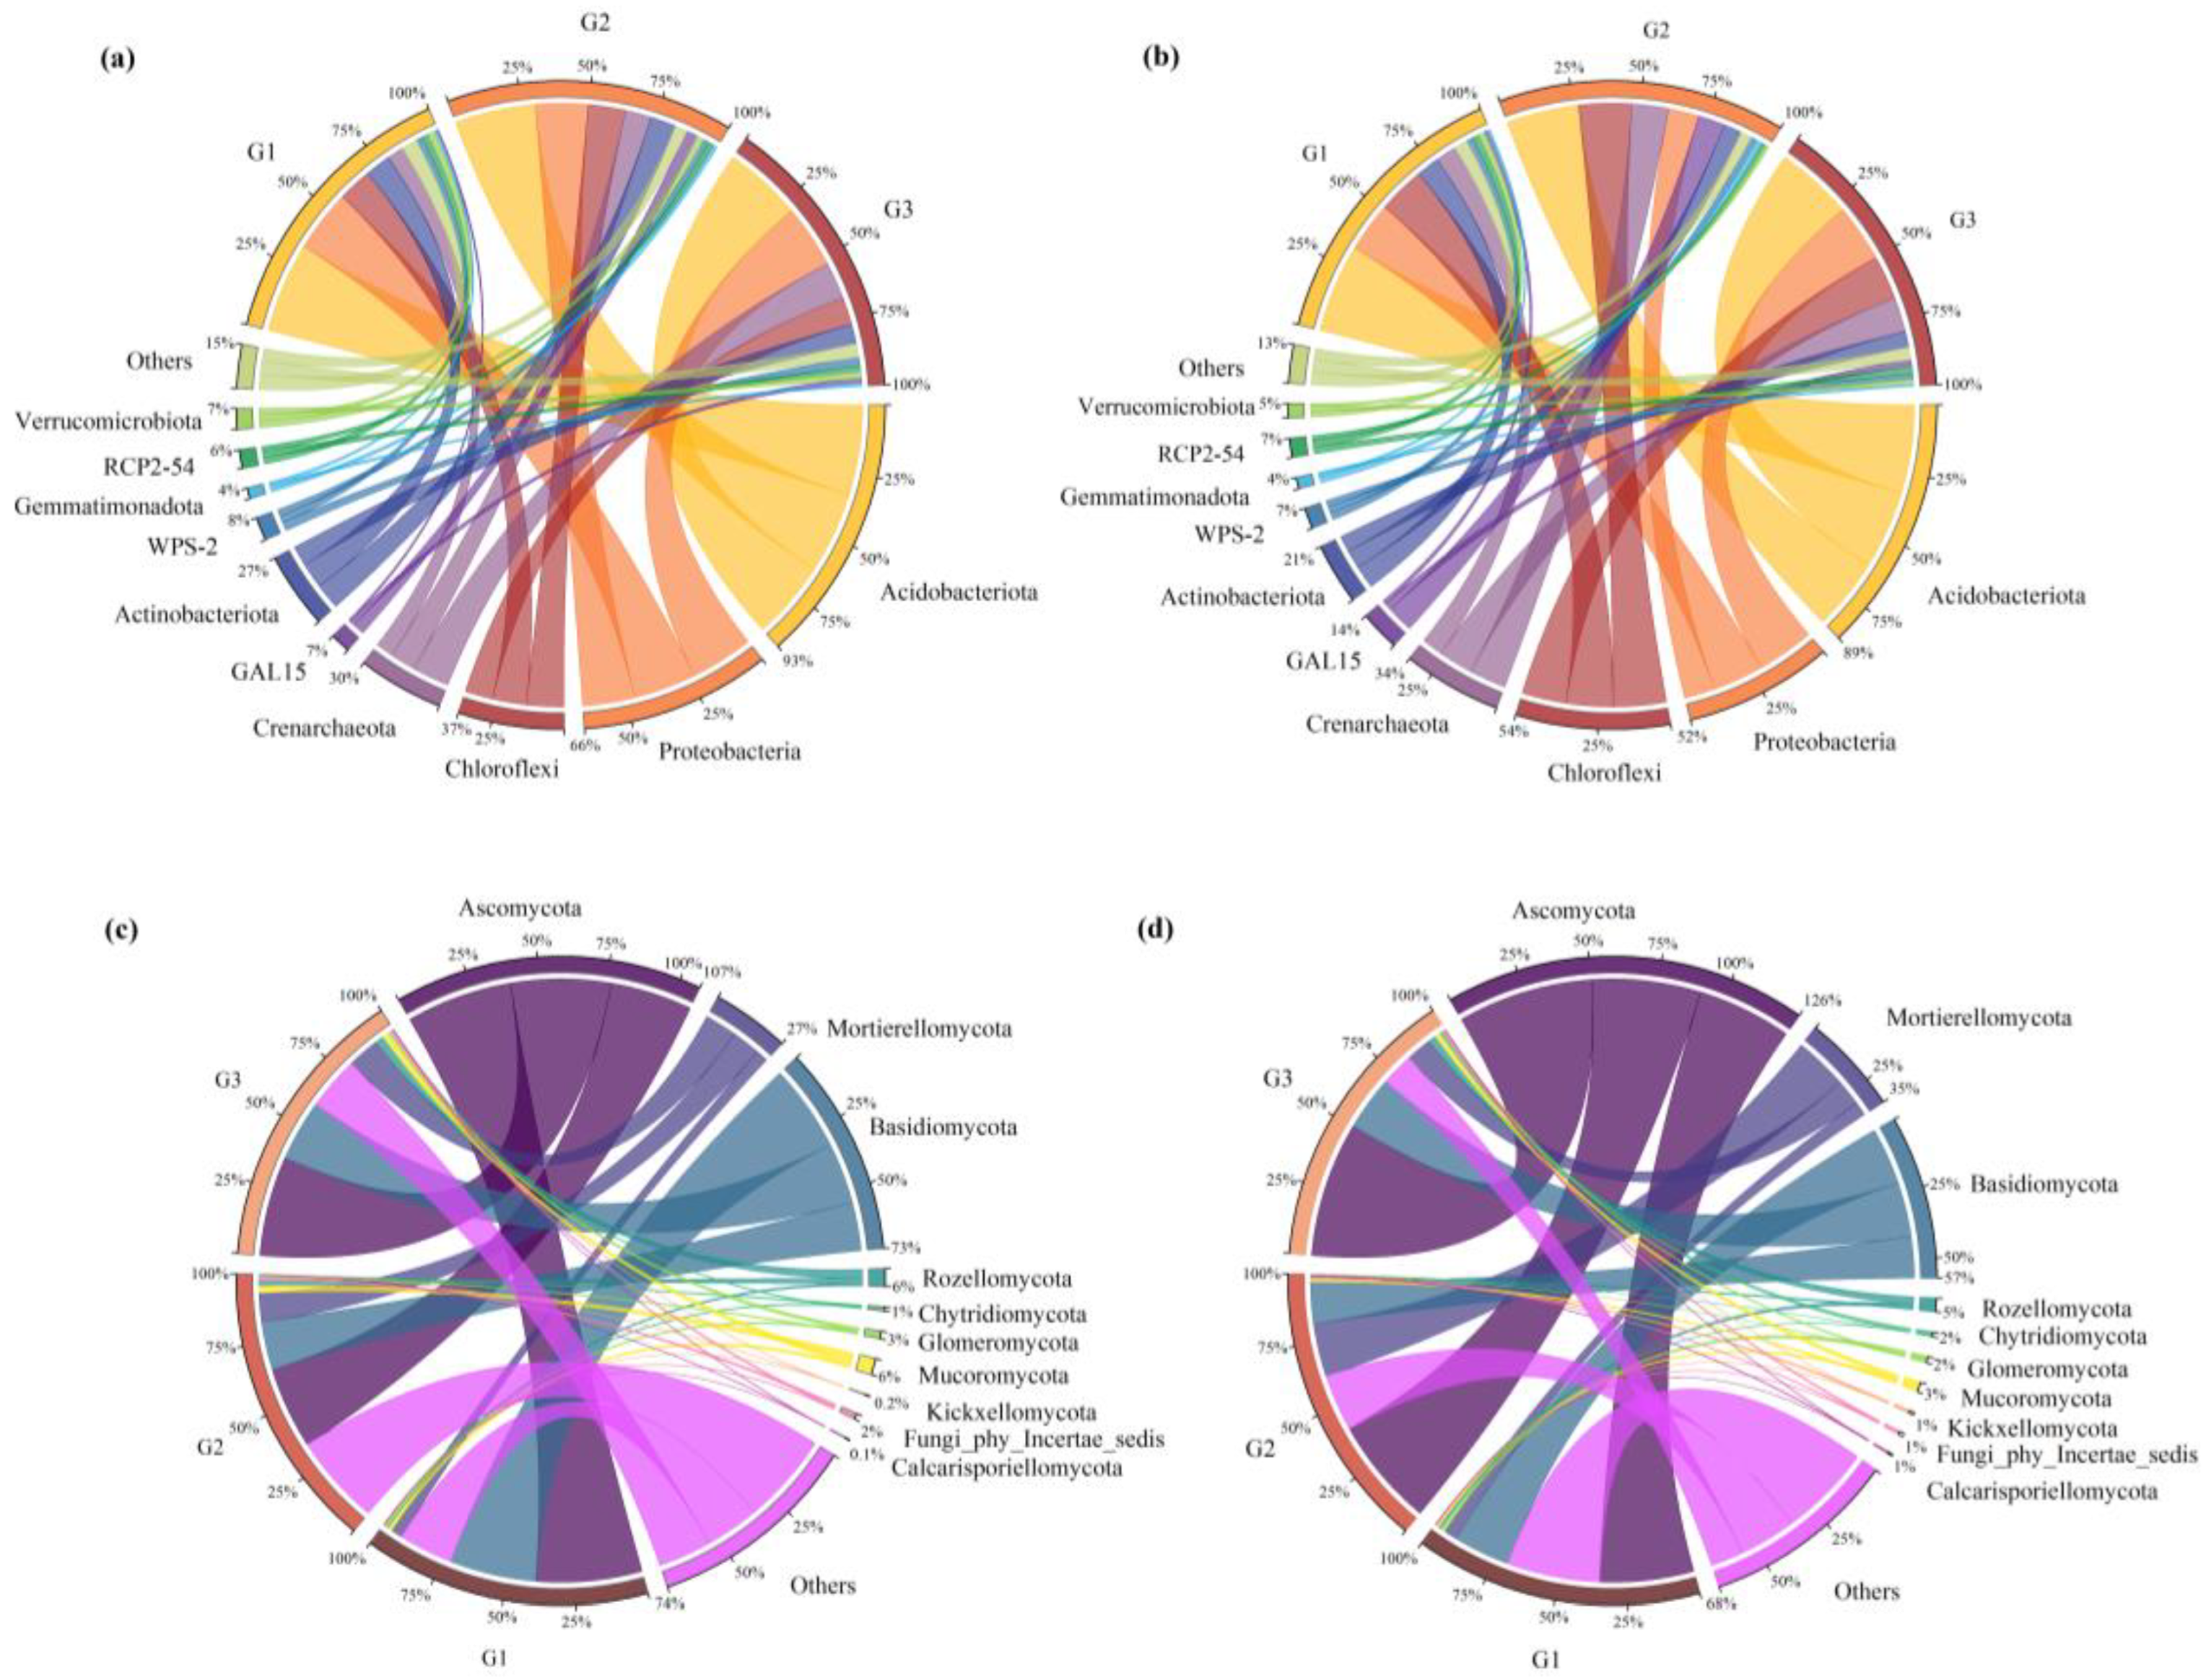
In the three Eucalyptus forest stands, there was a general consistency in the composition of the dominant soil microbiota phyla despite shifts in the relative abundance of dominant communities due to successive planting (Figure 4). In the two soil horizons that we studied, the dominant bacterial phyla were Acidobacteriota, Proteobacteria, Chloroflexi, Crenarchaeota, and Actinobacteriota (with relative abundances > 5%), which accounted for approximately 70% of each sequence. WPS-2, Gemmatimonadota, RCP2-54, Verrucomicrobiota, and GAL15 were underrepresented, and the remaining bacteria (with a relative abundance < 1%) were categorized as “other” (Figure 4a,b). Among the fungi, Ascomycota, Mortierellomycota, and Basidiomycota had relative abundances greater than 5%, and they were the dominant taxa. The other fungi among the top ten most common taxa were Rozellomycota, Chytridiomycota, Mucoromycota, Kickxellomycota Fungi_phy_Incertae_sedis, and Calcarisporiellomycota; those not in the top ten most common genera were categorized as “other” (Figure 4c,d). From a bacterial point of view, the relative abundance of Crenarchaeota increased due to successive planting. In the underlying soil horizon, the relative abundance of Actinobacteriota decreased generation by generation (Figure 5a,b). The relative abundance of fungal communities in the upper soil horizon (0–20 cm) was also significantly affected by successive planting operations, and the increasing planting generations significantly affected the relative abundance of Basidiomycota. The influence of multiple continuously planted generations on the dominant fungal taxa in the lower soil horizon (20–40 cm) was not significant (Figure 5c,d).

3.4. Soil Bacterial and Fungal Alpha Diversity

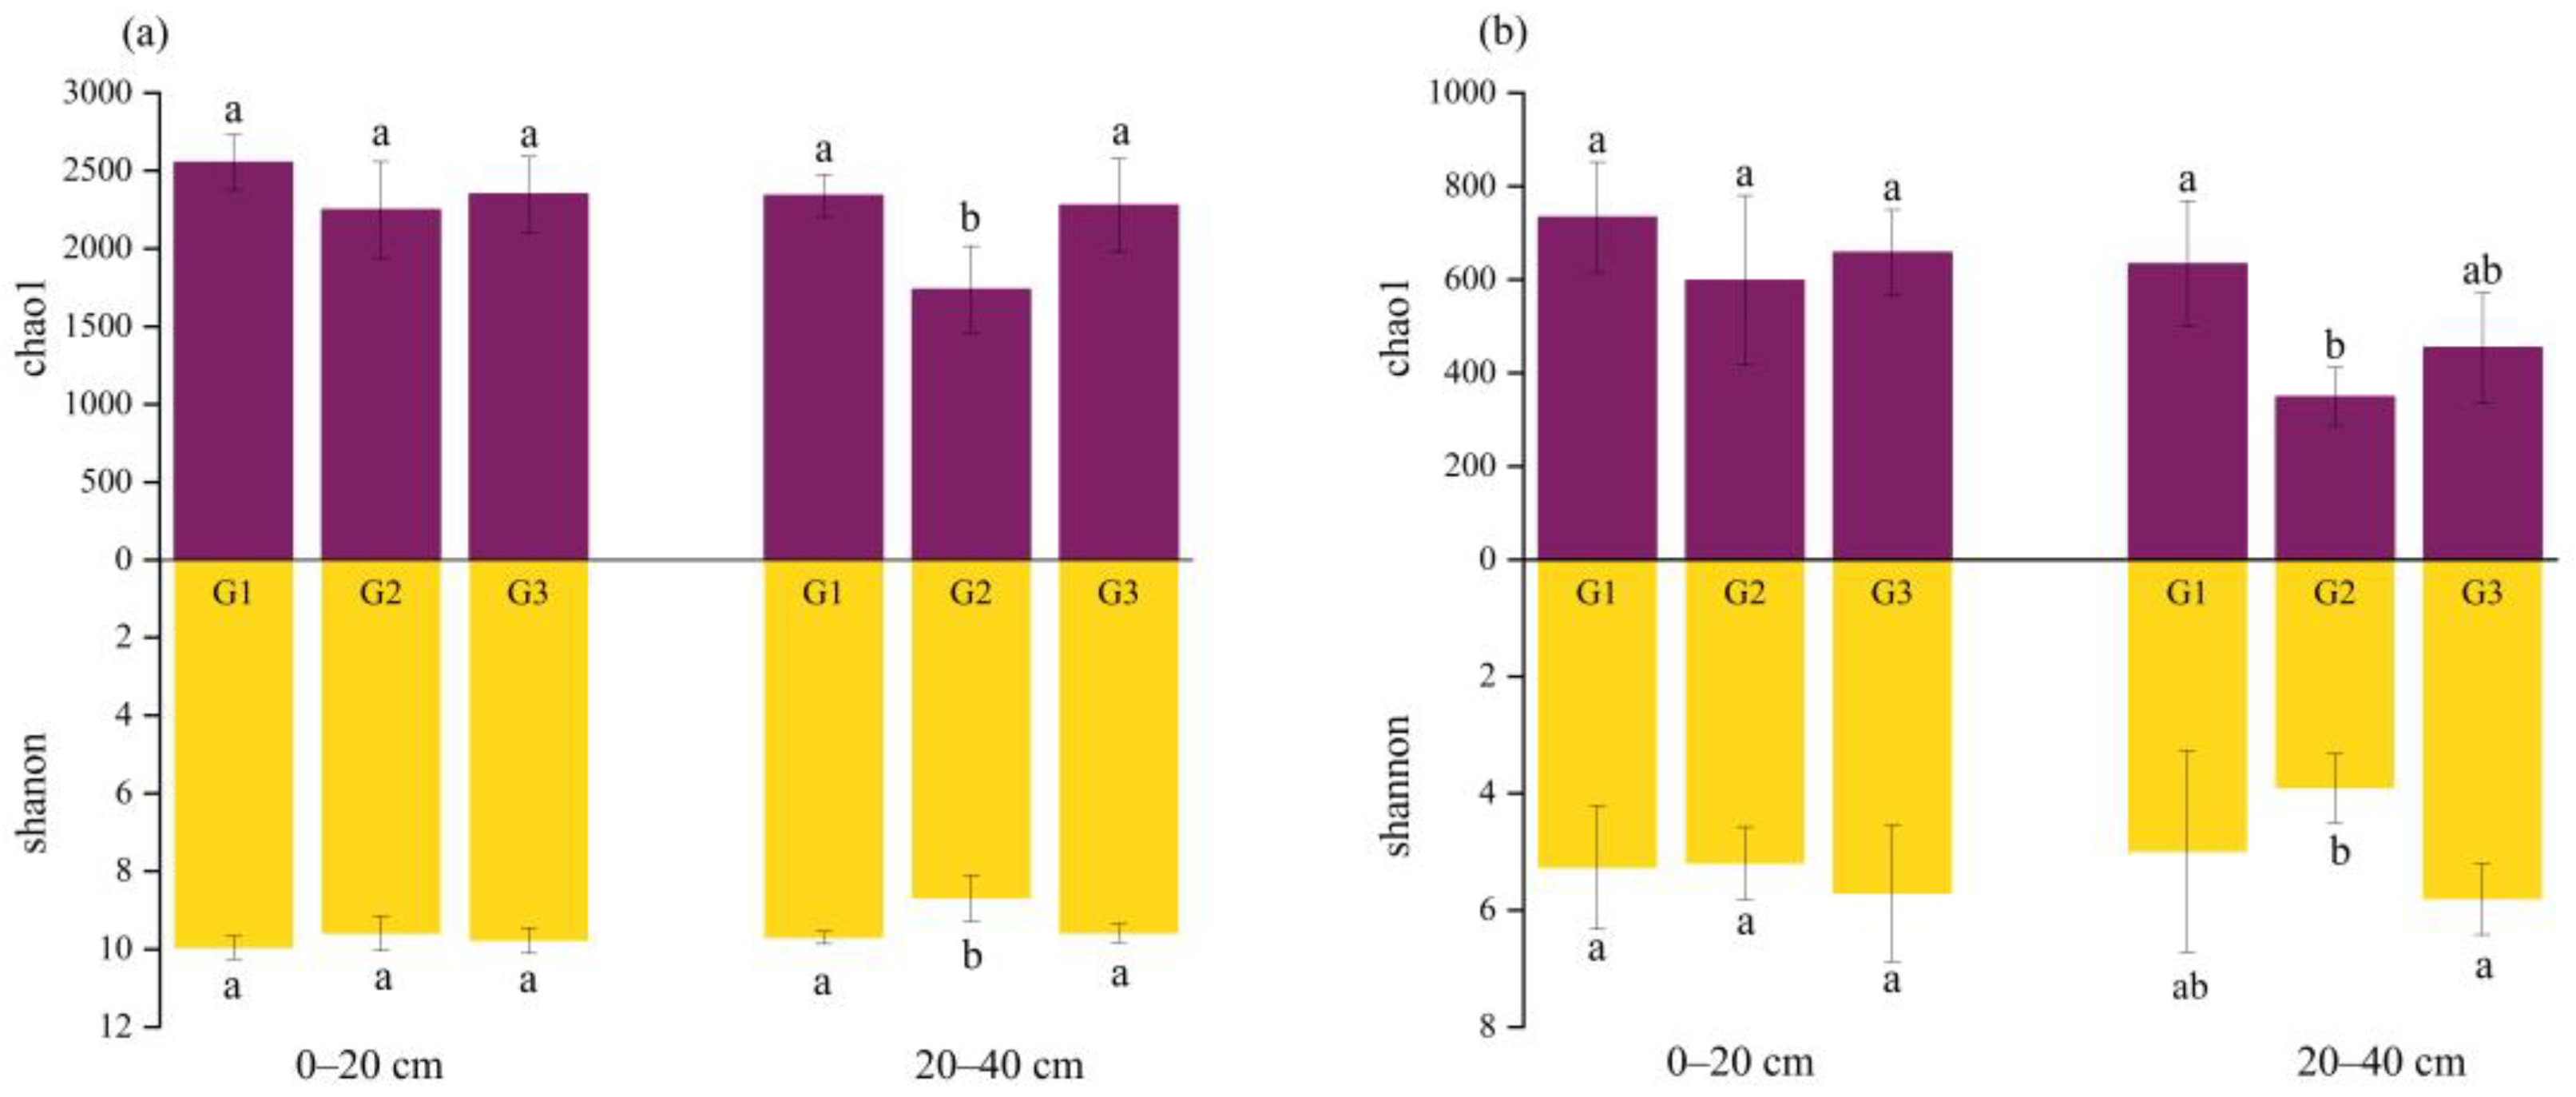
The diversity of soil microbial species in the forest stands was described in terms of the Chao1 and Shannon indices (Figure 6). Neither the bacterial nor the fungal community diversity in the upper soil horizon was significantly affected by multigenerational succession planting; however, the subsoil diversity of bacteria and fungi in G2 was significantly lower than that in G1 and G3. From the bacterial point of view, there was a trend toward a decrease in the diversity of surface soil bacterial communities with increasing generations of successive planting. Bacterial diversity was significantly lower in the deep soil (20–40 cm) of the G2 stand compared with the G1 and G3 stands (Figure 6a). As in the case of bacteria, in the surface soil (0–20 cm), multigenerational succession planting did not significantly affect fungal alpha diversity. Similarly, the trend of the fungal community Chao1 index was consistent with that of bacteria, but the Shannon index was greatest in the G3 stand. These findings indicate that the G3 stand possessed a greater abundance of the fungal community. In the deeper soil horizon, the fungal Chao1 and Shannon indices were lowest in the G2 stand (Figure 6b), and the bacterial and fungal diversity decreased to different extents in the second-generation Eucalyptus plantation forest. The correlation analyses revealed significant correlations between the bacterial Chao1 index and SWC and between DOC and MBC in the 0–20 cm soil horizon, with SWC showing the strongest correlation with the bacterial Shannon index. Of the soil factors we measured, only the SWC was significantly correlated with the fungal Chao1 index. In the 20–40 cm soil horizon, the bacterial Chao1 index was strongly related to the SWC and DOC, and the Shannon index was positively correlated with the SWC and TP. The fungal Chao1 index was closely correlated with SWC, DOC, TN, TP, and SOC but was significantly negatively correlated with ROC. None of the correlations between the fungal Shannon index and the soil factors were significant (Table 3).

3.5. Relationships between the SPPs and Microbiota

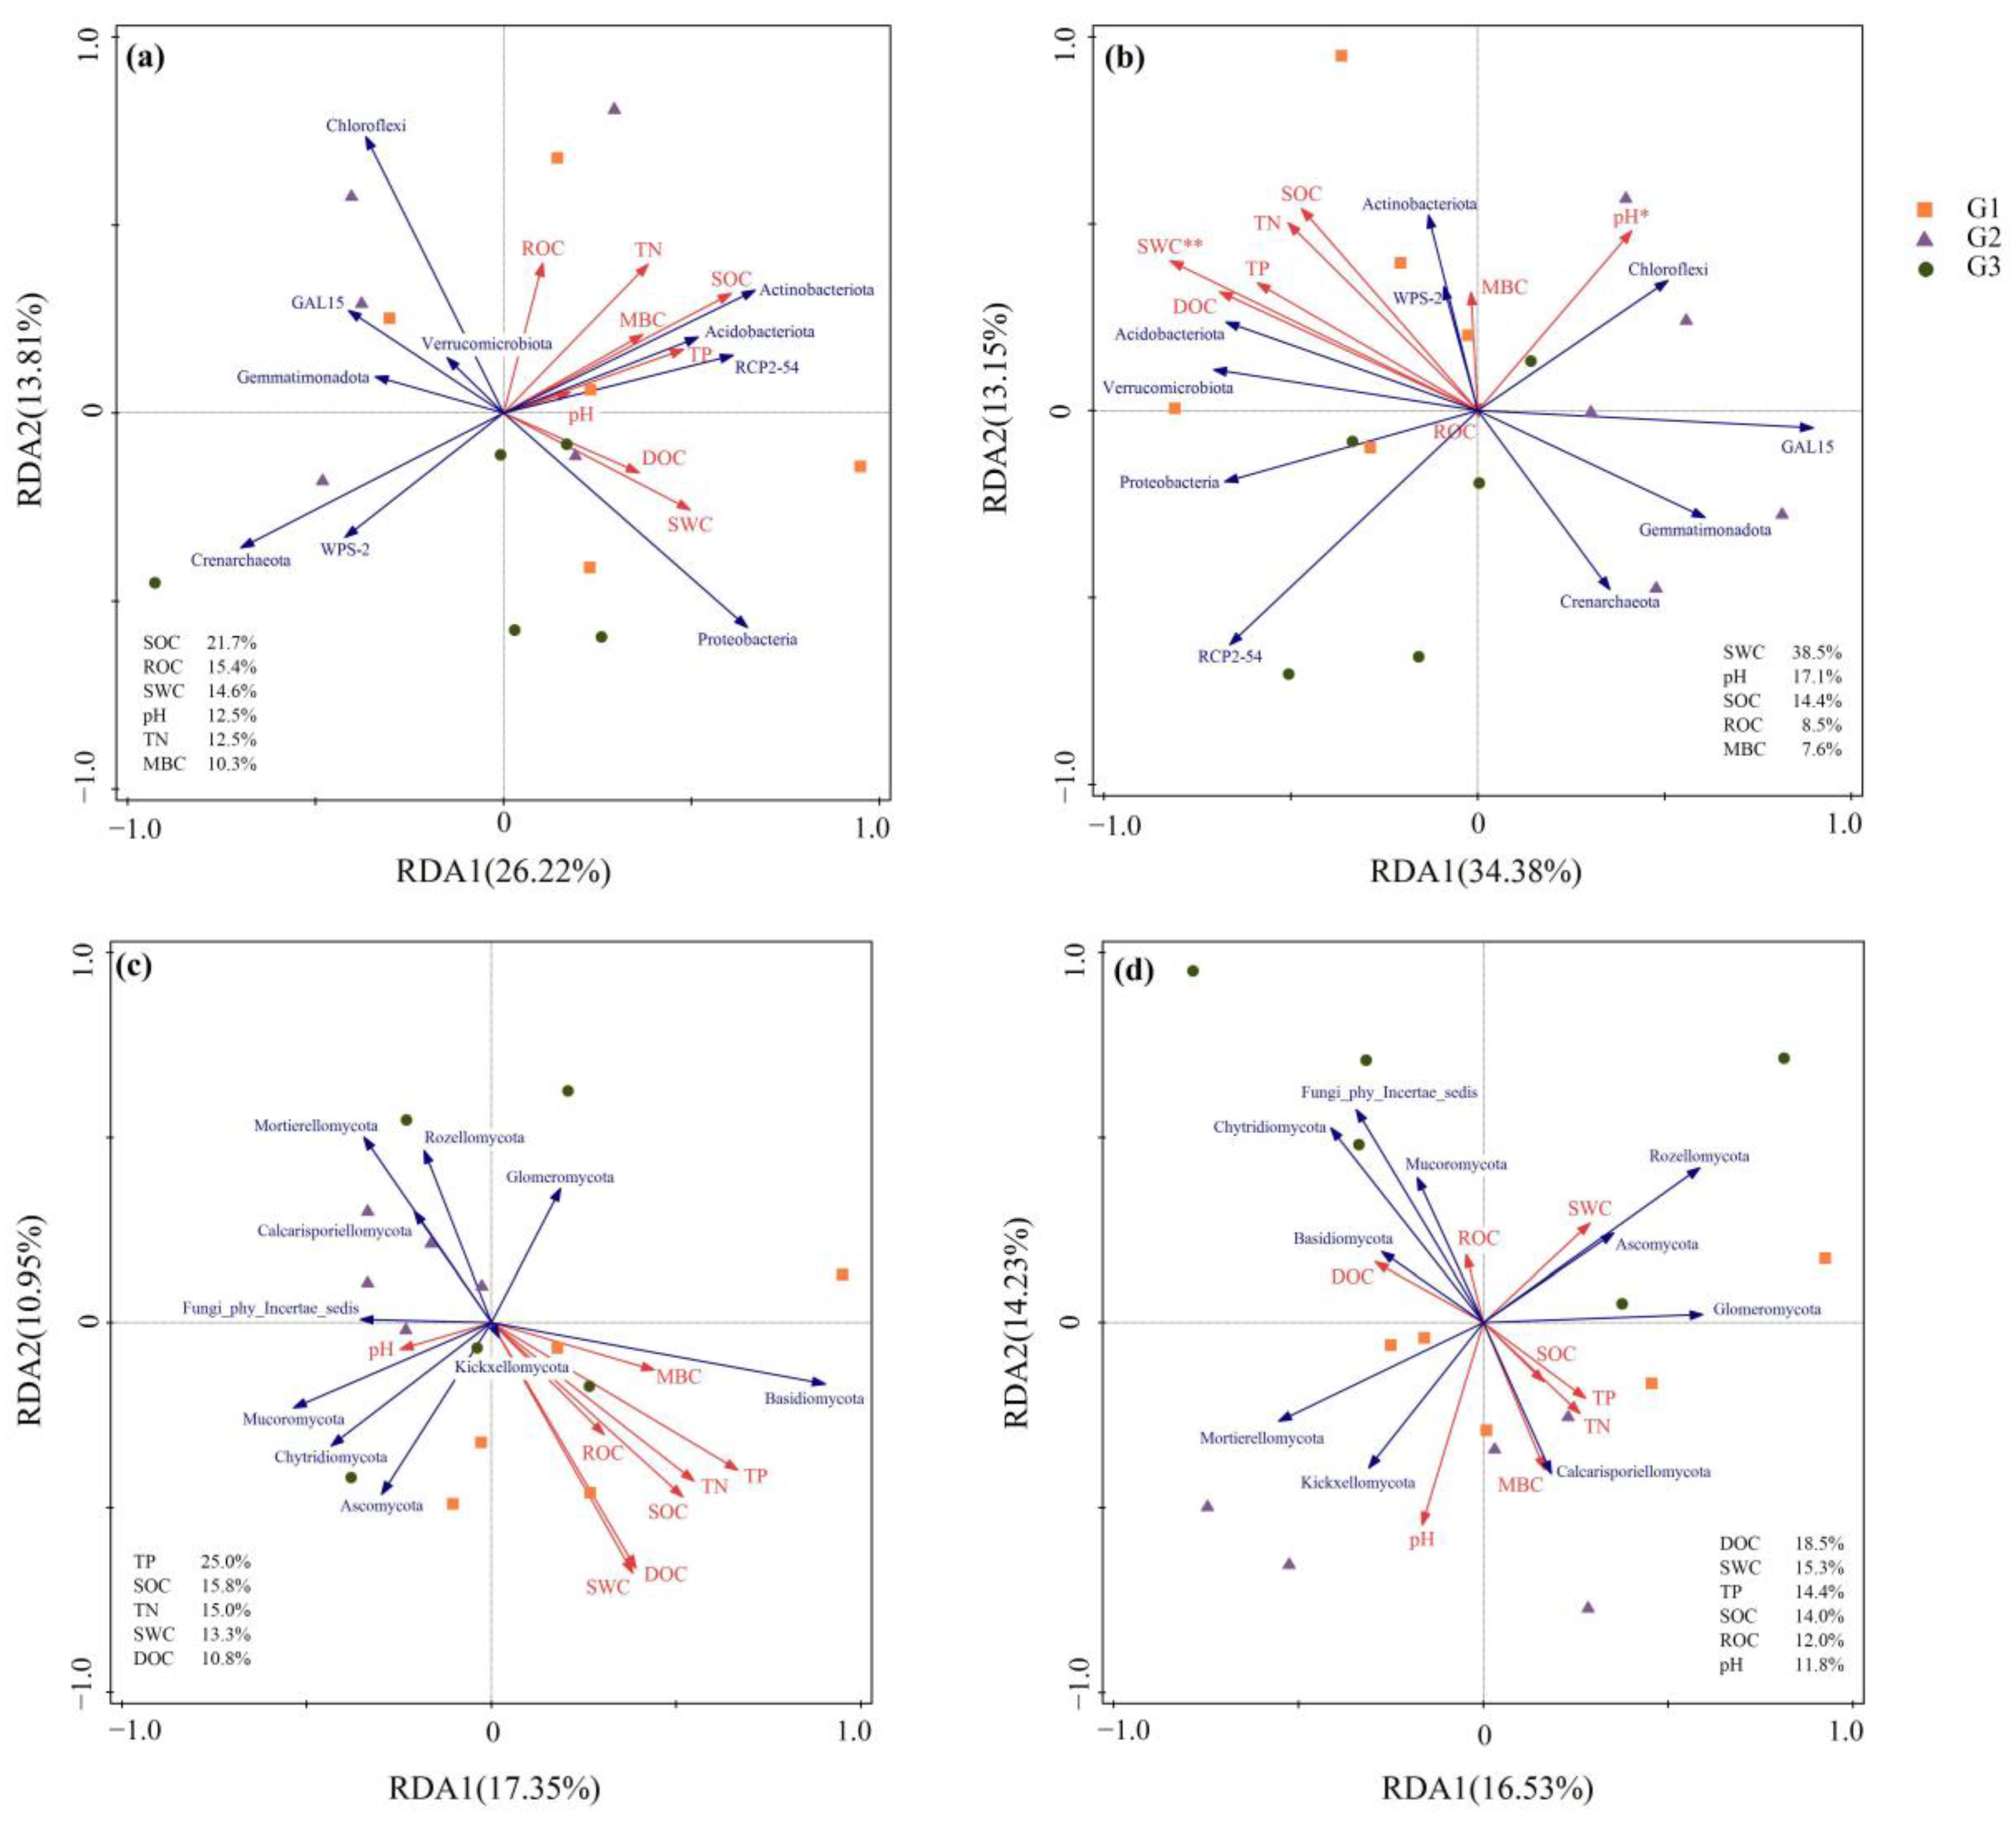
From the results of the redundancy analysis (RDA), it is clear that the bacterial and fungal communities are coordinated by multiple environmental factors (Figure 7). In terms of the bacterial communities, the most influential environmental factors in the 0–20 cm soil horizon were SOC and SWC, followed by TN and TP (Figure 7a). A total of 40.03% of the total variation in the soil bacterial communities and the SPPs was explained by the first two axes, with the highest contributing environmental factors being SOC, ROC, and SWC. In deep soil (20–40 cm), SWC and pH had significant effects on the bacterial community (Figure 7b). The first two axes together explained 47.53% of the variation in the soil bacterial community and in the environmental factors, with the highest contributing environmental factors being SWC, pH, and SOC. From the perspective of the fungal communities, in the surface layer (0–20 cm), the environmental factors affecting the fungal communities were mainly SWC and DOC, followed by SOC, TN, and TP (Figure 7c). In total, 17.53% of the variance was explained by the first axis, whereas the second axis explained 10.95%, with the largest contributing factor being TP at 25.0%. In the 20–40 cm soil horizon, environmental factors, mainly pH and SWC, affected the fungal community (Figure 7d). The first two axes together explained 30.76% of the variation in fungal communities and environmental factors.
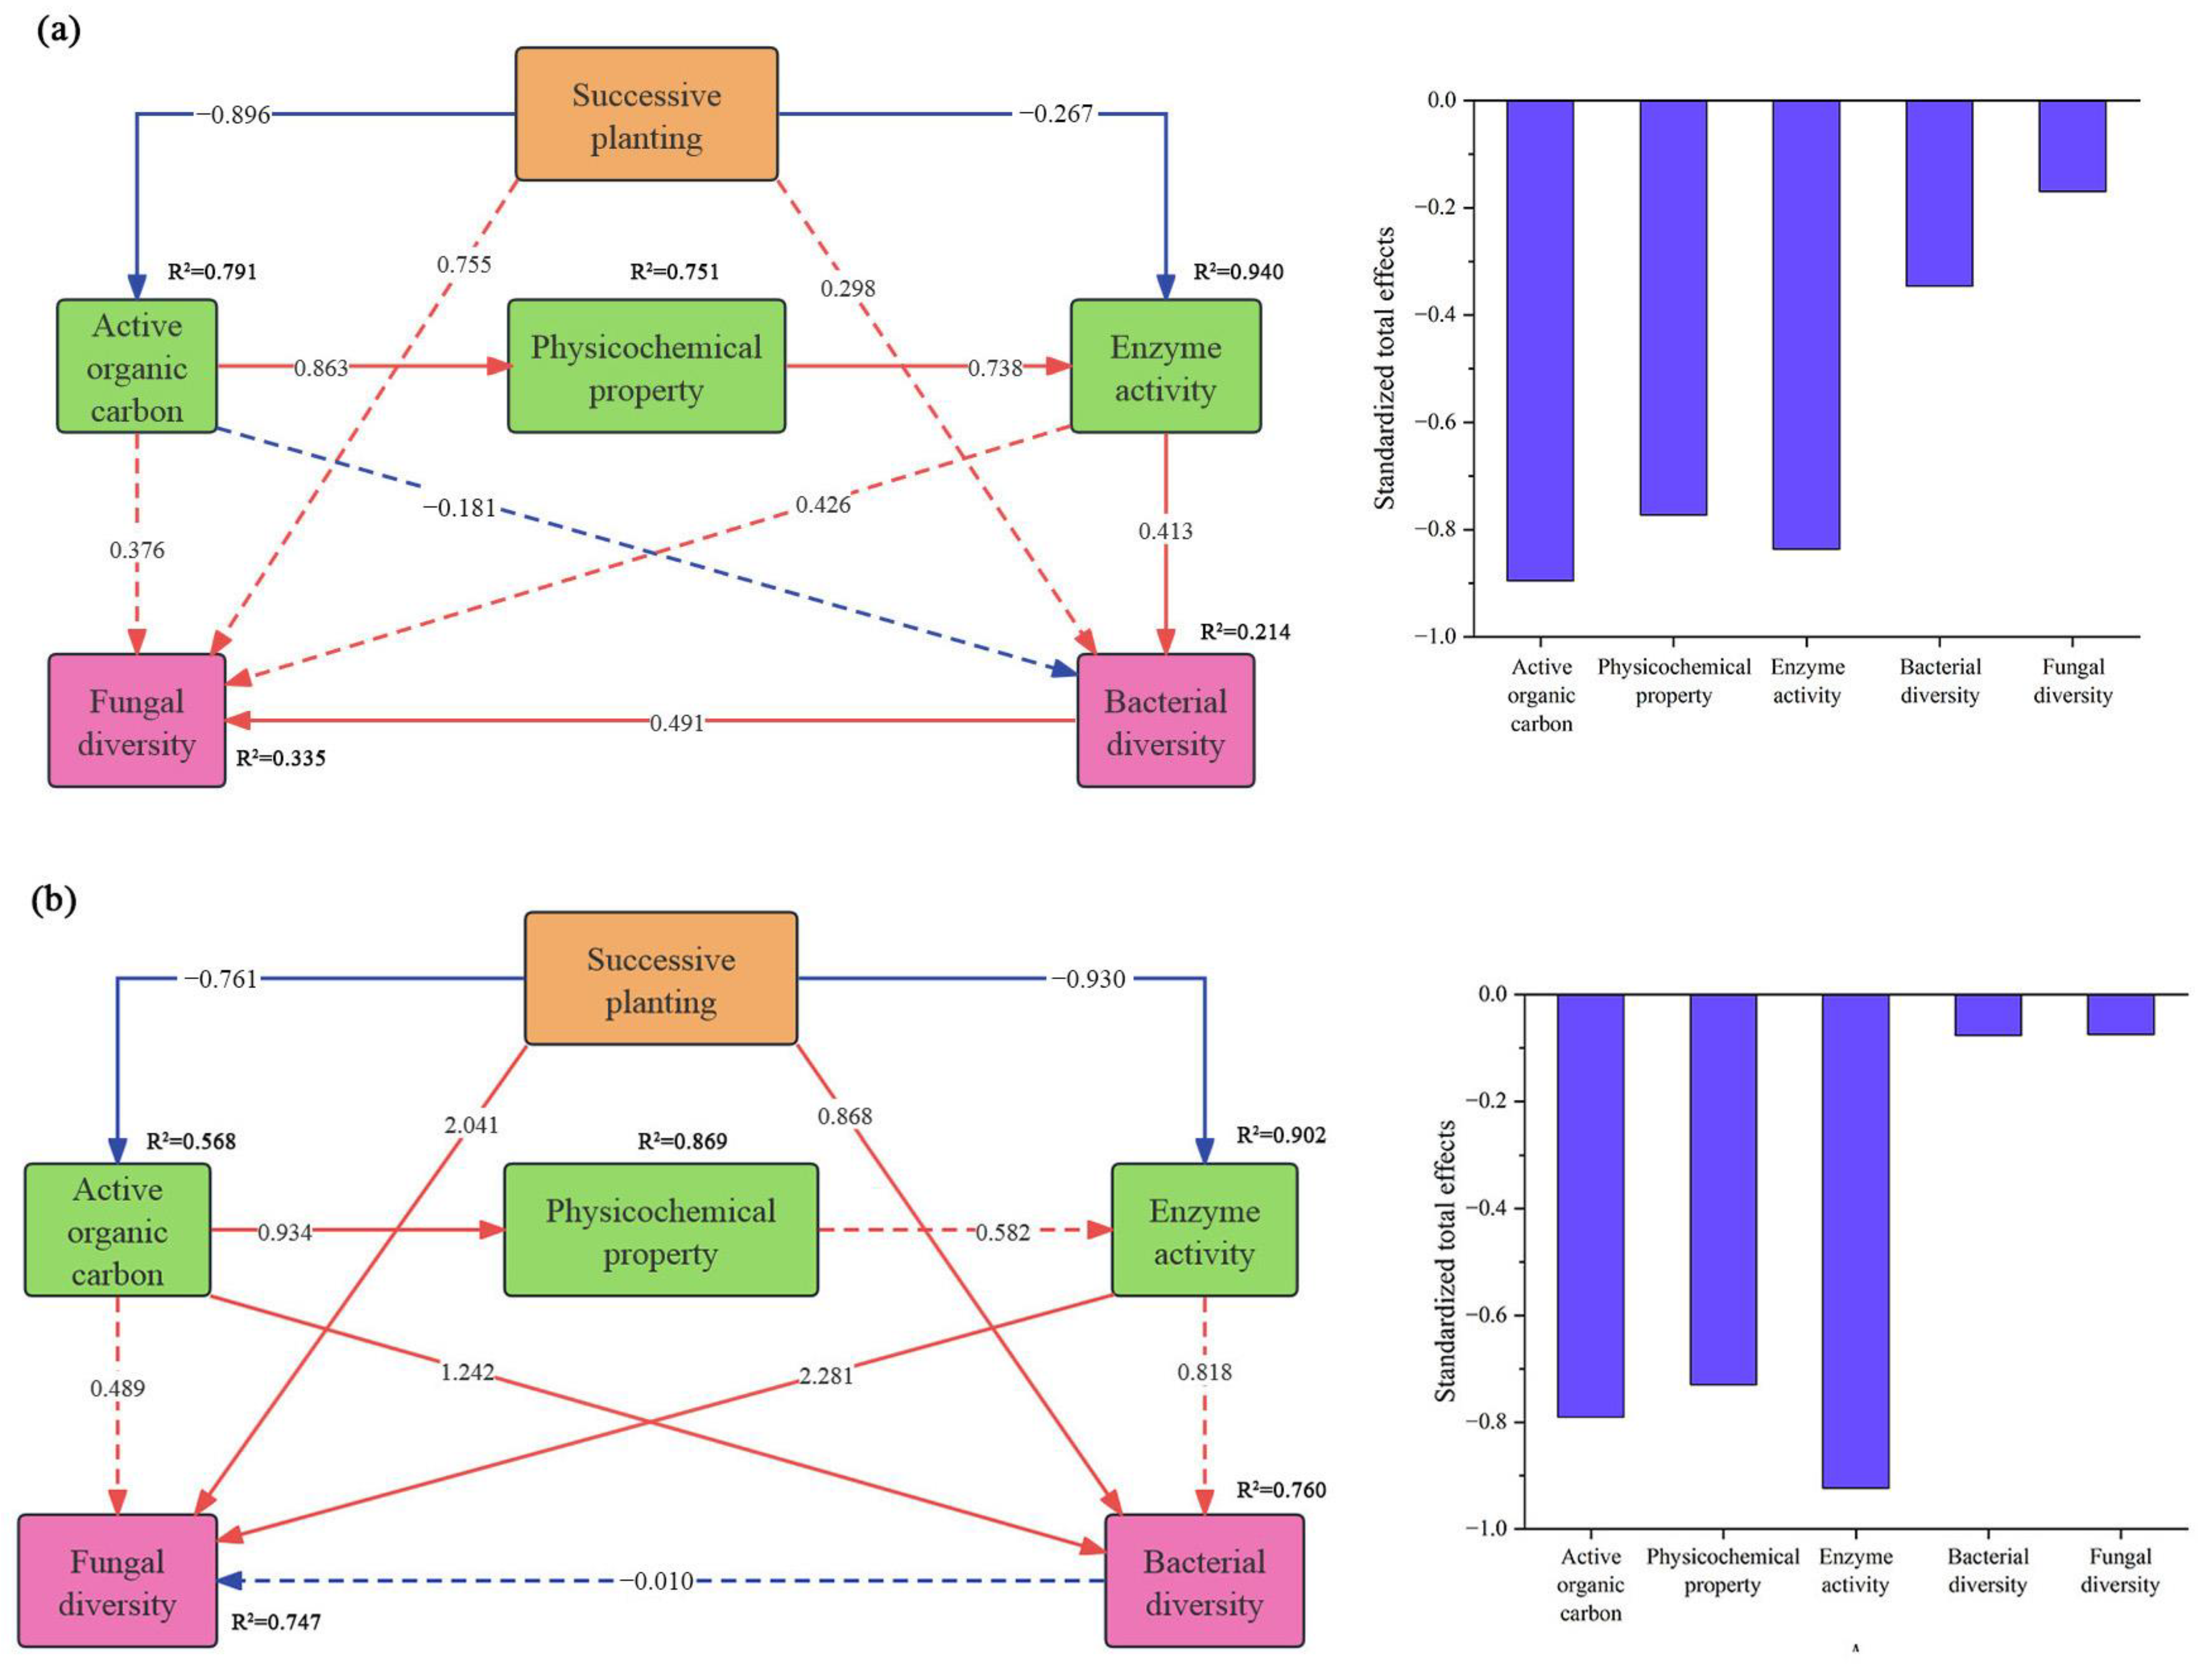
The outcome of structural equation modeling revealed that the negative influence of the multigeneration sequential planting of Eucalyptus on the fractions of SOC and enzyme activities was significant (Figure 8). In the surface soil horizon, bacterial community diversity was directly influenced by enzyme activity and indirectly influenced by Eucalyptus succession and the organic carbon fractions; fungal community diversity was directly influenced by bacteria (Figure 8a). In the 20–40 cm soil horizon, succession and soil organic carbon fractions directly influenced bacterial diversity, while succession and enzyme activity directly influenced fungal diversity (Figure 8b).

4. Discussion

4.1. Response of SPPs to Multiple Generations of Successive Planting

The varying soil physicochemical properties indicate that successive cropping has a significant impact on the soil physicochemical properties of Eucalyptus plantation forests, with significant changes in soil characteristics and a serious decline in overall quality with an increasing number of successive plantations. Our study showed that the successive planting of Eucalyptus led to a deterioration in the soil physical properties in the forest stands, possibly due to plantation forestry practices such as the plowing of the soil and the clearing of understory cover plants, which allows direct sunlight to reach the soil, increasing its temperature and evaporation, which in turn leads to a higher SBD and lower SWC [50]. The research by Zheng et al. suggests that the reduced SOC content due to soil and water loss can lead to an increase in SBD [50]. Furthermore, Eucalyptus, as a deep-rooted species with a well-developed root system, absorbs high amounts of water from the soil; therefore, planting multiple generations of Eucalyptus may also result in a reduction in SWC [51]. Soil physical properties are affected by successive planting, and soil nutrients also decline to varying degrees, probably because nutrients from supplementary fertilizers and leaf litter decomposition are not sufficient to compensate for the negative impact on soil nutrients from repeated multigeneration plantings [52]. The cultivation of plantation forests may mineralize SOC and leach ROC [53]; therefore, SOC and its active fractions decrease generation by generation. In the management of Eucalyptus plantations, several measures, such as the long-term application of inorganic fertilizers and manual weeding, can cause soil compaction and acidification, which also reduces organic matter to some extent [54]. Furthermore, the increase in SBD slows the carbon cycling rate, which reduces the SAOC fraction in the soil of stands with high numbers of successive plantations [55]. Tang et al. reported that the contents of aliphatic hydrocarbons, phenolic alcohols, and aromatic hydrocarbons increased in the soil with increasing plantation age, altering the SOC structure [56]. A recent meta-analysis confirmed that the relationships between MBC and SOC and TN were positive and significant [57]. A decrease in soil MBC may be associated with the lower levels of SOC and TN needed for microbial growth [58]. Additionally, the accumulation of plant root secretions (e.g., phenolic acids) could explain this phenomenon, as the release of a variety of chemosensory compounds from the root system results in a reduction in the relative abundance of microorganisms (e.g., mycorrhizal fungi), which decreases the MBC content [59,60]. ROC and MBC did not decrease in the deeper soil horizon; a possible reason for this could be that, compared with the topsoil horizon, the underlying soil has a more stable environment and is less susceptible to external environmental conditions [61].

4.2. Multiple Generations of Successive Planting Reduced Soil Enzyme Activity

Soil enzymes are essential for the conversion and utilization of plant nutrients as well as for organic matter mineralization; thus, soil enzyme activity is frequently used to assess soil quality due to its objectivity and precision [62]. Our study suggested that the multigenerational succession of Eucalyptus plantations influences soil enzyme activity, similar to the results from previous studies [63]. A reduction in SOC, TN, TP, DOC, and SWC may result in reduced soil enzyme activities, and the relationship between enzyme activity and SPPs also confirmed this view (Figure 3). As substrates for soil enzyme reactions, nutrients such as SOC, TN, and TP have a large influence on enzyme activity, and a decrease in their contents often results in a corresponding decrease in soil enzyme activity [64]. A reduction in soil SOC and TN was detrimental to the formation of enzyme–humus complexes, and the maintenance of enzyme activity and delay of catabolism were also negatively affected by these complexes [65]. Another possible explanation is that multiple generations of Eucalyptus trees result in the accumulation of chemosensory substances, which reduce soil enzyme activities [66]. In addition, soil bulk density increases and soil moisture and aeration deteriorate under the successive planting of Eucalyptus, and enzymatic reaction rates are consequently reduced, resulting in decreased soil enzyme activity [67]. Furthermore, microbial biomass is also a main factor that drives changes in soil enzyme activity, and a decrease in microbial biomass with increasing generations of continuously planted Eucalyptus may also be the reason for the decreased enzyme activity [68]. Furthermore, SOC and its active fractions have a high explanatory power for variations in enzyme activity because a lower SOC and higher microbial metabolic activity subject microorganisms in tropical and subtropical forest soils to strong carbon limitations [69].

4.3. Differences in the Diversity and Structure of Soil Bacterial and Fungal Communities across Generations of Regenerated Stands

The stability of forest stand soil ecosystems is largely regulated by microbial community diversity, and reductions in microbial diversity may cause imbalances in soil ecosystems, leading to reduced soil quality [20]. Multiple generations of succession plantations result in lower soil nutrient contents and reduced microbial biomass and enzyme activity, which may be responsible for the decline in microbial community diversity [70]. It has been reported that pH is a key factor that controls the diversity and structure of the microbiota [12,71]; however, in our study, we found no significant difference in pH between the three stands, so there may be other reasons for the changes in soil microbial diversity. Correlation analyses revealed strong positive correlations between SWC and bacterial and fungal community diversities. Most of the substrates used by microorganisms as energy sources are water-soluble, and the decrease in the soil water content due to multigenerational succession (Table 2) means that the energy available to microorganisms is reduced, as is the efficiency with which they utilize the resource, resulting in a loss of soil microbial diversity [72]. Schimel argues that because soil microbes are generally carbon-deficient, any biodegradable carbon is rapidly metabolized and utilized; therefore, microbiome diversity is likely to respond to changes in the effectiveness of water and carbon [73]. Similarly, our study showed that the soil bacterial and fungal diversities were correlated not only with the soil water content but also with the organic carbon active fraction (Table 3), possibly because the active carbon fraction is readily available to microorganisms and is conducive to stabilizing and complicating microbial networks [74].
Microbial communities in forest ecosystems are impacted by a wide range of factors. The soil microbiota structure responds to soil nutrient differences induced by forestry practices, and this response can be attributed to the distribution of dominant taxa [75]. The dominant bacterial and fungal phyla were not significantly impacted by the planting of successive generations in the two soil horizons studied, but the abundance of the dominant species differed between generations. The phyla with the highest relative abundances were Acidobacteria, Proteobacteria, and Chloroflexi (bacteria), and Ascomycota and Basidiomycota (fungi). This result is in accordance with the worldwide soil bacterial and fungal distributions [76,77]. Notably, multigeneration succession significantly impacted the relative abundances of Crenarchaeota and Actinobacteriota. Bomberg et al. [78] found that Crenarchaeota contains genes that enable it to supply itself with nutrients for growth by fixing CO2, allowing it to grow in oxygen-deprived conditions, and successive planting makes the soil compacted and less ventilate, providing favorable conditions for the survival of Crenarchaeota, which may explain the increase in relative abundance from generation to generation. Actinobacterial species are specialized aerobic bacteria that release enzymes that degrade cellulose and lignin and, in doing so, increase the efficiency of carbon source utilization; thus, the decrease in their abundance is consistent with the gradual decrease in the SOC content with successive generations [79]. Furthermore, a study by [80] showed a positive correlation between Actinobacteria and the N content, and a decrease in TN content with successive generations may also cause a generation-by-generation decrease in the relative abundance of Actinobacteria. Basidiomycota richness was significantly influenced by successive planting, and its abundance was highest in the one-generation forests. Basidiomycota tend to aggregate in nutrient-rich soils [81]; therefore, in multigenerational succession plantations of Eucalyptus with much lower nutrient contents, the relative abundance of Basidiomycota was significantly lower. It was concluded that nutrient-rich soil provides good conditions for the growth and development of Ascomycota, and in agreement with these findings, the relative abundance of Ascomycota was greater in the G1 stand, which had a higher nutrient content in this study. In addition, numerous fungi with a relatively low abundance also possess high activity levels and may play a necessary role in regulating ecosystem functioning [82]. These fungi also have their own special environmental needs; for instance, soil pH significantly impacts Chytridiomycota, Calcarisporiellomycota, and Mortierellomycota, and the abundances of Glomeromycota and Mucoromycota are negatively correlated with the nitrogen fraction [81,83,84]. However, the ecological functions of these fungi are poorly understood and need to be further explored.

4.4. Factors Affecting the Soil Microbiota during Successive Multigenerational Planting

The redundancy analysis results indicated that the SPPs, which included the SWC, pH, SOC, ROC, DOC, MBC, and TP, mainly influenced the relative abundances of bacteria and fungi (Figure 7). Among all the environmental factors we measured, soil pH is the factor that best explains variations in the structure and diversity of microbiota. pH can influence the microbiota structure by altering soil nutrient effectiveness and organic carbon status [85]. On the other hand, pH can impact plant communities as well as soil fauna and further drive changes in microbiota [86]. In addition, soil microorganisms are sensitive to SWC, and microbial activity and respiration decrease when the soil dries out [87]; in turn, when soil moisture increases, the oxygen limitation decreases microbial activity [88]. The content and effectiveness of the SOC and nutrients also significantly impact the bacterial community structure as well as the fungal community structure [89]. This finding is also consistent with our suggestion that the soil microbiota structure is influenced by different environmental factors.
A structural equation modeling was performed to investigate whether the effects of successive Eucalyptus planting on the SPPs, enzyme activities, and structure of the microbiota were direct. Consistent with our hypothesis (c), the multigeneration successive planting of Eucalyptus had a direct or indirect inhibitory effect on SPPs and enzyme activities, and through these effects, the plants negatively affected the microorganisms. As the most effective part of the soil carbon pool, active organic carbon is more readily utilized by microorganisms, and the multigeneration successive planting of Eucalyptus led to a reduction in soil active organic carbon content and a decrease in the effectiveness of soil organic carbon, which may lead to a shortage of microbial energy supply, resulting in differences in soil microbial communities [90]. Microbial carbon utilization efficiency is sensitive to nutrient stoichiometry ratios, and reductions in the active organic carbon fraction may exacerbate soil nutrient stoichiometry imbalances, with consequent impacts on the microbial community [91]. It has been shown that soil microbes can be limited by substrate availability [92]. The decrease in enzyme activity slows down the soil nutrient conversion cycle, and active organic carbon, as a substrate available to microorganisms, is also reduced [93]. This may also ultimately reduce the diversity of soil microbial communities. When soil organic carbon availability decreases, soil microorganisms will reduce enzyme production to increase carbon source utilization efficiency. Therefore, soil microorganisms may respond to the decrease in soil active organic carbon content by regulating the release of enzymes [94]. Soil microbes may use carbon cycle-related enzymes to increase the availability of effective resources. A study revealed that forest trees indirectly affect soil microorganisms by altering the soil microclimate and affecting root secretions, causing fluctuations in soil properties and enzyme activities [95]. Overall, the successive planting of Eucalyptus across multiple generations has a negative effect on the diversity of the soil microbiota, and this impact is influenced by the fractions of SOC and enzyme activity. However, the effects of forest trees on soil microorganisms are not always realized through soil properties and enzyme activities; rather, they may also be mediated by shrubby plants and soil fauna [96]. Therefore, further research is needed to understand the response of soil microorganisms to changes in understory vegetation and soil fauna communities.

5. Conclusions

This study indicated that the physical and chemical properties of soil and the enzyme activities of the pure E. grandis × E. urophylla plantation decreased with multiple generations of successive planting. In the deeper soil horizon, the differences in the diversity and abundance of soil bacterial communities across generations, as well as those of fungi, were significant; the increase in successive planting generations led to a tendency of decreasing and then recovering. In addition, multigenerational successive plantings also altered the relative abundance of microorganisms, showing a significant increase in Crenarchaeota and a generation-by-generation decrease in Actinobacteria as the number of successive planting generations increased. A redundancy analysis (RDA) revealed that SOC and SWC are the key drivers of changes in soil bacterial and fungal communities. Structural equation modeling (SEM) further revealed that multiple generations of continuously planted trees had direct negative effects on the fractions of SOC and enzyme activities, and an overall negative effect on the diversity of the bacterial community in the 20–40 cm soil horizon, as well as the fungal community. This effect was mediated by active organic carbon and enzyme activity. Overall, as the number of successive planting generations increases, soil physiochemical properties, active organic carbon fractions, and enzyme activities in the pure E. grandis × E. urophylla plantation forests decline to varying degrees, and microbial communities are also negatively impacted. The accumulation and sustainable productivity of soil organic carbon pools are thus threatened. Therefore, for the sake of achieving the sustainable management of Eucalyptus plantation forests, special attention should be paid to the variation in soil nutrients and microbial communities in Eucalyptus forest stands, and more appropriate Eucalyptus plantation forest management strategies should be applied.

Supplementary Materials

The following supporting information can be downloaded at: https://www.mdpi.com/article/10.3390/f15071166/s1.

Author Contributions

Conceptualization, C.J.; data curation, C.J. and Y.H.; formal analysis, C.J.; funding acquisition, S.Y.; investigation, C.J., Y.H., Y.C. and Y.L.; methodology, C.J., Y.H., Y.C. and H.Z.; project administration, S.Y.; resources, S.Y.; software, C.J.; supervision, S.Y.; visualization, C.J. and Y.C.; writing—original draft, C.J.; writing—review and editing, Y.L., H.Z. and S.Y. All authors have read and agreed to the published version of the manuscript.

Funding

This research was funded by the National Natural Science Foundation of China, grant number 32260382.

Data Availability Statement

The original contributions presented in the study are included in the article/Supplementary Materials; further inquiries can be directed to the corresponding author.

Acknowledgments

We thank the Guangxi State-owned Bobai Forest Farm for their help during the fieldwork. We are also grateful to the two anonymous reviewers for their insightful comments and suggestions on the manuscript.

Conflicts of Interest

The authors declare no conflicts of interest.

References

  1. Zhang, P.; Pang, S.; Yang, B.; Liu, S.; Jia, H.; Chen, J.; Guo, D. Effects of different mixing patterns on growth, litter production and soil nutrients in Eucalyptus plantations. J. Northwest Sci-Tech Univ. Agric. For. (Nat. Sci. Ed.) 2021, 49, 31–37. [Google Scholar]
  2. de Moraes Goncalves, J.L.; Alvares, C.A.; Higa, A.R.; Silva, L.D.; Alfenas, A.C.; Stahl, J.; de Barros Ferraz, S.F.; Lima, W.d.P.; Santin Brancalion, P.H.; Hubner, A.; et al. Integrating genetic and silvicultural strategies to minimize abiotic and biotic constraints in Brazilian eucalypt plantations. For. Ecol. Manag. 2013, 301, 6–27. [Google Scholar] [CrossRef]
  3. Wang, T.; Dai, Q.; Fu, Y.; Wei, P. Effect of continuous planting on tree growth traits and growth stress in plantation forests of Eucalyptus urophylla × E. grandis. Sustainability 2023, 15, 9624. [Google Scholar] [CrossRef]
  4. Asante, P.; Armstrong, G.W.; Adamowicz, W.L. Carbon sequestration and the optimal forest harvest decision: A dynamic programming approach considering biomass and dead organic matter. J. For. Econ. 2011, 17, 3–17. [Google Scholar] [CrossRef]
  5. Iovieno, P.; Alfani, A.; Baath, E. Soil microbial community structure and biomass as affected by Pinus pinea plantation in two Mediterranean areas. Appl. Soil Ecol. 2010, 45, 56–63. [Google Scholar] [CrossRef]
  6. Luo, G.; Rensing, C.; Chen, H.; Liu, M.; Wang, M.; Guo, S.; Ling, N.; Shen, Q. Deciphering the associations between soil microbial diversity and ecosystem multifunctionality driven by long-term fertilization management. Funct. Ecol. 2018, 32, 1103–1116. [Google Scholar] [CrossRef]
  7. Liu, J.; Wazir, Z.G.; Hou, G.-Q.; Wang, G.-Z.; Rong, F.-X.; Xu, Y.-Z.; Liu, K.; Li, M.-Y.; Liu, A.-J.; Liu, H.-L. The dependent correlation between soil multifunctionality and bacterial community across different farmland soils. Front. Microbiol. 2023, 14, 1144823. [Google Scholar] [CrossRef]
  8. Li, J.; Delgado-Baquerizo, M.; Wang, J.-T.; Hu, H.-W.; Cai, Z.-J.; Zhu, Y.-N.; Singh, B.K. Fungal richness contributes to multifunctionality in boreal forest soil. Soil Biol. Biochem. 2019, 136, 107526. [Google Scholar] [CrossRef]
  9. Ma, L.; Guo, C.; Lu, X.; Yuan, S.; Wang, R. Soil moisture and land use are major determinants of soil microbial community composition and biomass at a regional scale in northeastern China. Biogeosciences 2015, 12, 2585–2596. [Google Scholar] [CrossRef]
  10. Fierer, N.; Jackson, R.B. The diversity and biogeography of soil bacterial communities. Proc. Natl. Acad. Sci. USA 2006, 103, 626–631. [Google Scholar] [CrossRef]
  11. Wang, C.; Xue, L.; Dong, Y.; Jiao, R. Effects of stand density on soil microbial community composition and enzyme activities in subtropical Cunninghamia lanceolate (Lamb.) Hook plantations. For. Ecol. Manag. 2021, 479, 118559. [Google Scholar] [CrossRef]
  12. Bahram, M.; Hildebrand, F.; Forslund, S.K.; Anderson, J.L.; Soudzilovskaia, N.A.; Bodegom, P.M.; Bengtsson-Palme, J.; Anslan, S.; Coelho, L.P.; Harend, H.; et al. Structure and function of the global topsoil microbiome. Nature 2018, 560, 233–237. [Google Scholar] [CrossRef]
  13. Lu, X.; Hu, H.; Sun, L. Effect of fire disturbance on active organic carbon of Larix gmelinii forest soil in Northeastern China. J. For. Res. 2017, 28, 763–774. [Google Scholar] [CrossRef]
  14. Zhang, J.; Wang, S.; Feng, Z.; Wang, Q. Stability of soil organic carbon changes in successive rotations of Chinese fir (Cunninghamia lanceolata (Lamb.) Hook) plantations. J. Environ. Sci. 2009, 21, 352–359. [Google Scholar] [CrossRef]
  15. Zhang, Y.; Su, X.; Cong, J.; Lu, H.; Liu, M. The characteristics of soil organic carbon and soil microbial community structure in two deciduous broadleaved forest types. Chin. J. Soil Sci. 2014, 45, 625–629. [Google Scholar]
  16. Jia, X.; Zhong, Y.; Liu, J.; Zhu, G.; Shangguan, Z.; Yan, W. Effects of nitrogen enrichment on soil microbial characteristics: From biomass to enzyme activities. Geoderma 2020, 366, 114256. [Google Scholar] [CrossRef]
  17. Adetunji, A.T.; Lewu, F.B.; Mulidzi, R.; Ncube, B. The biological activities of β-glucosidase, phosphatase and urease as soil quality indicators: A review. J. Soil Sci. Plant Nutr. 2017, 17, 794–807. [Google Scholar] [CrossRef]
  18. Trivedi, P.; Delgado-Baquerizo, M.; Trivedi, C.; Hu, H.; Anderson, I.C.; Jeffries, T.C.; Zhou, J.; Singh, B.K. Microbial regulation of the soil carbon cycle: Evidence from gene-enzyme relationships. ISME J. 2016, 10, 2593–2604. [Google Scholar] [CrossRef]
  19. de Mesquita, C.P.B.; Knelman, J.E.; King, A.J.; Farrer, E.C.; Porazinska, D.L.; Schmidt, S.K.; Suding, K.N. Plant colonization of moss-dominated soils in the alpine: Microbial and biogeochemical implications. Soil Biol. Biochem. 2017, 111, 135–142. [Google Scholar] [CrossRef]
  20. Zhu, L.; Wang, X.; Chen, F.; Li, C.; Wu, L. Effects of the successive planting of Eucalyptus urophylla on soil bacterial and fungal community structure, diversity, microbial biomass, and enzyme activity. Land Degrad. Dev. 2019, 30, 636–646. [Google Scholar] [CrossRef]
  21. Tomao, A.; Antonio Bonet, J.; Castano, C.; de-Miguel, S. How does forest management affect fungal diversity and community composition? Current knowledge and future perspectives for the conservation of forest fungi. For. Ecol. Manag. 2020, 457, 117678. [Google Scholar] [CrossRef]
  22. Wu, Z.; Haack, S.E.; Lin, W.; Li, B.; Wu, L.; Fang, C.; Zhang, Z. Soil microbial community structure and metabolic activity of Pinus elliottii plantations across different stand ages in a Subtropical area. PLoS ONE 2015, 10, e0135354. [Google Scholar] [CrossRef]
  23. Zhang, Y.; Ma, X.; Jing, R.; Ma, F.; Guo, J.; Wang, Y.; Wang, H. Effects of successive-planting poplar plantation on soil microbial community. J. Shandong Univ. (Nat. Sci.) 2019, 54, 36–46. [Google Scholar]
  24. Paillet, Y.; Berges, L.; Hjalten, J.; Odor, P.; Avon, C.; Bernhardt-Roemermann, M.; Bijlsma, R.-J.; De Bruyn, L.; Fuhr, M.; Grandin, U.; et al. Biodiversity Differences between Managed and Unmanaged Forests: Meta-Analysis of Species Richness in Europe. Conserv. Biol. 2010, 24, 101–112. [Google Scholar] [CrossRef]
  25. Chen, J.; Deng, Z.; Jiang, Z.; Sun, J.; Meng, F.; Zuo, X.; Wu, L.; Cao, G.; Cao, S. Variations of rhizosphere and bulk soil microbial community in successive planting of Chinese fir (Cunninghamia lanceolata). Front. Plant Sci. 2022, 13, 954777. [Google Scholar] [CrossRef]
  26. Dai, Q.; Wang, T.; Wei, P.; Fu, Y. Effects of successive planting of Eucalyptus plantations on tree growth and soil quality. Sustainability 2023, 15, 6746. [Google Scholar] [CrossRef]
  27. de Vries, F.T.; Griffiths, R.I.; Bailey, M.; Craig, H.; Girlanda, M.; Gweon, H.S.; Hallin, S.; Kaisermann, A.; Keith, A.M.; Kretzschmar, M.; et al. Soil bacterial networks are less stable under drought than fungal networks. Nat. Commun. 2018, 9, 3033. [Google Scholar] [CrossRef]
  28. Li, H.; Yang, S.; Semenov, M.V.; Yao, F.; Ye, J.; Bu, R.; Ma, R.; Lin, J.; Kurganova, I.; Wang, X.; et al. Temperature sensitivity of SOM decomposition is linked with a K-selected microbial community. Glob. Change Biol. 2021, 27, 2763–2779. [Google Scholar] [CrossRef] [PubMed]
  29. Jatoi, M.T.; Lan, G.; Wu, Z.; Sun, R.; Yang, C.; Tan, Z. Comparison of soil microbial composition and diversity between mixed and monoculture rubber plantations in Hainan Province, China. Trop. Conserv. Sci. 2019, 12, 1–9. [Google Scholar] [CrossRef]
  30. Reijonen, I.; Metzler, M.; Hartikainen, H. Impact of soil pH and organic matter on the chemical bioavailability of vanadium species: The underlying basis for risk assessment. Environ. Pollut. 2016, 210, 371–379. [Google Scholar] [CrossRef]
  31. Shamrikova, E.V.; Vanchikova, E.V.; Kyzyurova, E.V.; Zhangurov, E.V. Methods for Measuring Organic Carbon Content in Carbonate-Containing Soils: A Review. Eurasian Soil Sci. 2024, 57, 380–394. [Google Scholar] [CrossRef]
  32. Tsiknia, M.; Tzanakakis, V.A.; Oikonomidis, D.; Paranychianakis, N.V.; Nikolaidis, N.P. Effects of olive mill wastewater on soil carbon and nitrogen cycling. Appl. Microbiol. Biotechnol. 2014, 98, 2739–2749. [Google Scholar] [CrossRef] [PubMed]
  33. Wu, H.; Li, Y.; Zhang, J.; Niu, L.; Zhang, W.; Cai, W.; Zhu, X. Sediment bacterial communities in a eutrophic lake influenced by multiple inflow-rivers. Environ. Sci. Pollut. Res. 2017, 24, 19795–19806. [Google Scholar] [CrossRef] [PubMed]
  34. Ghani, A.; Dexter, M.; Perrott, K.W. Hot-water extractable carbon in soils: A sensitive measurement for determining impacts of fertilisation, grazing and cultivation. Soil Biol. Biochem. 2003, 35, 1231–1243. [Google Scholar] [CrossRef]
  35. Zhou, W.; Wu, H.; Zhang, Y.; Xu, M.; Muhammad, A.; Wen, S. Improvement of Determination Method for Soil Labile Organic Carbon. Chin. J. Soil Sci. 2019, 50, 70–75. [Google Scholar]
  36. Brookes, P.C.; Landman, A.; Pruden, G.; Jenkinson, D.S. Chloroform fumigation and the release of soil nitrogen: A rapid direct extraction method to measure microbial biomass nitrogen in soil. Soil Biol. Biochem. 1985, 17, 837–842. [Google Scholar] [CrossRef]
  37. Kudeyarov, V.N.; Jenkinson, D.S. The effects of biocidal treatments on metabolism in soil—VI. Fumigation with carbon disulphide. Soil Biol. Biochem. 1976, 8, 375–378. [Google Scholar] [CrossRef]
  38. Bell, C.W.; Fricks, B.E.; Rocca, J.D.; Steinweg, J.M.; McMahon, S.K.; Wallenstein, M.D. High-throughput fluorometric measurement of potential soil extracellular enzyme activities. J. Vis. Exp. 2013, 81, e50961. [Google Scholar]
  39. Wang, C.; Lu, X.; Mori, T.; Mao, Q.; Zhou, K.; Zhou, G.; Nie, Y.; Mo, J. Responses of soil microbial community to continuous experimental nitrogen additions for 13 years in a nitrogen-rich tropical forest. Soil Biol. Biochem. 2018, 121, 103–112. [Google Scholar] [CrossRef]
  40. Bu, J.; Zou, J.; Zhang, X.; Xu, L.; Yang, F.; Sun, X. Influence of different fluorescence quench correction methods on three soil hydrolase activities analyzed by microplate fluorescence method. Chin. J. Soil Sci. 2014, 45, 660–665. [Google Scholar]
  41. Magoc, T.; Salzberg, S.L. FLASH: Fast length adjustment of short reads to improve genome assemblies. Bioinformatics 2011, 27, 2957–2963. [Google Scholar] [CrossRef]
  42. Bokulich, N.A.; Subramanian, S.; Faith, J.J.; Gevers, D.; Gordon, J.I.; Knight, R.; Mills, D.A.; Caporaso, J.G. Quality-filtering vastly improves diversity estimates from Illumina amplicon sequencing. Nat. Methods 2013, 10, 57–59. [Google Scholar] [CrossRef]
  43. Quast, C.; Pruesse, E.; Yilmaz, P.; Gerken, J.; Schweer, T.; Yarza, P.; Peplies, J.; Gloeckner, F.O. The SILVA ribosomal RNA gene database project: Improved data processing and web-based tools. Nucleic Acids Res. 2013, 41, D590–D596. [Google Scholar] [CrossRef]
  44. Nilsson, R.H.; Larsson, K.-H.; Taylor, A.F.S.; Bengtsson-Palme, J.; Jeppesen, T.S.; Schigel, D.; Kennedy, P.; Picard, K.; Gloeckner, F.O.; Tedersoo, L.; et al. The UNITE database for molecular identification of fungi: Handling dark taxa and parallel taxonomic classifications. Nucleic Acids Res. 2019, 47, D259–D264. [Google Scholar] [CrossRef]
  45. Edgar, R.C.; Haas, B.J.; Clemente, J.C.; Quince, C.; Knight, R. UCHIME improves sensitivity and speed of chimera detection. Bioinformatics 2011, 27, 2194–2200. [Google Scholar] [CrossRef]
  46. Callahan, B.J.; McMurdie, P.J.; Rosen, M.J.; Han, A.W.; Johnson, A.J.A.; Holmes, S.P. DADA2: High-resolution sample inference from Illumina amplicon data. Nat. Methods 2016, 13, 581–583. [Google Scholar] [CrossRef]
  47. Wang, Y.; Guo, H.; Gao, X.; Wang, J. The intratumor microbiota signatures associate with subtype, Tumor Stage, and Survival Status of Esophageal Carcinoma. Front. Oncol. 2021, 11, 754788. [Google Scholar] [CrossRef]
  48. Grace, J.B.; Anderson, T.M.; Smith, M.D.; Seabloom, E.; Andelman, S.J.; Meche, G.; Weiher, E.; Allain, L.K.; Jutila, H.; Sankaran, M.; et al. Does species diversity limit productivity in natural grassland communities? Ecol. Lett. 2007, 10, 680–689. [Google Scholar] [CrossRef]
  49. Hair, J.F.; Risher, J.J.; Sarstedt, M.; Ringle, C.M. When to use and how to report the results of PLS-SEM. Eur. Bus. Rev. 2019, 31, 2–24. [Google Scholar] [CrossRef]
  50. Zheng, H.; Ouyang, Z.; Xu, W.; Wang, X.; Miao, H.; Li, X.; Tian, Y. Variation of carbon storage by different reforestation types in the hilly red soil region of southern China. For. Ecol. Manag. 2008, 255, 1113–1121. [Google Scholar] [CrossRef]
  51. Ping, L.; Xie, Z.-Q. Effects of introducing Eucalyptus on indigenous biodiversity. Chin. J. Appl. Ecol. 2009, 20, 1765–1774. [Google Scholar]
  52. Tumer, J.; Lambert, M.J. Nutrient cycling in age sequences of two Eucalyptus plantation species. For. Ecol. Manag. 2008, 255, 1701–1712. [Google Scholar]
  53. Dawoe, E.K.; Quashie-Sam, J.S.; Oppong, S.K. Effect of land-use conversion from forest to cocoa agroforest on soil characteristics and quality of a Ferric Lixisol in lowland humid Ghana. Agrofor. Syst. 2014, 88, 87–99. [Google Scholar] [CrossRef]
  54. Fang, H.; Liu, K.; Li, D.; Peng, X.; Zhang, W.; Zhou, H. Long-term effects of inorganic fertilizers and organic manures on the structure of a paddy soil. Soil Tillage Res. 2021, 213, 105137. [Google Scholar] [CrossRef]
  55. Fan, B.; Ding, J.; Fenton, O.; Daly, K.; Chen, S.; Zhang, S.; Chen, Q. Investigation of differential levels of phosphorus fixation in dolomite and calcium carbonate amended red soil. J. Sci. Food Agric. 2022, 102, 740–749. [Google Scholar] [CrossRef] [PubMed]
  56. Tang, J.; Zhao, J.; Qin, Z.; Chen, L.; Song, X.; Ke, Q.; Wu, L.; Shi, Y. Structural equation model was used to evaluate the effects of soil chemical environment, fertility and enzyme activity on eucalyptus biomass. R. Soc. Open Sci. 2023, 10, 221570. [Google Scholar] [CrossRef]
  57. Wang, Y.; Chen, L.; Xiang, W.; Ouyang, S.; Zhang, T.; Zhang, X.; Zeng, Y.; Hu, Y.; Luo, G.; Kuzyakov, Y. Forest conversion to plantations: A meta-analysis of consequences for soil and microbial properties and functions. Glob. Change Biol. 2021, 27, 5643–5656. [Google Scholar] [CrossRef]
  58. Niu, X.; Sun, X.; Chen, D.; Zhang, S. Soil microorganisms, nutrients and enzyme activity of Larix kaempferi plantation under different ages in mountainous region of eastern Liaoning Province, China. Chin. J. Appl. Ecol. 2015, 26, 2663–2672. [Google Scholar]
  59. Li, X.-g.; Ding, C.-f.; Hua, K.; Zhang, T.-l.; Zhang, Y.-n.; Zhao, L.; Yang, Y.-r.; Liu, J.-g.; Wang, X.-x. Soil sickness of peanuts is attributable to modifications in soil microbes induced by peanut root exudates rather than to direct allelopathy. Soil Biol. Biochem. 2014, 78, 149–159. [Google Scholar] [CrossRef]
  60. Cipollini, D.; Rigsby, C.M.; Barto, E.K. Microbes as targets and mediators of allelopathy in plants. J. Chem. Ecol. 2012, 38, 714–727. [Google Scholar] [CrossRef]
  61. Zhao, H.; Zheng, W.; Zhang, S.; Gao, W.; Fan, Y. Soil microbial community variation with time and soil depth in Eurasian Steppe (Inner Mongolia, China). Ann. Microbiol. 2021, 71, 21. [Google Scholar] [CrossRef]
  62. Paz-Ferreiro, J.; Fu, S.; Mendez, A.; Gasco, G. Interactive effects of biochar and the earthworm Pontoscolex corethrurus on plant productivity and soil enzyme activities. J. Soils Sediments 2014, 14, 483–494. [Google Scholar] [CrossRef]
  63. Zhang, K.; Zheng, H.; Chen, F.L.; Ouyang, Z.Y.; Wang, Y.; Wu, Y.F.; Lan, J.; Fu, M.; Xiang, X.W. Changes in soil quality after converting Pinus to Eucalyptus plantations in southern China. Solid Earth 2015, 6, 115–123. [Google Scholar] [CrossRef]
  64. Wei, S.; Li, L.; Luo, X.; Tan, J.; Liu, X.; Liu, X.; Yang, S.; Cao, Q.; Huang, C. Soil enzyme activities and their relationships to soil physicochemical properties in different successive rotation plantations of Eucalyptus grandis. Chin. J. Appl. Environ. Biol. 2019, 25, 1312–1318. [Google Scholar]
  65. Zhen, Z.; Liu, H.; Wang, N.; Guo, L.; Meng, J.; Ding, N.; Wu, G.; Jiang, G. Effects of manure compost application on soil microbial community diversity and soil microenvironments in a temperate cropland in China. PLoS ONE 2014, 9, e108555. [Google Scholar] [CrossRef] [PubMed]
  66. Gu, S.; Hu, Q.; Cheng, Y.; Bai, L.; Liu, Z.; Xiao, W.; Gong, Z.; Wu, Y.; Feng, K.; Deng, Y.; et al. Application of organic fertilizer improves microbial community diversity and alters microbial network structure in tea (Camellia sinensis) plantation soils. Soil Tillage Res. 2019, 195, 104356. [Google Scholar] [CrossRef]
  67. Prieto, L.H.; Bertiller, M.B.; Carrera, A.L.; Olivera, N.L. Soil enzyme and microbial activities in a grazing ecosystem of Patagonian Monte, Argentina. Geoderma 2011, 162, 281–287. [Google Scholar] [CrossRef]
  68. Tischer, A.; Blagodatskaya, E.; Hamer, L. Extracellular enzyme activities in a tropical mountain rainforest region of southern Ecuador affected by low soil P status and land-use change. Appl. Soil Ecol. 2014, 74, 1–11. [Google Scholar] [CrossRef]
  69. Chen, R.; Yin, L.; Wang, X.; Chen, T.; Jia, L.; Jiang, Q.; Lyu, M.; Yao, X.; Chen, G. Mineral-associated organic carbon predicts the variations in microbial biomass and specific enzyme activities in a subtropical forest. Geoderma 2023, 439, 116671. [Google Scholar] [CrossRef]
  70. Guillaume, T.; Kotowska, M.M.; Hertel, D.; Knohl, A.; Krashevska, V.; Murtilaksono, K.; Scheu, S.; Kuzyakov, Y. Carbon costs and benefits of Indonesian rainforest conversion to plantations. Nat. Commun. 2018, 9, 2388. [Google Scholar] [CrossRef]
  71. Philippot, L.; Chenu, C.; Kappler, A.; Rillig, M.C.; Fierer, N. The interplay between microbial communities and soil properties. Nat. Rev. Microbiol. 2024, 22, 226–239. [Google Scholar] [CrossRef] [PubMed]
  72. Tecon, R.; Or, D. Biophysical processes supporting the diversity of microbial life in soil. Fems Microbiol. Rev. 2017, 41, 599–623. [Google Scholar] [CrossRef] [PubMed]
  73. Schimel, J.P. Life in dry soils: Effects of drought on soil microbial communities and processes. Annu. Rev. Ecol. Evol. Syst. 2018, 49, 409–432. [Google Scholar] [CrossRef]
  74. Shi, J.; Yang, L.; Liao, Y.; Li, J.; Jiao, S.; Shangguan, Z.; Deng, L. Soil labile organic carbon fractions mediate microbial community assembly processes during long-term vegetation succession in a semiarid region. iMeta 2023, 2, e142. [Google Scholar] [CrossRef] [PubMed]
  75. Xu, Y.; Li, C.; Zhu, W.; Wang, Z.; Wu, L.; Du, A. Effects of enrichmemt planting with native tree species on bacterial community structure and potential impact on Eucalyptus plantations in southern China. J. For. Res. 2022, 33, 1349–1363. [Google Scholar] [CrossRef]
  76. Tedersoo, L.; Bahram, M.; Polme, S.; Koljalg, U.; Yorou, N.S.; Wijesundera, R.; Villarreal Ruiz, L.; Vasco-Palacios, A.M.; Pham Quang, T.; Suija, A.; et al. Global diversity and geography of soil fungi. Science 2014, 346, 1256688. [Google Scholar] [CrossRef] [PubMed]
  77. Delgado-Baquerizo, M.; Oliverio, A.M.; Brewer, T.E.; Benavent-Gonzalez, A.; Eldridge, D.J.; Bardgett, R.D.; Maestre, F.T.; Singh, B.K.; Fierer, N. A global atlas of the dominant bacteria found in soil. Science 2018, 359, 320–325. [Google Scholar] [CrossRef] [PubMed]
  78. Bomberg, M.; Montonen, L.; Timonen, S. Anaerobic Eury- and Crenarchaeota inhabit ectomycorrhizas of boreal forest Scots pine. Eur. J. Soil Biol. 2010, 46, 356–364. [Google Scholar] [CrossRef]
  79. Barka Essaid, A.; Vatsa, P.; Sanchez, L.; Gaveau-Vaillant, N.; Jacquard, C.; Klenk, H.-P.; Clément, C.; Ouhdouch, Y.; van Wezel Gilles, P. Taxonomy, Physiology, and Natural products of Actinobacteria. Microbiol. Mol. Biol. Rev. 2015, 80, 1–43. [Google Scholar] [CrossRef]
  80. Liu, H.; Awasthi, M.K.; Zhang, Z.; Syed, A.; Bahkali, A.H.; Sindhu, R.; Verma, M. Microbial dynamics and nitrogen retention during sheep manure composting employing peach shell biochar. Bioresour. Technol. 2023, 386, 129555. [Google Scholar] [CrossRef]
  81. Guo, J.; Feng, H.; Roberge, G.; Feng, L.; Pan, C.; McNie, P.; Yu, Y. The negative effect of Chinese fir (Cunninghamia lanceolata) monoculture plantations on soil physicochemical properties, microbial biomass, fungal communities, and enzymatic activities. For. Ecol. Manag. 2022, 519, 120297. [Google Scholar] [CrossRef]
  82. Zhang, Z.; Pan, Y.; Liu, Y.; Li, M. High-Level diversity of basal fungal lineages and the control of fungal community assembly by stochastic processes in mangrove sediments. Appl. Environ. Microbiol. 2021, 87, e00928-21. [Google Scholar] [CrossRef]
  83. Shi, Y.; Qiu, L.; Guo, L.; Man, J.; Shang, B.; Pu, R.; Ou, X.; Dai, C.; Liu, P.; Yang, Y.; et al. K fertilizers reduce the accumulation of Cd in Panax notoginseng (Burk.) FH by improving the quality of themicrobial community. Front. Plant Sci. 2020, 11, 888. [Google Scholar] [CrossRef] [PubMed]
  84. Chen, C.; Zhang, J.; Lu, M.; Qin, C.; Chen, Y.; Yang, L.; Huang, Q.; Wang, J.; Shen, Z.; Shen, Q. Microbial communities of an arable soil treated for 8 years with organic and inorganic fertilizers. Biol. Fertil. Soils 2016, 52, 455–467. [Google Scholar] [CrossRef]
  85. Waldrop, M.P.; Holloway, J.M.; Smith, D.B.; Goldhaber, M.B.; Drenovsky, R.E.; Scow, K.M.; Dick, R.; Howard, D.; Wylie, B.; Grace, J.B. The interacting roles of climate, soils, and plant production on soil microbial communities at a continental scale. Ecology 2017, 98, 1957–1967. [Google Scholar] [CrossRef] [PubMed]
  86. Johnston, A.S.A.; Sibly, R.M. Multiple environmental controls explain global patterns in soil animal communities. Oecologia 2020, 192, 1047–1056. [Google Scholar] [CrossRef]
  87. Carbone, M.S.; Still, C.J.; Ambrose, A.R.; Dawson, T.E.; Williams, A.P.; Boot, C.M.; Schaeffer, S.M.; Schimel, J.P. Seasonal and episodic moisture controls on plant and microbial contributions to soil respiration. Oecologia 2011, 167, 265–278. [Google Scholar] [CrossRef]
  88. Davidson, E.A.; Samanta, S.; Caramori, S.S.; Savage, K. The Dual Arrhenius and Michaelis-Menten kinetics model for decomposition of soil organic matter at hourly to seasonal time scales. Glob. Change Biol. 2012, 18, 371–384. [Google Scholar] [CrossRef]
  89. Sul, W.J.; Asuming-Brempong, S.; Wang, Q.; Tourlousse, D.M.; Penton, C.R.; Deng, Y.; Rodrigues, J.L.M.; Adiku, S.G.K.; Jones, J.W.; Zhou, J.; et al. Tropical agricultural land management influences on soil microbial communities through its effect on soil organic carbon. Soil Biol. Biochem. 2013, 65, 33–38. [Google Scholar] [CrossRef]
  90. Ramirez, P.B.; Fuentes-Alburquenque, S.; Diez, B.; Vargas, I.; Bonilla, C.A. Soil microbial community responses to labile organic carbon fractions in relation to soil type and land use along a climate gradient. Soil Biol. Biochem. 2020, 141, 107692. [Google Scholar] [CrossRef]
  91. Zhu, D.; Liu, Y.; Chen, J.; Jiang, P. Long-term successive rotation affects soil microbial resource limitation and carbon use efficiency in Chinese fir (Cunninghamia lanceolata) monoculture plantations. For. Ecol. Manag. 2023, 540, 121037. [Google Scholar] [CrossRef]
  92. Fioretto, A.; Papa, S.; Pellegrino, A.; Ferrigno, A. Microbial activities in soils of a Mediterranean ecosystem in different successional stages. Soil Biol. Biochem. 2009, 41, 2061–2068. [Google Scholar] [CrossRef]
  93. Zhou, Y.; Staver, A.C. Enhanced activity of soil nutrient-releasing enzymes after plant invasion: A meta-analysis. Ecology 2019, 100, e02830. [Google Scholar] [CrossRef] [PubMed]
  94. Cui, Y.; Fang, L.; Guo, X.; Wang, X.; Zhang, Y.; Li, P.; Zhang, X. Ecoenzymatic stoichiometry and microbial nutrient limitation in rhizosphere soil in the arid area of the northern Loess Plateau, China. Soil Biol. Biochem. 2018, 116, 11–21. [Google Scholar] [CrossRef]
  95. Prescott, C.E.; Grayston, S.J. Tree species influence on microbial communities in litter and soil: Current knowledge and research needs. For. Ecol. Manag. 2013, 309, 19–27. [Google Scholar] [CrossRef]
  96. Frouz, J.; Liveckova, M.; Albrechtova, J.; Chronakova, A.; Cajthaml, T.; Pizl, V.; Hanel, L.; Stary, J.; Baldrian, P.; Lhotakova, Z.; et al. Is the effect of trees on soil properties mediated by soil fauna? A case study from post-mining sites. For. Ecol. Manag. 2013, 309, 87–95. [Google Scholar] [CrossRef]
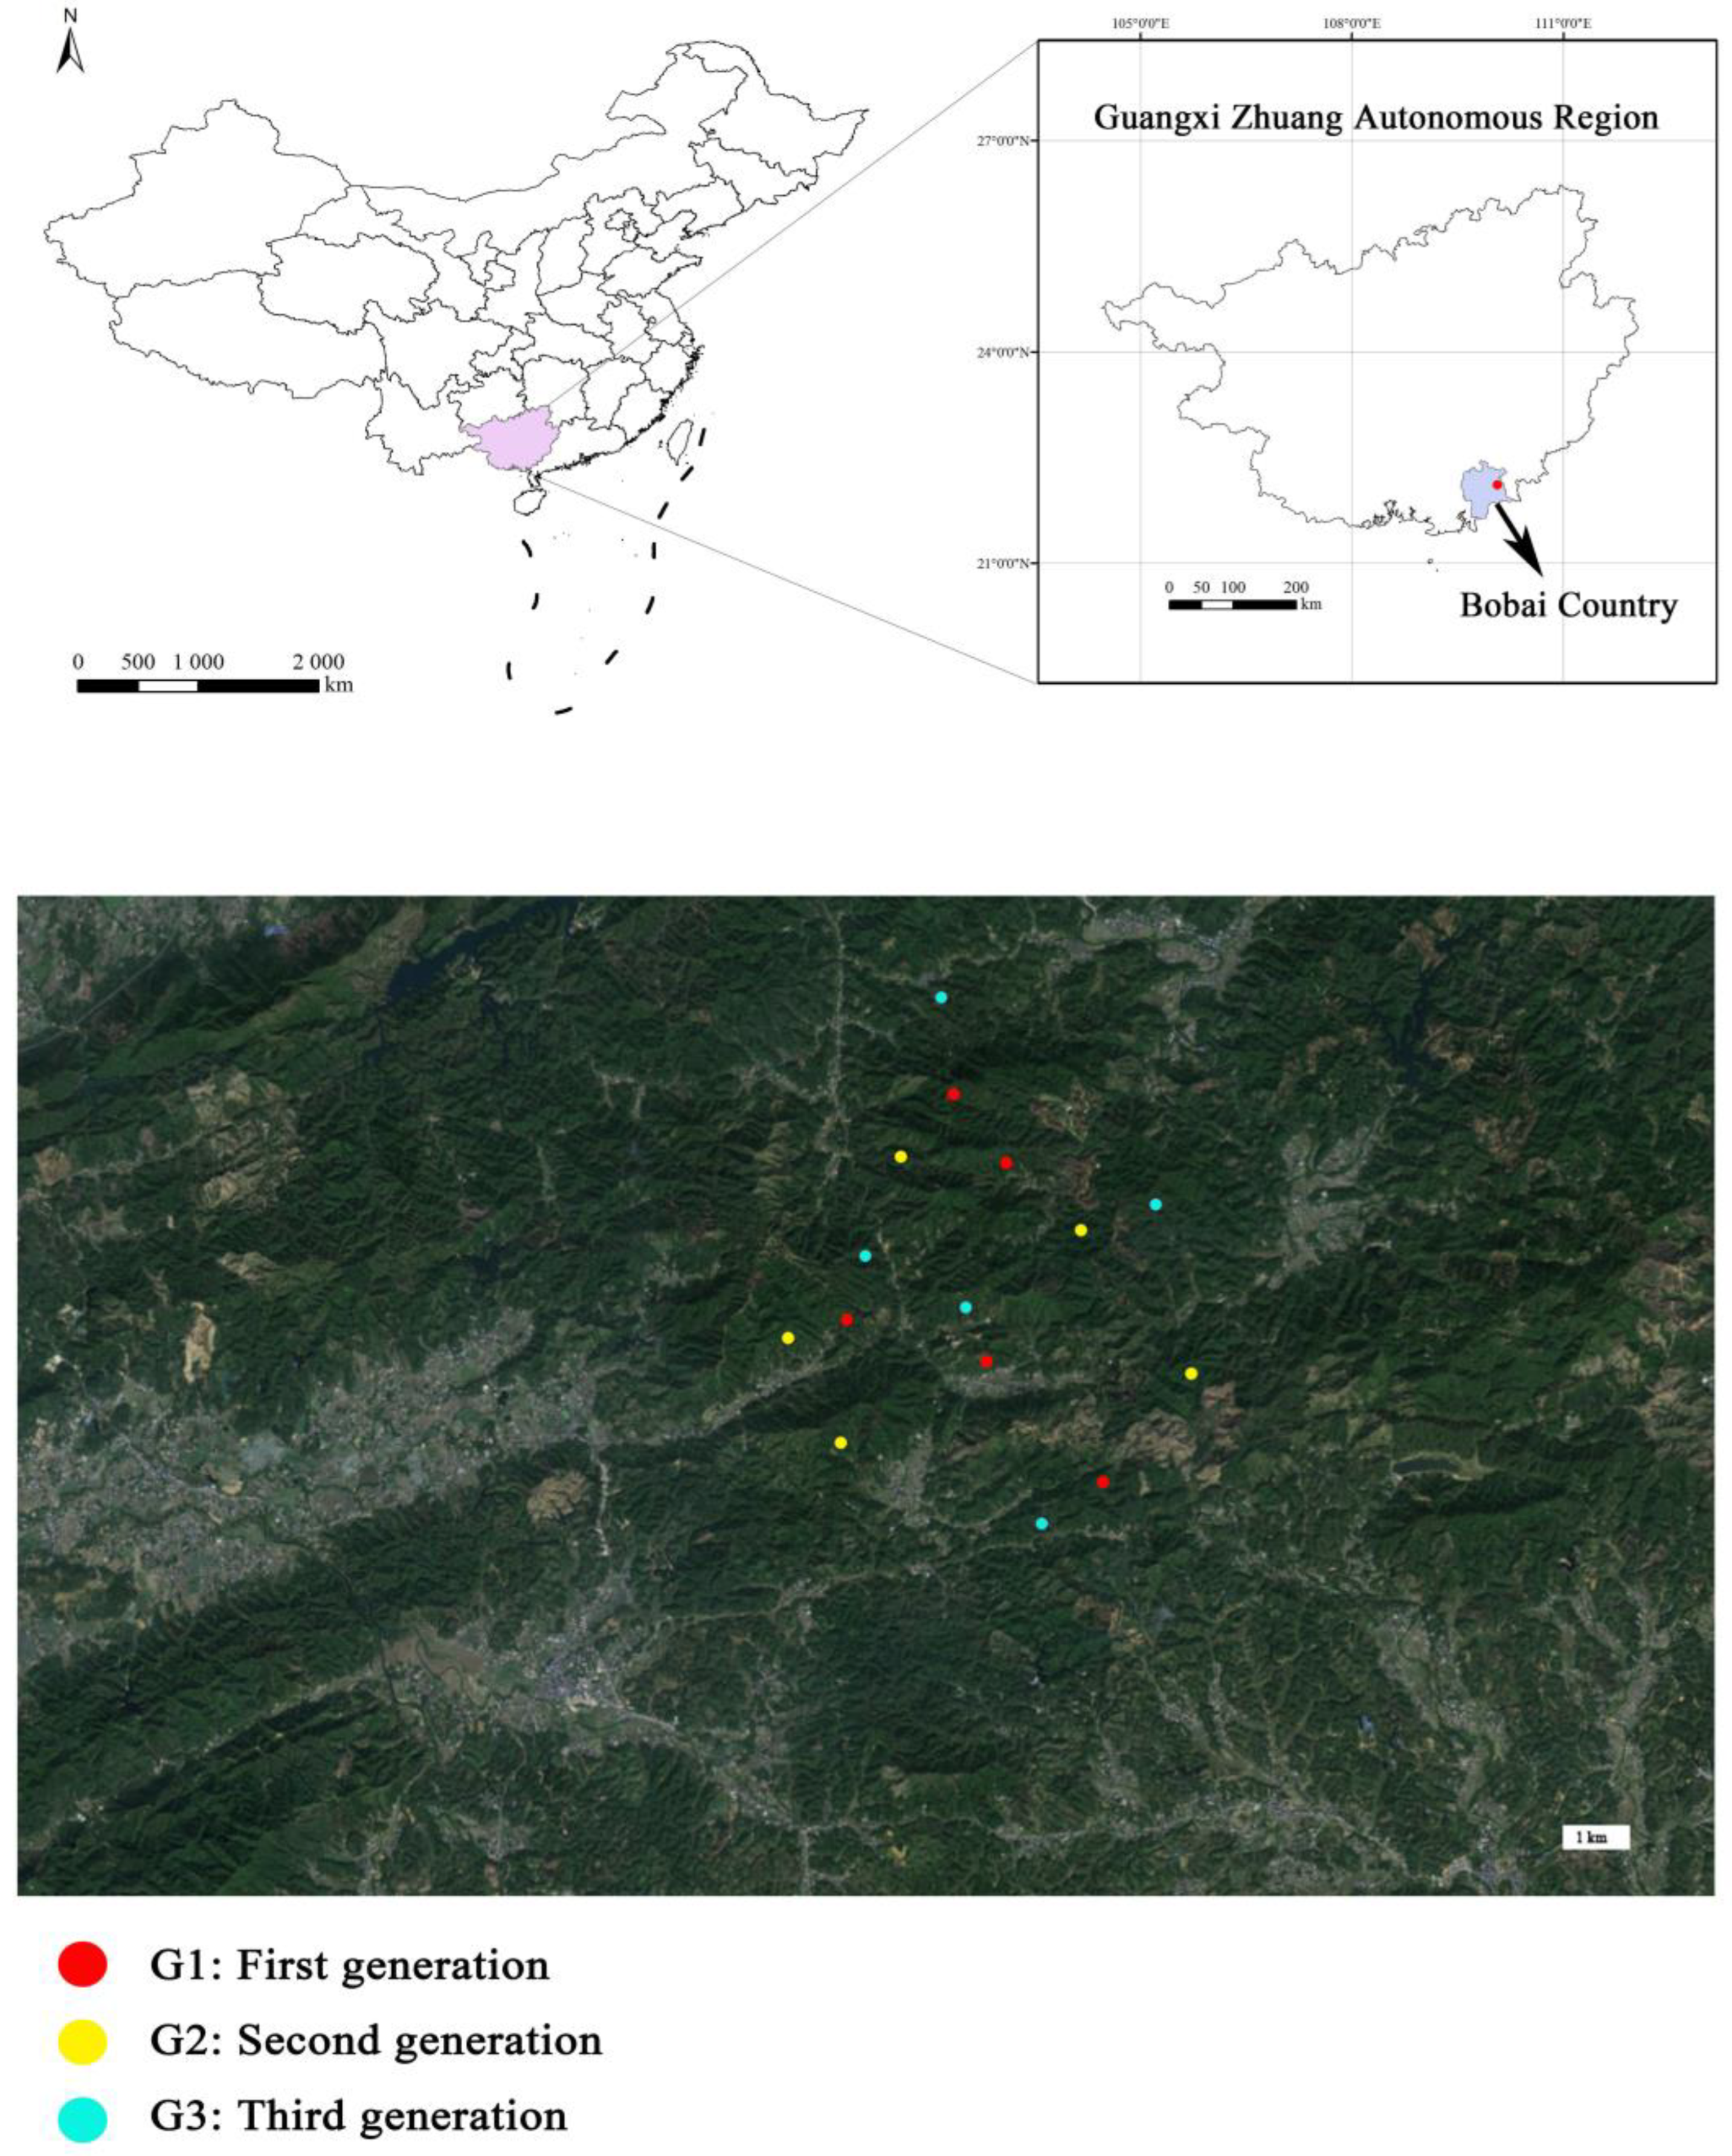
Figure 1. The location of the study area in Bobai Forest Farm, Bobai country, Guangxi province.
Forests 15 01166 g001
Figure 2. Different successive planting generations have different soil enzyme activities. (af) stand for NAG, LAP, ACP, BG, CBH and BX, respectively. Note: NAG stands for β-acetylglucosaminoglycosidase, LAP stands for leucine aminopeptidase, ACP stands for acid phosphatase, BG stands for β-glucosidase, CBH stands for cellobiose hydrolase, and BX stands for β-xylosidase. Different lowercase letters in the same soil horizon indicate significant differences between the two stands (p < 0.05). G1, G2, and G3 represent the first, second, and third generations of pure Eucalyptus grandis × Eucalyptus urophylla plantations.
Forests 15 01166 g002
Figure 3. The correlation table shows whether the relationship between SPPs and enzyme activity was significant. Note: (a) is the 0–20 cm soil layer and (b) is the 20–40 cm soil layer. SWC: soil water content; pH: soil pH value; SOC: soil organic carbon; TN: total nitrogen; TP: total phosphorus; ROC: readily oxidizable organic carbon; DOC: dissolved organic carbon; MBC: microbial biomass carbon. NAG stands for β-acetylglucosaminoglycosidase, LAP stands for leucine aminopeptidase, ACP stands for acid phosphatase, BG stands for β-glucosidase, CBH stands for cellobiose hydrolase, and BX stands for β-xylosidase.
Forests 15 01166 g003
Figure 4. Chord diagrams representing the community structure of the top ten bacteria (a,b) and fungi (c,d) according to relative abundance at the phylum level. Note: G1, G2, and G3 represent the first, second, and third generations of pure Eucalyptus grandis × Eucalyptus urophylla plantations.
Forests 15 01166 g004
Figure 5. Relative abundances of dominant bacterial (a,b) and fungal (c,d) phyla. Different lower-case letters for the same soil layer indicate significant differences in diversity indices between stands. G1, G2, and G3 represent the first, second, and third generations of pure Eucalyptus grandis × Eucalyptus urophylla plantations.
Forests 15 01166 g005
Figure 6. Microbial Chao1 and Shannon diversity indices of different forest stands. Note: (a) denotes bacteria and (b) denotes fungi. The Chao1 index is represented by a purple bar chart, and the Shannon index is represented by a yellow bar chart. Different lower-case letters for the same soil layer indicate significant differences in diversity indices between stands. G1, G2, and G3 represent the first, second, and third generations of pure Eucalyptus grandis × Eucalyptus urophylla plantations.
Forests 15 01166 g006
Figure 7. Relationships of dominant bacterial (a,b) and fungal (c,d) phyla with soil physicochemical factors in the 0–20 cm (a,c) and 20–40 cm horizons (b,d). Note: ** indicates p < 0.01, * indicates p < 0.05. The red and blue arrows represent explanatory variables and response variables, respectively. The value below the picture indicates the contribution of the corresponding explanatory variables. SWC: soil water content; pH: soil pH value; SOC: soil organic carbon; TN: total nitrogen; TP: total phosphorus; ROC: readily oxidizable organic carbon; DOC: dissolved organic carbon; MBC: microbial biomass carbon. G1, G2, and G3 represent the first, second, and third generations of pure Eucalyptus grandis × Eucalyptus urophylla plantations.
Forests 15 01166 g007
Figure 8. Structural equation modeling showing the direct and indirect influences of the multigenerational successive planting of Eucalyptus on the SPPs, organic carbon fractions, enzyme activities, and diversity of the bacterial and fungal communities in the 0–20 cm (a) and 20–40 cm soil (b) horizons. Note: The bar charts show the standardized total influence of multiple generations of successive cultivation on soil active organic carbon, SPPs, enzyme activities, and bacterial and fungal diversities. Standardized paths are represented by arrows. A solid line indicates that the impact between variables is significant (p < 0.05). Conversely, if the line is dashed, then there are nonsignificant impacts (p > 0.05). A red line indicates a positive impact and a blue line indicates a negative impact. R2 represents the proportion of variance that was explained.
Forests 15 01166 g008
Table 1. Basic information of sample plots of stand types with different successive planting generations.
Stand TypePlanting PatternAltitude (m)Stand Age (y)AspectSlope (°)Position on SlopeStand Area (ha)
G1seedling1506sunny slope24middle13.93
G2budding1235sunny slope18middle18.47
G3budding1775sunny slope29middle27.80
Note: G1, G2, and G3 represent the first, second, and third generations of pure Eucalyptus grandis × Eucalyptus urophylla plantations.
Table 2. Effects of different successive planting generations on the physicochemical properties of soils in Eucalyptus plantation forests.
GenerationG1G2G3G1G2G3
Soil Layer0–20 cm20–40 cm
SBD g·cm−30.94 ± 0.09 b1.20 ± 0.04 a1.27 ± 0.02 a1.22 ± 0.13 b1.39 ± 0.06 a1.39 ± 0.09 a
SWC %21.95 ± 4.72 a13.14 ± 1.33 b15.24 ± 2.19 b19.44 ± 0.93 a12.20 ± 1.02 c15.04 ± 1.20 b
pH3.00 ± 0.04 a3.00 ± 0.04 a2.98 ± 0.06 a3.06 ± 0.06 a3.09 ± 0.05 a2.96 ± 0.08 b
SOC g·kg−124.73 ± 4.97 a16.65 ± 3.02 b13.97 ± 2.31 b11.10 ± 2.65 a7.23 ± 1.60 b6.12 ± 1.25 b
TN g·kg−11.83 ± 0.13 a0.97 ± 0.26 b0.92 ± 0.09 b1.00 ± 0.02 a0.54 ± 0.07 b0.46 ± 0.02 c
TP g·kg−10.33 ± 0.02 a0.22 ± 0.01 b0.24 ± 0.02 b0.29 ± 0.02 a0.21 ± 0.01 b0.21 ± 0.02 b
ROC g·kg−14.08 ± 1.65 a3.52 ± 1.27 a1.47 ± 0.76 b1.90 ± 1.15 b3.20 ± 1.68 a3.96 ± 0.71 a
DOC g·kg−11.66 ± 0.17 a1.33 ± 0.09 b1.46 ± 0.22 a b2.13 ± 0.33 a1.43 ± 0.30 b1.72 ± 0.14 b
MBC mg·kg−1321.17 ± 62.77 a289.83 ± 79.37 ab227.39 ± 69.09 b236.39 ± 31.96 a219.94 ± 19.33 a206.44 ± 21.47 a
Note: date represents the means ± standard deviations (SD). Different lowercase letters in the same line indicate significant differences (p < 0.05). SBD: soil bulk density; SWC: soil water content; pH: soil pH value; SOC: soil organic carbon; TN: total nitrogen; TP: total phosphorus; ROC: readily oxidizable organic carbon; DOC: dissolved organic carbon; MBC: microbial biomass carbon. G1, G2, and G3 represent the first, second, and third generations of pure Eucalyptus grandis × Eucalyptus urophylla plantations.
Table 3. The correlation table shows whether the relationship between the SPPs and bacterial or fungal diversity is significant.
Soil LayerBacterialFungalBacterialFungal
0–20 cm20–40 cm
IndicatorChao1ShannonChao1ShannonChao1ShannonChao1Shannon
pH0.3560.219−0.1790.157−0.248−0.297−0.175−0.387
SWC0.875 **0.575 *0.568 *0.0930.596 *0.689 **0.689 **0.229
SOC0.3430.3040.339−0.14302200.2470.516 *−0.134
TN0.3900.0250286−0.1360.1340.2610.537 *−0.134
TP0.1630.1880.3890.0520.4570.623 *0.741 **0.138
ROC0.1000.0460.021−0.214−0.061−0.075−0.546 *−0.100
DOC0.611 *0.3790.2140.0210.575 *0.5070.689 **0.171
MBC0.521 *0.2080.4050.0020.1310.1270.160−0.066
Note: ** indicates a significant correlation (p < 0.01), and * indicates a significant correlation (p < 0.05). pH: soil pH value; SWC: soil water content; SOC: soil organic carbon; TN: total nitrogen; TP: total phosphorus; ROC: readily oxidizable organic carbon; DOC: dissolved organic carbon; MBC: microbial biomass carbon.
Disclaimer/Publisher’s Note: The statements, opinions and data contained in all publications are solely those of the individual author(s) and contributor(s) and not of MDPI and/or the editor(s). MDPI and/or the editor(s) disclaim responsibility for any injury to people or property resulting from any ideas, methods, instructions or products referred to in the content.